
A Combined Proteomic and Transcriptomic Analysis onSulfur Metabolism Pathways of Arabidopsis thalianaunder Simulated Acid Rain
Tingwu Liu1,2., Juan A. Chen1., Wenhua Wang1,3, Martin Simon1, Feihua Wu1, Wenjun Hu1,
Juan B. Chen1, Hailei Zheng1,4*
1 Key Laboratory of the Ministry of Education for Coastal and Wetland Ecosystems, College of the Environment and Ecology, Xiamen University, Xiamen, Fujian, P. R. China,
2Department of Biology, Huaiyin Normal University, Huaian, Jiangsu, P. R. China, 3Department of Biology, Duke University, Durham, North Carolina, United States of
America, 4 State Key Laboratory of Marine Environmental Science, Xiamen University, Xiamen, Fujian, P. R. China
Abstract
With rapid economic development, most regions in southern China have suffered acid rain (AR) pollution. In our study, weanalyzed the changes in sulfur metabolism in Arabidopsis under simulated AR stress which provide one of the first casestudies, in which the systematic responses in sulfur metabolism were characterized by high-throughput methods atdifferent levels including proteomic, genomic and physiological approaches. Generally, we found that all of the processesrelated to sulfur metabolism responded to AR stress, including sulfur uptake, activation and also synthesis of sulfur-containing amino acid and other secondary metabolites. Finally, we provided a catalogue of the detected sulfur metabolicchanges and reconstructed the coordinating network of their mutual influences. This study can help us to understand themechanisms of plants to adapt to AR stress.
Citation: Liu T, Chen JA, Wang W, Simon M, Wu F, et al. (2014) A Combined Proteomic and Transcriptomic Analysis on Sulfur Metabolism Pathways of Arabidopsisthaliana under Simulated Acid Rain. PLoS ONE 9(3): e90120. doi:10.1371/journal.pone.0090120
Editor: Keqiang Wu, National Taiwan University, Taiwan
Received September 16, 2013; Accepted January 27, 2014; Published March 3, 2014
Copyright: � 2014 Liu et al. This is an open-access article distributed under the terms of the Creative Commons Attribution License, which permits unrestricteduse, distribution, and reproduction in any medium, provided the original author and source are credited.
Funding: This study was financially supported by the Natural Science Foundation of China (NSFC) (30930076, 31260057, 30770192 and 30670317), theScholarship Award for Excellent Doctoral Student granted by Ministry of Education, the Foundation of the Chinese Ministry of Education (20070384033, 209084),the Program for New Century Excellent Talents in Xiamen University (NCETXMU X07115) and a Changjiang Scholarship (X09111). The funders had no role in studydesign, data collection and analysis, decision to publish, or preparation of the manuscript.
Competing Interests: The authors have declared that no competing interests exist.
* E-mail: [email protected]
. These authors contributed equally to this work.
Introduction
Acid rain (AR), as a worldwide environmental issue, has been a
serious global problem for several decades, especially in southern
China [1]. As for plants, it has caused a series of damages, such as
necrosis, thin crown, premature abscission, branch dieback, and
has been treated as a new abiotic stress factor [2–4]. Acid rain is
formed from SO2 and nitrous oxides (NOx) emitted to the
atmosphere, largely due to fossil-fuel combustion [5]. Different
from other regions in the world, AR in China contains a lot of
sulfate [1] due to the aggravated combustion of ubiquitous sulfur-
containing coal [6]. As a result of significant emissions and
subsequent deposition of sulfur (S), widespread AR is observed in
southern and southwestern China [1]. However, studies are rarely
focused on the plant’s response in S metabolism to AR, and
molecular details of this process are poorly understood [7].
S is an essential mineral element that is required in large
amount in plants, animals, and microorganisms [8]. It is uptaken
as sulfate and is then assimilated into organic compounds. S is
found in two amino acids including cysteine (Cys) and methionine
(Met), in oligopeptides including glutathione (GSH) and phyto-
chelatins, in some vitamins and cofactors including biotin,
molybdenum cofactor, thiamine and coenzyme A, in phytosulfo-
kin hormones and in a variety of secondary products, all of which
are essential in plant nutrition [9]. Finally, S is integrated into
some S-containing proteins. S also plays a critical role in catalytic
and electrochemical functions in these biomolecules. Disulfide
bonds between polypeptides, mediated by Cys, are of great
importance in protein assembly and structure [10]. The regulation
of sulfate uptake and assimilation has been dissected in great detail
[11–13], and dynamic adaptations of the integrative gene-
metabolite network in response to S deficiency have been
deciphered [12,14,15].
Proteomic, transcriptomic, and metabolomic approaches can
provide the comprehensive profiles of large numbers of gene
expression products [16]. The use of these approaches to obtain
comprehensive data sets increased rapidly in recent years,
especially with respect to the mechanisms underlying plant growth
and plant responses to stress [14,17]. The new high-throughput
tools have provided the potential to systematically analyze
biological systems and monitor their responses. By conceiving
the network architecture and thus the interrelation and regulation
of its components, it can be envisioned that it will be possible to
comprehend the whole system.
In the present study, we explored whole-cellular processes of S
metabolism at the levels of transcriptome and proteome in
Arabidopsis under AR stress by applying a DNA array and a
combination of proteomic and transcrpimic analysis. We depicted
PLOS ONE | www.plosone.org 1 March 2014 | Volume 9 | Issue 3 | e90120
a whole picture for the changes of plant S metabolism under AR
by combining an amount of multidimensional data. These data
can provide novel indications as to reveal the response of the
processes related to S metabolism to AR at the levels of the
transcriptome and proteome.
Materials and Methods
Plant Materials and Growth ConditionsSeeds of Arabidopsis thaliana, ecotype Columbia-0 (Col-0) were
planted in the mixed matrix with vermiculite and cover soil (2:1)
after vernalization. Then, plants were grown in controlled growth
chamber with a light/dark regime of 16/8 hr, temperature of 23/
20uC and a light intensity of 150 mmol m22 s21 photosynthetically
active radiation (PAR). After 3 weeks, the seedlings were sprayed
by simulated acid rain (AR, pH 3.0) at 5 ml per seedling,
meanwhile, the seedlings were sprayed with control solution
(CK, pH 5.6) which had the same ion composition as AR. The AR
solution was prepared from H2SO4 and HNO3 in the ratio of 5 to
1 by chemical equivalents, which represents the average ion
composition of rainfall in South China [18]. The final concentra-
tions of H2SO4 and HNO3 in the spray solution were 0.45 and
0.09 mM, respectively. The leaves were collected after AR
treatment for 3 days and they were immediately frozen in liquid
nitrogen (N2) and stored at 70uC for subsequent protein/RNA
extraction and enzyme for protein and RNA extraction assays.
The phenotype of the treated and control groups were shown in
Figure S1 after AR treatment. Each experiment was repeated at
least three times.
Microarray AnalysisFor Affymetrix GeneChip analysis, the materials were treated
the same as described above. 20 mg of total RNA from leaves of
Arabidopsis with or without AR treatment was extracted using the
RNeasy plant mini kit (Qiagen), and the product was used to make
biotin-labeled cRNA targets. The Affymetrix Arabidopsis ATH1
genome array GeneChip, which contains .22,500 probe sets
representing-24,000 genes, was used. Hybridization, washing, and
staining were performed according to the manufacturer’s instruc-
tions. Image processing was performed using Affymetrix Gene-
Chip Operating System (GCOS). Normalization and expression
estimate computation were calculated from the. CEL output files
from the Affymetrix GCOS 1.1 software using RMA implemented
in R language using standard settings. Statistical testing for
differential expression was performed with logic-t analysis. All
microarray expression data are available at the Gene Expression
Omnibus under the series entry GSE52487. Functional categories
were assigned to genes using the AGI number to search the MIPS
database (http://mips.gsf.de/cgi-bin/proj/thal/) and the Arabi-dopsis Information Resource website, TAIR (http://www.
arabidopsis.org/).
Total Protein Extraction and Two-dimensionalElectrophoresisProteins were extracted under denaturing conditions, according
to the phenol procedure [19]. Briefly, one gram of frozen
lyophilized tissue powder was re-suspended in 3 mL ice-cold
extraction buffer (100 mM PBS, pH 7.5) containing 100 mM
EDTA, 1% PVPP w/v, 1% Triton X-100 v/v, 2% b-mercapto-
ethanol v/v. After centrifugation at 4uC, 15,000 g for 15 min, the
upper phase was transferred to a new centrifuge tube. Two
volumes of Tris-saturated phenol (pH 8.0) were added and then
the mixture was further vortexed for 10 min. Proteins were
precipitated by adding five volumes of ammonium sulfate
saturated-methanol, and incubating at 220uC for at least 4 h.
After centrifugation as described above, the protein pellet was re-
suspended and rinsed with ice-cold methanol followed by ice-cold
acetone twice, and spun down at 15,000 g and 4uC for 5 min after
each washing. Finally, the washed pellets were air-dried and
recovered with lysis buffer containing 7 M urea, 2 M thiourea, 2%
CHAPS, 13 mM DTT and 1% IPG buffer. The sample
containing 800 mg of total proteins was subsequently loaded onto
an IPG strip holder with length 17 cm, pH 4–7 linear gradient
IPG strips (GE Healthcare, Sweden), and rehydrated for 24 h at
room temperature. Strips were covered with mineral oil to prevent
evaporation. Then IEF was performed as the following: 300 V for
1 h, 600 V for 1 h, 1000 V for 1 h, a gradient to 8000 V for 2 h,
and kept at 8000 V for 64,000 V?h. After focusing, the strips were
equilibrated with equilibration solution (50 mM Tris, pH 8.8, 6 M
urea, 30% glycerol, 2% SDS) containing 1% DTT, and
subsequently 4% iodoacetamide for 15 min for each equilibration
solution. The separation of proteins in the second dimension was
performed with SDS polyacrylamide gels (12%) on an Ettan
DALT System (GE Healthcare, Sweden) and sealed in with 0.5%
agarose, and run at 10 mA for electrophoresis. Each separation
was repeated 3 times to ensure the protein pattern reproducibility.
Protein Staining and Image AnalysisThe SDS-PAGE gels were stained by the CBB R250. 2-DE gels
were scanned at 600 dots per inch (dpi) resolution with a scanner
(Uniscan M3600). 2-D gel analysis was performed by PDQuest
software (Bio-Rad). For each gel, a set of three images was
generated, corresponding to the original 2-D scan, the filtered
image, and the Gaussian image. The Gaussian image containing
the three-dimensional Gaussian spots was used for the quantifi-
cation analysis. The intensity of each protein spot was normalized
relative to the total abundance of all valid spots. After
normalization and background subtraction, a matchset was
created by comparing the control gels. All spots were then
submitted to further analysis to test whether or not their expression
levels were affected by AR treatment and those that increased or
decreased significantly more than 2-fold change were then
identified by MALDI TOF/MS. The apparent Mr of each
protein in gel was determined with protein markers.
Protein IdentificationExcised gel spots were washed several times with destaining
solutions (25 mM NH4HCO3 for 15 min and then with 50% v/v
ACN containing 25 mM NH4HCO3 for 15 min). Gel pieces were
dehydrated with 100% ACN and dryed, then incubated with a
reducing solution (25 mM NH4HCO3 containing 10 mM DTT)
for 1 h at 37uC, and subsequently with an alkylating solution
(25 mM NH4HCO3 containing 55 mM iodoacetamide) for
30 min at 37uC. After reduction and alkylation, gels were washed
several times with the destaining solutions and finally with pure
water for 15 min, before dehydration with 100% ACN. Depend-
ing on protein amount, 2–3 mL of 0.1 mg mL21 modified trypsin
(Promega, sequencing grade) in 25 mM NH4HCO3 was added to
the dehydrated gel spots. After 30 min incubation, 7 mL of 25 mM
NH4HCO3 were added to submerge the gel spots at 37uC
overnight.
After digestion, the protein peptides were collected and
vacuum-dried. 0.5 mL peptide mixture was mixed with 0.5 mL
matrix solution (HCCA at half saturation in 60% ACN/0.1%
TFA v/v). A total of 1 mL of reconstituted in-gel digest sample was
spotted initially on Anchorchip target plate. The dried sample on
the target plate was washed twice with 1 mL of 0.1% TFA, left for
30 s before solvent removal. MALDI TOF MS analysis (Re-
Sulfur Metabolism Analysis under Acid Rain
PLOS ONE | www.plosone.org 2 March 2014 | Volume 9 | Issue 3 | e90120
FlexTMIII, Bruker) was used to acquire the peptide mass
fingerprint (PMF). The spectra were analyzed with the flexAnalysis
software (Bruker-Daltonics). All spectra were smoothed, and
internally calibrated with trypsin autolysis peaks. Then, the
measured tryptic peptide masses were transferred through MS
BioTool program (Bruker-Daltonics) as inputs to search against
the taxonomy of Arabidopsis thaliana (thale cress) in NCBI (NCBInr)
database. The PMF searched parameters were 100 ppm tolerance
as the maximum mass error, MH+ monoisotopic mass values,
allowance of oxidation (M) modifications, allowed for one missed
cleavage, and fixed modification of cysteine by carboxymethyl
(Carbamidomethylation, C). The match was considered in terms
of a higher Mascot score, the putative functions, and differential
expression patterns on 2-DE gels. Good matches were classified as
those having a Mascot score higher than 60 (threshold). The
identification was considered only with a higher MASCOT score,
maximum peptide coverage and additional experimental confir-
mation of the protein spots on the 2-DE gels. The identified
proteins were searched within the UniProt and TAIR database to
find out if their function was known, then they were further
classified using Functional Catalogue software (http://mips.gsf.
de/projects/funcat).
Real-time Quantitative PCRVerification of differential gene expression was performed by
real-time quantitative PCR (qRT-PCR) in the Rotor-GeneTM
6000 real-time analyzer (Corbett Research, Mortlake, Australia)
using the FastStart Universal SYBR Green Master (ROX, Roche
Ltd., Mannheim, Germany) according to the manufacturer’s
instructions. Reaction conditions (10 mL volumes) were optimized
by changing the primer concentration and annealing temperature
to minimize primer-dimer formation and to increase PCR
efficiency. The following PCR profile was used: 95uC for 5 min,
40 cycles of 95uC for 30 s, the appropriate annealing temperature
for 30 s and 72uC for 30 s, a melting curve was then performed to
verify the specificity of the amplification. Each run included
standard dilutions and negative reaction controls. Successive
dilutions of one sample were used as a standard curve. All the
results presented were standardized using the housekeeping gene
Actin2. The results of the mRNA expression level of genes were
expressed as the normalized ratio using the DDCt method
according to Livak and Schmittgen [20]. Ct values of each target
gene were calculated by Rotor-Gene 6000 Application Software,
and the DCt value of the Actin2 rRNA gene was treated as an
arbitrary constant for analyzing the DDCt value of samples. Three
independent pools for each target gene were averaged, and the
standard error of the mean value was recorded. The primer
sequences used for the gene amplification are described in Table
S1.
Physiological IndexGlutathione (GSH) Content. Glutathione (GSH) Content
was estimated fluorimetrically according to Karni et al [21]. Half a
gram plant material was frozen in liquid nitrogen and ground in
0.5 mL of 25% H3PO3 and 1.5 mL of 0.1 M sodium phosphate-
EDTA buffer (pH 8.0). The homogenate was centrifuged at
10,000 g for 20 min to obtain supernatant for the estimation of
GSH. The supernatant was diluted four times with phosphate-
EDTA buffer (pH 8.0). The assay mixture for GSH estimation
contained 100 mL of the diluted supernatant, 0.9 mL of
phosphate-EDTA buffer and 100 mL of O-phthalaldehyde solu-
tion (1 mg : 1 mL). After thorough mixing and incubation at room
temperature for 15 min, the solution was transferred to a quartz
cuvette and the fluorescence at 420 nm was measured after
excitation at 350 nm.
Ser Acetyltransferase Activity. Ser acetyltransferase (SAT)
activity was measured according to the method described by
Youssefian et al [22]. The incubation mixture with final volume of
240 mL contained 12 mM KPO3, 16 mM Ser, 30 mg BSA, 0.5 mM
acetyl CoA, 1 mM Na2S, and an appropriate amount of extracts.
The reaction was started by addition of the extracts and continued
for 20 min at 25uC and was terminated by addition of 400 mL
4 M HCl. The tubes were centrifuged at 15,000 g for 3 min and to
an aliquot of 200 mL supernatant, 200 mL modified ninhydrine
reagent was added. The mixture was heated at 100uC for 10 min
and cooled rapidly on ice, then 400 mL 98% ethanol was added
and the absorbance was determined at 560 nm. The calibration
curve was established by adding known amounts of L-Cys to the
assay mixture and measuring these without incubation.
Amino Acid Content. The samples of plant material (0.5 g)
were mixed with 1 ml of extraction solution (60% methanol, 25%
chloroform, and 15% water) at 42uC for 10 min. After brief
centrifugation, the supernatant was collected and the residue was
extracted with the same mixture solution again, then both
supernatants were combined. After adding the chloroform
(1 mL) and water (1 mL), the resulting mixture was centrifuged
again and the upper water-methanol phase was collected. Then
the supernatants were dried in a vacuum desiccator, and then
dissolved in 200 mL of water. The concentration of free amino
acids was determined using O-phthalaldehyde reagent, followed by
measuring the 335/447 nm fluorescence. Amino acid analyses
were performed by the ion-exchange chromatography technique
with a Hitachi model L-8800 amino acid analyzer (Hitachi Co.
Ltd., Tokyo, Japan) with a column packed with Hitachi custom
ion-exchange resin.
Statistical AnalysisEach experiment was repeated at least three times. Values in
figures and tables were expressed as means 6 SE. The statistical
significance of the data was analyzed using univariate analysis of
variance (p,0.05) (one-way ANOVA; SPSS for Windows, version
11.0).
Results and Discussion
Integrative Proteomic and Transcriptomic Analysis on SMetabolismIn order to investigate the expression changes of proteins related
to S metabolism under AR treatment, we analyzed the expression
patterns of AR responsive proteins using a proteomic approach.
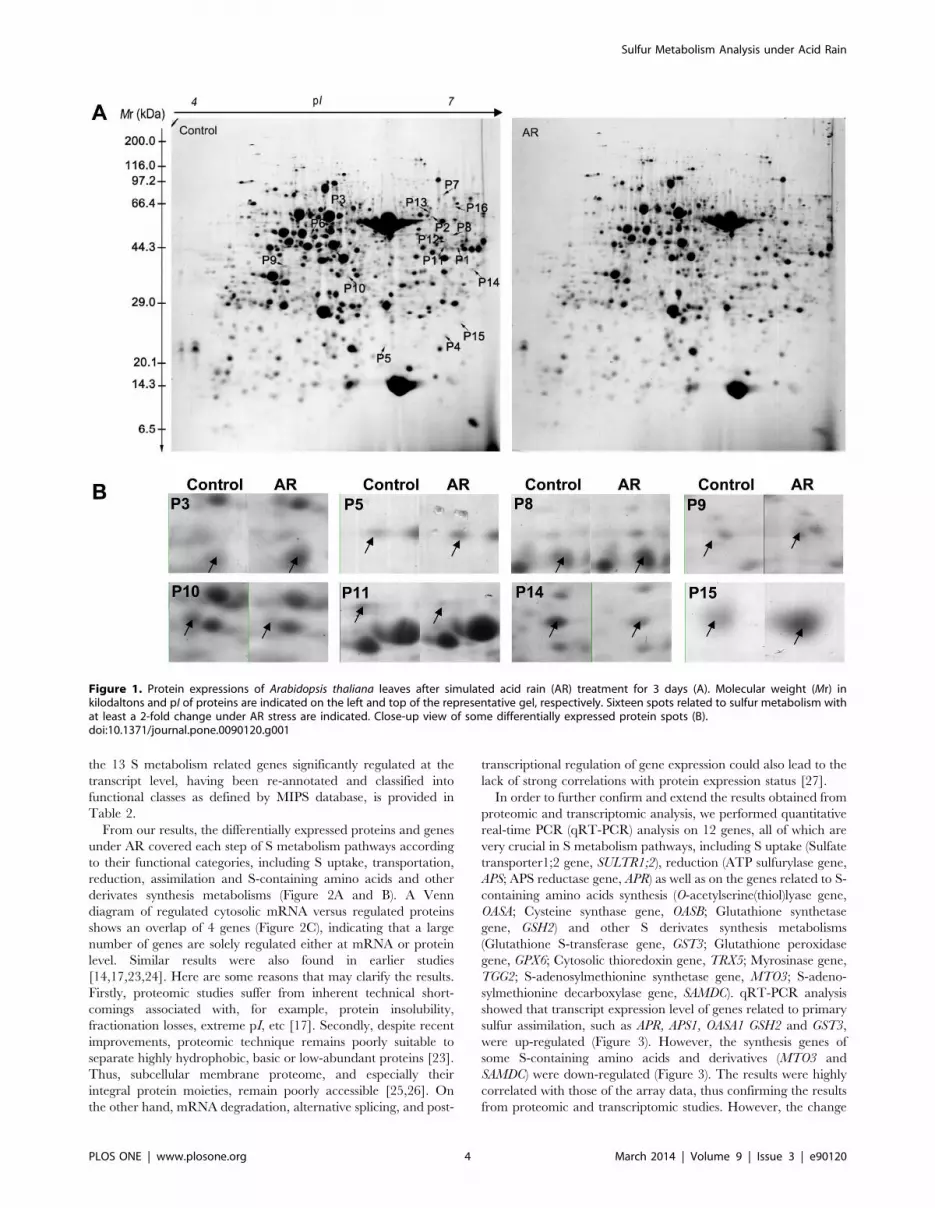
The proteins were separated by 2-DE. On CBB-stained 2-DE gels,
over 1500 highly reproducible protein spots in the pI range of 4–7
were revealed. 2-DE maps of the leaf proteome are shown in
Figure 1A. Close-up views of several protein spots are shown in
Figure 1B. Sixteen proteins related to S metabolism were
identified and thereafter the functional categories were assigned
to proteins using the AGI number to search the MIPS database
(Figure 2A). Detailed information including the description of
proteins, the MOWSE scores, theoretical pI values, molecular
weights (Mr) and peptides matched of those 16 proteins which are
related to S assimilation and primary/secondary metabolism are
shown in Table 1 and Table S2.
To further examine the responses of Arabidopsis to AR, we
applied transcript profiling employing the Affymetrix AH1 chips
covering 24,000 genes to analyze the changes in gene expression
patterns. In total, 13 genes which dramatically changed their
expression were found related to S metabolism (Table 2). A list of
Sulfur Metabolism Analysis under Acid Rain
PLOS ONE | www.plosone.org 3 March 2014 | Volume 9 | Issue 3 | e90120
the 13 S metabolism related genes significantly regulated at the
transcript level, having been re-annotated and classified into
functional classes as defined by MIPS database, is provided in
Table 2.
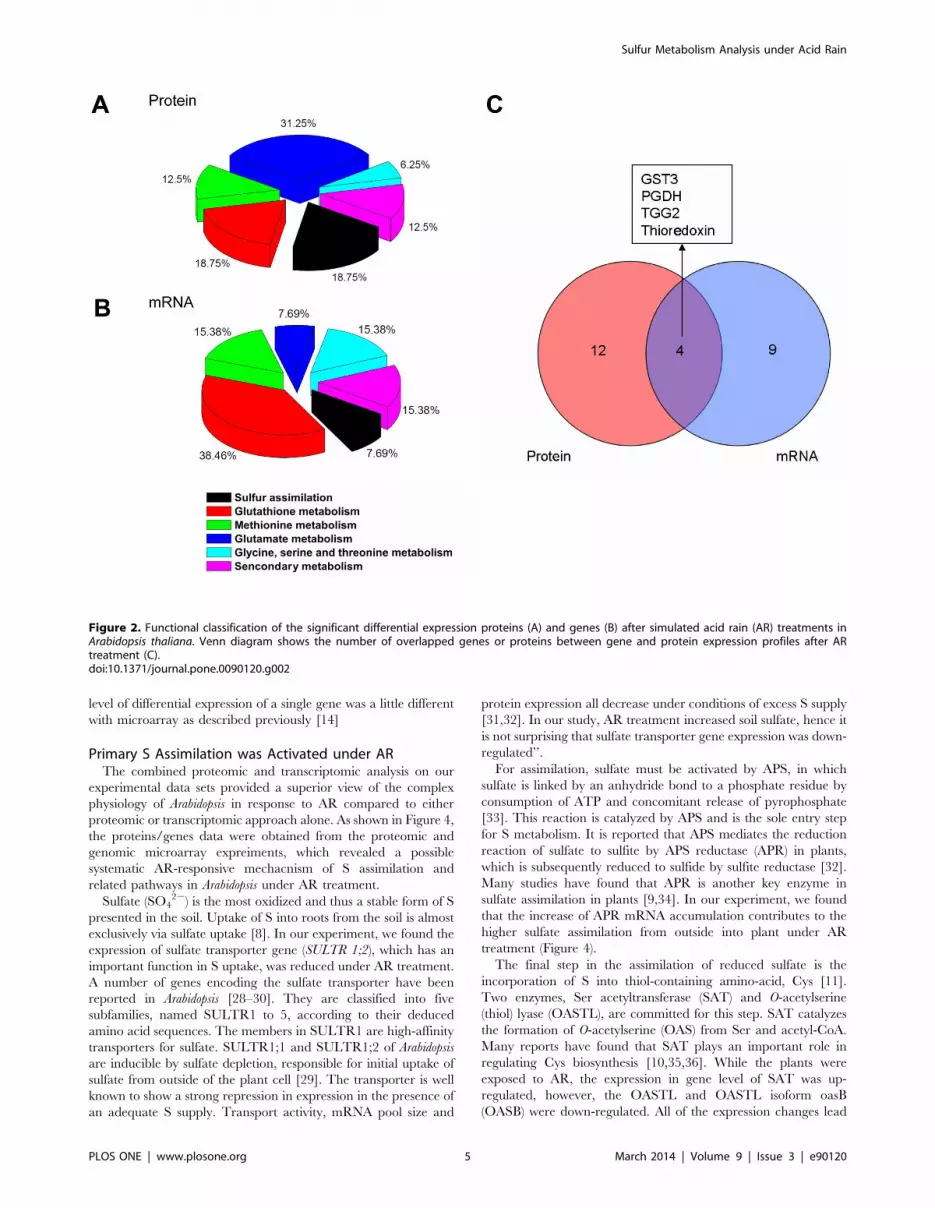
From our results, the differentially expressed proteins and genes
under AR covered each step of S metabolism pathways according
to their functional categories, including S uptake, transportation,
reduction, assimilation and S-containing amino acids and other
derivates synthesis metabolisms (Figure 2A and B). A Venn
diagram of regulated cytosolic mRNA versus regulated proteins
shows an overlap of 4 genes (Figure 2C), indicating that a large
number of genes are solely regulated either at mRNA or protein
level. Similar results were also found in earlier studies
[14,17,23,24]. Here are some reasons that may clarify the results.
Firstly, proteomic studies suffer from inherent technical short-
comings associated with, for example, protein insolubility,
fractionation losses, extreme pI, etc [17]. Secondly, despite recent
improvements, proteomic technique remains poorly suitable to
separate highly hydrophobic, basic or low-abundant proteins [23].
Thus, subcellular membrane proteome, and especially their
integral protein moieties, remain poorly accessible [25,26]. On
the other hand, mRNA degradation, alternative splicing, and post-
transcriptional regulation of gene expression could also lead to the
lack of strong correlations with protein expression status [27].
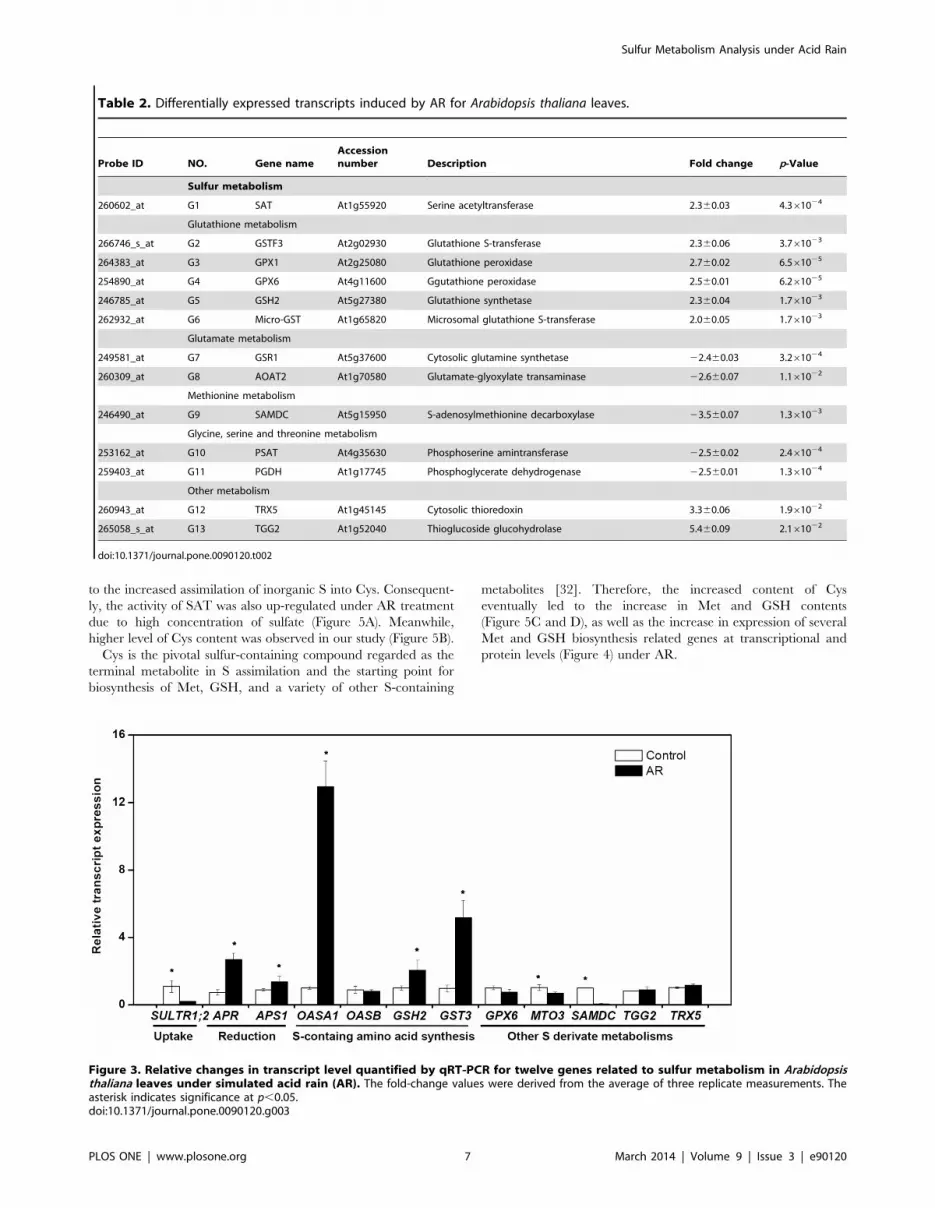
In order to further confirm and extend the results obtained from
proteomic and transcriptomic analysis, we performed quantitative
real-time PCR (qRT-PCR) analysis on 12 genes, all of which are
very crucial in S metabolism pathways, including S uptake (Sulfate
transporter1;2 gene, SULTR1;2), reduction (ATP sulfurylase gene,
APS; APS reductase gene, APR) as well as on the genes related to S-
containing amino acids synthesis (O-acetylserine(thiol)lyase gene,
OASA; Cysteine synthase gene, OASB; Glutathione synthetase
gene, GSH2) and other S derivates synthesis metabolisms
(Glutathione S-transferase gene, GST3; Glutathione peroxidase
gene, GPX6; Cytosolic thioredoxin gene, TRX5; Myrosinase gene,
TGG2; S-adenosylmethionine synthetase gene, MTO3; S-adeno-
sylmethionine decarboxylase gene, SAMDC). qRT-PCR analysis
showed that transcript expression level of genes related to primary
sulfur assimilation, such as APR, APS1, OASA1 GSH2 and GST3,
were up-regulated (Figure 3). However, the synthesis genes of
some S-containing amino acids and derivatives (MTO3 and
SAMDC) were down-regulated (Figure 3). The results were highly
correlated with those of the array data, thus confirming the results
from proteomic and transcriptomic studies. However, the change
Figure 1. Protein expressions of Arabidopsis thaliana leaves after simulated acid rain (AR) treatment for 3 days (A). Molecular weight (Mr) inkilodaltons and pI of proteins are indicated on the left and top of the representative gel, respectively. Sixteen spots related to sulfur metabolism withat least a 2-fold change under AR stress are indicated. Close-up view of some differentially expressed protein spots (B).doi:10.1371/journal.pone.0090120.g001
Sulfur Metabolism Analysis under Acid Rain
PLOS ONE | www.plosone.org 4 March 2014 | Volume 9 | Issue 3 | e90120
level of differential expression of a single gene was a little different
with microarray as described previously [14]
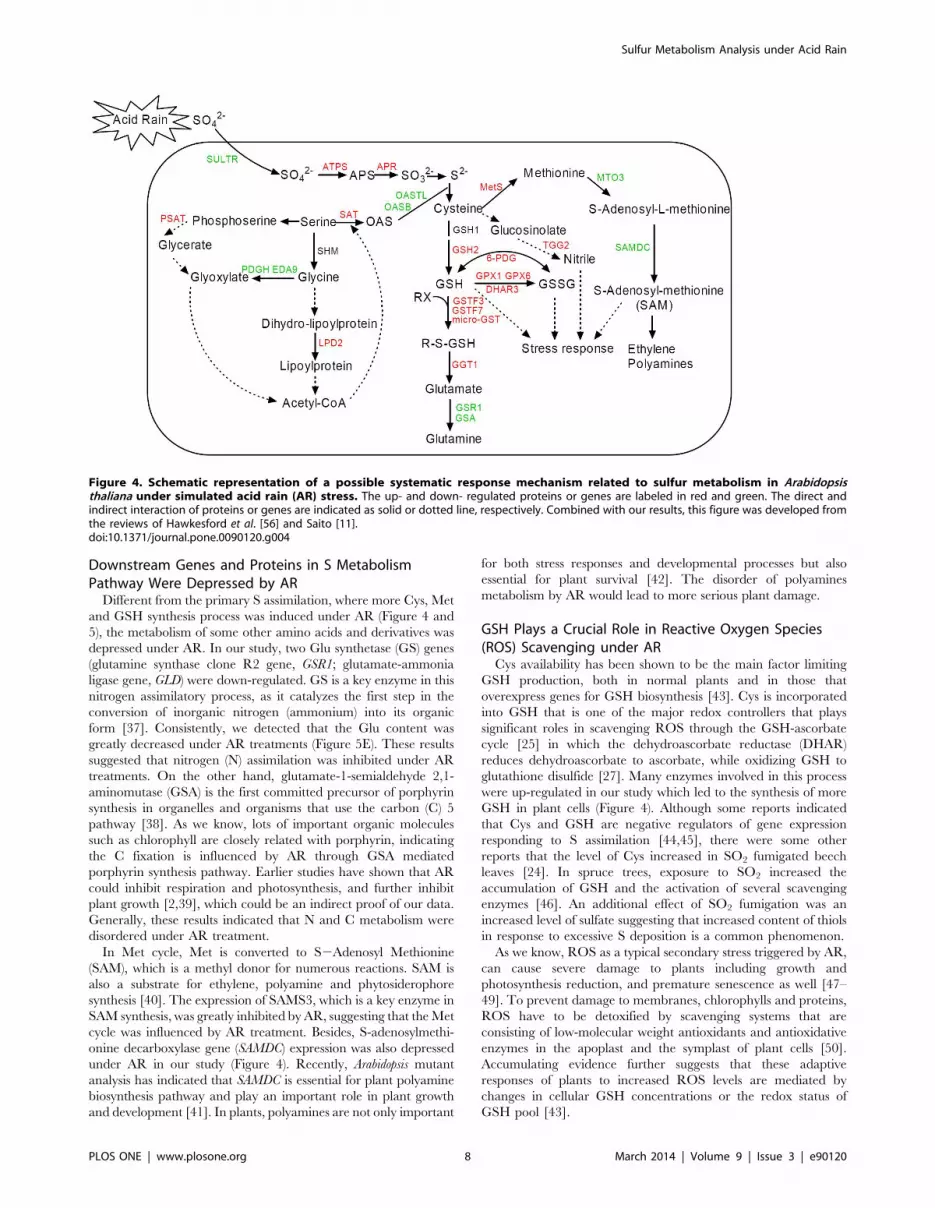
Primary S Assimilation was Activated under ARThe combined proteomic and transcriptomic analysis on our
experimental data sets provided a superior view of the complex
physiology of Arabidopsis in response to AR compared to either
proteomic or transcriptomic approach alone. As shown in Figure 4,
the proteins/genes data were obtained from the proteomic and
genomic microarray expreiments, which revealed a possible
systematic AR-responsive mechacnism of S assimilation and
related pathways in Arabidopsis under AR treatment.
Sulfate (SO422) is the most oxidized and thus a stable form of S
presented in the soil. Uptake of S into roots from the soil is almost
exclusively via sulfate uptake [8]. In our experiment, we found the
expression of sulfate transporter gene (SULTR 1;2), which has an
important function in S uptake, was reduced under AR treatment.
A number of genes encoding the sulfate transporter have been
reported in Arabidopsis [28–30]. They are classified into five
subfamilies, named SULTR1 to 5, according to their deduced
amino acid sequences. The members in SULTR1 are high-affinity
transporters for sulfate. SULTR1;1 and SULTR1;2 of Arabidopsis
are inducible by sulfate depletion, responsible for initial uptake of
sulfate from outside of the plant cell [29]. The transporter is well
known to show a strong repression in expression in the presence of
an adequate S supply. Transport activity, mRNA pool size and
protein expression all decrease under conditions of excess S supply
[31,32]. In our study, AR treatment increased soil sulfate, hence it
is not surprising that sulfate transporter gene expression was down-
regulated’’.
For assimilation, sulfate must be activated by APS, in which
sulfate is linked by an anhydride bond to a phosphate residue by
consumption of ATP and concomitant release of pyrophosphate
[33]. This reaction is catalyzed by APS and is the sole entry step
for S metabolism. It is reported that APS mediates the reduction
reaction of sulfate to sulfite by APS reductase (APR) in plants,
which is subsequently reduced to sulfide by sulfite reductase [32].
Many studies have found that APR is another key enzyme in
sulfate assimilation in plants [9,34]. In our experiment, we found
that the increase of APR mRNA accumulation contributes to the
higher sulfate assimilation from outside into plant under AR
treatment (Figure 4).
The final step in the assimilation of reduced sulfate is the
incorporation of S into thiol-containing amino-acid, Cys [11].
Two enzymes, Ser acetyltransferase (SAT) and O-acetylserine
(thiol) lyase (OASTL), are committed for this step. SAT catalyzes
the formation of O-acetylserine (OAS) from Ser and acetyl-CoA.
Many reports have found that SAT plays an important role in
regulating Cys biosynthesis [10,35,36]. While the plants were
exposed to AR, the expression in gene level of SAT was up-
regulated, however, the OASTL and OASTL isoform oasB
(OASB) were down-regulated. All of the expression changes lead
Figure 2. Functional classification of the significant differential expression proteins (A) and genes (B) after simulated acid rain (AR) treatments inArabidopsis thaliana. Venn diagram shows the number of overlapped genes or proteins between gene and protein expression profiles after ARtreatment (C).doi:10.1371/journal.pone.0090120.g002
Sulfur Metabolism Analysis under Acid Rain
PLOS ONE | www.plosone.org 5 March 2014 | Volume 9 | Issue 3 | e90120
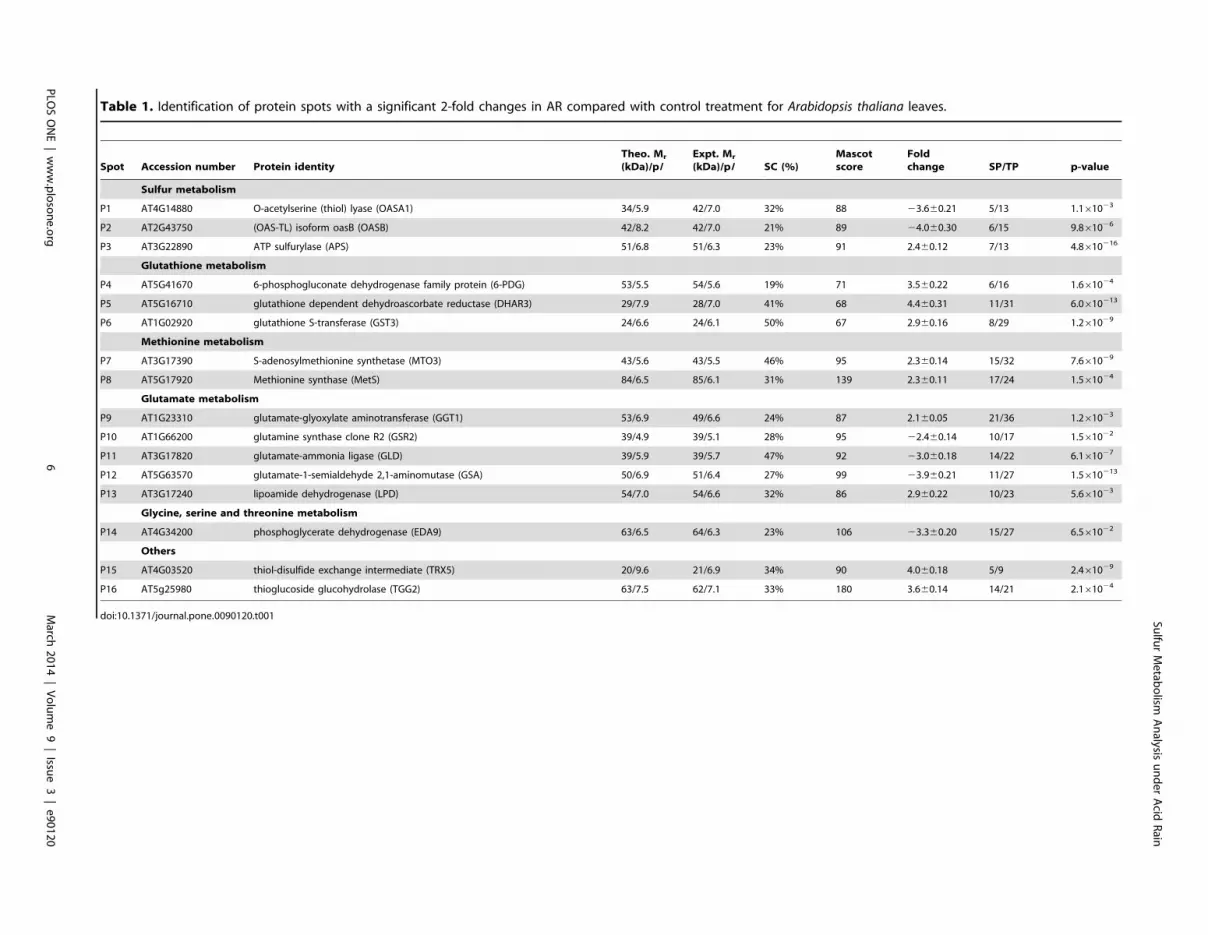
Table 1. Identification of protein spots with a significant 2-fold changes in AR compared with control treatment for Arabidopsis thaliana leaves.
Spot Accession number Protein identity
Theo. Mr
(kDa)/pIExpt. Mr
(kDa)/pI SC (%)
Mascot
score
Fold
change SP/TP p-value
Sulfur metabolism
P1 AT4G14880 O-acetylserine (thiol) lyase (OASA1) 34/5.9 42/7.0 32% 88 23.660.21 5/13 1.161023
P2 AT2G43750 (OAS-TL) isoform oasB (OASB) 42/8.2 42/7.0 21% 89 24.060.30 6/15 9.861026
P3 AT3G22890 ATP sulfurylase (APS) 51/6.8 51/6.3 23% 91 2.460.12 7/13 4.8610216
Glutathione metabolism
P4 AT5G41670 6-phosphogluconate dehydrogenase family protein (6-PDG) 53/5.5 54/5.6 19% 71 3.560.22 6/16 1.661024
P5 AT5G16710 glutathione dependent dehydroascorbate reductase (DHAR3) 29/7.9 28/7.0 41% 68 4.460.31 11/31 6.0610213
P6 AT1G02920 glutathione S-transferase (GST3) 24/6.6 24/6.1 50% 67 2.960.16 8/29 1.261029
Methionine metabolism
P7 AT3G17390 S-adenosylmethionine synthetase (MTO3) 43/5.6 43/5.5 46% 95 2.360.14 15/32 7.661029
P8 AT5G17920 Methionine synthase (MetS) 84/6.5 85/6.1 31% 139 2.360.11 17/24 1.561024
Glutamate metabolism
P9 AT1G23310 glutamate-glyoxylate aminotransferase (GGT1) 53/6.9 49/6.6 24% 87 2.160.05 21/36 1.261023
P10 AT1G66200 glutamine synthase clone R2 (GSR2) 39/4.9 39/5.1 28% 95 22.460.14 10/17 1.561022
P11 AT3G17820 glutamate-ammonia ligase (GLD) 39/5.9 39/5.7 47% 92 23.060.18 14/22 6.161027
P12 AT5G63570 glutamate-1-semialdehyde 2,1-aminomutase (GSA) 50/6.9 51/6.4 27% 99 23.960.21 11/27 1.5610213
P13 AT3G17240 lipoamide dehydrogenase (LPD) 54/7.0 54/6.6 32% 86 2.960.22 10/23 5.661023
Glycine, serine and threonine metabolism
P14 AT4G34200 phosphoglycerate dehydrogenase (EDA9) 63/6.5 64/6.3 23% 106 23.360.20 15/27 6.561022
Others
P15 AT4G03520 thiol-disulfide exchange intermediate (TRX5) 20/9.6 21/6.9 34% 90 4.060.18 5/9 2.461029
P16 AT5g25980 thioglucoside glucohydrolase (TGG2) 63/7.5 62/7.1 33% 180 3.660.14 14/21 2.161024
doi:10.1371/journal.pone.0090120.t001 Sulfu
rMetab
olism
Analysis
underAcid
Rain
PLO
SONE|www.plosone.org
6March
2014
|Volume9
|Issu
e3
|e90120
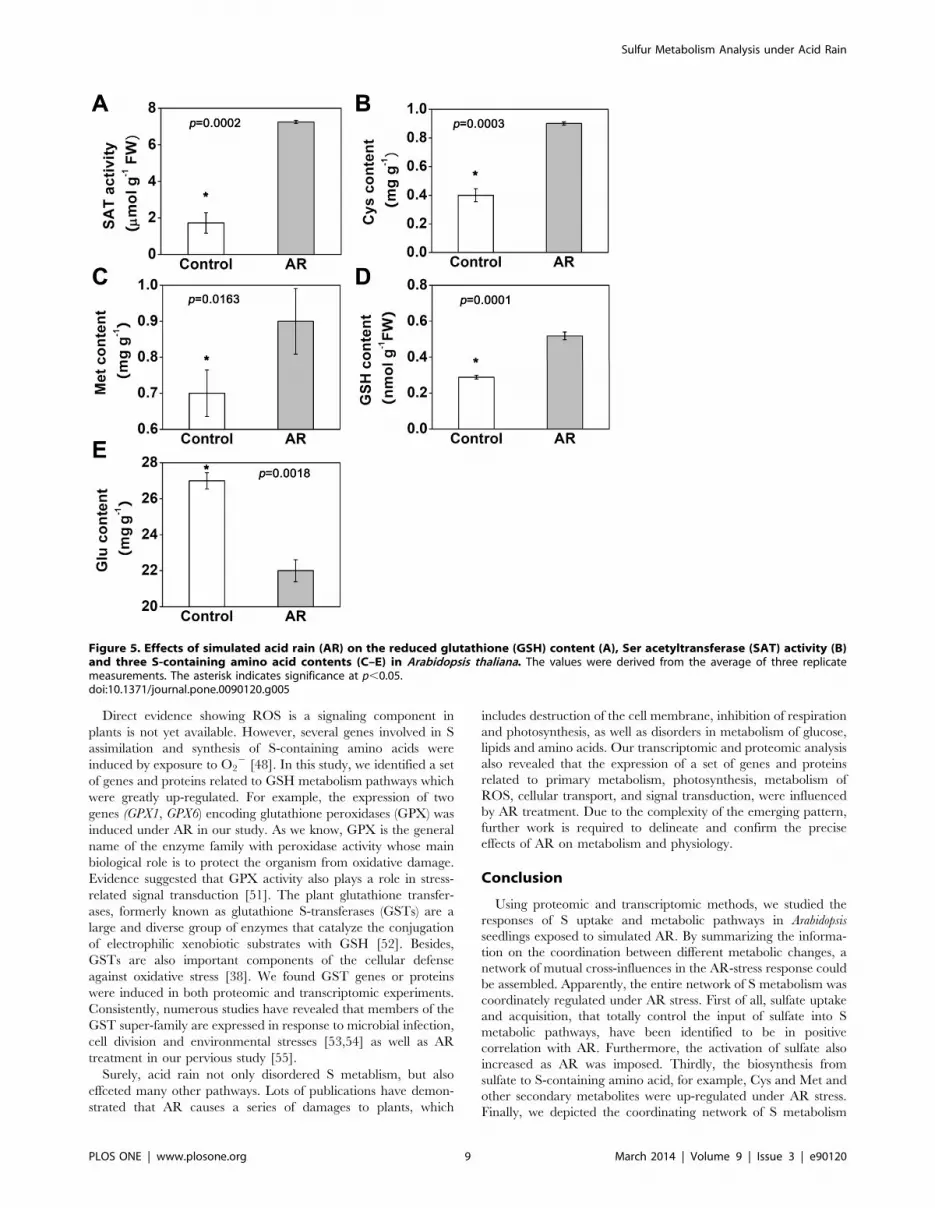
to the increased assimilation of inorganic S into Cys. Consequent-
ly, the activity of SAT was also up-regulated under AR treatment
due to high concentration of sulfate (Figure 5A). Meanwhile,
higher level of Cys content was observed in our study (Figure 5B).
Cys is the pivotal sulfur-containing compound regarded as the
terminal metabolite in S assimilation and the starting point for
biosynthesis of Met, GSH, and a variety of other S-containing
metabolites [32]. Therefore, the increased content of Cys
eventually led to the increase in Met and GSH contents
(Figure 5C and D), as well as the increase in expression of several
Met and GSH biosynthesis related genes at transcriptional and
protein levels (Figure 4) under AR.
Table 2. Differentially expressed transcripts induced by AR for Arabidopsis thaliana leaves.
Probe ID NO. Gene name
Accession
number Description Fold change p-Value
Sulfur metabolism
260602_at G1 SAT At1g55920 Serine acetyltransferase 2.360.03 4.361024
Glutathione metabolism
266746_s_at G2 GSTF3 At2g02930 Glutathione S-transferase 2.360.06 3.761023
264383_at G3 GPX1 At2g25080 Glutathione peroxidase 2.760.02 6.561025
254890_at G4 GPX6 At4g11600 Ggutathione peroxidase 2.560.01 6.261025
246785_at G5 GSH2 At5g27380 Glutathione synthetase 2.360.04 1.761023
262932_at G6 Micro-GST At1g65820 Microsomal glutathione S-transferase 2.060.05 1.761023
Glutamate metabolism
249581_at G7 GSR1 At5g37600 Cytosolic glutamine synthetase 22.460.03 3.261024
260309_at G8 AOAT2 At1g70580 Glutamate-glyoxylate transaminase 22.660.07 1.161022
Methionine metabolism
246490_at G9 SAMDC At5g15950 S-adenosylmethionine decarboxylase 23.560.07 1.361023
Glycine, serine and threonine metabolism
253162_at G10 PSAT At4g35630 Phosphoserine amintransferase 22.560.02 2.461024
259403_at G11 PGDH At1g17745 Phosphoglycerate dehydrogenase 22.560.01 1.361024
Other metabolism
260943_at G12 TRX5 At1g45145 Cytosolic thioredoxin 3.360.06 1.961022
265058_s_at G13 TGG2 At1g52040 Thioglucoside glucohydrolase 5.460.09 2.161022
doi:10.1371/journal.pone.0090120.t002
Figure 3. Relative changes in transcript level quantified by qRT-PCR for twelve genes related to sulfur metabolism in Arabidopsisthaliana leaves under simulated acid rain (AR). The fold-change values were derived from the average of three replicate measurements. Theasterisk indicates significance at p,0.05.doi:10.1371/journal.pone.0090120.g003
Sulfur Metabolism Analysis under Acid Rain
PLOS ONE | www.plosone.org 7 March 2014 | Volume 9 | Issue 3 | e90120
Downstream Genes and Proteins in S MetabolismPathway Were Depressed by ARDifferent from the primary S assimilation, where more Cys, Met
and GSH synthesis process was induced under AR (Figure 4 and
5), the metabolism of some other amino acids and derivatives was
depressed under AR. In our study, two Glu synthetase (GS) genes
(glutamine synthase clone R2 gene, GSR1; glutamate-ammonia
ligase gene, GLD) were down-regulated. GS is a key enzyme in this
nitrogen assimilatory process, as it catalyzes the first step in the
conversion of inorganic nitrogen (ammonium) into its organic
form [37]. Consistently, we detected that the Glu content was
greatly decreased under AR treatments (Figure 5E). These results
suggested that nitrogen (N) assimilation was inhibited under AR
treatments. On the other hand, glutamate-1-semialdehyde 2,1-
aminomutase (GSA) is the first committed precursor of porphyrin
synthesis in organelles and organisms that use the carbon (C) 5
pathway [38]. As we know, lots of important organic molecules
such as chlorophyll are closely related with porphyrin, indicating
the C fixation is influenced by AR through GSA mediated
porphyrin synthesis pathway. Earlier studies have shown that AR
could inhibit respiration and photosynthesis, and further inhibit
plant growth [2,39], which could be an indirect proof of our data.
Generally, these results indicated that N and C metabolism were
disordered under AR treatment.
In Met cycle, Met is converted to S2Adenosyl Methionine
(SAM), which is a methyl donor for numerous reactions. SAM is
also a substrate for ethylene, polyamine and phytosiderophore
synthesis [40]. The expression of SAMS3, which is a key enzyme in
SAM synthesis, was greatly inhibited by AR, suggesting that theMet
cycle was influenced by AR treatment. Besides, S-adenosylmethi-
onine decarboxylase gene (SAMDC) expression was also depressed
under AR in our study (Figure 4). Recently, Arabidopsis mutant
analysis has indicated that SAMDC is essential for plant polyamine
biosynthesis pathway and play an important role in plant growth
and development [41]. In plants, polyamines are not only important
for both stress responses and developmental processes but also
essential for plant survival [42]. The disorder of polyamines
metabolism by AR would lead to more serious plant damage.
GSH Plays a Crucial Role in Reactive Oxygen Species(ROS) Scavenging under ARCys availability has been shown to be the main factor limiting
GSH production, both in normal plants and in those that
overexpress genes for GSH biosynthesis [43]. Cys is incorporated
into GSH that is one of the major redox controllers that plays
significant roles in scavenging ROS through the GSH-ascorbate
cycle [25] in which the dehydroascorbate reductase (DHAR)
reduces dehydroascorbate to ascorbate, while oxidizing GSH to
glutathione disulfide [27]. Many enzymes involved in this process
were up-regulated in our study which led to the synthesis of more
GSH in plant cells (Figure 4). Although some reports indicated
that Cys and GSH are negative regulators of gene expression
responding to S assimilation [44,45], there were some other
reports that the level of Cys increased in SO2 fumigated beech
leaves [24]. In spruce trees, exposure to SO2 increased the
accumulation of GSH and the activation of several scavenging
enzymes [46]. An additional effect of SO2 fumigation was an
increased level of sulfate suggesting that increased content of thiols
in response to excessive S deposition is a common phenomenon.
As we know, ROS as a typical secondary stress triggered by AR,
can cause severe damage to plants including growth and
photosynthesis reduction, and premature senescence as well [47–
49]. To prevent damage to membranes, chlorophylls and proteins,
ROS have to be detoxified by scavenging systems that are
consisting of low-molecular weight antioxidants and antioxidative
enzymes in the apoplast and the symplast of plant cells [50].
Accumulating evidence further suggests that these adaptive
responses of plants to increased ROS levels are mediated by
changes in cellular GSH concentrations or the redox status of
GSH pool [43].
Figure 4. Schematic representation of a possible systematic response mechanism related to sulfur metabolism in Arabidopsisthaliana under simulated acid rain (AR) stress. The up- and down- regulated proteins or genes are labeled in red and green. The direct andindirect interaction of proteins or genes are indicated as solid or dotted line, respectively. Combined with our results, this figure was developed fromthe reviews of Hawkesford et al. [56] and Saito [11].doi:10.1371/journal.pone.0090120.g004
Sulfur Metabolism Analysis under Acid Rain
PLOS ONE | www.plosone.org 8 March 2014 | Volume 9 | Issue 3 | e90120
Direct evidence showing ROS is a signaling component in
plants is not yet available. However, several genes involved in S
assimilation and synthesis of S-containing amino acids were
induced by exposure to O22 [48]. In this study, we identified a set
of genes and proteins related to GSH metabolism pathways which
were greatly up-regulated. For example, the expression of two
genes (GPX1, GPX6) encoding glutathione peroxidases (GPX) was
induced under AR in our study. As we know, GPX is the general
name of the enzyme family with peroxidase activity whose main
biological role is to protect the organism from oxidative damage.
Evidence suggested that GPX activity also plays a role in stress-
related signal transduction [51]. The plant glutathione transfer-
ases, formerly known as glutathione S-transferases (GSTs) are a
large and diverse group of enzymes that catalyze the conjugation
of electrophilic xenobiotic substrates with GSH [52]. Besides,
GSTs are also important components of the cellular defense
against oxidative stress [38]. We found GST genes or proteins
were induced in both proteomic and transcriptomic experiments.
Consistently, numerous studies have revealed that members of the
GST super-family are expressed in response to microbial infection,
cell division and environmental stresses [53,54] as well as AR
treatment in our pervious study [55].
Surely, acid rain not only disordered S metablism, but also
effceted many other pathways. Lots of publications have demon-
strated that AR causes a series of damages to plants, which
includes destruction of the cell membrane, inhibition of respiration
and photosynthesis, as well as disorders in metabolism of glucose,
lipids and amino acids. Our transcriptomic and proteomic analysis
also revealed that the expression of a set of genes and proteins
related to primary metabolism, photosynthesis, metabolism of
ROS, cellular transport, and signal transduction, were influenced
by AR treatment. Due to the complexity of the emerging pattern,
further work is required to delineate and confirm the precise
effects of AR on metabolism and physiology.
Conclusion
Using proteomic and transcriptomic methods, we studied the
responses of S uptake and metabolic pathways in Arabidopsis
seedlings exposed to simulated AR. By summarizing the informa-
tion on the coordination between different metabolic changes, a
network of mutual cross-influences in the AR-stress response could
be assembled. Apparently, the entire network of S metabolism was
coordinately regulated under AR stress. First of all, sulfate uptake
and acquisition, that totally control the input of sulfate into S
metabolic pathways, have been identified to be in positive
correlation with AR. Furthermore, the activation of sulfate also
increased as AR was imposed. Thirdly, the biosynthesis from
sulfate to S-containing amino acid, for example, Cys and Met and
other secondary metabolites were up-regulated under AR stress.
Finally, we depicted the coordinating network of S metabolism
Figure 5. Effects of simulated acid rain (AR) on the reduced glutathione (GSH) content (A), Ser acetyltransferase (SAT) activity (B)and three S-containing amino acid contents (C–E) in Arabidopsis thaliana. The values were derived from the average of three replicatemeasurements. The asterisk indicates significance at p,0.05.doi:10.1371/journal.pone.0090120.g005
Sulfur Metabolism Analysis under Acid Rain
PLOS ONE | www.plosone.org 9 March 2014 | Volume 9 | Issue 3 | e90120
including S uptake, activation, S-containing amino acid biosyn-
thesis and other S-containing metabolites synthesis under AR
stress. This study can help us to understand the mechanisms by
which plants adapt to AR environment by alteration of the S
metabolism.
Supporting Information
Figure S1 Injury phenotype of Arabidopsis leaves under
simualted acid rain treatment.
(PDF)
Table S1 Primer pairs used in qRT-PCR analysis for 12 sulfur
metabolism related genes. Actin 2 was used as a standard to
normalize the content of cDNA.
(DOC)
Table S2 The details of identified acid rain stress-responsive
proteins in Arabidopsis.
(DOC)
Acknowledgments
We are grateful to Chen Lei for assistance in experiments, and Mr. Sieh
Kargbo for editing the manuscript.
Author Contributions
Conceived and designed the experiments: TWL JAC FHW HLZ.
Performed the experiments: TWL JBC WJH WHW. Analyzed the data:
TWL JBC FHW HLZ. Contributed reagents/materials/analysis tools:
TWL FHW. Wrote the paper: TWL JAC HLZ MS.
References
1. Larssen T, Lydersen E, Tang DG, He Y, Gao JX, et al. (2006) Acid rain in
china. Environmental Science & Technology 40: 418–425.
2. Likens GE, Driscoll CT, Buso DC (1996) Long-term effects of acid rain:
response and recovery of a forest ecosystem. Science 272: 244–246.
3. Rogasik J, Schroetter S, Schnug E (2002) Impact of air pollutants on agriculture.
Phyton-Annales Rei Botanicae 42: 171–182.
4. Karnosky DF (2001) Impacts of air pollution on forest ecosystems - Preface.
Environmental Pollution 115: 317–317.
5. Likens GE, Weathers KC, Butler TJ, Buso DC (1998) Solving the acid rain
problem. Science 282: 1991–1992.
6. Brychkova G, Xia ZL, Yang GH, Yesbergenova Z, Zhang ZL, et al. (2007)
Sulfite oxidase protects plants against sulfur dioxide toxicity. Plant Journal 50:
696–709.
7. Lee Y, Park J, Im K, Kim K, Lee J, et al. (2006) Arabidopsis leaf necrosis caused
by simulated acid rain is related to the salicylic acid signaling pathway. Plant
Physiology and Biochemistry 44: 38–42.
8. Bick JA, Leustek T (1998) Plant sulfur metabolism - the reduction of sulfate to
sulfite. Current Opinion in Plant Biology 1: 240–244.
9. Hell R (1997) Molecular physiology of plant sulfur metabolism. Planta 202: 138–
148.
10. Rausch T, Wachter A (2005) Sulfur metabolism: a versatile platform for
launching defence operations. Trends in Plant Science 10: 503–509.
11. Saito K (2004) Sulfur assimilatory metabolism. The long and smelling road.
Plant Physiology 136: 2443–2450.
12. Kopriva S, Rennenberg H (2004) Control of sulphate assimilation and
glutathione synthesis: interaction with N and C metabolism. Journal of
Experimental Botany 55: 1831–1842.
13. Zhu GH, Zhuang CX, Wang YQ, Jiang LR, Peng XX (2006) Differential
expression of rice genes under different nitrogen forms and their relationship
with sulfur metabolism. Journal of Integrative Plant Biology 48: 1177–1184.
14. Gallardo K, Firnhaber C, Zuber H, Hericher D, Belghazi M, et al. (2007) A
combined proteome and transcriptome analysis of developing Medicago
truncatula seeds. Molecular & Cellular Proteomics 6: 2165–2179.
15. Klikocka H, Haneklaus S, Bloem E, Schnug E (2005) Influence of sulfur
fertilization on infection of potato tubers with Rhizoctonia solani and Streptomyces
scabies. Journal of Plant Nutrition 28: 819–833.
16. Hesse H, Kreft O, Maimann S, Zeh M, Willmitzer L, et al. (2001) Approaches
towards understanding methionine biosynthesis in higher plants. Amino Acids
20: 281–289.
17. Li LY, Li QB, Rohlin L, Kim U, Salmon K, et al. (2007) Quantitative proteomic
and microarray analysis of the archaeon Methanosarcina acetivorans grown with
acetate versus methanol. Journal of Proteome Research 6: 759–771.
18. Fan HB, Wang YH (2000) Effects of simulated acid rain on germination, foliar
damage, chlorophyll contents and seedling growth of five hardwood species
growing in China. Forest Ecology and Management 132: 285–285.
19. Carpentier SC, Witters E, Laukens K, Deckers P, Swennen R, et al. (2005)
Preparation of protein extracts from recalcitrant plant tissues: An evaluation of
different methods for two-dimensional gel electrophoresis analysis. Proteomics 5:
2497-2507.
20. Livak KJ, Schmittgen TD (2001) Analysis of relative gene expression data using
real-time quantitative PCR and the 2(T)(-Delta Delta C) method. Methods 25:
402–408.
21. Karni L, Moss SJ, Telor E (1984) Glutathione-reductase activity in heterocysts
and vegetative cells of the Cyanobacterium Nostoc-Muscorum. Archives of
Microbiology 140: 215–217.
22. Youssefian S, Nakamura M, Orudgev E, Kondo N (2001) Increased cysteine
biosynthesis capacity of transgenic tobacco overexpressing an O-acetylser-
ine(thiol) lyase modifies plant responses to oxidative stress. Plant Physiology 126:
1001–1011.
23. Resch A, Leicht S, Saric M, Pasztor L, Jakob A, et al. (2006) Comparativeproteome analysis of Staphylococcus aureus biofilm and planktonic cells andcorrelation with transcriptome profiling. Proteomics 6: 1867–1877.
24. Marmagne A, Brabant P, Thiellement H, Alix K (2010) Analysis of geneexpression in resynthesized Brassica napus allotetraploids: transcriptional changesdo not explain differential protein regulation. New Phytologist 186: 216–227.
25. Cordwell SJ, Thingholm TE (2010) Technologies for plasma membraneproteomics. Proteomics 10: 611–627.
26. Gorg A, Drews O, Luck C, Weiland F, Weiss W (2009) 2-DE with IPGs.Electrophoresis 30: S122–S132.
27. Mitchell P (2010) Proteomics retrenches. Nature Biotechnology 28: 665–670.
28. Shibagaki N, Rose A, McDermott JP, Fujiwara T, Hayashi H, et al. (2002)Selenate-resistant mutants of Arabidopsis thaliana identify Sultr1;2, a sulfate
transporter required for efficient transport of sulfate into roots. Plant Journal 29:475–486.
29. Yoshimoto N, Takahashi H, Smith FW, Yamaya T, Saito K (2002) Two distincthigh-affinity sulfate transporters with different inducibilities mediate uptake ofsulfate in Arabidopsis roots. Plant Journal 29: 465–473.
30. Hawkesford MJ (2003) Transporter gene families in plants: the sulphatetransporter gene family - redundancy or specialization? Physiologia Plantarum117: 155–163.
31. Nikiforova V, Freitag J, Kempa S, Adamik M, Hesse H, et al. (2003)Transcriptome analysis of sulfur depletion in Arabidopsis thaliana: interlacing ofbiosynthetic pathways provides response specificity. Plant Journal 33: 633–650.
32. Maruyama-Nakashita A, Inoue E, Watanabe-Takahashi A, Yarnaya T,Takahashi H (2003) Transcriptome profiling of sulfur-responsive genes inArabidopsis reveals global effects of sulfur nutrition on multiple metabolicpathways. Plant Physiology 132: 597–605.
33. Koralewska A, Buchner P, Stuiver CEE, Posthumus FS, Kopriva S, et al. (2009)Expression and activity of sulfate transporters and APS reductase in curly kale inresponse to sulfate deprivation and re-supply. Journal of Plant Physiology 166:168–179.
34. Loudet O, Saliba-Colombani V, Camilleri C, Calenge F, Gaudon V, et al.(2007) Natural variation for sulfate content in Arabidopsis thaliana is highly
controlled by APR2. Nature Genetics 39: 896–900.
35. Harms K, von Ballmoos P, Brunold C, Hofgen R, Hesse H (2000) Expression ofa bacterial serine acetyltransferase in transgenic potato plants leads to increased
levels of cysteine and glutathione. Plant Journal 22: 335–343.
36. Toda K, Takano H, Nozaki J, Kuroiwa T (2001) The second serineacetyltransferase, bacterial-type O-acetylserine (thiol) lyase and eukaryotic-type
O-acetylserine (thiol) lyase from the primitive red alga Cyanidioschyzon merolae.Journal of Plant Research 114: 291–300.
37. Peterman TK, Goodman HM (1991) The Glutamine-synthetase gene family of
Arabidopsis thaliana - light regulation and differential expression in leaves, rootsand seeds. Molecular & General Genetics 230: 145–154.
38. Oliveira IC, Coruzzi GM (1999) Carbon and amino acids reciprocally modulate
the expression of glutamine synthetase in arabidopsis. Plant Physiology 121:301–309.
39. Tomlinson GH (2003) Acidic deposition, nutrient leaching and forest growth.
Biogeochemistry 65: 51–81.
40. Goto DB, Ogi M, Kijima F, Kumagai T, van Werven F, et al. (2002) A single-
nucleotide mutation in a gene encoding S-adenosylmethionine synthetase isassociated with methionine over-accumulation phenotype in Arabidopsis thaliana.Genes & Genetic Systems 77: 89–95.
41. Ge CM, Cui X, Wang YH, Hu YX, Fu ZM, et al. (2006) BUD2, encoding an S-adenosylmethionine decarboxylase, is required for Arabidopsis growth anddevelopment. Cell Research 16: 446–456.
42. Walters DR (2003) Polyamines and plant disease. Phytochemistry 64: 97–107.
43. Noctor G, Arisi ACM, Jouanin L, Foyer CH (1998) Manipulation of glutathioneand amino acid biosynthesis in the chloroplast. Plant Physiology 118: 471–482.
Sulfur Metabolism Analysis under Acid Rain
PLOS ONE | www.plosone.org 10 March 2014 | Volume 9 | Issue 3 | e90120
44. Hirai MY, Klein M, Fujikawa Y, Yano M, Goodenowe DB, et al. (2005)Elucidation of gene-to-gene and metabolite-to-gene networks in Arabidopsis byintegration of metabolomics and transcriptomics. Journal of BiologicalChemistry 280: 25590–25595.
45. Fabio F, Clarissa L, Barbara G, Gian AS (2007) Sulfur metabolism andcadmium stress in higher plants. Global Science Books.
46. Rennenberg H, Herschbach C, Haberer K, Kopriva S (2007) Sulfur metabolismin plants: Are trees different? Plant Biology 9: 620–637.
47. Bandurska H, Borowiak K, Miara M (2009) Effect of two different ambientozone concentrations on antioxidative enzymes in leaves of two tobacco cultivarswith contrasting ozone sensitivity. Acta Biologica Cracoviensia Series Botanica51: 37–44.
48. Langebartels C, Wohlgemuth H, Kschieschan S, Grun S, Sandermann H (2002)Oxidative burst and cell death in ozone-exposed plants. Plant Physiology andBiochemistry 40: 567–575.
49. Yano A, Suzuki K, Shinshi H (1999) A signaling pathway, independent of theoxidative burst, that leads to hypersensitive cell death in cultured tobacco cellsincludes a serine protease. Plant Journal 18: 105–109.
50. Asada K (2004) Functions of the water-water cycle in chloroplasts. Plant and
Cell Physiology 45: S11–S11.
51. Winfield MO, Lu CG, Wilson ID, Coghill JA, Edwards KJ (2010) Plant
responses to cold: transcriptome analysis of wheat. Plant Biotechnology Journal
8: 749–771.
52. Dixon DP, Skipsey M, Edwards R (2010) Roles for glutathione transferases in
plant secondary metabolism. Phytochemistry 71: 338–350.
53. Hatzios KK (1999) Functions and regulation of plant glutathione S-transferases.
Abstracts of Papers of the American Chemical Society 218: U117–U117.
54. Moons A (2005) Regulatory and functional interactions of plant growth
regulators and plant glutathione S-transferases (GSTS). Plant Hormones 72:
155–202.
55. Liu TW, Fu B, Niu L, Chen J, Wang WH, et al. (2011) Comparative proteomic
analysis of proteins in response to simulated acid rain in Arabidopsis. Journal of
Proteome Research 10: 2579–2589.
56. Hawkesford MJ, De Kok LJ (2006) Managing sulphur metabolism in plants.
Plant, Cell and Environment 29: 382–395.
Sulfur Metabolism Analysis under Acid Rain
PLOS ONE | www.plosone.org 11 March 2014 | Volume 9 | Issue 3 | e90120


