arXiv:0910.4279v1 [astro-ph.CO] 22 Oct 2009 Draft version October 22, 2009 Preprint typeset using L A T E X style emulateapj v. 04/20/08 THE HERSCHEL ATLAS S. Eales 1 , L. Dunne 2 , D. Clements 3 , A. Cooray 4 , G. De Zotti 5 , S. Dye 1 , R. Ivison 6 , M. Jarvis 7 , G. Lagache 8 , S. Maddox 2 , M. Negrello 9 , S. Serjeant 9 , M.A. Thompson 7 , E. Van Kampen 10 , A. Amblard 4 , P. Andreani 10 , M. Baes 11 , A. Beelen 8 , G.J. Bendo 3 , D. Benford 12 , F. Bertoldi 40 , J. Bock 47 , D. Bonfield 7 , A. Boselli 14 , C. Bridge 13 , V. Buat 14 , D. Burgarella 14 , R. Carlberg 48 , A. Cava 15 , P. Chanial 3 , S. Charlot 16 , N. Christopher 45 , P. Coles 1 , L. Cortese 1 , A. Dariush 1 , E. da Cunha 17 , G. Dalton 18 , L. Danese 19 , H. Dannerbauer 20 , S. Driver 46 , J. Dunlop 31 , L. Fan 19 , D. Farrah 21 , D. Frayer 22 , C. Frenk 23 , J. Geach 23 , J. Gardner 12 , H. Gomez 1 , J. Gonz´ alez-Nuevo 19 , E. Gonz´ alez-Solares 24 , M. Griffin 1 , M. Hardcastle 7 , E. Hatziminaoglou 10 , D. Herranz 25 , D. Hughes 26 , E. Ibar 6 , Woong-Seob Jeong 50 , C. Lacey 23 , A. Lapi 51 , M. Lee 27 , L. Leeuw 28 , J. Liske 10 , M. L´ opez-Caniego 29 , T. M¨ uller 30 , K. Nandra 3 , P. Panuzzo 39 , A. Papageorgiou 1 , G. Patanchon 49 , J. Peacock 31 , C. Pearson 32 , S. Phillipps 33 , M. Pohlen 1 , C. Popescu 34 , S. Rawlings 45 , E. Rigby 2 , M. Rigopoulou 18 , G. Rodighiero 42 , A. Sansom 34 , B. Schulz 13 , D. Scott 35 , D.J.B. Smith 2 , B. Sibthorpe 6 , I. Smail 23 , J. Stevens 7 , W. Sutherland 36 , T. Takeuchi 37 , J. Tedds 38 , P. Temi 28 , R. Tuffs 41 , M. Trichas 3 , M. Vaccari 42 , I. Valtchanov 43 , P. van der Werf 44 , A. Verma 45 , J. Vieria 13 , C. Vlahakis 44 & Glenn J. White 9,32 Draft version October 22, 2009 ABSTRACT The Herschel ATLAS is the largest open-time key project that will be carried out on the Herschel Space Observatory. It will survey 510 square degrees of the extragalactic sky, four times larger than all the other Herschel surveys combined, in five far-infrared and submillimetre bands. We describe the survey, the complementary multi-wavelength datasets that will be combined with the Herschel data, and the six major science programmes we are undertaking. Using new models based on a previous submillimetre survey of galaxies, we present predictions of the properties of the ATLAS sources in other wavebands. Subject headings: 1 School of Physics and Astronomy, Cardiff University, Queens Buildings, The Parade, Cardiff CF24 3AA, UK 2 School of Physics and Astronomy, University of Nottingham, Nottingham, NG7 2RD, UK 3 Physics Department, Imperial College London, Prince Consort Road, London, SW7 2AZ, UK 4 Center for Cosmology, University of California, Irvine, CA 92697, USA 5 INAF-Osservatorio Astronomico di Padova, I-35122 Padova, and SISSA, I-34014 Trieste, Italy 6 UK Astronomy Technology Centre, Royal Observatory, Black- ford Hill, Edinburgh EH9 3HJ, UK 7 Centre for Astrophysics Research, STRI, University of Hert- fordshire, Hatfield, AL10 9AB, UK 8 Institut d’Astrophysique Spatiale (IAS), Btiment 121, F-91405 Orsay, France; and Universit Paris-Sud 11 and CNRS (UMR 8617), France 9 Dept. of Physics and Astronomy, The Open University, Milton Keynes, MK7 6AA, UK 10 European Southern Observatory, Karl-Schwarzschild-Str. 2, 85748 Garching bei M¨ unchen, Germany 11 Sterrenkundig Observatorium, Universiteit Gent, Krijgslaan 281 S9, B-9000 Gent, Belgium 12 Observational Cosmology Laboratory, Code 665, NASA’s Goddard Space Flight Center, Greenbelt MD 20771, USA 13 California Institute of Technology, 1200 East California Blvd., Pasadena, CA 91125, USA 14 Laboratoire d’Astrophysique de Marseille, Observatoire As- tronomique Marseille Provence, Aix-Marseille Universit, CNRS, Franc 15 Instituto de Astrofsica de Canarias, Calle Va Lctea, E38205, La Laguna, Esp 16 Institut d’Astrophysique de Paris, CNRS UMR7095 UPMC, 98 bis boulevard Arago, F-75014 Paris, France 17 Department of Physics, University of Crete, 71003 Heraklion, Greece 18 Astrophysics, University of Oxford, Oxford OX1 3RH and The Rutherford Appleton Laboratory, Chilton, Didcot, OX11 0QX 19 SISSA, Via Beirut 2-4, I-34014 Trieste, Italy 20 Max Planck Institute for Astronomy, Knigstuhl 17, D-69117 Heidelberg, German 21 Astronomy Centre, University of Sussex, Brighton, UK 22 Infrared Processing and Analysis Center, California Institute of Technology 100-22, Pasadena, CA 91125, USA 23 Institute for Computational Cosmology, Physics Dept, Durham University, South Road, Durham DH1 3LE 24 Institute of Astronomy, University of Cambridge, Madingley Rd., Cambridge CB3 0HA, UK 25 Instituto de F´ ısica de Cantabria (CSIC-UC), Santander, 39005, Spain 26 Instituto Nacional de Astrof´ ısica, Optica y Electr´ onica (INAOE), Aptdo. Postal 51 y 216, Puebla, Mexico 27 Astronomy Program, Department of Physics and Astronomy, Seoul National University, Seoul 151-742, KOREA 28 Astrophysics Branch, NASA Ames Research Center, Mail Stop 245-6, Moffett Field, CA 94035, USA 29 Instituto de F´ ısica de Cantabria (CSIC-UC), Santander, 39005, Spain 30 Max-Planck-Institut f¨ ur extraterrestrische Physik, Giessen- bachstrasse, 85748 Garching, Germany 31 Institute for Astronomy, University of Edinburgh, Royal Ob- servatory, Edinburgh EH9 3HJ, UK 32 Rutherford Appleton Laboratory, Chilton, Didcot, Oxford- shire OX11 0QX, UK 33 Astrophysics Group, Department of Physics, University of Bristol, Tyndall Avenue, Bristol BS8 1TL 34 Jeremiah Horrocks Institute, University of Central Lan- cashire, Preston, PR1 2HE, UK 35 Department of Physics & Astronomy, University of British Columbia, 6224 Agricultural Road, Vancouver BC, V6T1Z1, Canada 36 Astronomy Unit, Queen Mary University of London, Mile End Road, London E1 4NS, UK 37 Institute for Advanced Research, Nagoya University, Furo- cho, Chikusa-ku, Nagoya 464-8601, Japan 38 Department of Physics and Astronomy, University of Leices- ter, University Road, Leicester LE1 7RH, UK 39 CEA, Laboratoire AIM, Irfu/SAp, F-91191 Gif-sur-Yvette, France 40 Argelander Institute for Astronomy, Bonn University, Auf dem Huegel 71, D-53121 Bonn, Germany
Transcript
arX
iv:0
910.
4279
v1 [
astr
o-ph
.CO
] 2
2 O
ct 2
009
Draft version October 22, 2009Preprint typeset using LATEX style emulateapj v. 04/20/08
THE HERSCHEL ATLAS
S. Eales1, L. Dunne2, D. Clements3, A. Cooray4, G. De Zotti5, S. Dye1, R. Ivison6, M. Jarvis7, G. Lagache8, S.Maddox2, M. Negrello9, S. Serjeant9, M.A. Thompson7, E. Van Kampen10, A. Amblard4, P. Andreani10, M.
Baes11, A. Beelen8, G.J. Bendo3, D. Benford12, F. Bertoldi40, J. Bock47, D. Bonfield7, A. Boselli14, C. Bridge13,V. Buat14, D. Burgarella14, R. Carlberg48, A. Cava15, P. Chanial3, S. Charlot16, N. Christopher45, P. Coles1,L. Cortese1, A. Dariush1, E. da Cunha17, G. Dalton18, L. Danese19, H. Dannerbauer20, S. Driver46, J. Dunlop31,L. Fan19, D. Farrah21, D. Frayer22, C. Frenk23, J. Geach23, J. Gardner12, H. Gomez1, J. Gonzalez-Nuevo19, E.Gonzalez-Solares24, M. Griffin1, M. Hardcastle7, E. Hatziminaoglou10, D. Herranz25, D. Hughes26, E. Ibar6,Woong-Seob Jeong50, C. Lacey23, A. Lapi51, M. Lee27, L. Leeuw28, J. Liske10, M. Lopez-Caniego29, T. Muller30,K. Nandra3, P. Panuzzo39, A. Papageorgiou1, G. Patanchon49, J. Peacock31, C. Pearson32, S. Phillipps33, M.
Pohlen1, C. Popescu34, S. Rawlings45, E. Rigby2, M. Rigopoulou18, G. Rodighiero42, A. Sansom34, B. Schulz13, D.Scott35, D.J.B. Smith2, B. Sibthorpe6, I. Smail23, J. Stevens7, W. Sutherland36, T. Takeuchi37, J. Tedds38, P.Temi28, R. Tuffs41, M. Trichas3, M. Vaccari42, I. Valtchanov43, P. van der Werf44, A. Verma45, J. Vieria13, C.
Vlahakis44 & Glenn J. White9,32
Draft version October 22, 2009
ABSTRACT
The Herschel ATLAS is the largest open-time key project that will be carried out on the HerschelSpace Observatory. It will survey 510 square degrees of the extragalactic sky, four times larger thanall the other Herschel surveys combined, in five far-infrared and submillimetre bands. We describe thesurvey, the complementary multi-wavelength datasets that will be combined with the Herschel data,and the six major science programmes we are undertaking. Using new models based on a previoussubmillimetre survey of galaxies, we present predictions of the properties of the ATLAS sources inother wavebands.Subject headings:
1 School of Physics and Astronomy, Cardiff University, QueensBuildings, The Parade, Cardiff CF24 3AA, UK
2 School of Physics and Astronomy, University of Nottingham,Nottingham, NG7 2RD, UK
3 Physics Department, Imperial College London, Prince ConsortRoad, London, SW7 2AZ, UK
4 Center for Cosmology, University of California, Irvine, CA92697, USA
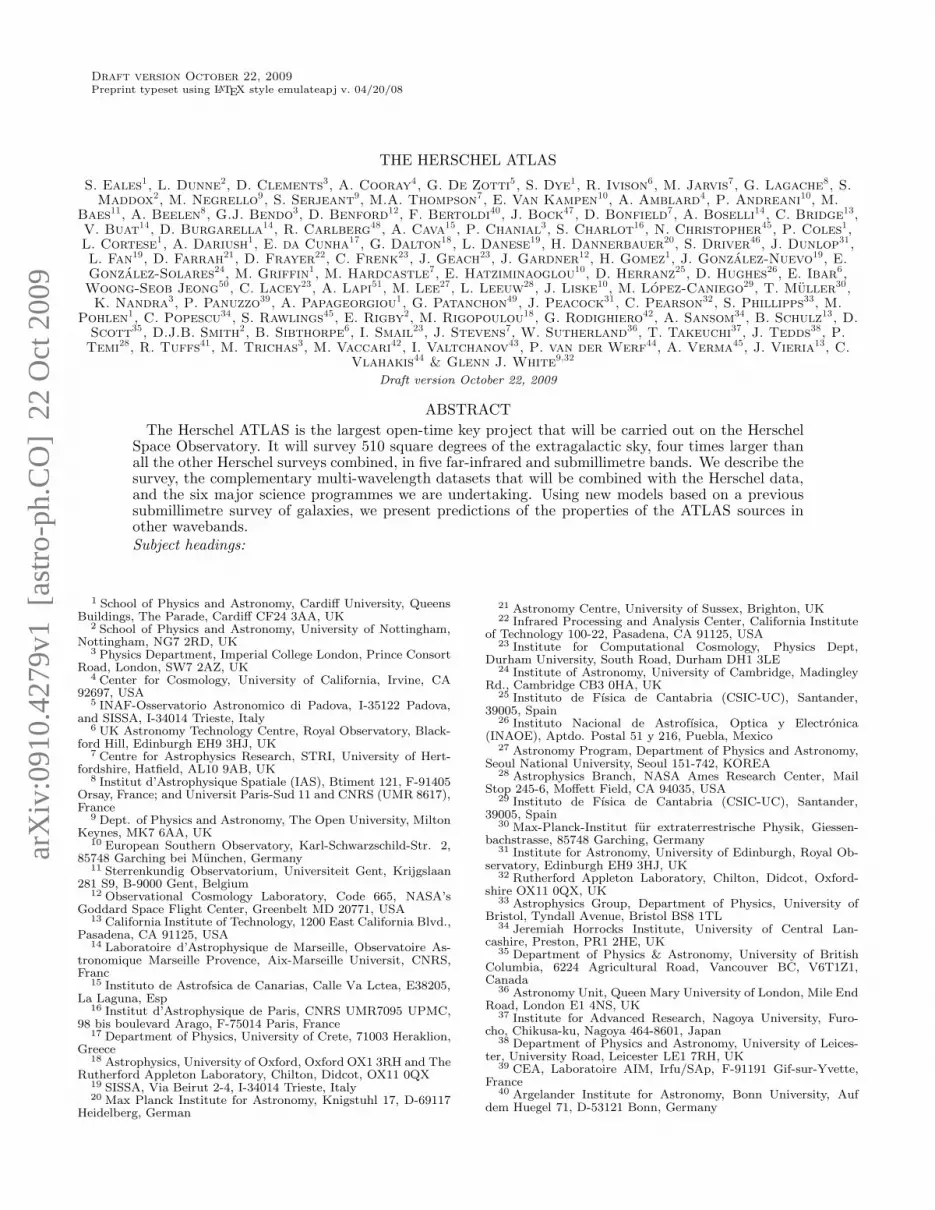
Approximately half the energy emitted since thebig bang by all the objects in the Universe hasbeen absorbed by dust and then reradiated between60 and 500 µm (Dwek et al. 1998; Fixsen et al. 1998;Driver et al. 2008), a wavelength range in which the Uni-verse is still largely unexplored (Fig. 1). On the short-wavelength side of this waveband, the whole sky was sur-veyed at 60 and 100 µm by IRAS in the 1980s. However,almost all of the tens of thousands of galaxies detected byIRAS were spirals and starbursts in the nearby Universe(z < 0.1), and IRAS revealed little about the dust inother galaxy populations, especially early-type galaxies(Bregman et al. 1998). Even in the late-type galaxies,only the small fraction of the the dust warm enough toradiate significantly in the far-infrared was detected byIRAS. Devereux and Young (1990), for example, showedthat the gas-to-dust ratio estimated from IRAS measure-ments alone was ≃10 times greater than the standardGalactic value, implying that ≃90% of the dust in galax-ies was effectively missed by IRAS. ISO and Spitzer, withtheir long wavelength (170 µm) band, suffered less fromthis problem but will still have effectively missed any dustwith T < 15K (Bendo et al. 2003). Notwithstanding thesuccesses of IRAS, ISO and Spitzer, most of the wave-band from 60 to 500 µm is still virtually terra incognita,and the only survey of a large area of the extragalacticsky at a wavelength beyond 200 µm is the one recentlycarried out by the Herschel pathfinder experiment, theBalloon Large Area Survey Telescope (BLAST), whichcovers ≃ 20 deg2 (Devlin et al. 2009).
The lack of a survey covering a large area of skyin the submillimetre waveband (in this paper definedas 100 µm < λ < 1 mm) has left us in some waysknowing more about dust in the distant, early Universethan in the Universe today. The surveys that havebeen carried out in the submillimetre waveband withground-based telescopes—at 450 and 850 µm withthe SCUBA camera on the James Clerk MaxwellTelescope (Hughes et al. 1998; Eales et al. 1999;Coppin et al. 2006), at 1.2 mm with MAMBO
46 School of Physics and Astronomy, University of St Andrews,St Andrews, KY16 9SS
47 Astrophysics and Space Science, Jet Propulsion Laboratory,Pasadena, CA, 91109, USA; and Department of Physics, Mathand Astronomy, California Institute of Technology, Pasadena, CA,91125, USA
48 Department of Astronomy and Astrophysics, 50 St. GeorgeStreet, Toronto, Ontario, M5S 3H4, Canada
49 Universite Denis Diderot, Laboratoire Astro-Particules etCosmologie, 10 rue Alice Domon et Leonie Duquet, 75205, ParisCedex 13, France
50 Space Science Division, Korea Astronomy & Space ScienceInstitute, 61-1, Whaam-dong, Yuseung-gu, Deajeon, 305-348, Re-public of Korea
51 Physics Dept., University Tor Vergata, Via della Ricerca Sci-entifica 1, I-00133 Roma, Italy
Fig. 1.— The extraglactic background radiation as a function ofwavelength (Dole et al. 2006)
on the IRAM 30-m telescope (Greve et al. 2004;Bertoldi et al. 2007; Greve et al. 2008) and at 1.1mm with AZTEC on the James Clerk Maxwell Tele-scope (Perera et al. 2008; Scott et al. 2008)—havebeen of very small areas of sky, covering ∼ 1 deg2 ofsky in total. Because of the unusual submillimetre‘K-correction’52, these surveys have mostly detectedsources at very high redshifts (z 1). They have ledto the important discovery that there is a population ofluminous dust-enshrouded galaxies in the early Universe(Smail et al. 1997; Hughes et al. 1998), which manyauthors have suggested are the ancestors of ellipticalstoday (Scott et al. 2002; Dunne et al. 2003), but theyhave told us relatively little about the evolution ofthe Universe since z ≃ 1 (the last 8 billion years) andalmost nothing at all about dusty galaxies in the nearbyUniverse.
Two basic things one would like to know about thenearby Universe are the submillimetre luminosity func-tion and the dust-mass function(the space-density ofgalaxies as a function of dust mass). These functionsare important for many reasons, including tests of semi-analytical models of galaxy formation (Cole et al. 2000;Baugh et al. 2005) and, by comparison with the samefunctions at high redshift, accurate measurements of theamount of evolution that is occurring in the submil-limetre waveband (Dunne et al. 2003). Unfortunately,our knowledge of these functions is still extremely poorbecause of the limitations in areal coverage and sen-sitivity of previous submillimetre telescopes. Until re-cently the only estimates of the local submillimetre lu-minosity function were one based on 55 galaxies de-tected in an ISO 170-µm survey (Takeuchi et al. 2006)and ones based on SCUBA 850-µm observations of ≃200galaxies selected in other wavebands (Dunne et al. 2000;Vlahakis et al. 2005). There are now direct estimatesfrom the BLAST results of the local luminosity functionat 250, 350 and 500 µm (Eales et al. 2009), but theiraccuracy is limited by the small number of low-redshiftsources detected in the BLAST survey: ≃ 30 at z < 0.2.
52 Beyond a redshift of ≃ 1, as the redshift increases, the typi-cal spectral energy distribution of a dusty galaxy means that theeffect of increasing luminosity-distance on the brightness of thegalaxy is compensated for by the increasing rest-frame luminosityof the galaxy. The consequence is that the galaxy’s flux density isapproximately independent of redshift.
The Herschel ATLAS 3
The lack of a large-area survey capable of measuringthe dust content and dust-obscured star formation inlarge numbers of galaxies in the local Universe has beenespecially galling for submillimetre astronomers in thelight of the success of their colleagues working in otherwavebands. The Sloan Digital Sky Survey and the 2dFGalaxy Redshift Survey have led to a revolution in ourunderstanding of the distribution of galaxies in the localUniverse, and the relationships between their presentstar-formation rate, star-formation history, stellarmass, morphology and environment (Lewis et al. 2002;Kauffmann et al. 2003a; Kauffmann et al. 2003b;Heavens et al. 2004; Balogh et al. 2004). However, allthe studies that have used these impressive datasetsto investigate the physics and ecology of the galaxypopulation have been forced to ignore the dust phaseof the interstellar medium and star formation that isheavily obscured by dust, because the IRAS survey wasonly sensitive enough to detect a small percentage of thegalaxies in the redshift surveys (1.8 per cent of the SDSSgalaxies - Obric et al. 2006), and it missed 90% of thedust in the detected galaxies because of its insensitivityto cold dust (Devereux and Young 1990).
The launch of the Herschel Space Observatory, whichoccurred on May 14th 2009, has the potential to dramat-ically increase our knowledge of dust and dust-obscuredstar formation, especially in the nearby Universe. Her-schel has two main cameras: SPIRE, which will be ableto image the sky simultaneously at 250, 350 and 500µm (Griffin et al. 2007), and PACS, which will be ableto image the sky in two bands simultaneously, either 70and 170 µm or 110 and 170 µm (Poglitsch et al. 2006).Herschel will have much better angular resolution (≃18arcsec at 250 µm) and sensitivity than previous observa-tories, and the spectral coverage of SPIRE will make itpossible to carry out the first large-area surveys in thisvirtually unexplored part of the electromagnetic spec-trum. The SPIRE bands will also make it possible todetect the cold dust that was missed by earlier obser-vatories. Herschel is also better suited for investigatingthe local Universe than the submillimetre surveys thatwill soon be carried out from the ground, in particularthe SCUBA-2 and LABOCA surveys, because these willoperate mostly at 850 µm, where low-redshift galaxiesare intrinsically faint, whereas the Herschel bands spanthe peak of the typical spectral energy distribution of agalaxy in the nearby Universe.
In this paper, we describe the largest project that willbe carried out with the Herschel Space Observatory in‘Open Time’, the time available for competition withinthe international astronomical community53. The Her-schel Astrohysical Terahertz Large Area Survey (the Her-schel ATLAS or H-ATLAS) will be a survey of 510 deg2
of sky in five photometric bands. This is ≃8 times largerthan the coverage of the next largest (in area) Herschelextragalactic survey, HERMES (Oliver et al. 2009). Themain scientific goal of the H-ATLAS is to provide mea-surements of the dust masses and dust-obscured star for-mation for tens of thousands of nearby galaxies, the far-IR/submillimetre equivalent to the SDSS photometric
53 This forms about 2/3 of the total observing time on Herschel,with the remaining 1/3 being time reserved for the teams that builtthe instruments—‘Guaranteed Time’.
Note. — Reading from the left, the columns are: the name of thefield; the central position of the field; the width of the field in degreesin RA; the width of the field in degrees in declination.a The precise coverage of the fields and their orientation on the sky willdepend on exactly when they are observed. See §6 for more details.
survey. However, the H-ATLAS has many other sciencegoals ranging from the investigation of the point sourcesthat will be detected by the Planck Surveyor to a studyof high-latitude galactic dust.
The arrangement of this paper is as follows. In Section2 we describe the basic parameters of the survey. In Sec-tion 3 we present predictions of the number and redshiftdistribution of the sources that will be detected by theH-ATLAS. In Section 4, we describe the complementarydata that exists or will soon exist for the H-ATLAS fields.In Section 5 we describe the six main H-ATLAS scienceprogrammes. In Section 6 we describe the detailed sur-vey strategy, including issues that will be of interest tothe general community, such as our plans for the releaseof data products. We everywhere assume the cosmologi-cal parameters for a ‘concordance universe’: ΩM = 0.267and ΩΛ = 0.762.
2. THE BASIC PARAMETERS OF THE SURVEY
The H-ATLAS has been allocated 600 hours of time,making it the largest key project that will be carriedout with Herschel in Open Time. For all of our sciencegoals (§5), the final sensitivity of the survey is not criti-cal and it is more important to survey the greatest pos-sible area of sky. We have therefore chosen to use themaximum possible scan rate for the telescope (60 arc-sec sec−1). For our first science programme (§5.1), it isimportant to make observations with PACS and SPIRE,and therefore we have chosen to use the Herschel ob-serving mode that allows simultaneous observations withthe two cameras: Parallel Mode (PMode). Of the twopossible combinations of photometric bands for PACS(Poglitsch et al. 2006), we have chosen to observe at 110and 170 µm rather than at 70 and 170 µm mostly onthe grounds of sensitivity; the noise at 70 and 110 µmshould be fairly similar but galaxies, even at low red-shift, are generally brighter at the longer wavelength.Although this combination will be worse for estimatingthe temperature of the dust, our models suggest that wewill still be able to obtain useful measurements of thetemperature of the dust in low-redshift galaxies.
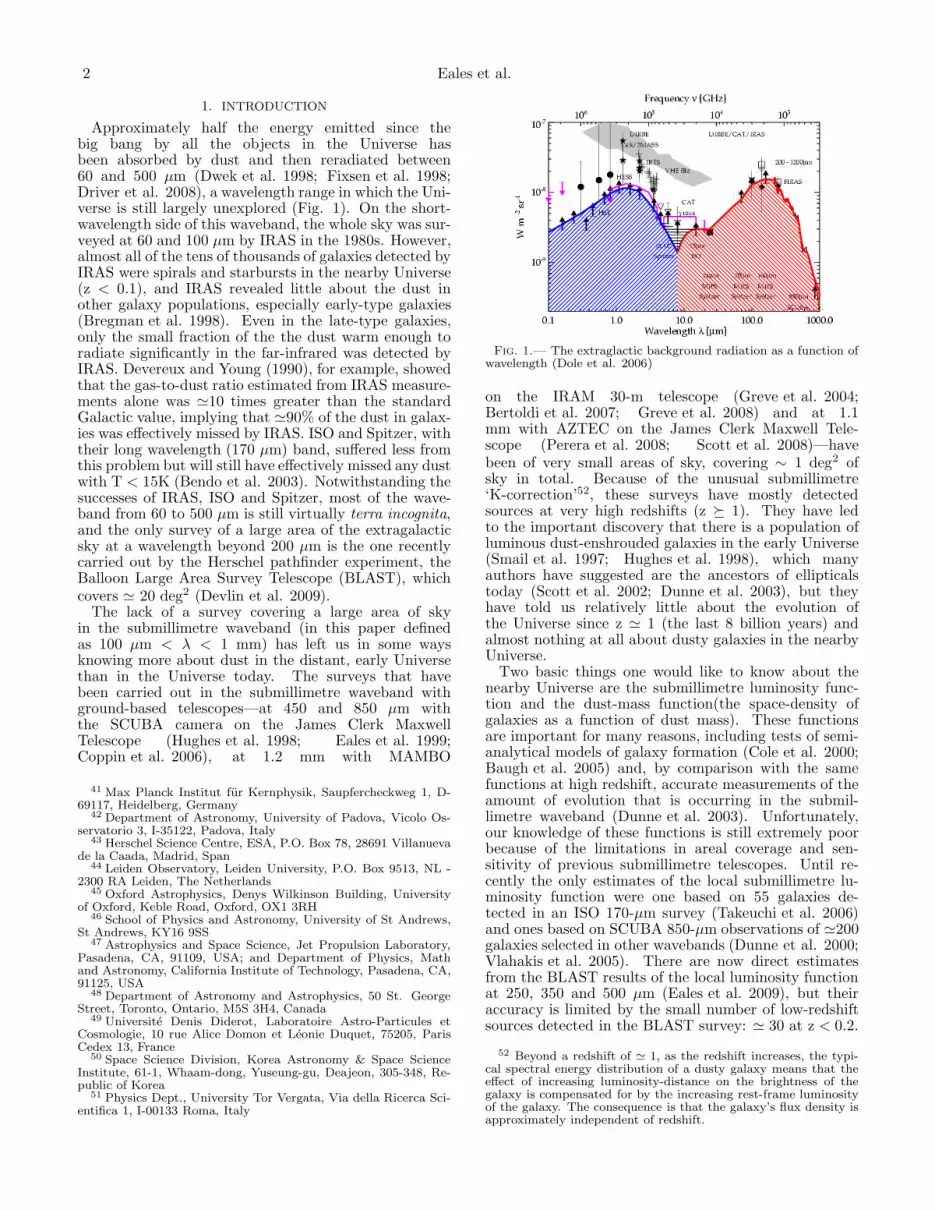
With an eye on the legacy value of the H-ATLAS, wehave chosen to observe fields in the northern and south-ern hemispheres and on the celestial equator. Other thanthat, we have chosen our fields to maximise the amountof complementary data and to minimize the amount ofconfusing emission from dust in the Galaxy, this last de-termined from the IRAS 100 µm maps. The fields, which
4 Eales et al.
Fig. 2.— The positions of the ATLAS field, shown as white blocks, superimposed on the IRAS 100 µm map of the sky, which traces thedistribution of galactic dust. Figure 2(a) shows the northern galactic cap and Figure 2(b) shows the southern galactic cap. The colourcoding for the lines is as follow: solid green lines—RA and dec; dotted green lines—ecliptic latitude and longitude; cyan—KIDS/VIKINGarea; yellow—SDSS area; blue—2dFGRS area; magenta—area of the Dark Energy Survey; magenta/blue dashed—area covered by theSouth Pole Telescope.
are shown in Figure 2 and listed in Table 1, are:
• One field close to the northern galactic pole withan area of 150 deg2 (henceforth the NGP field)
• Three fields, each of 36 deg2 in area, coincidingwith the fields being surveyed in the Galaxy AndMass Assembly redshift survey (Driver et al. 2009)(henceforth the GAMA fields)
• Two fields with a total area of 250 deg2 close to thesouth galactic pole (henceforth the SGP fields)
The total survey covers 510 deg2. The angular resolu-tion (full-width half maximum) of the observations willbe approximately 8, 12, 18, 25 and 36 arcsec at 70, 110,250, 350 and 500 µm, respectively. The 5σ sensitivi-ties that should be reached in the five bands are 67 mJyat 110 µm, 94 mJy at 170 µm, 45 mJy at 250 µm, 62mJy at 350 µm and 53 mJy at 500 µm. These sensi-tivities have been estimated using the current version ofthe Herschel observation planning package HSpot. Wehave assumed that the sources will be unresolved by thetelescope beam, which will be true for most sources butwill not be true for the closest sources. We have alsoneglected the effects of emission from dust in the Galaxyand of confusion from extragalactic sources. The im-portance of these is still uncertain, but the importanceof confusion should be less than for the deeper Herschelsurveys (Oliver et al. 2009).
3. PREDICTIONS
The number of sources that will be found in any of theHerschel surveys is uncertain because they cover regimesof flux density and wavelength that have never been ex-plored before. There is a particular problem in the wave-length range 200 < λ < 500 µm because no survey, un-til the very recent survey with the balloon-borne tele-scope BLAST (Devlin et al. 2009), has been carried outat these wavelengths. Models based on surveys at shorter
wavelengths, such as IRAS, are likely to underestimatethe number of sources in the submillimetre band becausethese surveys miss the cold dust that radiates stronglyat the longer wavelengths (Dunne & Eales 2001).
We have used two models to predict the proper-ties of the sources that will be found in the H-ATLAS. First, the model of Lagache and collaborators(Lagache et al. 2003; Lagache et al. 2004) is an empir-ical evolution model in which an analytical form is as-sumed for the evolution, and the parameters of themodel are adjusted to fit the observational data in thefar-infrared and submillimetre wavebands, in particu-lar the source counts at 24, 70, 160 and 850 µm andthe spectrum of the cosmic background radiation. Sec-ond, we have developed a new empirical evolution modelbased on the SCUBA Local Universe and Galaxy Survey(Dunne et al. 2000; Vlahakis et al. 2005). Both modelsgive adequate agreement with the results of the BLASTsurvey (Dye et al. 2009), although the comparison be-tween the results and the models is still at a preliminarystage because of the large amount of source confusion inthe BLAST survey (Eales et al. 2009). We now describethe new model in more detail.
The model is based on the sample of 104 galaxies ob-served by Dunne et al. (2000) with the SCUBA sub-millimetre camera as part of the SCUBA Local Uni-verse and Galaxy Survey (SLUGS). These galaxies forma statistically-complete sample above a flux limit at 60µm of 5.24 Jy (Dunne et al. 2000). All of these galaxieswere detected at 850 µm and many at 450 µm. Dunneand Eales (2001) present a simple two-component dustmodel that fits the 60, 100, 450 and 850 µm flux mea-surements. For the galaxies without measurements at450 µm, it is possible to determine the parameters ofthe model by making the additional assumption that thetemperature of the cold dust component is 20 K, whichis the average of the estimates for the galaxies that dohave complete flux measurements. The SLUGS sample isstill the only large sample of galaxies for which there areempirical spectral energy distributions that extend from
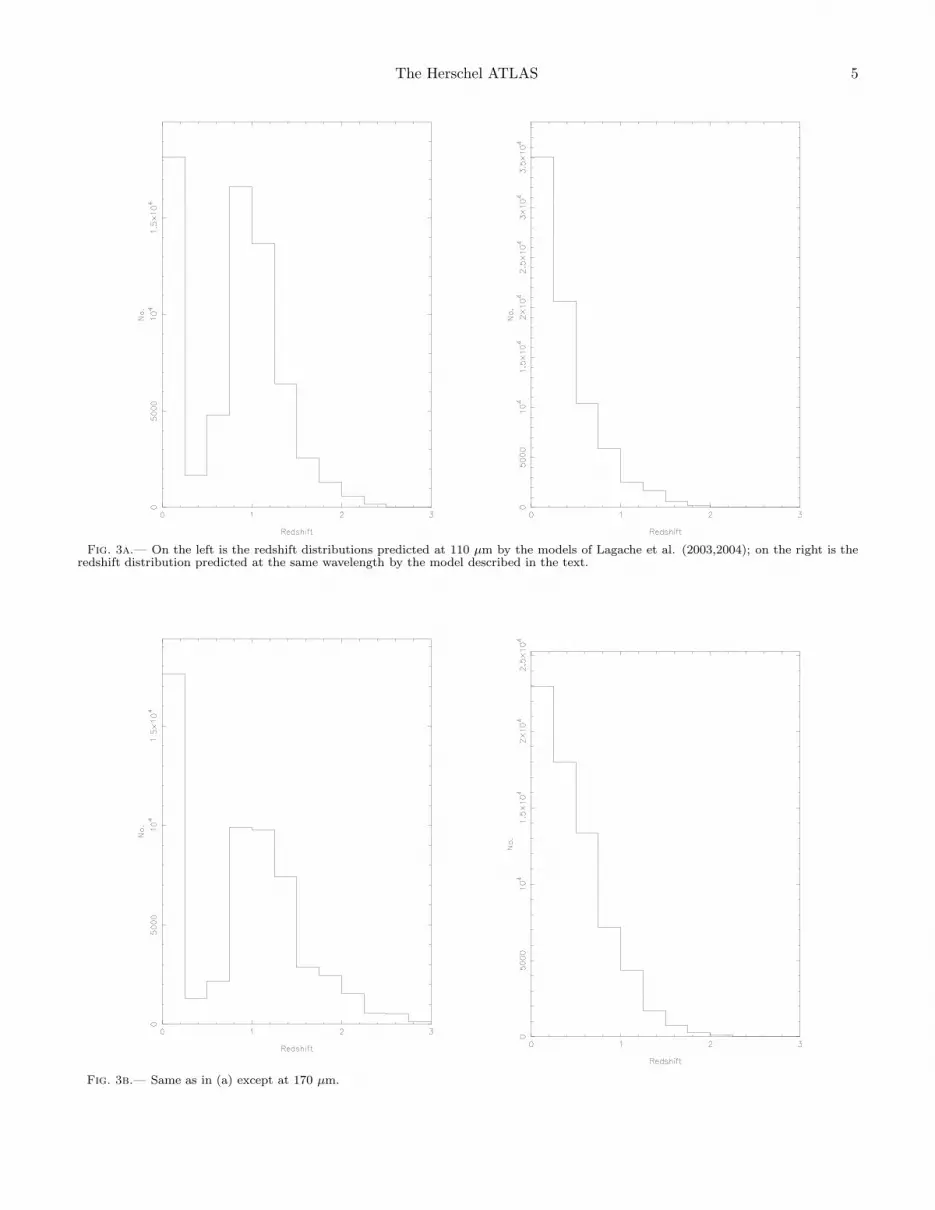
The Herschel ATLAS 5
Fig. 3a.— On the left is the redshift distributions predicted at 110 µm by the models of Lagache et al. (2003,2004); on the right is theredshift distribution predicted at the same wavelength by the model described in the text.
Fig. 3b.— Same as in (a) except at 170 µm.
6 Eales et al.
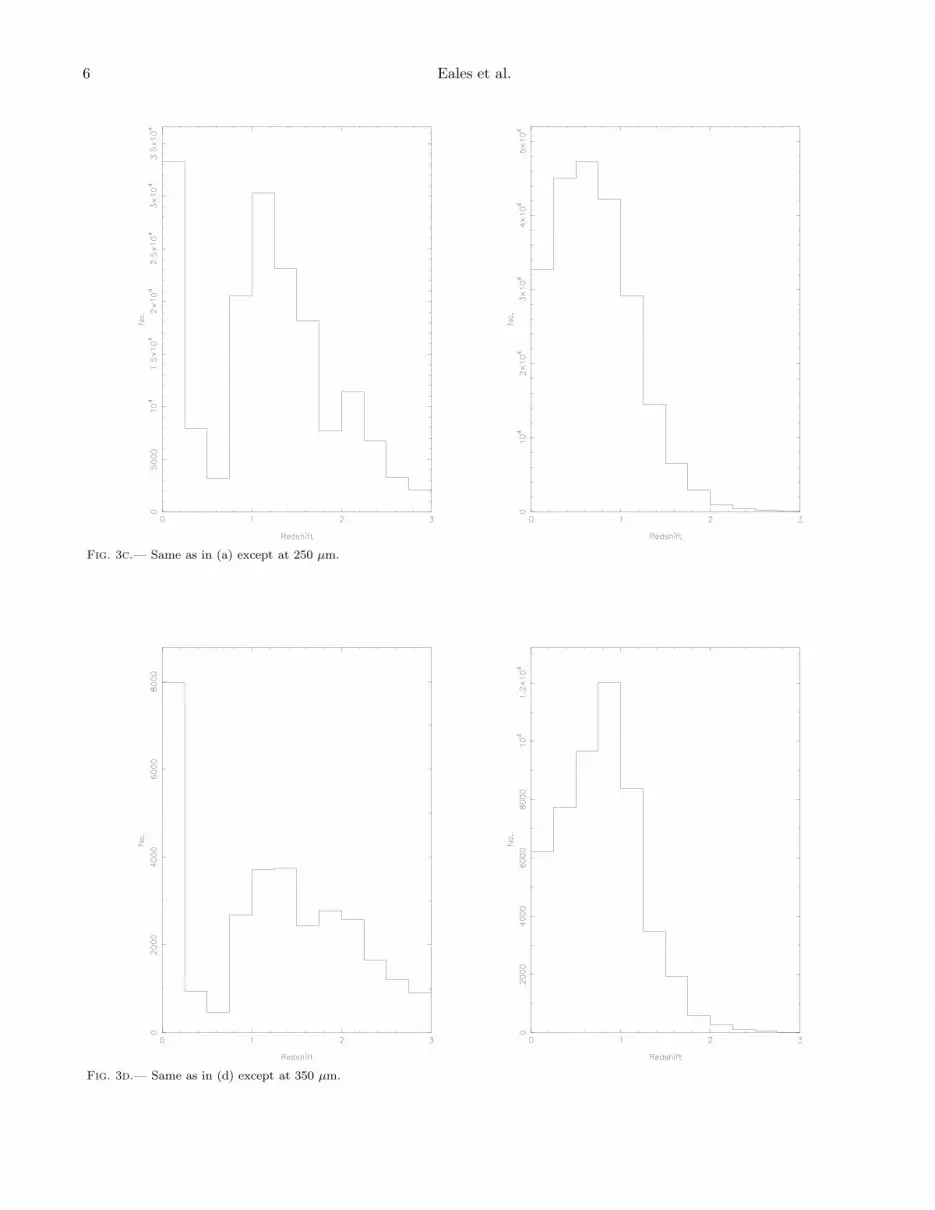
Fig. 3c.— Same as in (a) except at 250 µm.
Fig. 3d.— Same as in (d) except at 350 µm.
The Herschel ATLAS 7
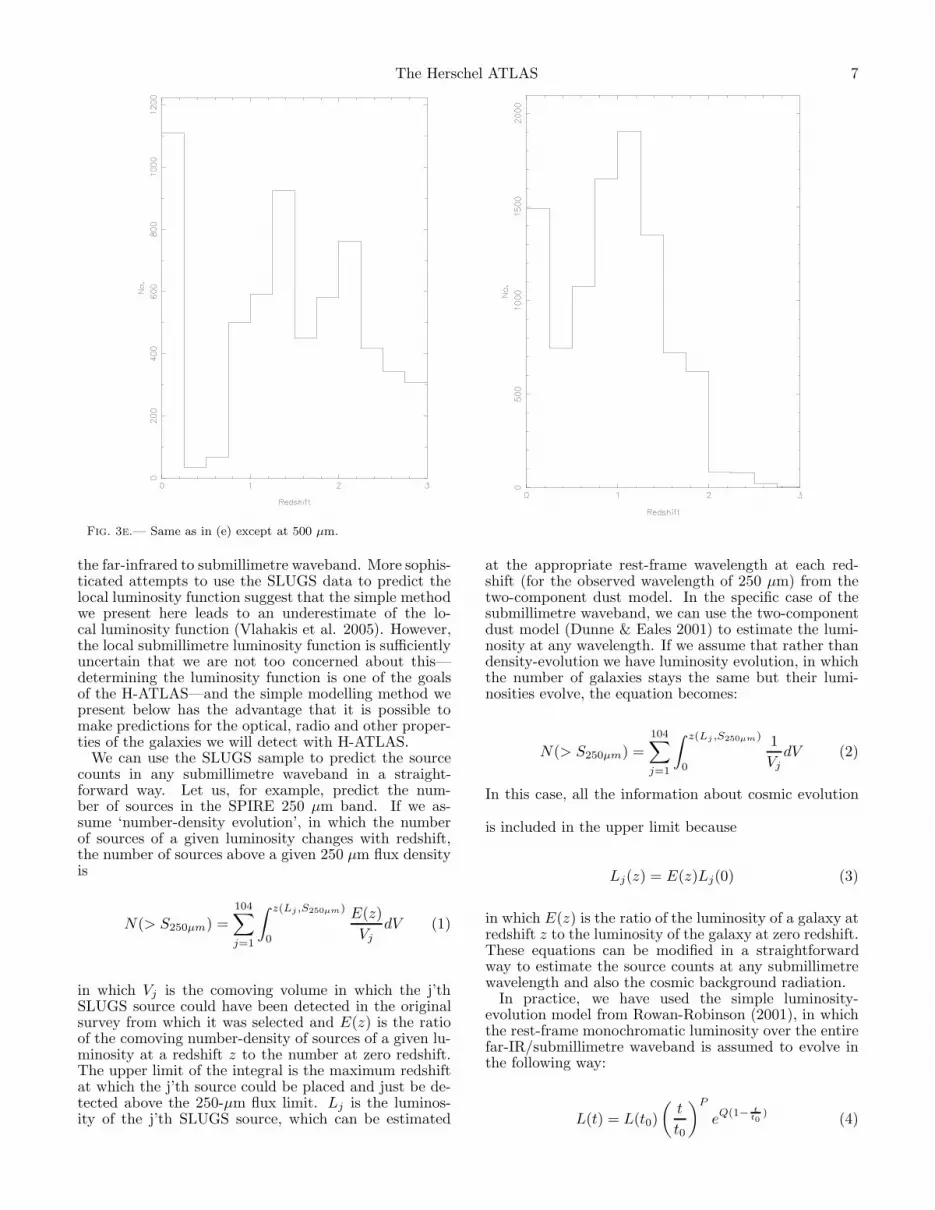
Fig. 3e.— Same as in (e) except at 500 µm.
the far-infrared to submillimetre waveband. More sophis-ticated attempts to use the SLUGS data to predict thelocal luminosity function suggest that the simple methodwe present here leads to an underestimate of the lo-cal luminosity function (Vlahakis et al. 2005). However,the local submillimetre luminosity function is sufficientlyuncertain that we are not too concerned about this—determining the luminosity function is one of the goalsof the H-ATLAS—and the simple modelling method wepresent below has the advantage that it is possible tomake predictions for the optical, radio and other proper-ties of the galaxies we will detect with H-ATLAS.
We can use the SLUGS sample to predict the sourcecounts in any submillimetre waveband in a straight-forward way. Let us, for example, predict the num-ber of sources in the SPIRE 250 µm band. If we as-sume ‘number-density evolution’, in which the numberof sources of a given luminosity changes with redshift,the number of sources above a given 250 µm flux densityis
N(> S250µm) =
104∑
j=1
∫ z(Lj ,S250µm)
0
E(z)
Vj
dV (1)
in which Vj is the comoving volume in which the j’thSLUGS source could have been detected in the originalsurvey from which it was selected and E(z) is the ratioof the comoving number-density of sources of a given lu-minosity at a redshift z to the number at zero redshift.The upper limit of the integral is the maximum redshiftat which the j’th source could be placed and just be de-tected above the 250-µm flux limit. Lj is the luminos-ity of the j’th SLUGS source, which can be estimated
at the appropriate rest-frame wavelength at each red-shift (for the observed wavelength of 250 µm) from thetwo-component dust model. In the specific case of thesubmillimetre waveband, we can use the two-componentdust model (Dunne & Eales 2001) to estimate the lumi-nosity at any wavelength. If we assume that rather thandensity-evolution we have luminosity evolution, in whichthe number of galaxies stays the same but their lumi-nosities evolve, the equation becomes:
N(> S250µm) =
104∑
j=1
∫ z(Lj ,S250µm)
0
1
Vj
dV (2)
In this case, all the information about cosmic evolution
is included in the upper limit because
Lj(z) = E(z)Lj(0) (3)
in which E(z) is the ratio of the luminosity of a galaxy atredshift z to the luminosity of the galaxy at zero redshift.These equations can be modified in a straightforwardway to estimate the source counts at any submillimetrewavelength and also the cosmic background radiation.
In practice, we have used the simple luminosity-evolution model from Rowan-Robinson (2001), in whichthe rest-frame monochromatic luminosity over the entirefar-IR/submillimetre waveband is assumed to evolve inthe following way:
L(t) = L(t0)
(
t
t0
)P
eQ(1− t
t0)
(4)
8 Eales et al.
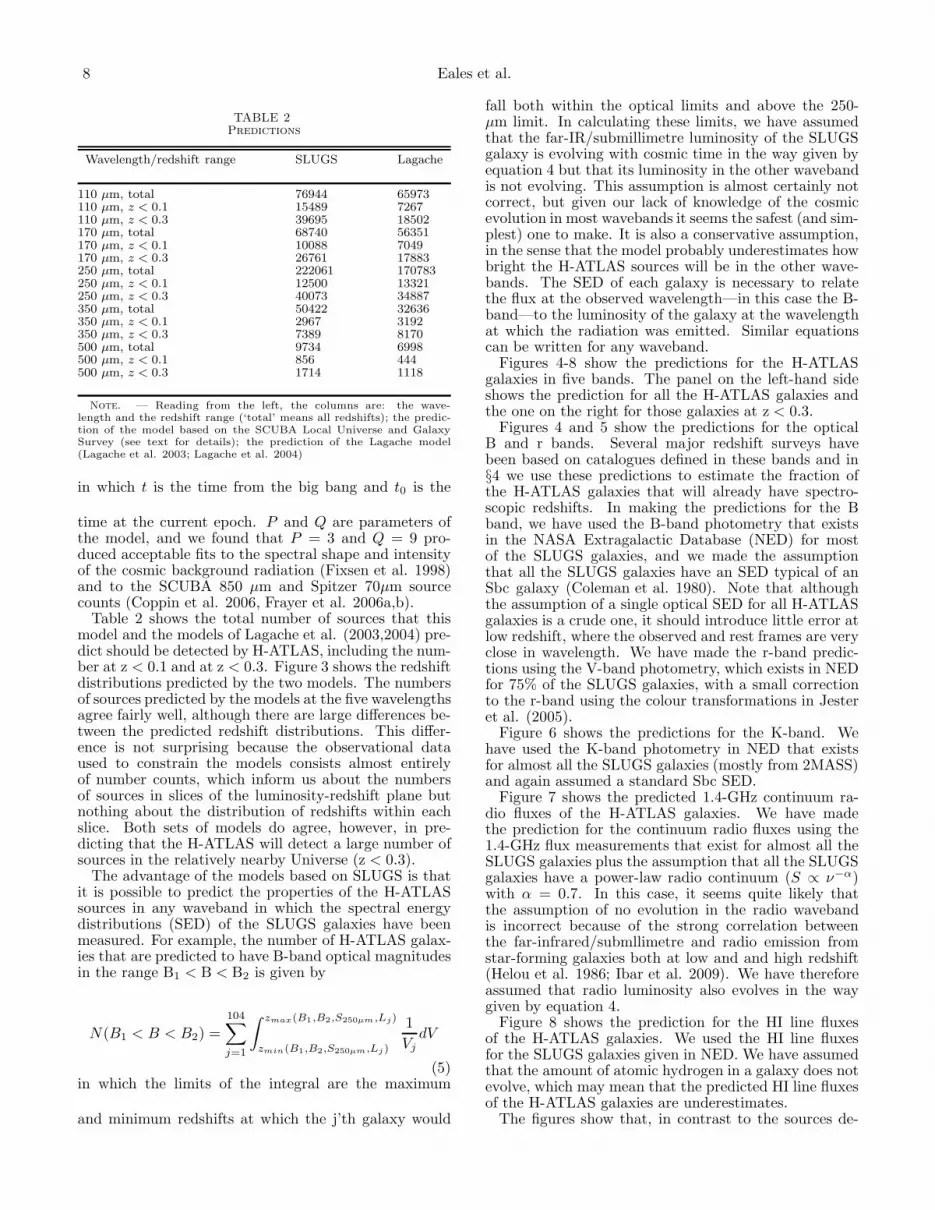
TABLE 2Predictions
Wavelength/redshift range SLUGS Lagache
110 µm, total 76944 65973110 µm, z < 0.1 15489 7267110 µm, z < 0.3 39695 18502170 µm, total 68740 56351170 µm, z < 0.1 10088 7049170 µm, z < 0.3 26761 17883250 µm, total 222061 170783250 µm, z < 0.1 12500 13321250 µm, z < 0.3 40073 34887350 µm, total 50422 32636350 µm, z < 0.1 2967 3192350 µm, z < 0.3 7389 8170500 µm, total 9734 6998500 µm, z < 0.1 856 444500 µm, z < 0.3 1714 1118
Note. — Reading from the left, the columns are: the wave-length and the redshift range (‘total’ means all redshifts); the predic-tion of the model based on the SCUBA Local Universe and GalaxySurvey (see text for details); the prediction of the Lagache model(Lagache et al. 2003; Lagache et al. 2004)
in which t is the time from the big bang and t0 is the
time at the current epoch. P and Q are parameters ofthe model, and we found that P = 3 and Q = 9 pro-duced acceptable fits to the spectral shape and intensityof the cosmic background radiation (Fixsen et al. 1998)and to the SCUBA 850 µm and Spitzer 70µm sourcecounts (Coppin et al. 2006, Frayer et al. 2006a,b).
Table 2 shows the total number of sources that thismodel and the models of Lagache et al. (2003,2004) pre-dict should be detected by H-ATLAS, including the num-ber at z < 0.1 and at z < 0.3. Figure 3 shows the redshiftdistributions predicted by the two models. The numbersof sources predicted by the models at the five wavelengthsagree fairly well, although there are large differences be-tween the predicted redshift distributions. This differ-ence is not surprising because the observational dataused to constrain the models consists almost entirelyof number counts, which inform us about the numbersof sources in slices of the luminosity-redshift plane butnothing about the distribution of redshifts within eachslice. Both sets of models do agree, however, in pre-dicting that the H-ATLAS will detect a large number ofsources in the relatively nearby Universe (z < 0.3).
The advantage of the models based on SLUGS is thatit is possible to predict the properties of the H-ATLASsources in any waveband in which the spectral energydistributions (SED) of the SLUGS galaxies have beenmeasured. For example, the number of H-ATLAS galax-ies that are predicted to have B-band optical magnitudesin the range B1 < B < B2 is given by
N(B1 < B < B2) =
104∑
j=1
∫ zmax(B1,B2,S250µm,Lj)
zmin(B1,B2,S250µm,Lj)
1
Vj
dV
(5)in which the limits of the integral are the maximum
and minimum redshifts at which the j’th galaxy would
fall both within the optical limits and above the 250-µm limit. In calculating these limits, we have assumedthat the far-IR/submillimetre luminosity of the SLUGSgalaxy is evolving with cosmic time in the way given byequation 4 but that its luminosity in the other wavebandis not evolving. This assumption is almost certainly notcorrect, but given our lack of knowledge of the cosmicevolution in most wavebands it seems the safest (and sim-plest) one to make. It is also a conservative assumption,in the sense that the model probably underestimates howbright the H-ATLAS sources will be in the other wave-bands. The SED of each galaxy is necessary to relatethe flux at the observed wavelength—in this case the B-band—to the luminosity of the galaxy at the wavelengthat which the radiation was emitted. Similar equationscan be written for any waveband.
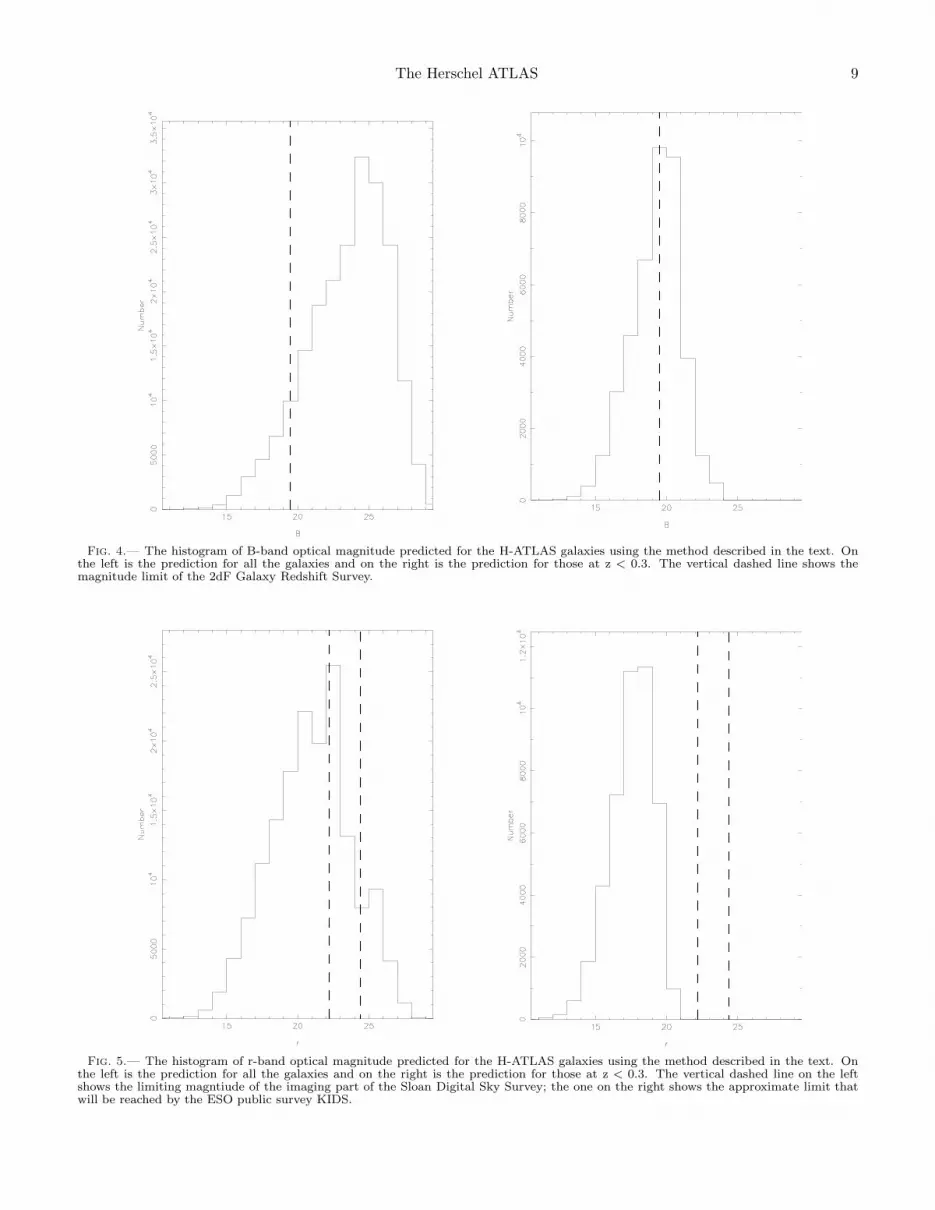
Figures 4-8 show the predictions for the H-ATLASgalaxies in five bands. The panel on the left-hand sideshows the prediction for all the H-ATLAS galaxies andthe one on the right for those galaxies at z < 0.3.
Figures 4 and 5 show the predictions for the opticalB and r bands. Several major redshift surveys havebeen based on catalogues defined in these bands and in§4 we use these predictions to estimate the fraction ofthe H-ATLAS galaxies that will already have spectro-scopic redshifts. In making the predictions for the Bband, we have used the B-band photometry that existsin the NASA Extragalactic Database (NED) for mostof the SLUGS galaxies, and we made the assumptionthat all the SLUGS galaxies have an SED typical of anSbc galaxy (Coleman et al. 1980). Note that althoughthe assumption of a single optical SED for all H-ATLASgalaxies is a crude one, it should introduce little error atlow redshift, where the observed and rest frames are veryclose in wavelength. We have made the r-band predic-tions using the V-band photometry, which exists in NEDfor 75% of the SLUGS galaxies, with a small correctionto the r-band using the colour transformations in Jesteret al. (2005).
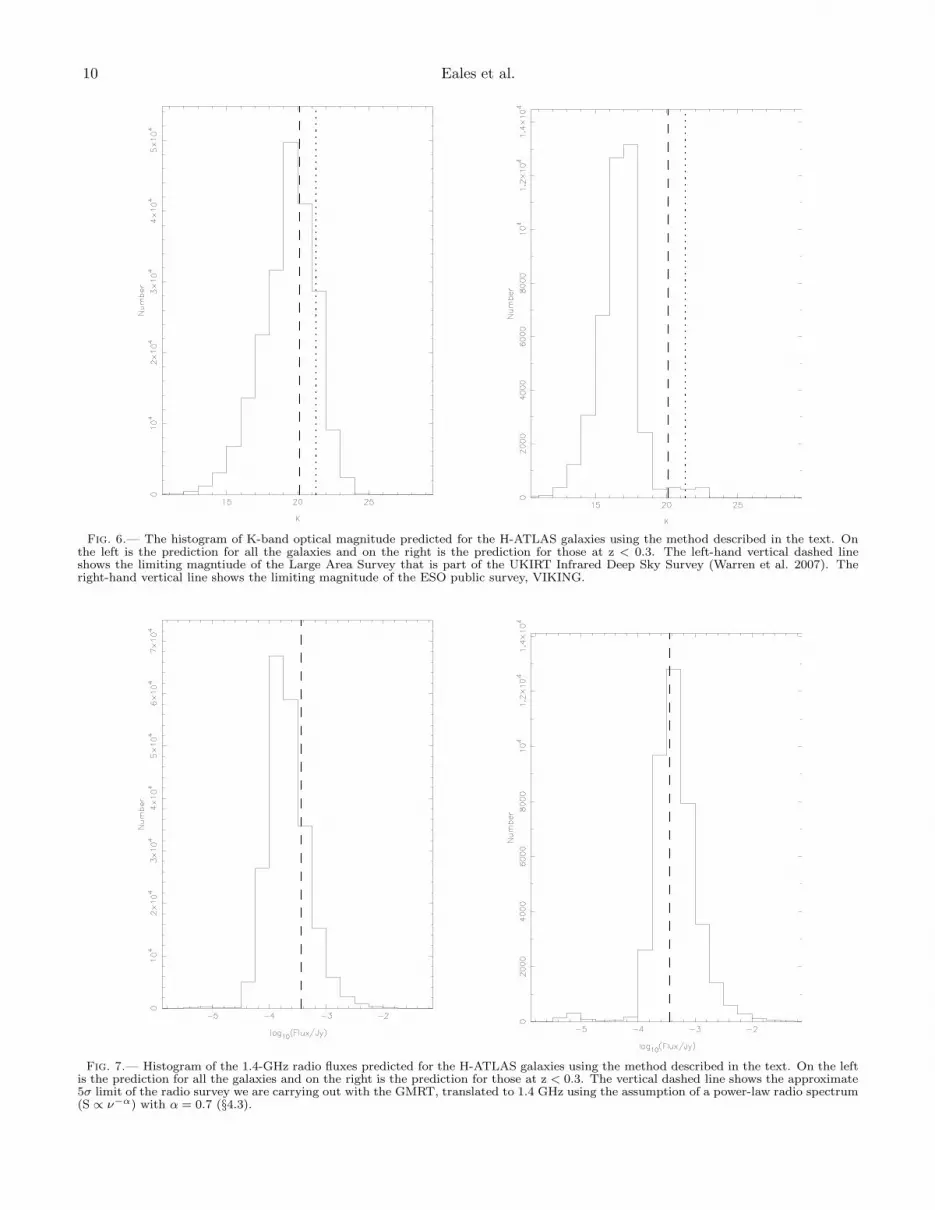
Figure 6 shows the predictions for the K-band. Wehave used the K-band photometry in NED that existsfor almost all the SLUGS galaxies (mostly from 2MASS)and again assumed a standard Sbc SED.
Figure 7 shows the predicted 1.4-GHz continuum ra-dio fluxes of the H-ATLAS galaxies. We have madethe prediction for the continuum radio fluxes using the1.4-GHz flux measurements that exist for almost all theSLUGS galaxies plus the assumption that all the SLUGSgalaxies have a power-law radio continuum (S ∝ ν−α)with α = 0.7. In this case, it seems quite likely thatthe assumption of no evolution in the radio wavebandis incorrect because of the strong correlation betweenthe far-infrared/submllimetre and radio emission fromstar-forming galaxies both at low and and high redshift(Helou et al. 1986; Ibar et al. 2009). We have thereforeassumed that radio luminosity also evolves in the waygiven by equation 4.
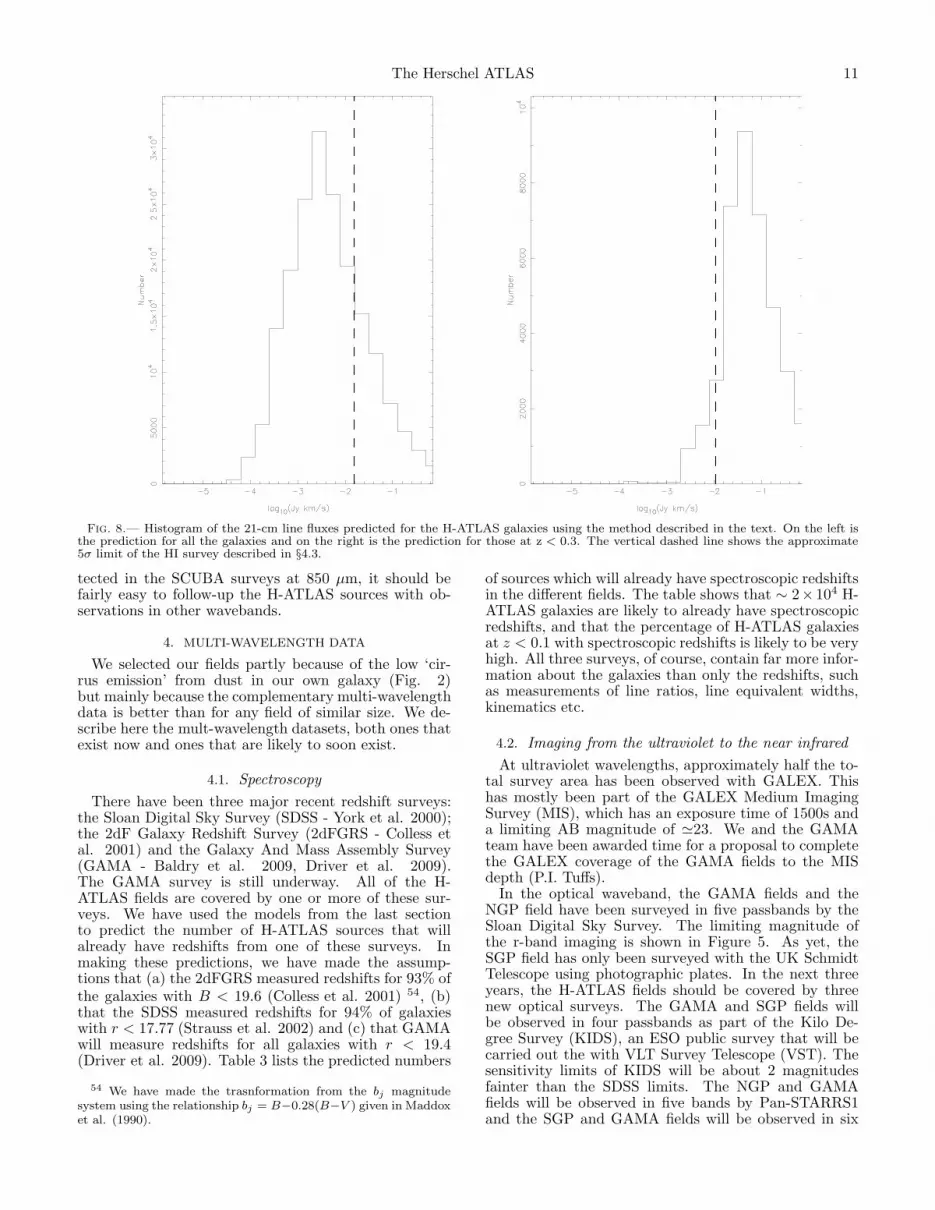
Figure 8 shows the prediction for the HI line fluxesof the H-ATLAS galaxies. We used the HI line fluxesfor the SLUGS galaxies given in NED. We have assumedthat the amount of atomic hydrogen in a galaxy does notevolve, which may mean that the predicted HI line fluxesof the H-ATLAS galaxies are underestimates.
The figures show that, in contrast to the sources de-
The Herschel ATLAS 9
Fig. 4.— The histogram of B-band optical magnitude predicted for the H-ATLAS galaxies using the method described in the text. Onthe left is the prediction for all the galaxies and on the right is the prediction for those at z < 0.3. The vertical dashed line shows themagnitude limit of the 2dF Galaxy Redshift Survey.
Fig. 5.— The histogram of r-band optical magnitude predicted for the H-ATLAS galaxies using the method described in the text. Onthe left is the prediction for all the galaxies and on the right is the prediction for those at z < 0.3. The vertical dashed line on the leftshows the limiting magntiude of the imaging part of the Sloan Digital Sky Survey; the one on the right shows the approximate limit thatwill be reached by the ESO public survey KIDS.
10 Eales et al.
Fig. 6.— The histogram of K-band optical magnitude predicted for the H-ATLAS galaxies using the method described in the text. Onthe left is the prediction for all the galaxies and on the right is the prediction for those at z < 0.3. The left-hand vertical dashed lineshows the limiting magntiude of the Large Area Survey that is part of the UKIRT Infrared Deep Sky Survey (Warren et al. 2007). Theright-hand vertical line shows the limiting magnitude of the ESO public survey, VIKING.
Fig. 7.— Histogram of the 1.4-GHz radio fluxes predicted for the H-ATLAS galaxies using the method described in the text. On the leftis the prediction for all the galaxies and on the right is the prediction for those at z < 0.3. The vertical dashed line shows the approximate5σ limit of the radio survey we are carrying out with the GMRT, translated to 1.4 GHz using the assumption of a power-law radio spectrum(S ∝ ν−α) with α = 0.7 (§4.3).
The Herschel ATLAS 11
Fig. 8.— Histogram of the 21-cm line fluxes predicted for the H-ATLAS galaxies using the method described in the text. On the left isthe prediction for all the galaxies and on the right is the prediction for those at z < 0.3. The vertical dashed line shows the approximate5σ limit of the HI survey described in §4.3.
tected in the SCUBA surveys at 850 µm, it should befairly easy to follow-up the H-ATLAS sources with ob-servations in other wavebands.
4. MULTI-WAVELENGTH DATA
We selected our fields partly because of the low ‘cir-rus emission’ from dust in our own galaxy (Fig. 2)but mainly because the complementary multi-wavelengthdata is better than for any field of similar size. We de-scribe here the mult-wavelength datasets, both ones thatexist now and ones that are likely to soon exist.
4.1. Spectroscopy
There have been three major recent redshift surveys:the Sloan Digital Sky Survey (SDSS - York et al. 2000);the 2dF Galaxy Redshift Survey (2dFGRS - Colless etal. 2001) and the Galaxy And Mass Assembly Survey(GAMA - Baldry et al. 2009, Driver et al. 2009).The GAMA survey is still underway. All of the H-ATLAS fields are covered by one or more of these sur-veys. We have used the models from the last sectionto predict the number of H-ATLAS sources that willalready have redshifts from one of these surveys. Inmaking these predictions, we have made the assump-tions that (a) the 2dFGRS measured redshifts for 93% ofthe galaxies with B < 19.6 (Colless et al. 2001) 54, (b)that the SDSS measured redshifts for 94% of galaxieswith r < 17.77 (Strauss et al. 2002) and (c) that GAMAwill measure redshifts for all galaxies with r < 19.4(Driver et al. 2009). Table 3 lists the predicted numbers
54 We have made the trasnformation from the bj magnitudesystem using the relationship bj = B−0.28(B−V ) given in Maddoxet al. (1990).
of sources which will already have spectroscopic redshiftsin the different fields. The table shows that ∼ 2×10⁴ H-ATLAS galaxies are likely to already have spectroscopicredshifts, and that the percentage of H-ATLAS galaxiesat z < 0.1 with spectroscopic redshifts is likely to be veryhigh. All three surveys, of course, contain far more infor-mation about the galaxies than only the redshifts, suchas measurements of line ratios, line equivalent widths,kinematics etc.
4.2. Imaging from the ultraviolet to the near infrared
At ultraviolet wavelengths, approximately half the to-tal survey area has been observed with GALEX. Thishas mostly been part of the GALEX Medium ImagingSurvey (MIS), which has an exposure time of 1500s anda limiting AB magnitude of ≃23. We and the GAMAteam have been awarded time for a proposal to completethe GALEX coverage of the GAMA fields to the MISdepth (P.I. Tuffs).
In the optical waveband, the GAMA fields and theNGP field have been surveyed in five passbands by theSloan Digital Sky Survey. The limiting magnitude ofthe r-band imaging is shown in Figure 5. As yet, theSGP field has only been surveyed with the UK SchmidtTelescope using photographic plates. In the next threeyears, the H-ATLAS fields should be covered by threenew optical surveys. The GAMA and SGP fields willbe observed in four passbands as part of the Kilo De-gree Survey (KIDS), an ESO public survey that will becarried out the with VLT Survey Telescope (VST). Thesensitivity limits of KIDS will be about 2 magnitudesfainter than the SDSS limits. The NGP and GAMAfields will be observed in five bands by Pan-STARRS1and the SGP and GAMA fields will be observed in six
12 Eales et al.
TABLE 3Redshift Surveys
H-ATLAS field Datasets No. at z < 0.1 No. at z < 0.3
Note. — Reading from the left, the columns are: the H-ATLAS fields; the redshifts surveys covering this field; the predicted number of sourcesat z < 0.1 in this field with the predicted number with spectroscopic redshifts in brackets; the predicted number of sources at z < 0.3 in this fieldwith the predicted number with spectroscopic redshifts in brackets
bands by SkyMapper (Keller et al. 2007). The approx-imate 5σ limits for all the optical surveys are given inTable 4. A little further off in time, the SGP field willbe observed as part of the Dark Energy Survey.
In the near infrared, the GAMA and NGP fieldsare being surveyed in four passbands as part of theLarge Area Survey (LAS), a legacy survey being car-ried out as part of the UKIRT Infrared Deep Sky Sur-vey (Warren et al. 2007). The GAMA and SGP fieldswill soon be observed in five passbands as part of theVISTA Kilo-Degree Infrared Galaxy Survey in the In-frared (VIKING), an ESO public survey that is currentlybeing carried out with the Visible and Infared Telescopefor Astronomy (VISTA). The approximate limits of bothsurveys are given in Table 4 and shown in Figure 6.
4.3. Radio Surveys - continuum and HI
The H-ATLAS fields have been surveyed at 1.4 GHzas part of the NRAO VLA Sky Survey. This surveyis not sensitive enough, however, to detect a significantpercentage of the H-ATLAS sources. We are thereforecurrently completing a radio survey (P.I. Jarvis) of theGAMA fields at 325 MHz with the Giant Metre-waveRadio Telescope (GMRT), which will reach an approxi-mate 5σ sensitivity of 1 mJy. The limit of this survey isshown in Figure 7. The NGP field is also high on the listof targets for an early survey with the Low FrequencyArray for Astronomy (LOFAR).
There is currently no HI survey of any of the H-ATLASfields that could yield HI measurements of a significantfraction of the H-ATLAS sources. However, the SGPand GAMA fields are natural targets for the new south-ern radiotelescopes that are being built as prototypes forthe Square Kilometre Array (and for the SKA itself, ofcourse). We have designed a potential HI survey of theSGP field using the parameters given for the AustralianSquare Kilometre Pathfinder Array (ASKAP) by John-ston et al. (2007). We estimate that in one month ofobserving time it should be possible to carry out a sur-vey of the SGP sensitive to galaxies out to z ≃ 1 with anapproximate sensitivity to HI flux of ≃ 10−2 Jy km s−1
(Fig. 8).
4.4. Planck and other telescopes
The Planck Surveyor is surveying the whole sky in ninepassbands, two of which (350 and 550 µm) are the nearlythe same as those that will be used in H-ATLAS. The size(full-width-half-maximum) of the Planck beam is ≃ 10times greater than that of H-ATLAS at the same fre-quency, although the sensitivity in surface brightness is
fairly similar. Therefore, in the common area of the sky(one eightieth of the whole sky), the two surveys willbe complementary, with the H-ATLAS providing high-resolution observations of the sources that will be de-tected by Planck.
The SGP field may also be observed by the South PoleTelescope, a telescope designed to look for high-redshiftclusters using the Sunyaev-Zeldovich effect.
5. THE H-ATLAS SCIENCE PROGRAMME
In this section we describe the six major science pro-grammes planned by the H-ATLAS team. We note thatthese programmes represent only a limited subset of thescientific projects that will be ultimately possible withthe H-ATLAS for two reasons. First, many other projectswill become possible as the surveys of the H-ATLASfields at other wavelengths (§4) are gradually completed.Second, since the wavelength range from 200 to 500 µmis virtually unexplored and since the H-ATLAS will coverone eigthieth of the sky in this waveband, it is possiblethat there will be some unanticipated discoveries.
5.1. The Local Universe
Our models (§4) predict that the H-ATLAS will de-tect ≃40,000 galaxies in the relatively nearby Universe(z < 0.3). Almost all the galaxies detected at z < 0.1and approximately half the galaxies detected at z < 0.3should already have spectroscopic redshifts. Most ofthese galaxies will be unresolved by the H-ATLAS beams.There are ≃120 clusters of Abell richness class 1 orgreater, including the Coma Cluster, in our fields.
Apart from providing the spectroscopic redshifts nec-essary to calculate the intrinsic properties of many ofthe sources (luminosities, dust masses etc.), the com-plementary data will be helpful in other ways. Threeare particularly important. First, the redshift surveyswill allow us to determine the position within the cosmicweb of each Herschel galaxy and to measure the densityof the galaxy’s environment (exactly how to do this bestis debateable—e.g. Balogh et al. 2004). Second, theexistence of catalogues at other wavelengths means thatthe H-ATLAS will contain more information than the in-dividual source detections. By coadding (‘stacking’) theHerschel emission at the positions of objects in differentclasses, we can study the dust and dust-obscured starformation in objects that would be too faint to detect in-dividually (Dole et al. 2006; Dye et al. 2007b). An im-portant example is elliptical galaxies (§1). Third, wewill be able to answer the question of what fraction ofthe optical light from a galaxy is obscured by dust. Op-tical astronomers have struggled with this issue for 50
Note. — Reading from the left, the columns are: the H-ATLAS field; the optical or near-IR survey; the quoted sensitivity limits in AB magnitudes(These are 5σ limits for point sources, except in the case of the SDSS in which the limits represent the 95% detection repeatability for point sources).a The limits are for the planned three-year survey with Pan-STARRS1.b The limits are for the planned six-epoch survey by SkyMapper.
years (Holmberg 1958; Davies and Burstein 1995) withlimited success, largely because optical galaxy catalogueshave large selection effects caused by dust. The impli-cations for extragalactic astronomy are potentially large,with a recent study concluding that the optical luminos-ity function is significantly altered by dust extinction andthat even bulges suffer as much as 2 mag of extinction atcertain inclinations (Driver et al. 2007). The ultraviolet,optical and near-infrared data that exist for some of thefields (§4) will allow us to address this issue by the sim-ple energy-balance technique of comparing the total dustemission to the total unobscured starlight. The only as-sumption in this technique is that the absorption by thedust is isotropic. This is almost certainly untrue but byaveraging over many objects we can largely eliminate theeffects of anisotropy (Driver et al. 2008).
We give the following four projects as examples:
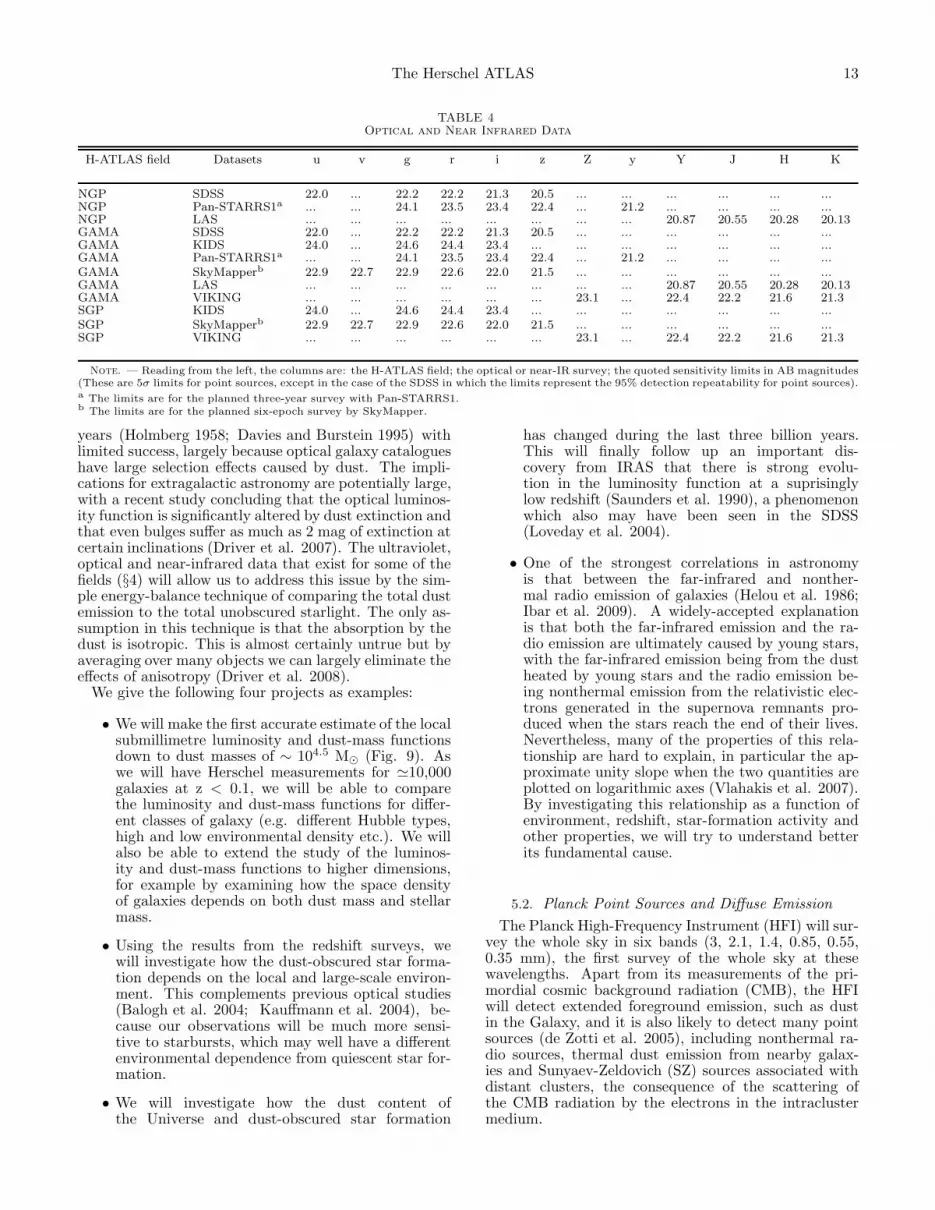
• We will make the first accurate estimate of the localsubmillimetre luminosity and dust-mass functionsdown to dust masses of ∼ 104.5 M⊙ (Fig. 9). Aswe will have Herschel measurements for ≃10,000galaxies at z < 0.1, we will be able to comparethe luminosity and dust-mass functions for differ-ent classes of galaxy (e.g. different Hubble types,high and low environmental density etc.). We willalso be able to extend the study of the luminos-ity and dust-mass functions to higher dimensions,for example by examining how the space densityof galaxies depends on both dust mass and stellarmass.
• Using the results from the redshift surveys, wewill investigate how the dust-obscured star forma-tion depends on the local and large-scale environ-ment. This complements previous optical studies(Balogh et al. 2004; Kauffmann et al. 2004), be-cause our observations will be much more sensi-tive to starbursts, which may well have a differentenvironmental dependence from quiescent star for-mation.
• We will investigate how the dust content ofthe Universe and dust-obscured star formation
has changed during the last three billion years.This will finally follow up an important dis-covery from IRAS that there is strong evolu-tion in the luminosity function at a suprisinglylow redshift (Saunders et al. 1990), a phenomenonwhich also may have been seen in the SDSS(Loveday et al. 2004).
• One of the strongest correlations in astronomyis that between the far-infrared and nonther-mal radio emission of galaxies (Helou et al. 1986;Ibar et al. 2009). A widely-accepted explanationis that both the far-infrared emission and the ra-dio emission are ultimately caused by young stars,with the far-infrared emission being from the dustheated by young stars and the radio emission be-ing nonthermal emission from the relativistic elec-trons generated in the supernova remnants pro-duced when the stars reach the end of their lives.Nevertheless, many of the properties of this rela-tionship are hard to explain, in particular the ap-proximate unity slope when the two quantities areplotted on logarithmic axes (Vlahakis et al. 2007).By investigating this relationship as a function ofenvironment, redshift, star-formation activity andother properties, we will try to understand betterits fundamental cause.
5.2. Planck Point Sources and Diffuse Emission
The Planck High-Frequency Instrument (HFI) will sur-vey the whole sky in six bands (3, 2.1, 1.4, 0.85, 0.55,0.35 mm), the first survey of the whole sky at thesewavelengths. Apart from its measurements of the pri-mordial cosmic background radiation (CMB), the HFIwill detect extended foreground emission, such as dustin the Galaxy, and it is also likely to detect many pointsources (de Zotti et al. 2005), including nonthermal ra-dio sources, thermal dust emission from nearby galax-ies and Sunyaev-Zeldovich (SZ) sources associated withdistant clusters, the consequence of the scattering ofthe CMB radiation by the electrons in the intraclustermedium.
14 Eales et al.
Fig. 9.— The triangles and stars show estimates of the dust-mass function (the space-density of galaxies as a function of dust mass) fromVlahakis, Dunne and Eales (2005). The vertical lines along the bottom show our estimates, on the assumption of Poisson statistics, of the±1σ errors on the estimate of the dust-mass function from the H-ATLAS.
The SZ sources detected by Planck are potentially ofgreat importance for cosmologists, because the number-density of clusters as a function of redshift dependscritically on the cosmological model (Bartelmann 2001;Bartelmann and White 2002). It might also be possible,because the spectral shape of the SZ effect depends onthe peculiar motion of the cluster, to measure bulk flowsin the universe (Kashlinsky and Atrio-Barandela 2000),which is another critical test of the cosmologicalparadigm. A major problem, however, is the contami-nation of the SZ effect by thermal emission from dustygalaxies within the large (5-10 arcmin) Planck beam,because there is evidence that even at moderate red-shift the combined emission from dust in cluster galax-ies is comparable to the SZ effect in the 0.85-mm band,and much greater in the two shorter wavelength bands(Zemcov 2007). There is zero SZ effect at 1.4 mm, whichleaves only the two long-wavelength bands with little con-tribution from dusty galaxies, but as these also have theworst angular resolution there is the additional problemof confusion with nonthermal radio sources.
The H-ATLAS will survey one eightieth of the sky inthe two Planck bands with the highest frequencies, butwith much better resolution. The sensitivity to extendedregions of low surface brightness of the two surveys islikely to be similar. The combination of the two surveyswill make possible several joint projects:
• The effects of confusion on the Planck point sourcecatalogue are likely to be large, particularly in thehighest frequency channels. These include Edding-ton bias (Eddington 1940), which can lead to bothoverestimates of the fluxes of the sources and spu-rious detections, and a large and uncertain effecton the positions of the sources. The H-ATLAS willprovide a sample of sources with accurately knownpositions and fluxes, which can then be checked
against the Planck point-source catalogue for thesame area of sky for the two highest frequencychannels. This comparison will provide an estimateof the correction factor for the Planck fluxes, anestimate of the fraction of the Planck sources thatare spurious, and measurements of the positionalerrors of the Planck sources.
• Some of the Planck science goals, such as the detec-tion of the anisotropies in the cosmic infrared back-ground (Lagache et al. 2003; Lagache et al. 2004),require the successful removal of galactic cirrusemission. The galactic cirrus should be easier todistinguish in the H-ATLAS images because of thebetter angular resolution, and so we will be able totest the success of the Planck component separa-tion techniques.
• The combination of the high-resolution images pro-vided by H-ATLAS and the spectral energy distri-butions of the Planck sources should make it possi-ble to determine unambiguously the nature of eachsource in the overlap region between the two sur-veys. The detailed information provided by theH-ATLAS for the Planck sources in this region willmake it possible to develop better statistical meth-ods based on their spectral energy distributions fordetermining the nature of the Planck sources in theregion not covered by H-ATLAS.
• In the overlap region between the two surveys, theH-ATLAS will make it possible to determine thecontribution of dusty galaxies to each SZ sourceand then subtract these galaxies’ emission from theSZ signal. The detailed information in the over-lap region will also provide statistical informationabout the average level of contamination for thePlanck SZ sources not covered by H-ATLAS.
The Herschel ATLAS 15
5.3. The H-ATLAS Lens Sample
In principle, gravitational lensing is a powerful way ofinvestigating the evolution in the mass profiles of galax-ies, a fundamental test of models of structure formation.In practice, it has proved very hard to assemble the nec-essary large sample of lenses. The most ambitious pro-gramme to date searched for lenses among flat-spectrumradio sources but, after high-resolution radio observa-tions, found only 22 lenses out of 16000 radio sources—asuccess rate of 0.14% (Browne 2003).
Submillimetre surveys are possibly the ideal wayto find lenses. At z ≥ 1, the monochromatic flux densityat the long-wavelength end of the submillimete wave-band depends on luminosity but is approximately inde-pendent of redshift, a consequence of the characteristicspectral energy distribution of dust in galaxies. A resultof this and the strong cosmic evolution in the submilime-tre waveband is that sources in submillimetre surveystend to lie at high redshifts (§1) and are thus likely tohave a large optical depth to lensing. Because of theapproximate independence of flux and redshift, a brightsource in a submillimetre survey must necessarily have ahigh luminosity unless it is is at z ≤ 1. Above a criti-cal flux density, the luminosities of any sources beyondthis redshift must lie above the luminosity at which theluminosity function declines steeply—and so any sourcesabove this flux density are highly likely to be lensed sys-tems.
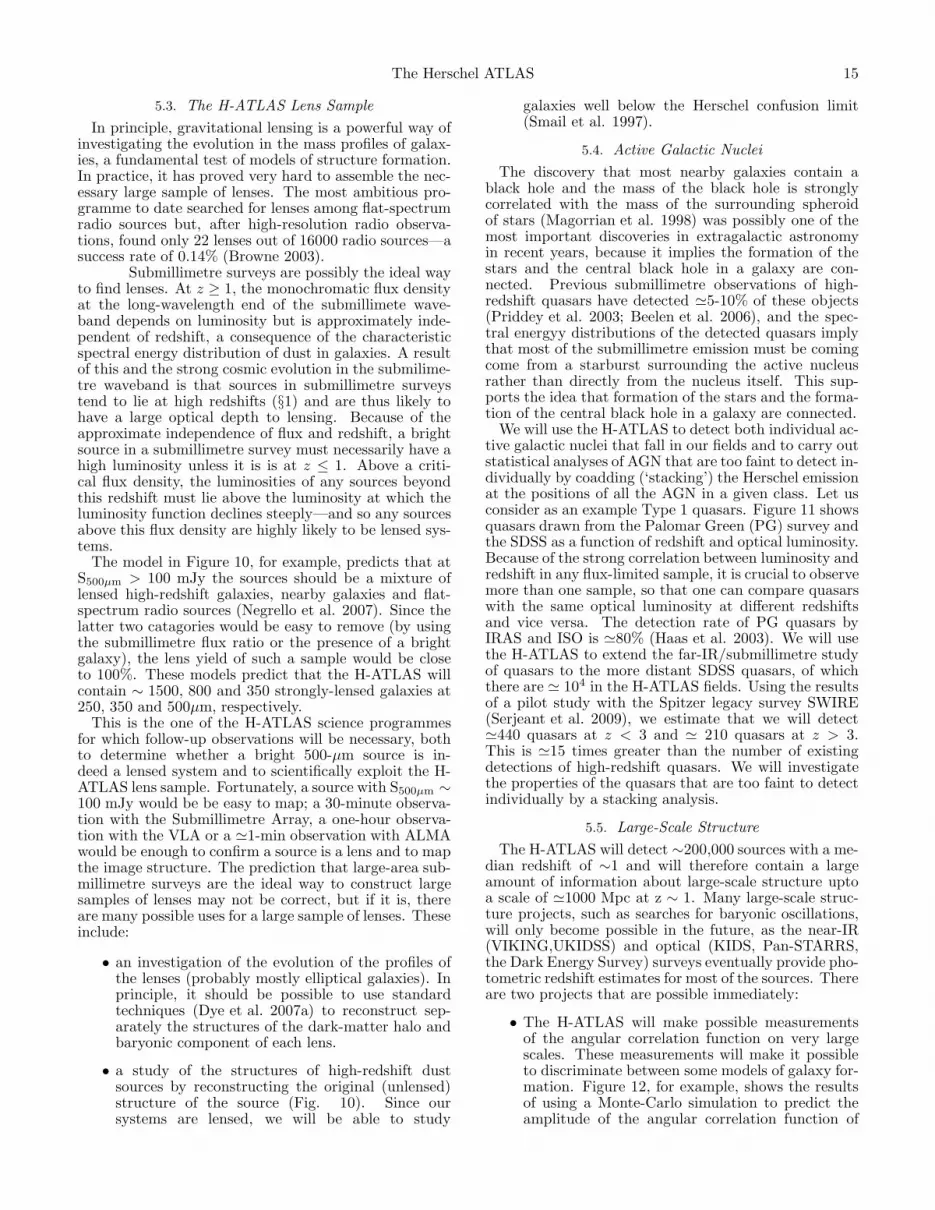
The model in Figure 10, for example, predicts that atS500µm > 100 mJy the sources should be a mixture oflensed high-redshift galaxies, nearby galaxies and flat-spectrum radio sources (Negrello et al. 2007). Since thelatter two catagories would be easy to remove (by usingthe submillimetre flux ratio or the presence of a brightgalaxy), the lens yield of such a sample would be closeto 100%. These models predict that the H-ATLAS willcontain ∼ 1500, 800 and 350 strongly-lensed galaxies at250, 350 and 500µm, respectively.
This is the one of the H-ATLAS science programmesfor which follow-up observations will be necessary, bothto determine whether a bright 500-µm source is in-deed a lensed system and to scientifically exploit the H-ATLAS lens sample. Fortunately, a source with S500µm ∼100 mJy would be be easy to map; a 30-minute observa-tion with the Submillimetre Array, a one-hour observa-tion with the VLA or a ≃1-min observation with ALMAwould be enough to confirm a source is a lens and to mapthe image structure. The prediction that large-area sub-millimetre surveys are the ideal way to construct largesamples of lenses may not be correct, but if it is, thereare many possible uses for a large sample of lenses. Theseinclude:
• an investigation of the evolution of the profiles ofthe lenses (probably mostly elliptical galaxies). Inprinciple, it should be possible to use standardtechniques (Dye et al. 2007a) to reconstruct sep-arately the structures of the dark-matter halo andbaryonic component of each lens.
• a study of the structures of high-redshift dustsources by reconstructing the original (unlensed)structure of the source (Fig. 10). Since oursystems are lensed, we will be able to study
galaxies well below the Herschel confusion limit(Smail et al. 1997).
5.4. Active Galactic Nuclei
The discovery that most nearby galaxies contain ablack hole and the mass of the black hole is stronglycorrelated with the mass of the surrounding spheroidof stars (Magorrian et al. 1998) was possibly one of themost important discoveries in extragalactic astronomyin recent years, because it implies the formation of thestars and the central black hole in a galaxy are con-nected. Previous submillimetre observations of high-redshift quasars have detected ≃5-10% of these objects(Priddey et al. 2003; Beelen et al. 2006), and the spec-tral energyy distributions of the detected quasars implythat most of the submillimetre emission must be comingcome from a starburst surrounding the active nucleusrather than directly from the nucleus itself. This sup-ports the idea that formation of the stars and the forma-tion of the central black hole in a galaxy are connected.
We will use the H-ATLAS to detect both individual ac-tive galactic nuclei that fall in our fields and to carry outstatistical analyses of AGN that are too faint to detect in-dividually by coadding (‘stacking’) the Herschel emissionat the positions of all the AGN in a given class. Let usconsider as an example Type 1 quasars. Figure 11 showsquasars drawn from the Palomar Green (PG) survey andthe SDSS as a function of redshift and optical luminosity.Because of the strong correlation between luminosity andredshift in any flux-limited sample, it is crucial to observemore than one sample, so that one can compare quasarswith the same optical luminosity at different redshiftsand vice versa. The detection rate of PG quasars byIRAS and ISO is ≃80% (Haas et al. 2003). We will usethe H-ATLAS to extend the far-IR/submillimetre studyof quasars to the more distant SDSS quasars, of whichthere are ≃ 104 in the H-ATLAS fields. Using the resultsof a pilot study with the Spitzer legacy survey SWIRE(Serjeant et al. 2009), we estimate that we will detect≃440 quasars at z < 3 and ≃ 210 quasars at z > 3.This is ≃15 times greater than the number of existingdetections of high-redshift quasars. We will investigatethe properties of the quasars that are too faint to detectindividually by a stacking analysis.
5.5. Large-Scale Structure
The H-ATLAS will detect ∼200,000 sources with a me-dian redshift of ∼1 and will therefore contain a largeamount of information about large-scale structure uptoa scale of ≃1000 Mpc at z ∼ 1. Many large-scale struc-ture projects, such as searches for baryonic oscillations,will only become possible in the future, as the near-IR(VIKING,UKIDSS) and optical (KIDS, Pan-STARRS,the Dark Energy Survey) surveys eventually provide pho-tometric redshift estimates for most of the sources. Thereare two projects that are possible immediately:
• The H-ATLAS will make possible measurementsof the angular correlation function on very largescales. These measurements will make it possibleto discriminate between some models of galaxy for-mation. Figure 12, for example, shows the resultsof using a Monte-Carlo simulation to predict theamplitude of the angular correlation function of
16 Eales et al.
Fig. 10.— The left-hand panel shows the predicted number of sources as a function of 500 µm flux density plotted over the results fromBLAST (Negrello et al. 2007). The key to the curves is as follows: red solid—unlensed high-z protospheroids; red dashed—lensed high-zprotospheroids; green—blazars; blue—nearby late-type galaxies. The vertical dashed line shows the approximate limit of H-ATLAS at 500µm. The middle panel shows a simulated image of a strongly lensed 100mJy 500µm H-ATLAS source as observed using the SubmillimetreArray at 870µm in extended mode over a 6h track. The panel on the right shows the reconstructed source obtained by applying thereconstruction method of Dye et al. (2007a) to the simulated ring image. The image caustic of the best fit lens model is over-plotted.
Fig. 11.— The distribution of PG (circle) and SDSS (point)QSOs as a function of redshift and luminosity.
H-ATLAS sources using three alternative modelsof galaxy formation: the hybrid model from VanKampen et al. (2005) and two new models (VanKampen et al. in preparation). The simulationshows that it should be easy to discriminate be-tween these models.
• The individual sources, however, only represent≃10% of the extragalactic background radiationat the Herschel wavelengths and the unresolvedbackground contains a wealth of further informa-tion about the clustering properties of dusty galax-ies. A powerful technique to extract further in-formation is to investigate the clustering proper-ties of the intensity distribution on the maps afterthe high signal-to-noise sources have been removed(Amblard and Cooray 2007; Lagache et al. 2007).The strength of the fluctuations on large angularscales (linear regime) can be used to estimate theaverage mass of the dark matter halos containingthe sources, whereas the strength of the fluctua-tions on small angular scales (non-linear regime)can be used to estimate the halo occupancy distri-bution (Amblard and Cooray 2007).
5.6. Galactic Dust Sources
We will use the H-ATLAS to look for dust associ-ated with stars, especially debris disks and dust around
Fig. 12.— A histogram of the amplitude of the angular corre-lation function (Asky) of H-ATLAS sources for 100 Monte-Carlorealisations for each of three different models of galaxy formation:the hybrid model described by Van Kampen et al. (2005) and twonew models (Van Kampen et al. in preparation).
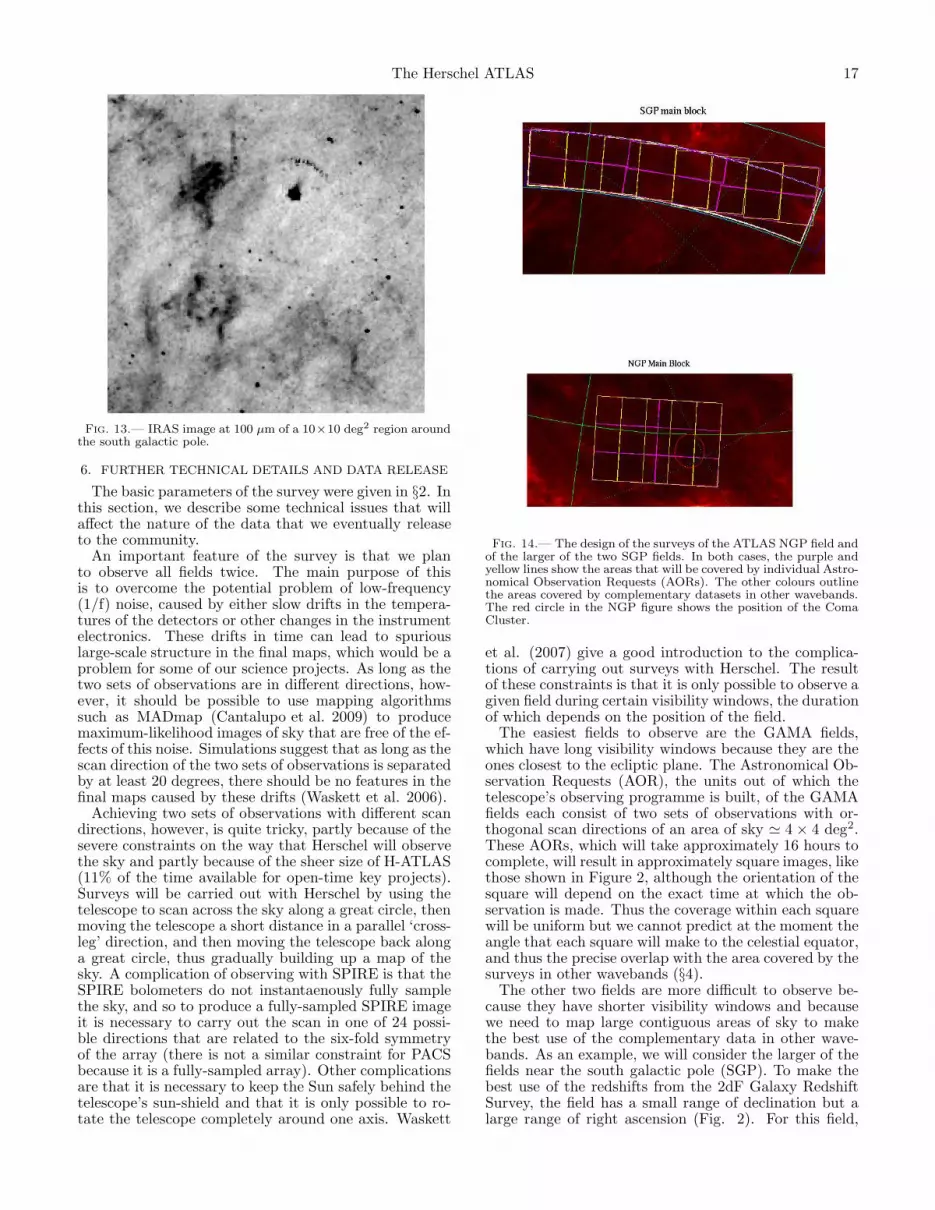
stars on the asymptotic giant branch. We will alsostudy the distribution and spectral properties of dustin the interstellar medium. Although the H-ATLASfields are at high galactic latitudes, in order to mini-mize the emission from dust within the Galaxy, IRASimages show that there is plenty of dust even at thegalactic poles (Figure 13). The H-ATLAS will allowus to study the structure of an interstellar dust on anangular scale ≃10 times smaller than was possible withIRAS (Mivilles-Deschenes et al. 2007) and will be pos-sible with Planck, while still having as good sensitivityto large-scale structure as the two other telescopes. TheH-ATLAS will also detect the cold dust missed by IRAS.
A more speculative idea is to look for prestellar coresand protostars at high latitudes. Since the dust disks ingalaxies are thin, most of the high-latitude dust is within0.5 kpc. Therefore, we will be able to carry out a searchfor prestellar cores and protostars in our fields down tosurprisingly low mass limits. On the assumption of adust temperature of 20 K and a standard gas-to-dustratio, we estimate that we should detect all protostarsand prestellar cores down to a mass of ∼ 0.002 M⊙—wellbelow the brown dwarf limit and in the Jupiter regime.
The Herschel ATLAS 17
Fig. 13.— IRAS image at 100 µm of a 10×10 deg2 region aroundthe south galactic pole.
6. FURTHER TECHNICAL DETAILS AND DATA RELEASE
The basic parameters of the survey were given in §2. Inthis section, we describe some technical issues that willaffect the nature of the data that we eventually releaseto the community.
An important feature of the survey is that we planto observe all fields twice. The main purpose of thisis to overcome the potential problem of low-frequency(1/f) noise, caused by either slow drifts in the tempera-tures of the detectors or other changes in the instrumentelectronics. These drifts in time can lead to spuriouslarge-scale structure in the final maps, which would be aproblem for some of our science projects. As long as thetwo sets of observations are in different directions, how-ever, it should be possible to use mapping algorithmssuch as MADmap (Cantalupo et al. 2009) to producemaximum-likelihood images of sky that are free of the ef-fects of this noise. Simulations suggest that as long as thescan direction of the two sets of observations is separatedby at least 20 degrees, there should be no features in thefinal maps caused by these drifts (Waskett et al. 2006).
Achieving two sets of observations with different scandirections, however, is quite tricky, partly because of thesevere constraints on the way that Herschel will observethe sky and partly because of the sheer size of H-ATLAS(11% of the time available for open-time key projects).Surveys will be carried out with Herschel by using thetelescope to scan across the sky along a great circle, thenmoving the telescope a short distance in a parallel ‘cross-leg’ direction, and then moving the telescope back alonga great circle, thus gradually building up a map of thesky. A complication of observing with SPIRE is that theSPIRE bolometers do not instantaenously fully samplethe sky, and so to produce a fully-sampled SPIRE imageit is necessary to carry out the scan in one of 24 possi-ble directions that are related to the six-fold symmetryof the array (there is not a similar constraint for PACSbecause it is a fully-sampled array). Other complicationsare that it is necessary to keep the Sun safely behind thetelescope’s sun-shield and that it is only possible to ro-tate the telescope completely around one axis. Waskett
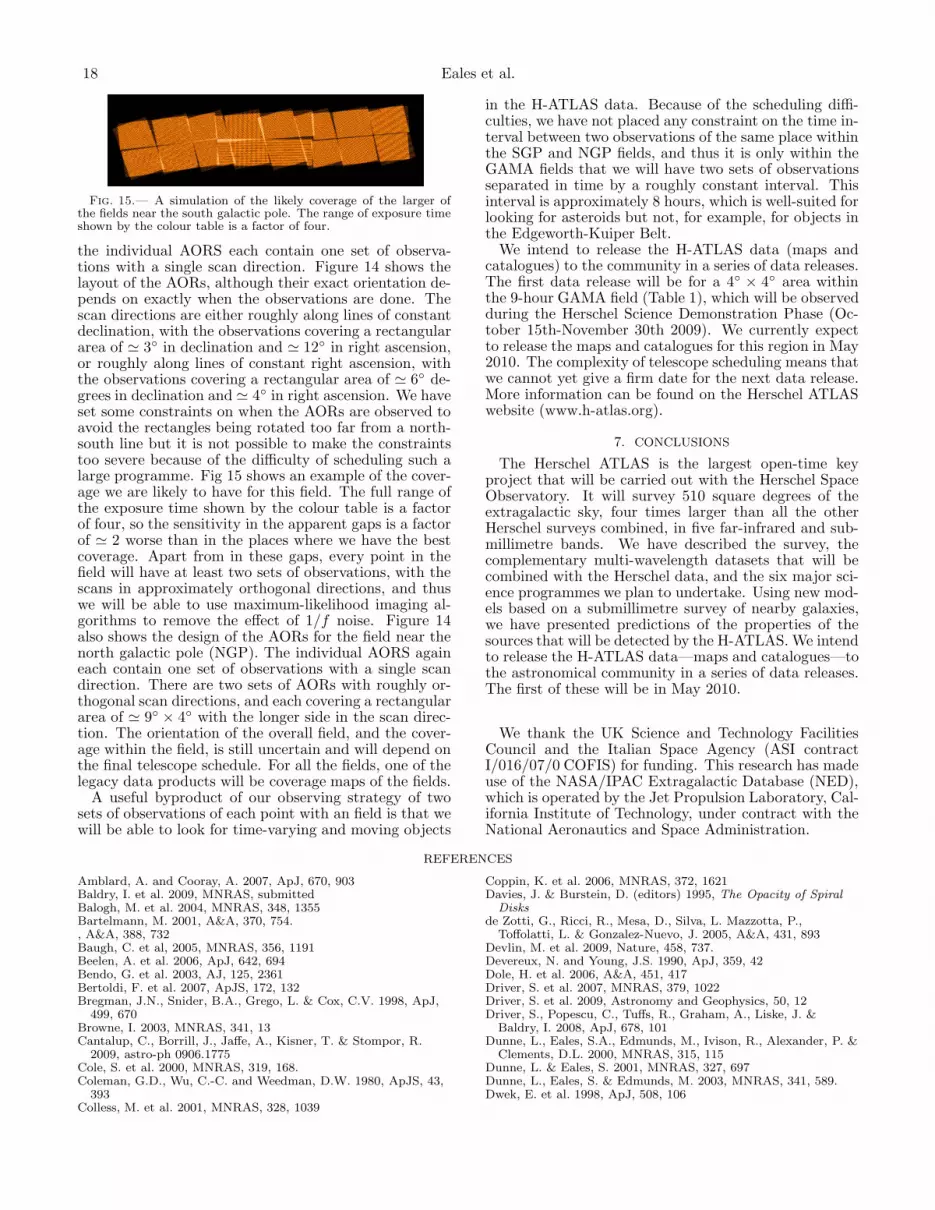
Fig. 14.— The design of the surveys of the ATLAS NGP field andof the larger of the two SGP fields. In both cases, the purple andyellow lines show the areas that will be covered by individual Astro-nomical Observation Requests (AORs). The other colours outlinethe areas covered by complementary datasets in other wavebands.The red circle in the NGP figure shows the position of the ComaCluster.
et al. (2007) give a good introduction to the complica-tions of carrying out surveys with Herschel. The resultof these constraints is that it is only possible to observe agiven field during certain visibility windows, the durationof which depends on the position of the field.
The easiest fields to observe are the GAMA fields,which have long visibility windows because they are theones closest to the ecliptic plane. The Astronomical Ob-servation Requests (AOR), the units out of which thetelescope’s observing programme is built, of the GAMAfields each consist of two sets of observations with or-thogonal scan directions of an area of sky ≃ 4 × 4 deg2.These AORs, which will take approximately 16 hours tocomplete, will result in approximately square images, likethose shown in Figure 2, although the orientation of thesquare will depend on the exact time at which the ob-servation is made. Thus the coverage within each squarewill be uniform but we cannot predict at the moment theangle that each square will make to the celestial equator,and thus the precise overlap with the area covered by thesurveys in other wavebands (§4).
The other two fields are more difficult to observe be-cause they have shorter visibility windows and becausewe need to map large contiguous areas of sky to makethe best use of the complementary data in other wave-bands. As an example, we will consider the larger of thefields near the south galactic pole (SGP). To make thebest use of the redshifts from the 2dF Galaxy RedshiftSurvey, the field has a small range of declination but alarge range of right ascension (Fig. 2). For this field,
18 Eales et al.
Fig. 15.— A simulation of the likely coverage of the larger ofthe fields near the south galactic pole. The range of exposure timeshown by the colour table is a factor of four.
the individual AORS each contain one set of observa-tions with a single scan direction. Figure 14 shows thelayout of the AORs, although their exact orientation de-pends on exactly when the observations are done. Thescan directions are either roughly along lines of constantdeclination, with the observations covering a rectangulararea of ≃ 3 in declination and ≃ 12 in right ascension,or roughly along lines of constant right ascension, withthe observations covering a rectangular area of ≃ 6 de-grees in declination and ≃ 4 in right ascension. We haveset some constraints on when the AORs are observed toavoid the rectangles being rotated too far from a north-south line but it is not possible to make the constraintstoo severe because of the difficulty of scheduling such alarge programme. Fig 15 shows an example of the cover-age we are likely to have for this field. The full range ofthe exposure time shown by the colour table is a factorof four, so the sensitivity in the apparent gaps is a factorof ≃ 2 worse than in the places where we have the bestcoverage. Apart from in these gaps, every point in thefield will have at least two sets of observations, with thescans in approximately orthogonal directions, and thuswe will be able to use maximum-likelihood imaging al-gorithms to remove the effect of 1/f noise. Figure 14also shows the design of the AORs for the field near thenorth galactic pole (NGP). The individual AORS againeach contain one set of observations with a single scandirection. There are two sets of AORs with roughly or-thogonal scan directions, and each covering a rectangulararea of ≃ 9 × 4 with the longer side in the scan direc-tion. The orientation of the overall field, and the cover-age within the field, is still uncertain and will depend onthe final telescope schedule. For all the fields, one of thelegacy data products will be coverage maps of the fields.
A useful byproduct of our observing strategy of twosets of observations of each point with an field is that wewill be able to look for time-varying and moving objects
in the H-ATLAS data. Because of the scheduling diffi-culties, we have not placed any constraint on the time in-terval between two observations of the same place withinthe SGP and NGP fields, and thus it is only within theGAMA fields that we will have two sets of observationsseparated in time by a roughly constant interval. Thisinterval is approximately 8 hours, which is well-suited forlooking for asteroids but not, for example, for objects inthe Edgeworth-Kuiper Belt.
We intend to release the H-ATLAS data (maps andcatalogues) to the community in a series of data releases.The first data release will be for a 4 × 4 area withinthe 9-hour GAMA field (Table 1), which will be observedduring the Herschel Science Demonstration Phase (Oc-tober 15th-November 30th 2009). We currently expectto release the maps and catalogues for this region in May2010. The complexity of telescope scheduling means thatwe cannot yet give a firm date for the next data release.More information can be found on the Herschel ATLASwebsite (www.h-atlas.org).
7. CONCLUSIONS
The Herschel ATLAS is the largest open-time keyproject that will be carried out with the Herschel SpaceObservatory. It will survey 510 square degrees of theextragalactic sky, four times larger than all the otherHerschel surveys combined, in five far-infrared and sub-millimetre bands. We have described the survey, thecomplementary multi-wavelength datasets that will becombined with the Herschel data, and the six major sci-ence programmes we plan to undertake. Using new mod-els based on a submillimetre survey of nearby galaxies,we have presented predictions of the properties of thesources that will be detected by the H-ATLAS. We intendto release the H-ATLAS data—maps and catalogues—tothe astronomical community in a series of data releases.The first of these will be in May 2010.
We thank the UK Science and Technology FacilitiesCouncil and the Italian Space Agency (ASI contractI/016/07/0 COFIS) for funding. This research has madeuse of the NASA/IPAC Extragalactic Database (NED),which is operated by the Jet Propulsion Laboratory, Cal-ifornia Institute of Technology, under contract with theNational Aeronautics and Space Administration.
REFERENCES
Amblard, A. and Cooray, A. 2007, ApJ, 670, 903Baldry, I. et al. 2009, MNRAS, submittedBalogh, M. et al. 2004, MNRAS, 348, 1355Bartelmann, M. 2001, A&A, 370, 754., A&A, 388, 732Baugh, C. et al, 2005, MNRAS, 356, 1191Beelen, A. et al. 2006, ApJ, 642, 694Bendo, G. et al. 2003, AJ, 125, 2361Bertoldi, F. et al. 2007, ApJS, 172, 132Bregman, J.N., Snider, B.A., Grego, L. & Cox, C.V. 1998, ApJ,
499, 670Browne, I. 2003, MNRAS, 341, 13Cantalup, C., Borrill, J., Jaffe, A., Kisner, T. & Stompor, R.
2009, astro-ph 0906.1775Cole, S. et al. 2000, MNRAS, 319, 168.Coleman, G.D., Wu, C.-C. and Weedman, D.W. 1980, ApJS, 43,
393Colless, M. et al. 2001, MNRAS, 328, 1039
Coppin, K. et al. 2006, MNRAS, 372, 1621Davies, J. & Burstein, D. (editors) 1995, The Opacity of Spiral
Disksde Zotti, G., Ricci, R., Mesa, D., Silva, L. Mazzotta, P.,
Toffolatti, L. & Gonzalez-Nuevo, J. 2005, A&A, 431, 893Devlin, M. et al. 2009, Nature, 458, 737.Devereux, N. and Young, J.S. 1990, ApJ, 359, 42Dole, H. et al. 2006, A&A, 451, 417Driver, S. et al. 2007, MNRAS, 379, 1022Driver, S. et al. 2009, Astronomy and Geophysics, 50, 12Driver, S., Popescu, C., Tuffs, R., Graham, A., Liske, J. &
Baldry, I. 2008, ApJ, 678, 101Dunne, L., Eales, S.A., Edmunds, M., Ivison, R., Alexander, P. &
Clements, D.L. 2000, MNRAS, 315, 115Dunne, L. & Eales, S. 2001, MNRAS, 327, 697Dunne, L., Eales, S. & Edmunds, M. 2003, MNRAS, 341, 589.Dwek, E. et al. 1998, ApJ, 508, 106
The Herschel ATLAS 19
Dye, S., Smail, I., Swinbank, A., Ebeling, H. & Edge, A. 2007a,MNRAS, 379, 308
Dye, S. et al. 2007b, MNRAS, 375, 725Dye, S. et al. 2009, ApJ, in pressEales, S.A. et al. 1999, ApJ, 515, 518Eales, S.A. et al. 2009, ApJ, submittedEddington, A. 1940, MNRAS, 100, 354Fixsen, D.J., Dwek, E., Mather, J.C., Bennett, C.L. & Shafer,
Carilli, C.L. 2004, MNRAS, 354, 779.Greve, T.R., Pope, A., Scott, D., Ivison, R.J., Conselice, C.J. &
Bertoldi, F. 2008, MNRAS, in pressGriffin, M. et al. 2007, Advances in Space Research, 40, 612Frayer, D.T. et al. 2006, AJ, 131, 250Frayer, D.T. et al. 2006, ApJ, 647, L9Haas, M. et al. 2003, A&A, 402, 87Heavens, A., Panter, B., Jimenez, R. & Dunlop, J. 2004, Nature,
428, 625.Helou, G., Rowan-Robinson, M. & Helou, G. 1986, ApJ, 298, L7Holmberg, E. 1958, Medd. Lund. Astron. Obs. Ser. 2, 6Hughes, D. et al. 1998, Nature, 394, 241Ibar, E. et al. 2009, MNRAS, 386, 953Jester, S. et al. 2005, AJ, 130, 873Johnstone, S. et al. 2007, PASA, 24, 174Kashlinsky, A, & Atrio-Barandela, F. 2000, ApJ, 536, L67Kauffmann, G. et al. 2003a, MNRAS, 341, 33Kauffmann, G. et al. 2003b, MNRAS, 341, 54Kauffmann, G. et al. 2004, MN, 353, 713Keller, S., Schmidt, B.P. & Bessell, M.S. 2007, Proceedings of the
ESO Calibration Workshop, astroph 0704.1339Lagache, G., Dole, H. & Puget, J.-L. 2003, MNRAS, 338, 555.Lagache, G. et al. 2004, ApJS, 154, 112
Lagache, G. et al. 2007, ApJ, 665, L89Lewis, I. et al. 2002, MNRAS, 334, 673Loveday, J. et al. 2004, MN, 347, 601Magorrian, J. et al. 1998, AJ, 115, 2285Maddox, S., Efstathiou, G. & Sutherland, W. 1990, MNRAS, 246,
433Mivilles-Deschenes, M.-A. et al. 2007, A&A, 459, 595Negrello, M. et al. 2007, MNRAS, 377, 1557Obric, M. et al. 2006, MNRAS, 370, 1677Oliver, S. et al. in preparationPerera, T.A. et al. 2008, MNRAS, submittedPoglitsch, A. et al. 2006, SPIE, 6265, 8Priddey, R. et al. 2003, MNRAS, 339, 1183Saunders, W. et al. 1990, MN, 242, 318Scott, S. et al. 2002, MNRAS, 331, 817Scott, K.S. et al. 2008, MNRAS, 385, 2225Serjeant, S. & Hatziminaoglou, E. 2009, MNRAS, 397, 265Smail, I., Ivison, R. & Blain, A. 1997, ApJ, 490, L5Strauss, M. et al. 2002, AJ, 124, 1810Takeuchi, T.T., Ishii, T.T., Dole, H., Dennefeld, M., Lagache,
G.& Puget, J.-L. 2006, A&A, 448, 525Van Kampen, E. et al. 2005, MNRAS, 359, 469Vlahakis, C., Dunne, L. & Eales, S. 2005, MNRAS, 364, 1253Vlahakis, C., Dunne, L. & Eales, S. 2007, MNRAS, 379, 1042Warren, S. et al. 2007, astroph 0703037.Waskett, T.J., Sibthorpe, B., Griffin, M.J. & Chanial, P.F. 2007,


![Atlas of Islam [language:English]](https://static.documents.page/doc/80x56/631dec503dc6529d5d07b6e7/atlas-of-islam-languageenglish.jpg)


