SUBSIDENCE PREDICTION CAUSED BY THE OIL AND GAS DEVELOPMENT Anton Sroka Institute of Mining Surveying and Geodesy Technische Universität Bergakademie Freiberg/ Germany Email: [email protected]Ryszard Hejmanowski Dept. of Mining Damage and Geoinformatics Faculty of Mining Surveying and Environmental Engineering AGH University of Science and Technology/Cracow/ Poland Email: [email protected]Abstract: Oil and gas development from underground reservoirs disturbs original rock mass balance. The tending of the rock mass to achieve a new, even only temporary balance is manifested in the movements of the ground surface. Movements can affect ground infrastructure like offshore platforms, pipelines and buildings. For increasing the efficiency of the preventive actions a’priori precisely prediction of the subsidence is necessary. By the prediction of surface subsidence changes of pore pressure in time due to exploitation and geometry of the reservoir have to be taken into account. The prediction method based on the influence function of Knothe will be presented in the paper. Some applications according to the oil and natural gas developments will be discussed 1. Introduction Surface subsidence of areas where oil, gas and water are exploited are a serious problem in various parts of the World. In the coastal regions, vertical movements of the surface may result in flooding or generate extra costs for securing the banks. Such problems were encountered, e.g. in the area of Maracaibo Lake in Venezuela (ca. 3.5 m – maximum subsidence), Mexican Gulf, in California (ca. 10 m – maximum subsidence) and in Japan. The subsidence troughs may be huge in size and the damage to the objects standing on them is comparable to those in the mining areas. Considerable deformations of surface usually can be found in the places where thick fluid reservoirs occur and the host rocks have compaction qualities. Surface deformations in the areas of oil and gas exploitation can be efficiently predicted on the basis of methods employing the influence functions. These methods make use of relatively uncomplicated mathematical models and are simple in use. Regarding their high efficiency, these methods are not frequently met in the World’s literature, therefore the Authors decided to discuss the prediction model based on an influence function applicable to fluid mineral reservoirs. 3rd IAG / 12th FIG Symposium, Baden, May 22-24, 2006
Transcript
SUBSIDENCE PREDICTION CAUSED BY THE OIL AND GAS DEVELOPMENT
Anton Sroka Institute of Mining Surveying and Geodesy
Technische Universität Bergakademie Freiberg/ Germany Email: [email protected]
Ryszard Hejmanowski
Dept. of Mining Damage and Geoinformatics Faculty of Mining Surveying and Environmental Engineering AGH University of Science and Technology/Cracow/ Poland
Abstract: Oil and gas development from underground reservoirs disturbs original rock mass balance. The tending of the rock mass to achieve a new, even only temporary balance is manifested in the movements of the ground surface. Movements can affect ground infrastructure like offshore platforms, pipelines and buildings. For increasing the efficiency of the preventive actions a’priori precisely prediction of the subsidence is necessary. By the prediction of surface subsidence changes of pore pressure in time due to exploitation and geometry of the reservoir have to be taken into account. The prediction method based on the influence function of Knothe will be presented in the paper. Some applications according to the oil and natural gas developments will be discussed
1. Introduction Surface subsidence of areas where oil, gas and water are exploited are a serious problem in various parts of the World. In the coastal regions, vertical movements of the surface may result in flooding or generate extra costs for securing the banks. Such problems were encountered, e.g. in the area of Maracaibo Lake in Venezuela (ca. 3.5 m – maximum subsidence), Mexican Gulf, in California (ca. 10 m – maximum subsidence) and in Japan. The subsidence troughs may be huge in size and the damage to the objects standing on them is comparable to those in the mining areas. Considerable deformations of surface usually can be found in the places where thick fluid reservoirs occur and the host rocks have compaction qualities.
Surface deformations in the areas of oil and gas exploitation can be efficiently predicted on the basis of methods employing the influence functions. These methods make use of relatively uncomplicated mathematical models and are simple in use. Regarding their high efficiency, these methods are not frequently met in the World’s literature, therefore the Authors decided to discuss the prediction model based on an influence function applicable to fluid mineral reservoirs.
3rd IAG / 12th FIG Symposium, Baden, May 22-24, 2006
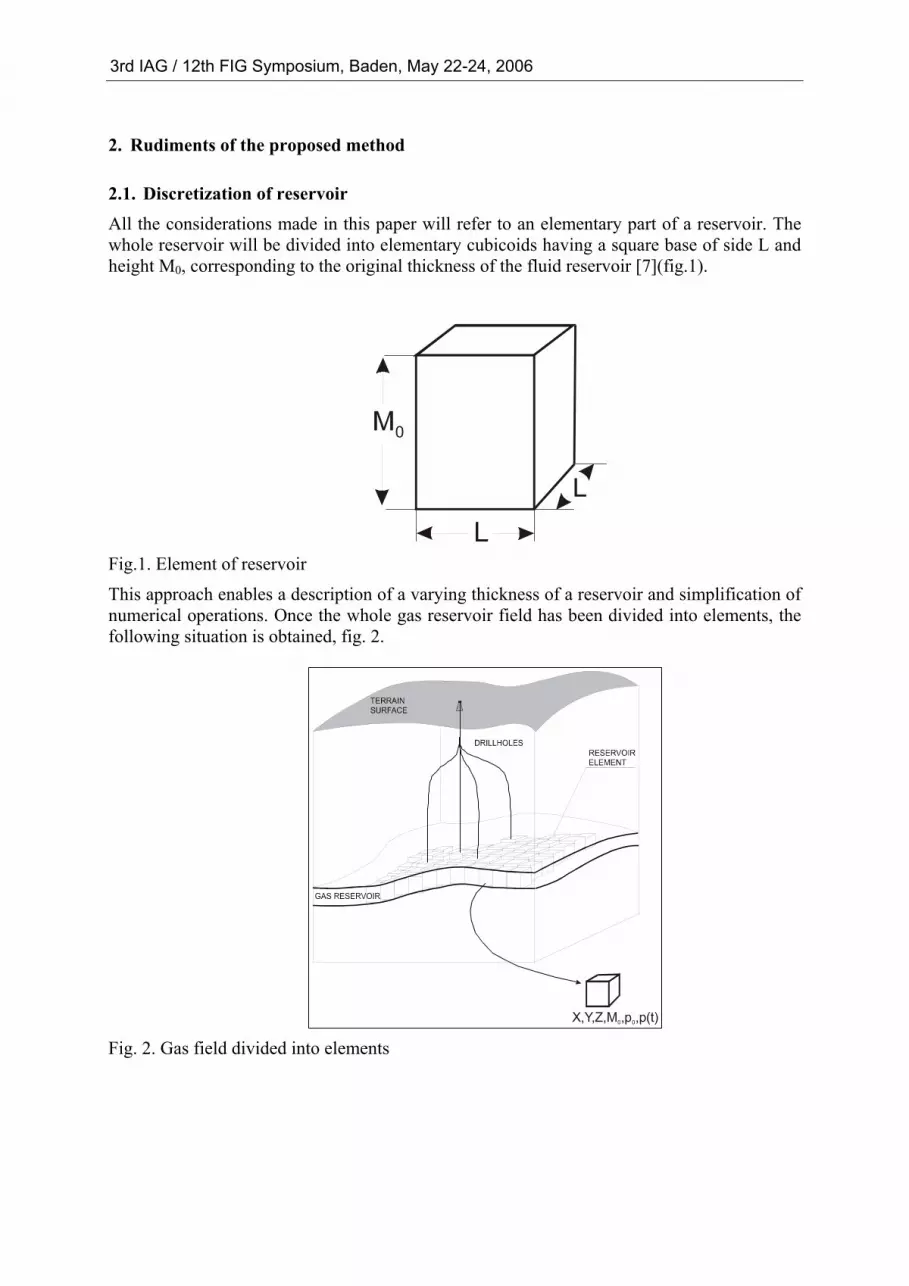
2.1. Discretization of reservoir All the considerations made in this paper will refer to an elementary part of a reservoir. The whole reservoir will be divided into elementary cubicoids having a square base of side L and height M0, corresponding to the original thickness of the fluid reservoir [7](fig.1).
0
LL
Fig.1. Element of reservoir
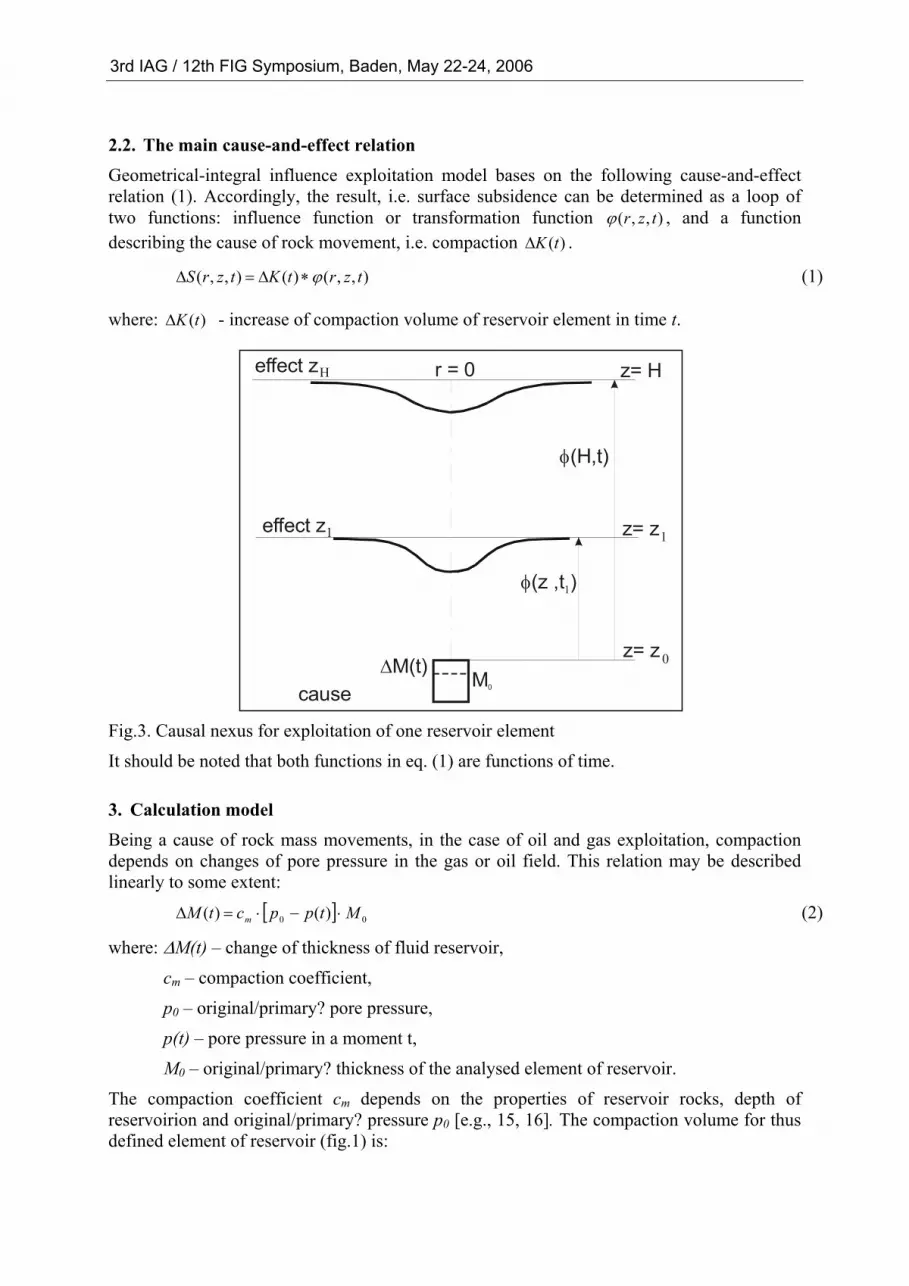
This approach enables a description of a varying thickness of a reservoir and simplification of numerical operations. Once the whole gas reservoir field has been divided into elements, the following situation is obtained, fig. 2.
X,Y,Z,M ,p ,p(t)0 0
Fig. 2. Gas field divided into elements
3rd IAG / 12th FIG Symposium, Baden, May 22-24, 2006
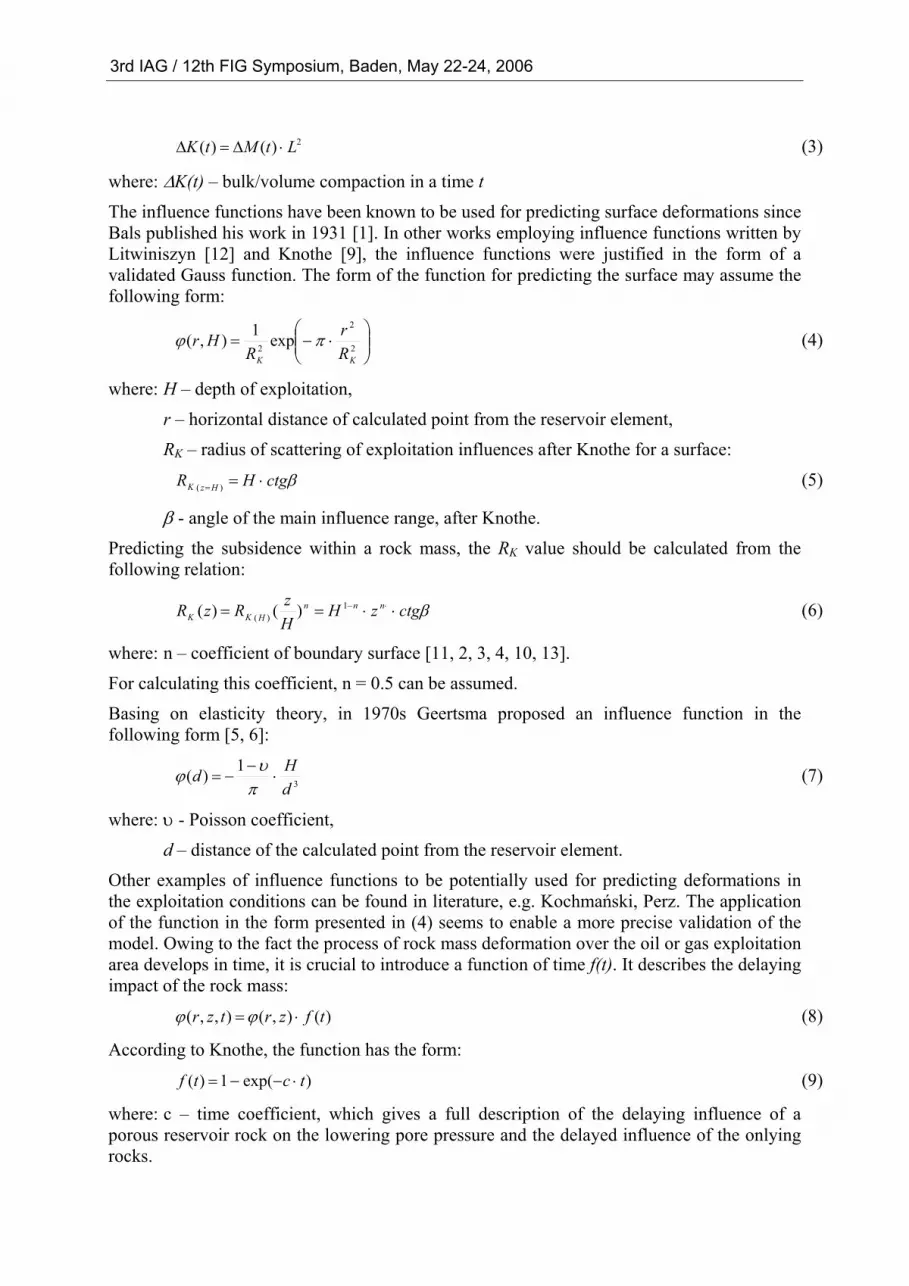
2.2. The main cause-and-effect relation Geometrical-integral influence exploitation model bases on the following cause-and-effect relation (1). Accordingly, the result, i.e. surface subsidence can be determined as a loop of two functions: influence function or transformation function ),,( tzrϕ , and a function describing the cause of rock movement, i.e. compaction )(tK∆ .
),,()(),,( tzrtKtzrS ϕ∗∆=∆ (1)
where: - increase of compaction volume of reservoir element in time t. )(tK∆
z= Hr = 0effect zΗ
Fig.3. Causal nexu
It should be noted
3. Calculation moBeing a cause of depends on changlinearly to some ex
)( ctM =∆
where: ∆M(t) – ch
cm – compa
p0 – origina
p(t) – pore
M0 – origin
The compaction reservoirion and odefined element of
3rd IAG / 12th FIG Symposium, Baden, May 22-24, 2006
φ(H,t)
φ(z ,t )1
z= z 0
z= z 1
cause
effect z1
∆M(t)M0
s for exploitation of one reservoir element
that both functions in eq. (1) are functions of time.
del rock mass movements, in the case of oil and gas exploitation, compaction es of pore pressure in the gas or oil field. This relation may be described tent:
[ ] 00 )( Mtppm ⋅−⋅ (2)
ange of thickness of fluid reservoir,
ction coefficient,
l/primary? pore pressure,
pressure in a moment t,
al/primary? thickness of the analysed element of reservoir.
coefficient cm depends on the properties of reservoir rocks, depth of riginal/primary? pressure p0 [e.g., 15, 16]. The compaction volume for thus reservoir (fig.1) is:
2)()( LtMtK ⋅∆=∆ (3)
where: ∆K(t) – bulk/volume compaction in a time t
The influence functions have been known to be used for predicting surface deformations since Bals published his work in 1931 [1]. In other works employing influence functions written by Litwiniszyn [12] and Knothe [9], the influence functions were justified in the form of a validated Gauss function. The form of the function for predicting the surface may assume the following form:
⋅−= 2
2
2 exp1),(KK R
rR
Hr πϕ (4)
where: H – depth of exploitation,
r – horizontal distance of calculated point from the reservoir element,
RK – radius of scattering of exploitation influences after Knothe for a surface:
βctgHR HzK ⋅== )( (5)
β - angle of the main influence range, after Knothe.
Predicting the subsidence within a rock mass, the RK value should be calculated from the following relation:
βctgzHHzRzR nnn
HKK ⋅⋅== ⋅−1)( )()( (6)
where: n – coefficient of boundary surface [11, 2, 3, 4, 10, 13].
For calculating this coefficient, n = 0.5 can be assumed.
Basing on elasticity theory, in 1970s Geertsma proposed an influence function in the following form [5, 6]:
3
1)(dHd ⋅
−−=
πυϕ (7)
where: υ - Poisson coefficient,
d – distance of the calculated point from the reservoir element.
Other examples of influence functions to be potentially used for predicting deformations in the exploitation conditions can be found in literature, e.g. Kochmański, Perz. The application of the function in the form presented in (4) seems to enable a more precise validation of the model. Owing to the fact the process of rock mass deformation over the oil or gas exploitation area develops in time, it is crucial to introduce a function of time f(t). It describes the delaying impact of the rock mass:
)(),(),,( tfzrtzr ⋅=ϕϕ (8)
According to Knothe, the function has the form:
)exp(1)( tctf ⋅−−= (9)
where: c – time coefficient, which gives a full description of the delaying influence of a porous reservoir rock on the lowering pore pressure and the delayed influence of the onlying rocks.
3rd IAG / 12th FIG Symposium, Baden, May 22-24, 2006
Predicting the surface subsidence, they can be calculated by superpositioning the elementary subsidence’s. Elementary subsidence caused by exploitation of a fluid from one or any element of reservoir will be written in compliance with (1) as:
),,()()( ,,, tzrtKtS ijijiij ϕ⋅∆=∆ (10)
where: j – number of calculation point,
i – number of reservoir element,
( ) ( )22, ijijij yyxxr −+−= ,
. ijij zzz −=,
Using the linear superpositioning, a subsidence of any point in a time t can be calculated from:
∑=
=
∆=Ni
iijj tStS
1, )()( (11)
where: N – number of reservoir elements ( Ni ≤≤1 ).
The subsidence distribution over a large fluid reservoir with the on-going exploitation can be calculated on the basis of known reservoir pressure distributions. Having divided of the whole reservoir into constituent elements it was possible to precisely describe the reservoir pressure distribution, its changeability in time and space, and hence to precisely model the surface subsidence in time. If the element of a reservoir were treated as an object initiating rock mass movements, it can be described values of such attributes as, e.g. location (x, y, z), thickness M0, primary pore pressure p0, pressure caused by exploitation in the successive moments of time p1(t1), p2(t2), etc. Contemporary numerical techniques enable operation of attributes for each reservoir element not only at the stage of calculation and prediction of subsidence’s. Having had a description of attributes, spatial analyses can be made. Their objective can be, e.g. determining efficiency of a given exploitation method or prevention against too big deformations of the sea bed on shelves or on the surface.
4. Practical application
4.1. Prediction of surface subsidence
The Authors verified the presented model on some real-life examples. These were oil reservoirs under the North Sea and gas reservoirs in one of European countries.
The modeling in the case of the gas field was made in stages. The results of calculations were compared with the levelling measurement and presented in figure 5. Parameters of the calculation model, i.e. RK, c, cm, were determined on the basis of data measured as subsidence points on surface by a moment t and as compaction properties of the reservoir. The prediction of subsidence for the successive period (ti+1) was calculated with the use of these parameters and expected decreases of pore pressure value in time ti+1. Therefore, it was possible to obtain an exceptionally high accuracy of predicted subsidence’s, which was not attainable with other methods [7, 8]. In view of the cause-and-effect relation mentioned in section 2, the parameters of the model can be also identified. This was indicated by, among others, results of analyses carried out for a gas field, where the inverse analysis of measured surface subsidences enabled
3rd IAG / 12th FIG Symposium, Baden, May 22-24, 2006
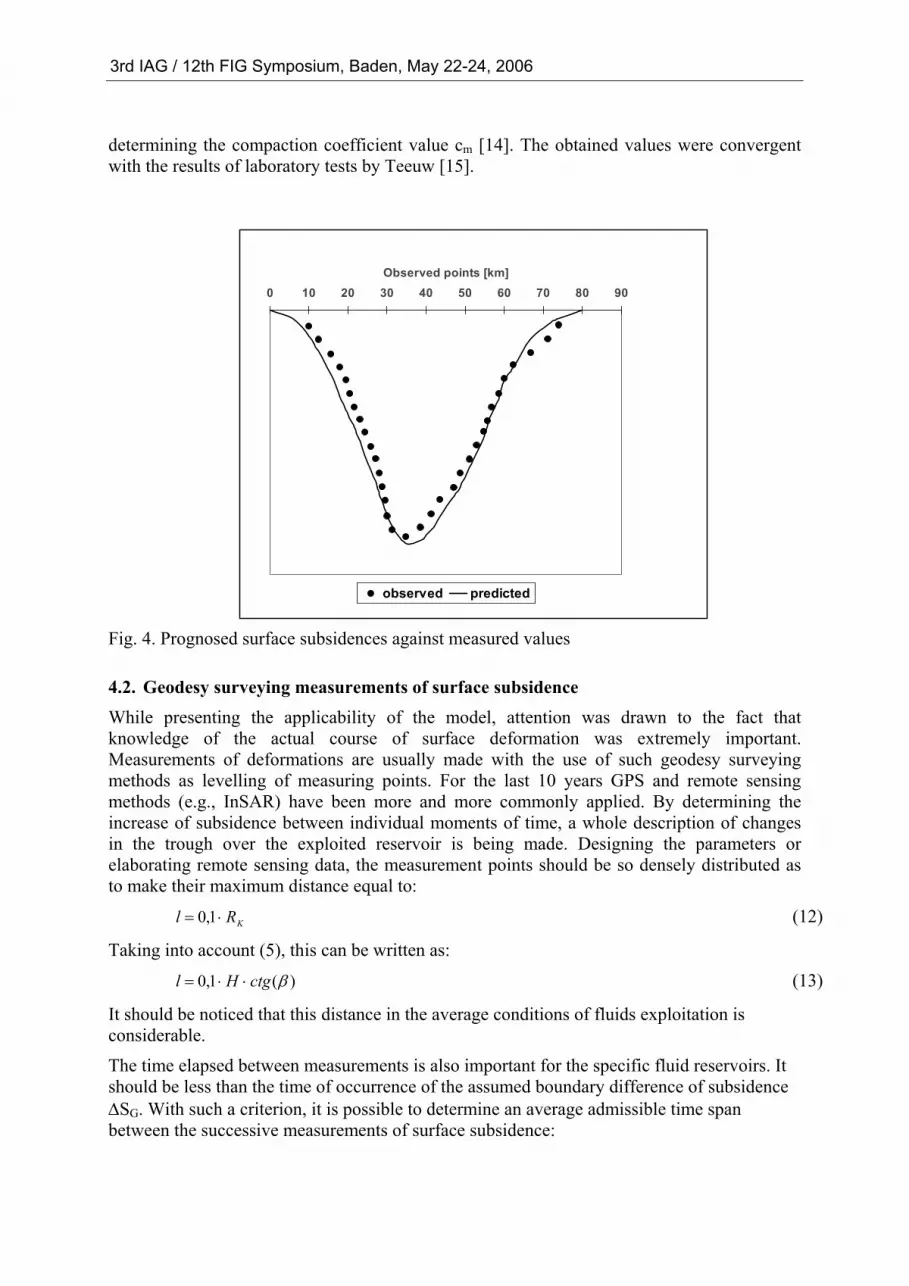
determining the compaction coefficient value cm [14]. The obtained values were convergent with the results of laboratory tests by Teeuw [15].
Observed points [km]
Fig. 4. Prognosed
4.2. Geodesy survWhile presenting knowledge of thMeasurements of methods as levellmethods (e.g., InSincrease of subsidin the trough oveelaborating remoteto make their maxi
KRl ⋅= 1,0
Taking into accoun
1,0 Hl ⋅=
It should be noticeconsiderable.
The time elapsed bshould be less than∆SG. With such a cbetween the succe
3rd IAG / 12th FIG Symposium, Baden, May 22-24, 2006
0 10 20 30 40 50 60 70 80 90
observed predicted
surface subsidences against measured values
eying measurements of surface subsidence the applicability of the model, attention was drawn to the fact that e actual course of surface deformation was extremely important. deformations are usually made with the use of such geodesy surveying ing of measuring points. For the last 10 years GPS and remote sensing AR) have been more and more commonly applied. By determining the
ence between individual moments of time, a whole description of changes r the exploited reservoir is being made. Designing the parameters or sensing data, the measurement points should be so densely distributed as mum distance equal to:
(12)
t (5), this can be written as:
)(βctg⋅ (13)
d that this distance in the average conditions of fluids exploitation is
etween measurements is also important for the specific fluid reservoirs. It the time of occurrence of the assumed boundary difference of subsidence riterion, it is possible to determine an average admissible time span
ssive measurements of surface subsidence:
β2
2_
__
0
_
ctgF
H
pMc
St
tm
G ⋅∆⋅⋅
∆=∆
∆
(14)
where: - low thickness of reservoir, 0
_
M
- average decrease of reservoir pressure in time ∆t, tp ∆∆_
_
H - average depth of deposition,
F – total surface of the reservoir.
As the decrease of pressure can be written as:
tpttpp t ∆⋅=∆⋅∂∂
=ƥ
∆
_
, (15)
where: - gradient of pore pressure, then eq. (14) will finally take the form: •
p
βctgHFpMc
St
m
G_
_
0
_
⋅⋅⋅⋅
∆=∆
• (16)
It follows from eq. (14) that the time span between individual observations depends on a parameter typical of mineral exploitation rate. In this case it is described by a gradient of pore pressure decrease.
References: [1] Bals R.: Beitrag zur Frage der Vorausberechnung bergbaulicher Senkungen. Mitt. Aus
dem Markscheidewesen, 1931/32. [2] Bartosik-Sroka T., Sroka A.: Zmienność wartości parametrów teorii T.Kochmańskiego
i S.Knothego w górotworze. Rudy i Metale Nieżelazne, nr 7., 1974. [3] Drzęźla B.: Badania teoretyczne i modelowe ruchów górotworu przy eksploatacji
górniczej. Politechnika Śląska, Gliwice, 1971 (niepublikowane). [4] Drzęźla B.: Zmienność zasięgu wpływów eksploatacji w górotworze. Przegląd Górniczy,
nr 10. Katowice 1979. [5] Geertsma J.: Land subsidence above compaction oil and gas reservoirs. SPE-European
Spring Meeting 1972; SPE AIME Nr 3730, pp 17. [6] Geertsma J., Van Opstal, G.: A numerical technique for predicting subsidence above
compaction reservoirs, based on the nucleus of strain concept. Verhandlingen Koniklijk Nederlands Geologisch Mijnbouwkundig Genootschap., Vol. 28, pp.63-78, 1973.
[7] Hejmanowski R.: Zur Vorausberechnung förderbedingten Bodensenkungen über Erdöl- und Erdgaslagerstätten. PhD. Thesis. Technical University Clausthal, Germany, 1993.
[8] Hejmanowski.R., Sroka A.: Time-space ground subsidence prediction determined by volume extraction from the rock mass: Land subsidence : proceedings of the sixth international symposium on Land subsidence : Ravenna 24–29 September 2000. Vol. 2: Measuring and monitoring theory and modeling, 2000. pp. 367–375.
[9] Knothe. S.: Równanie profilu ostatecznie wykształconej niecki osiadania. Archiwum Górnictwa i Hutnictwa, t.1, z.1, 1953.
3rd IAG / 12th FIG Symposium, Baden, May 22-24, 2006
[10] Kowalski A.: Określenie zmienności parametru promienia zasięgu wpływów głównych
w górotworze teorii Budryka-Knothego na podstawie badań geodezyjnych przemieszczeń pionowych górotworu. Praca doktorska. GIG, Katowice, 1984 (niepublikowane).
[11] Krzysztoń D.: Parametr zasięgu niecek osiadania w ośrodku sypkim. Archiwum Górnictwa, t.10, z.1., 1965.
[12] Litwiniszyn J.: Przemieszczenia górotworu w świetle teorii prawdopodobieństwa. Archiwum Górnictwa i Hutnictwa, t.2, z.4., 1954.
[13] Mikołajczak J.: Uwagi do równania promienia zasięgu wpływów głównych. Ochrona Terenów Górniczych, nr 69/3. Katowice 1984.
[14] Sroka A., Schober F.: Studie zur Analyse und Vorhersage der Bodensenkungen und Kompaktionsverhaltens eines Erdgasfeldes. Abschlussbericht, 1989.(niepublikowane)
[15] Teew.D.: Laboratory measurement of compaction properties of Groningen reservoir rock, Verhandlingen Koniklijk Nederlands Geologisch Mijnbouwkundig Genootschap., Vol. 28, pp.19-32, 1973.
[16] Van Kesteren. J.: Estimate of compaction properties of Groningen reservoir rock. Verhandlingen Koniklijk Nederlands Geologisch Mijnbouwkundig Genootschap., Vol. 28, pp.33-40, 1973
3rd IAG / 12th FIG Symposium, Baden, May 22-24, 2006