This article appeared in a journal published by Elsevier. The attached copy is furnished to the author for internal non-commercial research and education use, including for instruction at the authors institution and sharing with colleagues. Other uses, including reproduction and distribution, or selling or licensing copies, or posting to personal, institutional or third party websites are prohibited. In most cases authors are permitted to post their version of the article (e.g. in Word or Tex form) to their personal website or institutional repository. Authors requiring further information regarding Elsevier’s archiving and manuscript policies are encouraged to visit: http://www.elsevier.com/copyright
Transcript
This article appeared in a journal published by Elsevier. The attachedcopy is furnished to the author for internal non-commercial researchand education use, including for instruction at the authors institution
and sharing with colleagues.
Other uses, including reproduction and distribution, or selling orlicensing copies, or posting to personal, institutional or third party
websites are prohibited.
In most cases authors are permitted to post their version of thearticle (e.g. in Word or Tex form) to their personal website orinstitutional repository. Authors requiring further information
regarding Elsevier’s archiving and manuscript policies areencouraged to visit:
Chemical Engineering and Processing 57– 58 (2012) 51– 58
Contents lists available at SciVerse ScienceDirect
Chemical Engineering and Processing:Process Intensification
jo u rn al hom epage: www.elsev ier .com/ locate /cep
Exploration of process parameters for continuous hydrolysis of canola oil,camelina oil and algal oil
Wei-Cheng Wanga, Timothy L. Turnerb, Larry F. Stikeleatherc,∗, William L. Robertsa,d
a Department of Mechanical and Aerospace Engineering, North Carolina State University, Raleigh, NC, USAb Permafuels Inc., Carrboro, NC, USAc Department of Biological and Agricultural Engineering, North Carolina State University, Raleigh, NC, USAd Clean Combustion Research Center, King Abdullah University of Science and Technology, Thuwal, Saudi Arabia
a r t i c l e i n f o
Article history:Received 22 September 2011Received in revised form 2 April 2012Accepted 18 April 2012Available online 26 April 2012
Keywords:Continuous hydrolysisFree fatty acid
a b s t r a c t
Thermal hydrolysis of triglycerides to form free fatty acid (FFA) is a well-established industry practice.Recently, this process has been employed as a first step in the production of biofuels from lipids. To thatend, batch and continuous hydrolysis of various feedstocks has been examined at the laboratory scale.Canola, the primary feedstock in this paper, camelina and algal oils were converted to high quality FFA.For the different reaction temperatures, the continuous hydrolysis system was found to provide betteryields than the laboratory batch system. In addition, CFD simulation with ANSYS-CFX was used to modelthe performance and reactant/product separation in the continuous, counter-flow reactor. The effects ofreaction temperature, water-to-oil ratio (ratio of water and oil volumetric inflow rate), and preheatingof the reactants were examined experimentally. Optimization of these parameters has resulted in animproved, continuous process with high mass yields (89–93%, for reactor temperature of 260 ◦C andwater-to-oil ratio of 4:1) and energy efficiency (76%, for reactor temperature of 250 ◦C and water-to-oilratio of 2:1). Based on the product quality and energy efficiency considerations, the reactor temperatureof 260 ◦C and water-to-oil ratio of 4:1 have provided the optimal condition for the lab scale continuoushydrolysis reaction.
Oils and fats have been viewed as the most important renewableraw materials of the chemical industry. They have been convertedinto high quality free fatty acid (FFA, high total FFA concentration,more than 98%, and lowest glycerides, less than 2%) to be used forchemical conversions and for the synthesis of chemically pure com-pounds [1]. Average annual world oil production from 1996 to 2000was reported to be 105 × 106 tons and will increase to 184.7 × 10⁶
tons in the year of 2016–2020 [2]. In 2000, the world production offatty acid from the hydrolysis of natural fats and oils totaled about4 × 106 tons per year [3], and glycerol, as a by-product of hydrolysis,was estimated to be 0.75 × 10⁶ tons per year [4].
FFAs produced from a hydrolysis reactor have traditionally beena precursor for other industrial products. The reactor is likely to beconstructed in a large industrial facility that also contains other pro-cessing units to accept the FFA precursor, and the facility has a large,
∗ Corresponding author at: 178 D. S. Weaver Labs, Box 7625, NCSU, Raleigh, NC27695-7625, USA. Tel.: +1 919 515 6754; fax: +1 919 515 7760.
flexible distribution system for receiving feedstocks and deliver-ing products. Thus, “economy-of-scale” has the greatest impacton the design of the hydrolysis reactor. Currently it is found thatstraight alkanes can be produced from FFA through a decarboxy-lation process [5], and these hydrocarbons are considered as goodreplacements of petroleum diesel or other transportation fuels aftersuitable refining. Therefore, the logistical and economic factors thatcontrol the FFA production must be considered. It is well-knownthat the size of biorefineries must be optimized for conflictingconstraints including “economy-of-scale” and the costs of trans-porting biomass of low volumetric energy density [6–8]. To produceadvanced biofuels economically, it may be desirable to build abiorefinery at smaller scale co-located with the feedstock. If this isdone, new techniques must be utilized in the biorefinery to improveefficiency, since “economy-of-scale” alone may be reduced. If asmaller hydrolysis reactor is produced to reduce capital costs andaccommodate less feed, then the residence time is reduced, andother parameters may need to be optimized to compensate forreduced residence time. Additionally, if the biorefinery is built in ageographically remote location in proximity to feedstock sources,then resource limitations (water, power) may be more importantthan maximizing energy efficiency. In such cases, energy efficiencyat a variety of conditions (e.g., water-to-oil ratios (ratio of waterand oil volumetric inflow rate), preheating the water and oil) may
52 W.-C. Wang et al. / Chemical Engineering and Processing 57– 58 (2012) 51– 58
be of interest. Therefore, a re-evaluation of continuous countercur-rent hydrolysis at the laboratory scale, where the entire processcan be characterized under a well-controlled environment, wasnecessary.
There are numerous theoretical [9,10] and experimental[11–14] investigations of hydrolysis developed from batch studies.Under ideal stoichiometric conditions, fat splitting is a reversiblereaction which requires the addition of three moles of water toone mole of triglyceride to produce three moles of fatty acids andone mole of glycerol. The reaction requires relatively high temper-atures. High enough pressure is maintained to keep the water, andhence the entire reaction, in the liquid phase. Increasing reactiontemperature not only improves the reaction rate but also increasesthe diffusion rate of water and glycerol into and out of the oil phase[9]. The higher the reaction temperature, the greater the solubilityof water in oil and the faster the reaction occurs. For hydrolysis withpure water without any catalyst, much higher temperatures areneeded to increase both the solubility of water in oil phase and theelectrolytic dissociation of this water [15]. In an autoclave, Lascaray[11] observed that an increase in reaction temperature from 240 ◦Cto 250 ◦C results in 1.2–1.5 times higher reaction rate. In addition,from the study of Sturzenegger and Sturm [12], it is found thathydrolysis attains equilibrium 5 times faster when temperature isincreased from 225 ◦C to 280 ◦C.
Water-to-oil ratio also affects the degree and reaction rate ofhydrolysis. Higher water-to-oil ratio shifts the equilibrium balancein favor of product [13]. King et al. [14] showed that 5:1 water-to-oil volume ratio would produce higher FFA yield in less time than2.5:1 ratio in subcritical water. Moquin and Temelli [10,13] havealso found a significant increase of FFA yield as the water-to-oilmolar ratio was increased from 3:1 to 17:1 and 70:1 in supercriticalCO2.
If a continuous process is used, a flow-through process canbe expected to produce higher yields than a continuous stirred-tank reactor (CSTR), since hydrolysis is an equilibrium reactionunder these conditions [16]. The Colgate-EmeryTM [17] and Foster-WheelerTM [18] processes are the most common industrial fatsplitting methods. In a continuous countercurrent flow column,oil and water react at about 260 ◦C and about 50 bar. Withoutthe use of a catalyst, high quality FFA is produced in 1–3 h foraverage residence time. Besides the FFA product, sweet-water(the glycerol–water mixture) is controlled by applying more freshwater, and this method maintains the glycerol content in the sweet-water at a very low concentration and maintains a high yield of FFA.While continuous hydrolysis of fats or oils is a well-understoodarea, the studies regarding the reaction parameters are currentlylimited.
All industrial fat splitting methods have the twin objectives ofhigh rate of reaction along with high yields. All efforts to reachthese two targets are always of interest. In this paper, a continu-ous, lab scale high-pressure non-catalytic counter-flow hydrolysisreactor has been constructed, with complementary modeling. Uponcompletion of the reactor, several series of experiments were con-ducted to characterize the reactor while varying each of severaloperating conditions (temperature of reactants, reaction tempera-ture, water-to-oil ratio, and feedstock). The extent of completionof hydrolysis at various temperatures and different water-to-oilratios are presented to help understand the mechanism of thecontinuous hydrolysis reaction. Canola oil was the primary feed-stock in this research; hydrolysis of camelina oil as well as algaloil was also demonstrated to show the versatility of this process.This modified Colgate-Emery process is an efficient and inex-pensive method for production of FFA from triglycerides. Uponconfirmation that the reactor operates correctly, future endeav-ors to modify the system (e.g., catalysts, recycle streams) can beconducted.
2. Experimental methods
2.1. Materials
The basic materials used in this study were commercial canolaoil and distilled water. The other feedstocks were refined, bleachedand deodorized (RBD) canola oil purchased from Jedwards Interna-tional Inc. (Quincy, MA), camelina oil from Touchet Seed & Energy(Touchet, WA), and algal oil from Eldorado Biofuels (Santa Fe, NM).
2.2. Experimental
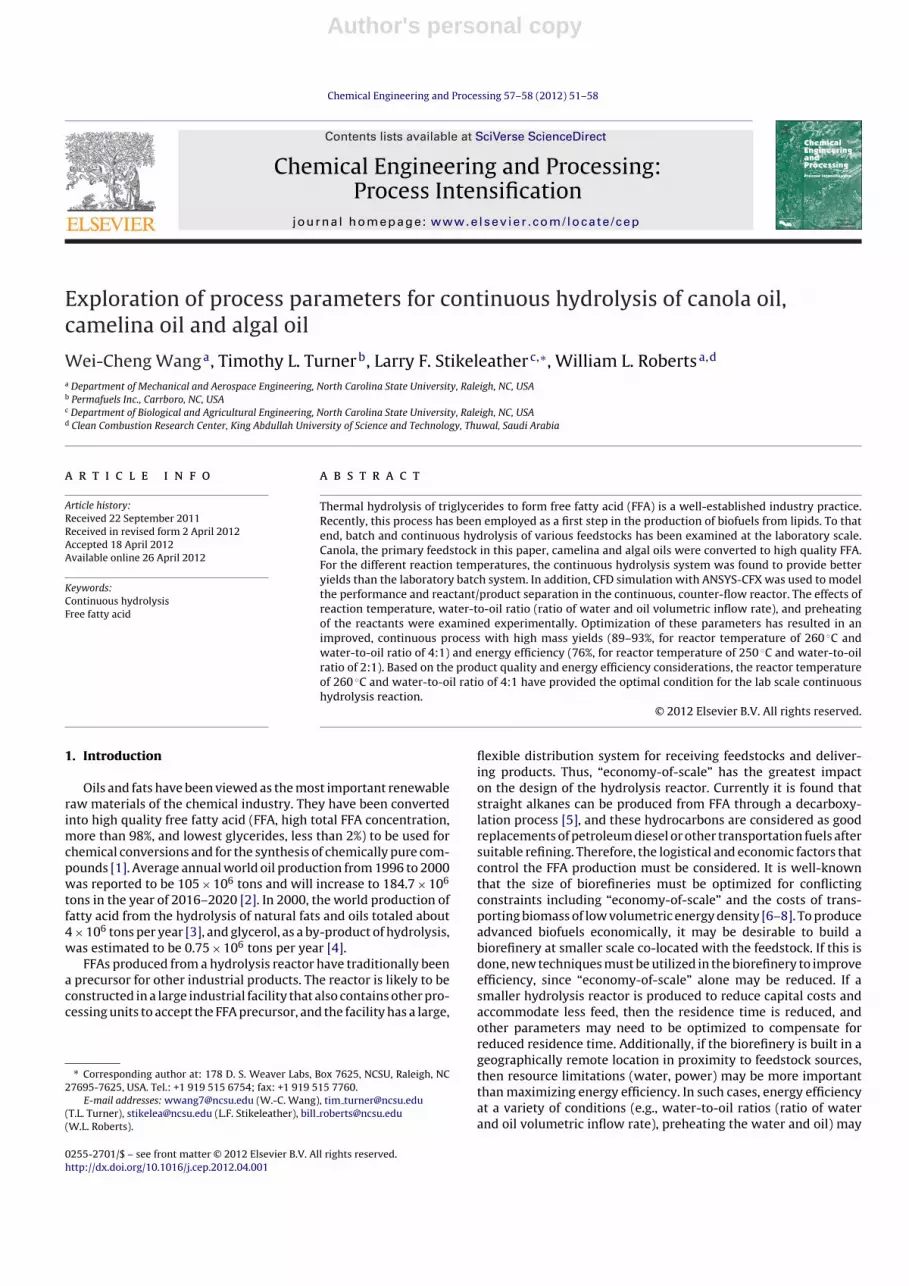
Fig. 1 shows the lab-scale continuous hydrolysis reactor setup.In this system, appropriate proportions of water and oil were fedat 55 bar1 into the hydrolysis reactor via a Neptune proportionalpump (model: 515-S-N1, Neptune Chemical Pump Company, Inc.,Buffalo, NY) and modified Waters HPLC pumps (model: 510, WatersCorporation, Milford, MA) (external Swagelok check valves wereplumbed to replace the pump head check valves in order to alloweffective pumping of the viscous oils). The water and oil can bepumped individually or simultaneously. The hydrolysis reactionwas performed in a custom designed 316 SS reactor, 150 cm tall by8.9 cm inner diameter, providing a fluid volume of 10 L. This reac-tor was heated via direct electromagnetic induction coils driven bytwo modified commercial induction oven cooktops [20]. The topand bottom halves of the reactor were heated by separate inductioncoils. Temperature control was via K type thermocouples mountedon the surface of the reactor. These thermocouples were connectedto Delta DTB 4824 Temperature Controllers which control the ovensin on-off mode. The power consumption of the heaters was adjustedby tuning the inductive circuits, with a maximum power of 1.8 kWper coil. The heaters are capable of bringing the upper and lowerparts of the reactors to the desired temperature in about 120 min.
For a hydrolysis reaction, the reaction temperature was setbetween 250 and 270 ◦C. Water was pumped into a preheater witha fluid volume of 600 mL. Oil was pumped into a second preheatercolumn with a 154 mL volume. Both columns were heated to 250 ◦Cby induction coils similar to those on the reactor. Experiments withand without water and oil pre-heating were conducted. Water wasinjected at a point about 25 cm below the top of the reactor andoil was injected about 120 cm below the top of the reactor. By thedifference of densities, water and oil flow counter-currently, whichalso enhances mixing.
During the continuous reaction, the FFA and the sweet waterstreams leaving the vessel were cooled by a tube-in-shell heatexchanger. Pressure was controlled via Swagelok back pressurerelief valves. The flow rates of the FFA and sweet water were main-tained by Swagelok metering valves. The purity of the product wasobtained by comparing the acid value, which is proportional to themolar fraction of free fatty acid present, to the saponification value,which is proportional to the total number of moles of bound andunbound fatty acids.
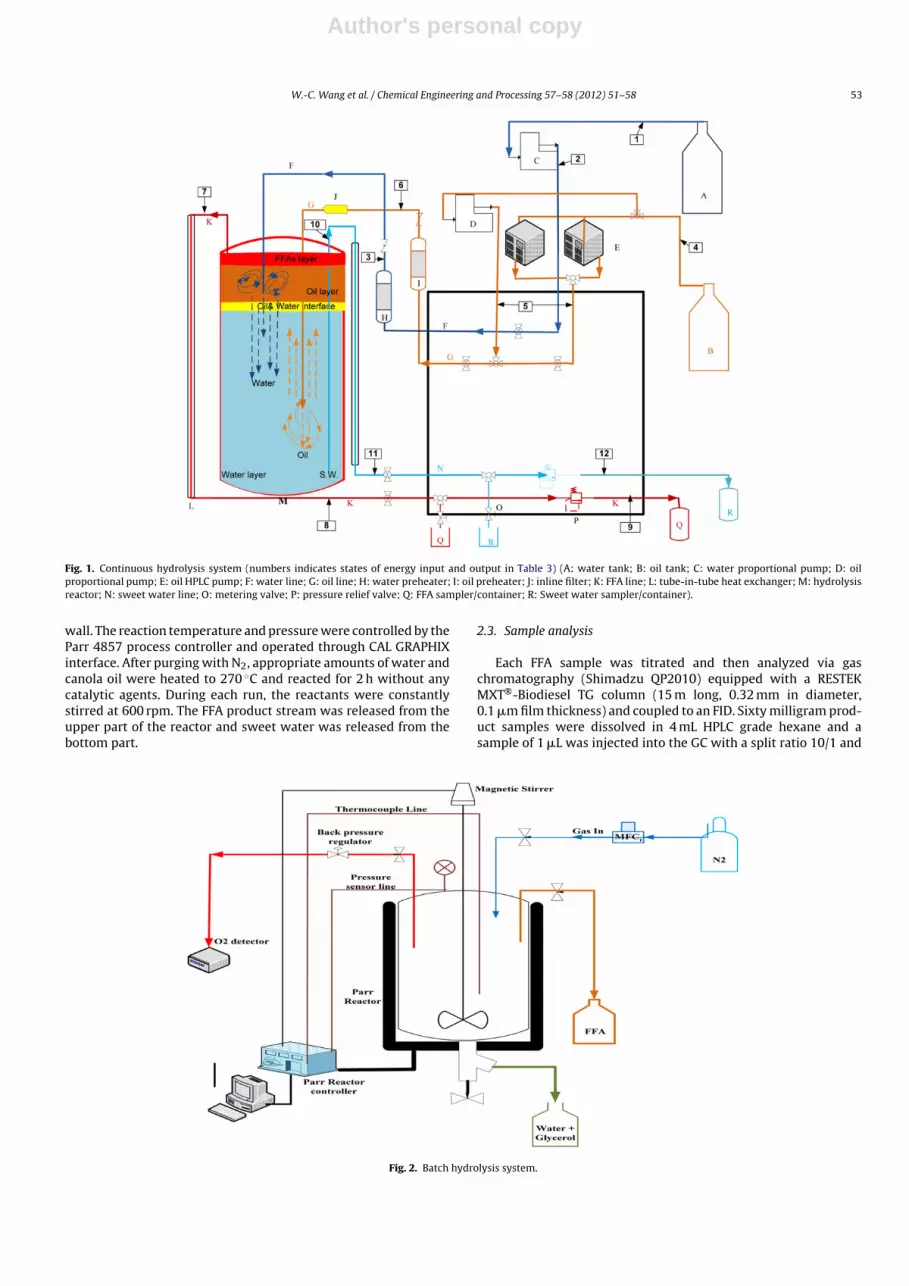
Batch hydrolysis experiments were also conducted for compar-ison with the continuous hydrolysis results. Fig. 2 shows the 5 Lbatch hydrolysis reactor (Parr HT/HP reactor, 14 cm I.D. × 37.7 cmhigh, model 4580, Parr Instrument Company, Moline, IL). This vesselis equipped with 3600 W ceramic fiber heaters which are designedto provide uniform heat distribution to the walls and bottom ofthe vessel. A thermowell is inserted in the heater to accommodatean external J type thermocouple for contact with the outside vessel
1 Pressure was maintained constant at 55 bar for this study. At 250 ◦C, the vaporpressure is 39.762 bar [19]. As long as the pressure stays well below the criticalpressure (220.640 bar, at a critical temperature of 373.946 ◦C), it is expected thatdensity stays relatively constant and thus pressure effects are minimal.
Author's personal copy
W.-C. Wang et al. / Chemical Engineering and Processing 57– 58 (2012) 51– 58 53
Fig. 1. Continuous hydrolysis system (numbers indicates states of energy input and output in Table 3) (A: water tank; B: oil tank; C: water proportional pump; D: oilproportional pump; E: oil HPLC pump; F: water line; G: oil line; H: water preheater; I: oil preheater; J: inline filter; K: FFA line; L: tube-in-tube heat exchanger; M: hydrolysisreactor; N: sweet water line; O: metering valve; P: pressure relief valve; Q: FFA sampler/container; R: Sweet water sampler/container).
wall. The reaction temperature and pressure were controlled by theParr 4857 process controller and operated through CAL GRAPHIXinterface. After purging with N2, appropriate amounts of water andcanola oil were heated to 270 ◦C and reacted for 2 h without anycatalytic agents. During each run, the reactants were constantlystirred at 600 rpm. The FFA product stream was released from theupper part of the reactor and sweet water was released from thebottom part.
2.3. Sample analysis
Each FFA sample was titrated and then analyzed via gaschromatography (Shimadzu QP2010) equipped with a RESTEKMXT®-Biodiesel TG column (15 m long, 0.32 mm in diameter,0.1 �m film thickness) and coupled to an FID. Sixty milligram prod-uct samples were dissolved in 4 mL HPLC grade hexane and asample of 1 �L was injected into the GC with a split ratio 10/1 and
Fig. 2. Batch hydrolysis system.
Author's personal copy
54 W.-C. Wang et al. / Chemical Engineering and Processing 57– 58 (2012) 51– 58
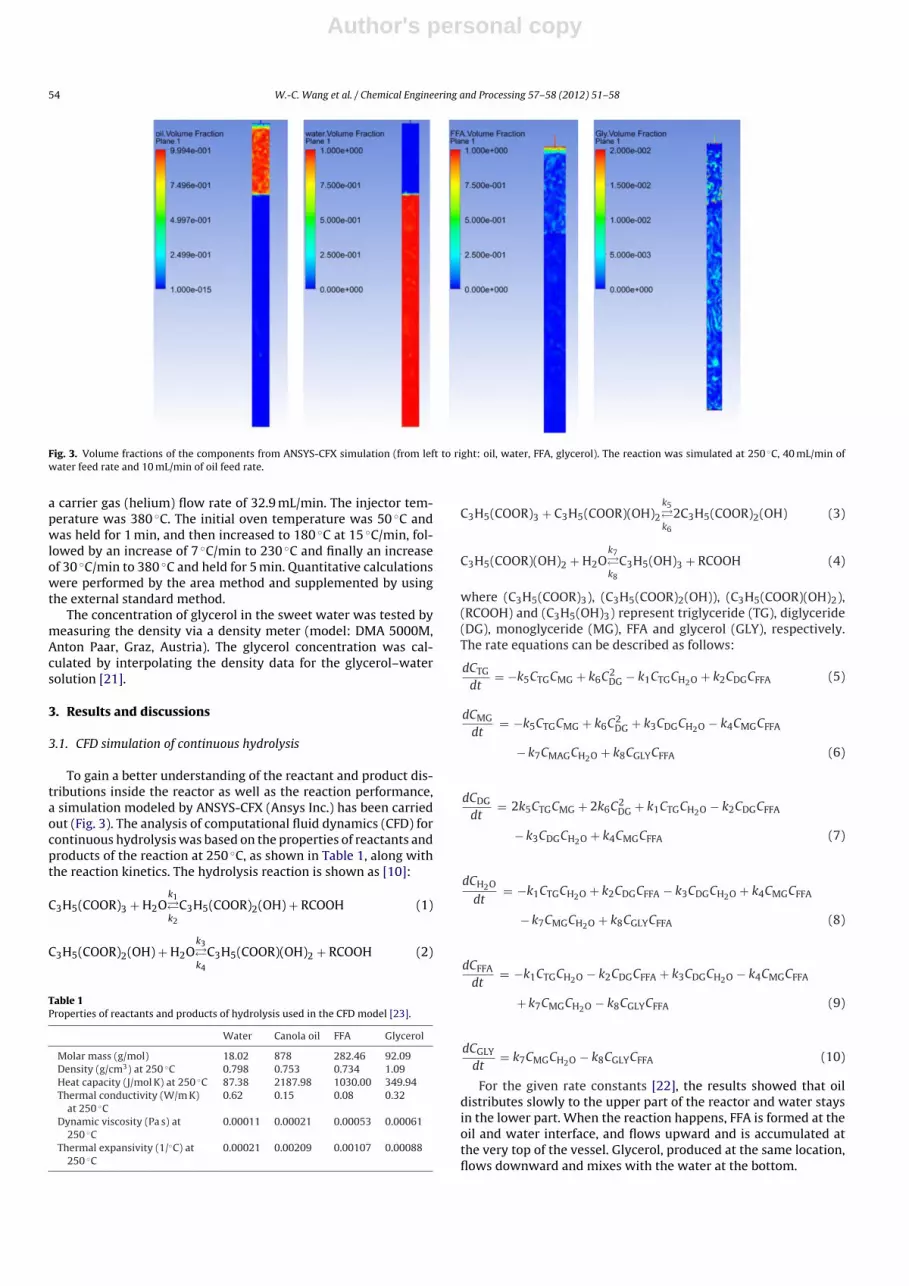
Fig. 3. Volume fractions of the components from ANSYS-CFX simulation (from left to right: oil, water, FFA, glycerol). The reaction was simulated at 250 ◦C, 40 mL/min ofwater feed rate and 10 mL/min of oil feed rate.
a carrier gas (helium) flow rate of 32.9 mL/min. The injector tem-perature was 380 ◦C. The initial oven temperature was 50 ◦C andwas held for 1 min, and then increased to 180 ◦C at 15 ◦C/min, fol-lowed by an increase of 7 ◦C/min to 230 ◦C and finally an increaseof 30 ◦C/min to 380 ◦C and held for 5 min. Quantitative calculationswere performed by the area method and supplemented by usingthe external standard method.
The concentration of glycerol in the sweet water was tested bymeasuring the density via a density meter (model: DMA 5000M,Anton Paar, Graz, Austria). The glycerol concentration was cal-culated by interpolating the density data for the glycerol–watersolution [21].
3. Results and discussions
3.1. CFD simulation of continuous hydrolysis
To gain a better understanding of the reactant and product dis-tributions inside the reactor as well as the reaction performance,a simulation modeled by ANSYS-CFX (Ansys Inc.) has been carriedout (Fig. 3). The analysis of computational fluid dynamics (CFD) forcontinuous hydrolysis was based on the properties of reactants andproducts of the reaction at 250 ◦C, as shown in Table 1, along withthe reaction kinetics. The hydrolysis reaction is shown as [10]:
C3H5(COOR)3 + H2Ok1�k2
C3H5(COOR)2(OH) + RCOOH (1)
C3H5(COOR)2(OH) + H2Ok3�k4
C3H5(COOR)(OH)2 + RCOOH (2)
Table 1Properties of reactants and products of hydrolysis used in the CFD model [23].
Water Canola oil FFA Glycerol
Molar mass (g/mol) 18.02 878 282.46 92.09Density (g/cm3) at 250 ◦C 0.798 0.753 0.734 1.09Heat capacity (J/mol K) at 250 ◦C 87.38 2187.98 1030.00 349.94Thermal conductivity (W/m K)
at 250 ◦C0.62 0.15 0.08 0.32
Dynamic viscosity (Pa s) at250 ◦C
0.00011 0.00021 0.00053 0.00061
Thermal expansivity (1/◦C) at250 ◦C
0.00021 0.00209 0.00107 0.00088
C3H5(COOR)3 + C3H5(COOR)(OH)2
k5�k6
2C3H5(COOR)2(OH) (3)
C3H5(COOR)(OH)2 + H2Ok7�k8
C3H5(OH)3 + RCOOH (4)
where (C3H5(COOR)3), (C3H5(COOR)2(OH)), (C3H5(COOR)(OH)2),(RCOOH) and (C3H5(OH)3) represent triglyceride (TG), diglyceride(DG), monoglyceride (MG), FFA and glycerol (GLY), respectively.The rate equations can be described as follows:
For the given rate constants [22], the results showed that oildistributes slowly to the upper part of the reactor and water staysin the lower part. When the reaction happens, FFA is formed at theoil and water interface, and flows upward and is accumulated atthe very top of the vessel. Glycerol, produced at the same location,flows downward and mixes with the water at the bottom.
Author's personal copy
W.-C. Wang et al. / Chemical Engineering and Processing 57– 58 (2012) 51– 58 55
Fig. 4. Effect of preheating water and oil on FFA% yield; reaction was carried out ata constant temperature of 250 ◦C and oil feed rate of 10 mL/min and water feed rateof 40 mL/min.
3.2. Effect of water and oil preheating
As described by Mills [24], water and oil were pre-heated tothe reaction temperature before entering the reactor. Pre-heatingwater and oil is actually used to avoid heat exchange between thenew feed pumped into the reactor and the reactants in the vesselwithin the hydrolysis reaction. Water and oil pumped into the reac-tor without pre-heating will reduce the reaction temperature insome regions of the reactor and decrease the hydrolysis rate. As theexperimental results shown in Fig. 4, at a reaction temperature of250 ◦C and a water-to-oil ratio of 4:1, pre-heating both water and oilat 250 ◦C provided around 96.5% FFA yield when reaching steady-state (at the 210 min transient time after initial oil feeding), 36%more than with no pre-heating, 18% more than only pre-heatingwater and 3% more than only pre-heating oil.
3.3. Effect of reaction temperatures
Increasing the reaction temperature not only increases the rateof reaction but improves the rate of diffusion of water and glycerolin and out from the oil phase [25]. Water at higher temperaturehas low dielectric constant and behaves more like polar organicsolvents rather than ambient liquid water [15]. Therefore, watersolubility in the oil phase is enhanced by higher temperatures,hence the period of emulsive hydrolysis is reduced and the reac-tion is accelerated [11]. Fig. 5 shows the degree of hydrolysis withrespect to temperature. With an increase of 20 ◦C (from 250 ◦C to270 ◦C), the water content in the oil phase increased accordingly,and results in a 3% improvement in FFA conversion and higherreaction rate (30 min faster in transition time). These results are inagreement with previous studies [9,12]. In the interest of minimiz-ing energy input, a trial was run to examine the effect of operatingthe bottom half of the reactor at a lower temperature while main-taining the temperature of the upper region. The lower part waskept at 200 ◦C while the upper part was at the desired tempera-ture (260 ◦C). The resulting FFA yield was lower during the first 3 hafter start of hydrolysis but reached the same yield at equilibriumeventually. Thus, it seems evident that for the overall hydroly-sis reaction, the heterogeneous reaction occurs at the beginning
Fig. 5. FFA conversions at different temperatures; water was fed at 40 mL/min andoil was fed at 10 mL/min.
of hydrolysis and a homogeneous reaction occurs thereafter, andthese take place in the water/oil interface and in the oil phase,respectively.
3.4. Effect of water-to-oil ratio
The water-to-oil ratios in this study represent the ratio of inflowrates for the two reactants. To obtain a high conversion to FFA,the glycerol concentration must be kept low [11]. In the continu-ous system, glycerol is washed out countercurrently [25] as freshwater is pumped in and sweet water is removed. As shown inFig. 6, glycerol concentration tracks very closely with FFA yield,which represents the progress of the reaction. The highest glyc-erol concentration measured was 2.03%, at the time the hydrolysisreached equilibrium. The hydrolysis level is improved by replac-ing the glycerol–water phase by adding fresh water as soon as thereaction rate slows down [11]. In addition, higher excess water
Fig. 6. The variation of FFA and glycerol concentration for continuous hydrolysisreactions; reaction was conducted at 250 ◦C as well as 20 mL/min of water feed rateand 10 mL/min of oil feed rate.
Author's personal copy
56 W.-C. Wang et al. / Chemical Engineering and Processing 57– 58 (2012) 51– 58
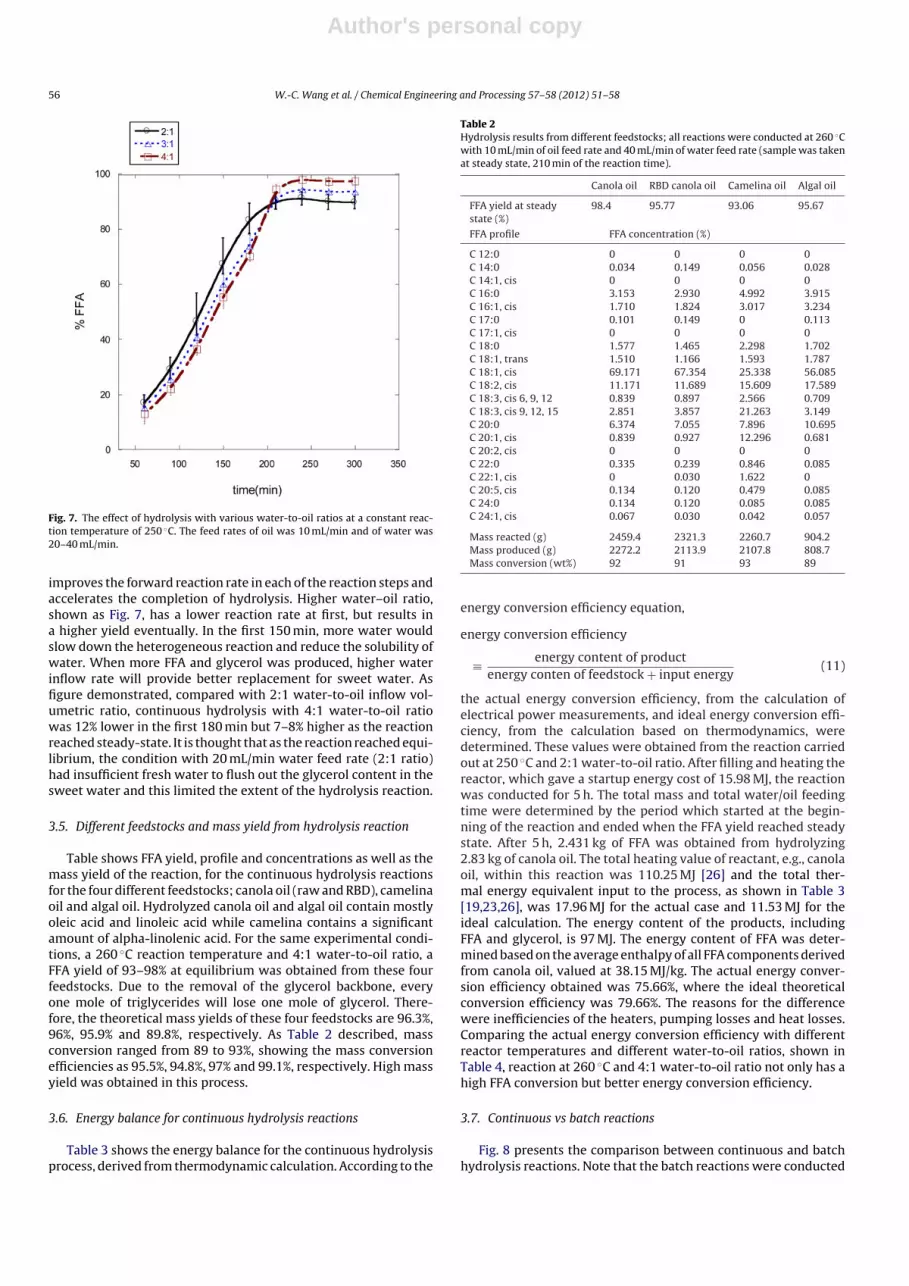
Fig. 7. The effect of hydrolysis with various water-to-oil ratios at a constant reac-tion temperature of 250 ◦C. The feed rates of oil was 10 mL/min and of water was20–40 mL/min.
improves the forward reaction rate in each of the reaction steps andaccelerates the completion of hydrolysis. Higher water–oil ratio,shown as Fig. 7, has a lower reaction rate at first, but results ina higher yield eventually. In the first 150 min, more water wouldslow down the heterogeneous reaction and reduce the solubility ofwater. When more FFA and glycerol was produced, higher waterinflow rate will provide better replacement for sweet water. Asfigure demonstrated, compared with 2:1 water-to-oil inflow vol-umetric ratio, continuous hydrolysis with 4:1 water-to-oil ratiowas 12% lower in the first 180 min but 7–8% higher as the reactionreached steady-state. It is thought that as the reaction reached equi-librium, the condition with 20 mL/min water feed rate (2:1 ratio)had insufficient fresh water to flush out the glycerol content in thesweet water and this limited the extent of the hydrolysis reaction.
3.5. Different feedstocks and mass yield from hydrolysis reaction
Table shows FFA yield, profile and concentrations as well as themass yield of the reaction, for the continuous hydrolysis reactionsfor the four different feedstocks; canola oil (raw and RBD), camelinaoil and algal oil. Hydrolyzed canola oil and algal oil contain mostlyoleic acid and linoleic acid while camelina contains a significantamount of alpha-linolenic acid. For the same experimental condi-tions, a 260 ◦C reaction temperature and 4:1 water-to-oil ratio, aFFA yield of 93–98% at equilibrium was obtained from these fourfeedstocks. Due to the removal of the glycerol backbone, everyone mole of triglycerides will lose one mole of glycerol. There-fore, the theoretical mass yields of these four feedstocks are 96.3%,96%, 95.9% and 89.8%, respectively. As Table 2 described, massconversion ranged from 89 to 93%, showing the mass conversionefficiencies as 95.5%, 94.8%, 97% and 99.1%, respectively. High massyield was obtained in this process.
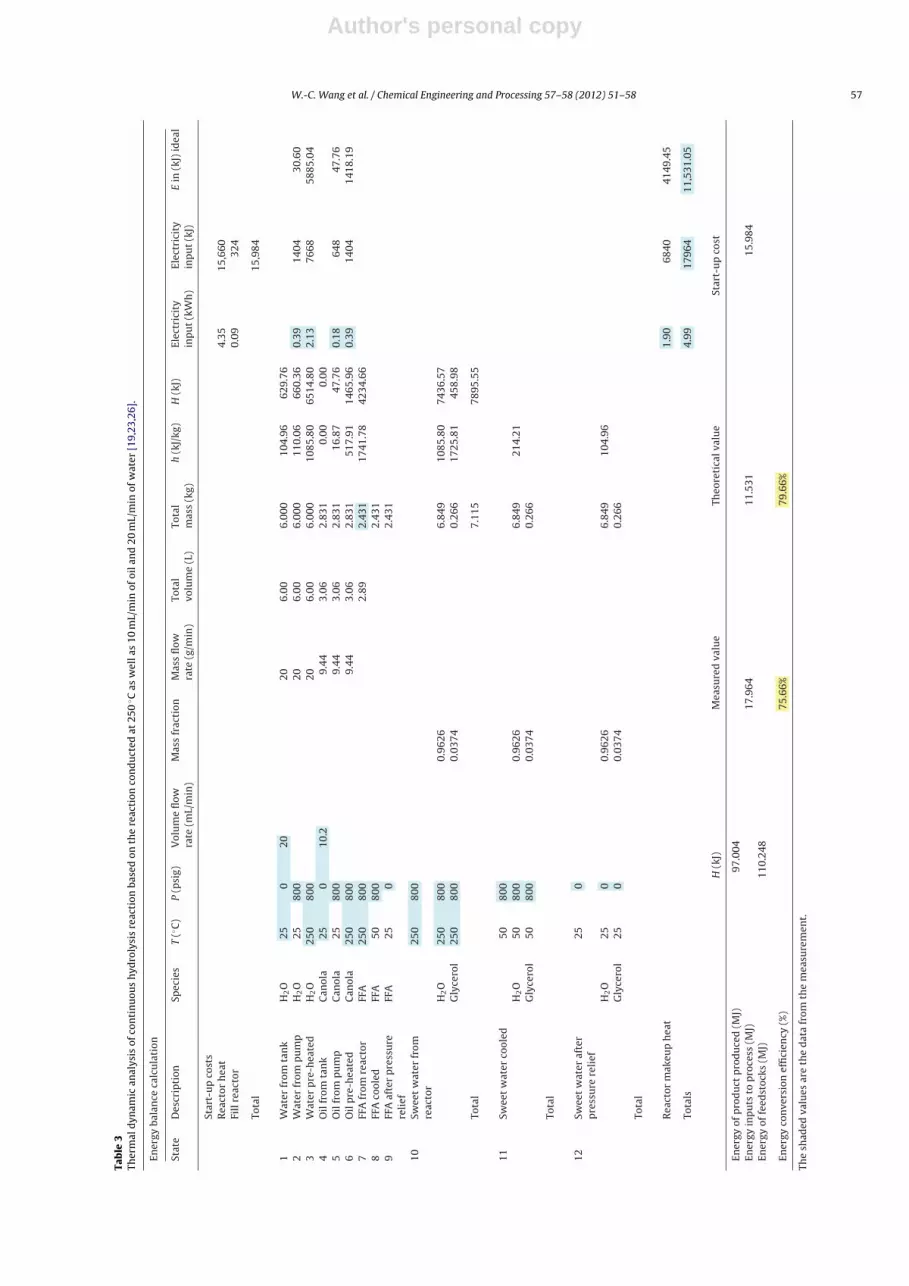
3.6. Energy balance for continuous hydrolysis reactions
Table 3 shows the energy balance for the continuous hydrolysisprocess, derived from thermodynamic calculation. According to the
Table 2Hydrolysis results from different feedstocks; all reactions were conducted at 260 ◦Cwith 10 mL/min of oil feed rate and 40 mL/min of water feed rate (sample was takenat steady state, 210 min of the reaction time).
Mass reacted (g) 2459.4 2321.3 2260.7 904.2Mass produced (g) 2272.2 2113.9 2107.8 808.7Mass conversion (wt%) 92 91 93 89
energy conversion efficiency equation,
energy conversion efficiency
≡ energy content of productenergy conten of feedstock + input energy
(11)
the actual energy conversion efficiency, from the calculation ofelectrical power measurements, and ideal energy conversion effi-ciency, from the calculation based on thermodynamics, weredetermined. These values were obtained from the reaction carriedout at 250 ◦C and 2:1 water-to-oil ratio. After filling and heating thereactor, which gave a startup energy cost of 15.98 MJ, the reactionwas conducted for 5 h. The total mass and total water/oil feedingtime were determined by the period which started at the begin-ning of the reaction and ended when the FFA yield reached steadystate. After 5 h, 2.431 kg of FFA was obtained from hydrolyzing2.83 kg of canola oil. The total heating value of reactant, e.g., canolaoil, within this reaction was 110.25 MJ [26] and the total ther-mal energy equivalent input to the process, as shown in Table 3[19,23,26], was 17.96 MJ for the actual case and 11.53 MJ for theideal calculation. The energy content of the products, includingFFA and glycerol, is 97 MJ. The energy content of FFA was deter-mined based on the average enthalpy of all FFA components derivedfrom canola oil, valued at 38.15 MJ/kg. The actual energy conver-sion efficiency obtained was 75.66%, where the ideal theoreticalconversion efficiency was 79.66%. The reasons for the differencewere inefficiencies of the heaters, pumping losses and heat losses.Comparing the actual energy conversion efficiency with differentreactor temperatures and different water-to-oil ratios, shown inTable 4, reaction at 260 ◦C and 4:1 water-to-oil ratio not only has ahigh FFA conversion but better energy conversion efficiency.
3.7. Continuous vs batch reactions
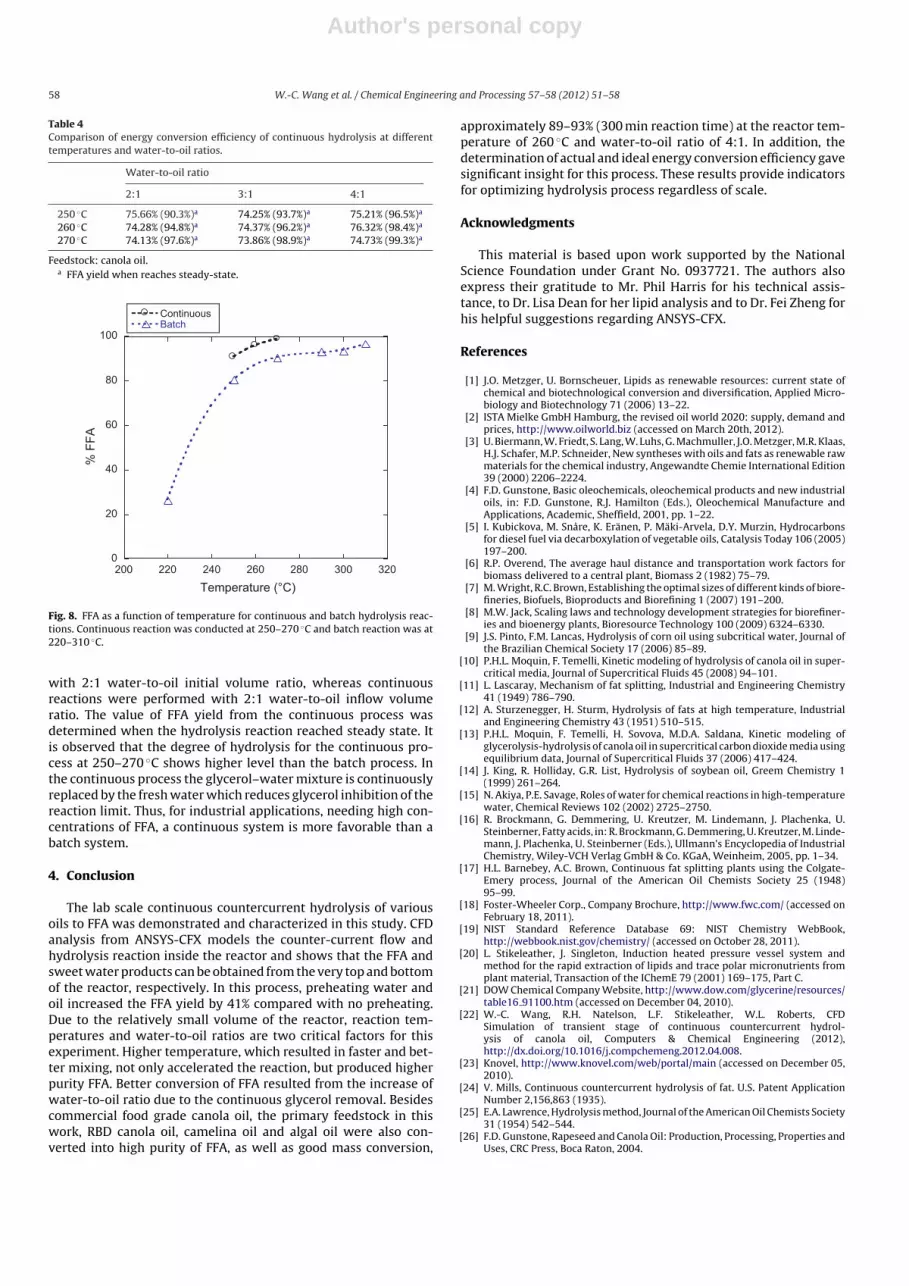
Fig. 8 presents the comparison between continuous and batchhydrolysis reactions. Note that the batch reactions were conducted
Author's personal copy
W.-C. Wang et al. / Chemical Engineering and Processing 57– 58 (2012) 51– 58 57
Tab
le
3Th
erm
al
dyn
amic
anal
ysis
of
con
tin
uou
s
hyd
roly
sis
reac
tion
base
d
on
the
reac
tion
con
du
cted
at
250
◦ C
as
wel
l as
10
mL/
min
of
oil a
nd
20
mL/
min
of
wat
er
[19,
23,2
6].
Ener
gy
bala
nce
calc
ula
tion
Stat
e
Des
crip
tion
Spec
ies
T
(◦ C)
P
(psi
g)
Vol
um
e
flow
rate
(mL/
min
)M
ass
frac
tion
Mas
s
flow
rate
(g/m
in)
Tota
lvo
lum
e
(L)
Tota
lm
ass
(kg)
h
(kJ/
kg)
H
(kJ)
Elec
tric
ity
inp
ut
(kW
h)
Elec
tric
ity
inp
ut
(kJ)
E in
(kJ)
idea
l
Star
t-u
p
cost
sR
eact
or
hea
t4.
35
15,6
60Fi
ll
reac
tor
0.09
324
Tota
l
15,9
84
1
Wat
er
from
tan
k
H2O
25
0
20
20
6.00
6.00
0
104.
96
629.
762
Wat
er
from
pu
mp
H2O
25
800
20
6.00
6.00
0
110.
06
660.
36
0.39
1404
30.6
03
Wat
er
pre
-hea
ted
H2O
250
800
20
6.00
6.00
0
1085
.80
6514
.80
2.13
7668
5885
.04
4
Oil
from
tan
k
Can
ola
25
0
10.2
9.44
3.06
2.83
1
0.00
0.00
5
Oil
from
pu
mp
Can
ola
25
800
9.44
3.06
2.83
1
16.8
7
47.7
6
0.18
648
47.7
66
Oil
pre
-hea
ted
Can
ola
250
800
9.44
3.06
2.83
1
517.
91
1465
.96
0.39
1404
1418
.19
7
FFA
from
reac
tor
FFA
250
800
2.89
2.43
1
1741
.78
4234
.66
8
FFA
cool
ed
FFA
50
800
2.43
19
FFA
afte
r
pre
ssu
rere
lief
FFA
25
0
2.43
1
10
Swee
t
wat
er
from
reac
tor
250
800
H2O
250
800
0.96
26
6.84
9
1085
.80
7436
.57
Gly
cero
l25
0
800
0.03
74
0.26
6
1725
.81
458.
98
Tota
l
7.11
5
7895
.55
11
Swee
t
wat
er
cool
ed
50
800
H2O
50
800
0.96
26
6.84
9
214.
21G
lyce
rol
50
800
0.03
74
0.26
6
Tota
l
12
Swee
t
wat
er
afte
rp
ress
ure
reli
ef25
0
H2O
25
0
0.96
26
6.84
9
104.
96G
lyce
rol
25
0
0.03
74
0.26
6
Tota
l
Rea
ctor
mak
eup
hea
t
1.90
6840
4149
.45
Tota
ls
4.99
1796
4
11,5
31.0
5
H
(kJ)
Mea
sure
d
valu
e
Theo
reti
cal v
alu
e
Star
t-u
p
cost
Ener
gy
of
pro
du
ct
pro
du
ced
(MJ)
97.0
04En
ergy
inp
uts
to
pro
cess
(MJ)
17.9
64
11.5
31
15.9
84En
ergy
of
feed
stoc
ks
(MJ)
110.
248
Ener
gy
con
vers
ion
effi
cien
cy
(%)
75.6
6%
79.6
6%
The
shad
ed
valu
es
are
the
dat
a
from
the
mea
sure
men
t.
Author's personal copy
58 W.-C. Wang et al. / Chemical Engineering and Processing 57– 58 (2012) 51– 58
Table 4Comparison of energy conversion efficiency of continuous hydrolysis at differenttemperatures and water-to-oil ratios.
Feedstock: canola oil.a FFA yield when reaches steady-state.
0
20
40
60
80
100
200 220 240 260 280 300 320
Continuous Batch
% F
FA
Temperature (°C)
Fig. 8. FFA as a function of temperature for continuous and batch hydrolysis reac-tions. Continuous reaction was conducted at 250–270 ◦C and batch reaction was at220–310 ◦C.
with 2:1 water-to-oil initial volume ratio, whereas continuousreactions were performed with 2:1 water-to-oil inflow volumeratio. The value of FFA yield from the continuous process wasdetermined when the hydrolysis reaction reached steady state. Itis observed that the degree of hydrolysis for the continuous pro-cess at 250–270 ◦C shows higher level than the batch process. Inthe continuous process the glycerol–water mixture is continuouslyreplaced by the fresh water which reduces glycerol inhibition of thereaction limit. Thus, for industrial applications, needing high con-centrations of FFA, a continuous system is more favorable than abatch system.
4. Conclusion
The lab scale continuous countercurrent hydrolysis of variousoils to FFA was demonstrated and characterized in this study. CFDanalysis from ANSYS-CFX models the counter-current flow andhydrolysis reaction inside the reactor and shows that the FFA andsweet water products can be obtained from the very top and bottomof the reactor, respectively. In this process, preheating water andoil increased the FFA yield by 41% compared with no preheating.Due to the relatively small volume of the reactor, reaction tem-peratures and water-to-oil ratios are two critical factors for thisexperiment. Higher temperature, which resulted in faster and bet-ter mixing, not only accelerated the reaction, but produced higherpurity FFA. Better conversion of FFA resulted from the increase ofwater-to-oil ratio due to the continuous glycerol removal. Besidescommercial food grade canola oil, the primary feedstock in thiswork, RBD canola oil, camelina oil and algal oil were also con-verted into high purity of FFA, as well as good mass conversion,
approximately 89–93% (300 min reaction time) at the reactor tem-perature of 260 ◦C and water-to-oil ratio of 4:1. In addition, thedetermination of actual and ideal energy conversion efficiency gavesignificant insight for this process. These results provide indicatorsfor optimizing hydrolysis process regardless of scale.
Acknowledgments
This material is based upon work supported by the NationalScience Foundation under Grant No. 0937721. The authors alsoexpress their gratitude to Mr. Phil Harris for his technical assis-tance, to Dr. Lisa Dean for her lipid analysis and to Dr. Fei Zheng forhis helpful suggestions regarding ANSYS-CFX.
References
[1] J.O. Metzger, U. Bornscheuer, Lipids as renewable resources: current state ofchemical and biotechnological conversion and diversification, Applied Micro-biology and Biotechnology 71 (2006) 13–22.
[2] ISTA Mielke GmbH Hamburg, the revised oil world 2020: supply, demand andprices, http://www.oilworld.biz (accessed on March 20th, 2012).
[3] U. Biermann, W. Friedt, S. Lang, W. Luhs, G. Machmuller, J.O. Metzger, M.R. Klaas,H.J. Schafer, M.P. Schneider, New syntheses with oils and fats as renewable rawmaterials for the chemical industry, Angewandte Chemie International Edition39 (2000) 2206–2224.
[4] F.D. Gunstone, Basic oleochemicals, oleochemical products and new industrialoils, in: F.D. Gunstone, R.J. Hamilton (Eds.), Oleochemical Manufacture andApplications, Academic, Sheffield, 2001, pp. 1–22.
[5] I. Kubickova, M. Snåre, K. Eränen, P. Mäki-Arvela, D.Y. Murzin, Hydrocarbonsfor diesel fuel via decarboxylation of vegetable oils, Catalysis Today 106 (2005)197–200.
[6] R.P. Overend, The average haul distance and transportation work factors forbiomass delivered to a central plant, Biomass 2 (1982) 75–79.
[7] M. Wright, R.C. Brown, Establishing the optimal sizes of different kinds of biore-fineries, Biofuels, Bioproducts and Biorefining 1 (2007) 191–200.
[8] M.W. Jack, Scaling laws and technology development strategies for biorefiner-ies and bioenergy plants, Bioresource Technology 100 (2009) 6324–6330.
[9] J.S. Pinto, F.M. Lancas, Hydrolysis of corn oil using subcritical water, Journal ofthe Brazilian Chemical Society 17 (2006) 85–89.
[10] P.H.L. Moquin, F. Temelli, Kinetic modeling of hydrolysis of canola oil in super-critical media, Journal of Supercritical Fluids 45 (2008) 94–101.
[11] L. Lascaray, Mechanism of fat splitting, Industrial and Engineering Chemistry41 (1949) 786–790.
[12] A. Sturzenegger, H. Sturm, Hydrolysis of fats at high temperature, Industrialand Engineering Chemistry 43 (1951) 510–515.
[13] P.H.L. Moquin, F. Temelli, H. Sovova, M.D.A. Saldana, Kinetic modeling ofglycerolysis-hydrolysis of canola oil in supercritical carbon dioxide media usingequilibrium data, Journal of Supercritical Fluids 37 (2006) 417–424.
[14] J. King, R. Holliday, G.R. List, Hydrolysis of soybean oil, Greem Chemistry 1(1999) 261–264.
[15] N. Akiya, P.E. Savage, Roles of water for chemical reactions in high-temperaturewater, Chemical Reviews 102 (2002) 2725–2750.
[16] R. Brockmann, G. Demmering, U. Kreutzer, M. Lindemann, J. Plachenka, U.Steinberner, Fatty acids, in: R. Brockmann, G. Demmering, U. Kreutzer, M. Linde-mann, J. Plachenka, U. Steinberner (Eds.), Ullmann’s Encyclopedia of IndustrialChemistry, Wiley-VCH Verlag GmbH & Co. KGaA, Weinheim, 2005, pp. 1–34.
[17] H.L. Barnebey, A.C. Brown, Continuous fat splitting plants using the Colgate-Emery process, Journal of the American Oil Chemists Society 25 (1948)95–99.
[18] Foster-Wheeler Corp., Company Brochure, http://www.fwc.com/ (accessed onFebruary 18, 2011).
[19] NIST Standard Reference Database 69: NIST Chemistry WebBook,http://webbook.nist.gov/chemistry/ (accessed on October 28, 2011).
[20] L. Stikeleather, J. Singleton, Induction heated pressure vessel system andmethod for the rapid extraction of lipids and trace polar micronutrients fromplant material, Transaction of the IChemE 79 (2001) 169–175, Part C.
[21] DOW Chemical Company Website, http://www.dow.com/glycerine/resources/table16 91100.htm (accessed on December 04, 2010).
[22] W.-C. Wang, R.H. Natelson, L.F. Stikeleather, W.L. Roberts, CFDSimulation of transient stage of continuous countercurrent hydrol-ysis of canola oil, Computers & Chemical Engineering (2012),http://dx.doi.org/10.1016/j.compchemeng.2012.04.008.
[23] Knovel, http://www.knovel.com/web/portal/main (accessed on December 05,2010).
[24] V. Mills, Continuous countercurrent hydrolysis of fat. U.S. Patent ApplicationNumber 2,156,863 (1935).
[25] E.A. Lawrence, Hydrolysis method, Journal of the American Oil Chemists Society31 (1954) 542–544.