PLEASE SCROLL DOWN FOR ARTICLE
This article was downloaded by: [Lupi, Francesca Romana]On: 6 October 2010Access details: Access Details: [subscription number 927643839]Publisher Taylor & FrancisInforma Ltd Registered in England and Wales Registered Number: 1072954 Registered office: Mortimer House, 37-41 Mortimer Street, London W1T 3JH, UK
Energy Sources, Part A: Recovery, Utilization, and Environmental EffectsPublication details, including instructions for authors and subscription information:http://www.informaworld.com/smpp/title~content=t713770930
Rheological Study of O/W Concentrated Model Emulsions for HeavyCrude Oil TransportationD. Gabrielea; M. Miglioria; F. R. Lupia; B. De Cindioa
a Department of Engineering Modelling, University of Calabria, Rende, Italy
Online publication date: 05 October 2010
To cite this Article Gabriele, D. , Migliori, M. , Lupi, F. R. and De Cindio, B.(2011) 'Rheological Study of O/WConcentrated Model Emulsions for Heavy Crude Oil Transportation', Energy Sources, Part A: Recovery, Utilization, andEnvironmental Effects, 33: 1, 72 — 79To link to this Article: DOI: 10.1080/15567030902937283URL: http://dx.doi.org/10.1080/15567030902937283
Full terms and conditions of use: http://www.informaworld.com/terms-and-conditions-of-access.pdf
This article may be used for research, teaching and private study purposes. Any substantial orsystematic reproduction, re-distribution, re-selling, loan or sub-licensing, systematic supply ordistribution in any form to anyone is expressly forbidden.
The publisher does not give any warranty express or implied or make any representation that the contentswill be complete or accurate or up to date. The accuracy of any instructions, formulae and drug dosesshould be independently verified with primary sources. The publisher shall not be liable for any loss,actions, claims, proceedings, demand or costs or damages whatsoever or howsoever caused arising directlyor indirectly in connection with or arising out of the use of this material.
Energy Sources, Part A, 33:72–79, 2011
Copyright © Taylor & Francis Group, LLC
ISSN: 1556-7036 print/1556-7230 online
DOI: 10.1080/15567030902937283
Rheological Study of O/W Concentrated Model
Emulsions for Heavy Crude Oil Transportation
D. GABRIELE,1 M. MIGLIORI,1 F. R. LUPI,1 and
B. DE CINDIO1
1University of Calabria, Department of Engineering Modelling, Rende, Italy
Abstract The oil-in-water emulsion is increasing in popularity as a cost-reducing
method for “heavy” crude oil transportation. In order to analyze the effect of oil-in-water ratio and emulsifier amount on the viscosity of the final emulsion, concentrated
model-emulsion of oil-in-water were rheologically characterized. Two emulsificationmethods were investigated: batch and “in-flow” in a lab scale plant. Comparison
revealed the effect of the emulsifier amount both on the viscosity decay during timeand on the final emulsion viscosity. Qualitative microscopy results revealed a rather
wide drop size distribution for systems exhibiting a lower viscosity value.
Keywords crude oil, emulsifier effect, flow emulsification, O/W emulsion viscosity,rheology
1. Introduction
The preparation of crude oil in water emulsion is one of the methods used to decrease
the fluid viscosity for crude oil transportation in pipelines (Saniere et al., 2004). Emulsi-
fication can decrease the viscosity of crude oil, reducing pressure drop in pipelines as a
consequence. Nevertheless, the study of formation and characterization of crude oil-water
emulsion is still an interesting topic to be exploited, in the view of industrial application.
Viscosity of heavy oils may widely range from 0.1 to 100 Pa � s�1 (Ahmed et al., 1999;
Quiñones-Cisneros et al., 2005), also showing shear thinning behavior, depending upon
type and amount of minor components (such as waxes, resins, asphaltenes, sand, or
eventually hydrates). In the view of a systemic approach of the rheology of heavy oil
O/W emulsion, it would be useful to set up a “model oily” phase, based on standard
oil and accounting for relevant viscosity effect (including waxes, asphaltenes, and solid
particles), to be used as a test material in a bench scale test. Packing degree, droplet size,
and distribution of disperse phase strongly affect the viscosity; thus, the control of the
rheological behavior of emulsions becomes rather crucial (Pal, 2000). In this concern,
this article shows results of oil-in-water (O/W) emulsion of a base oil having a Newtonian
viscosity comparable to that of heavy oil without any additive component. Viscosity data
of O/W emulsion, prepared using hydrophilic nonionic emulsifier (Yaghi and Al-Bemani,
2002), are obtained either from batch preparation or from an emulsifying loop, a lab scale
loop-plant aiming at reproducing flow emulsification process on a small scale. Different
emulsifier amounts and O/W ratios are investigated in terms of either emulsion viscosity
or “in-flow” emulsion formation.
Address correspondence to Massimo Migliori, University of Calabria, Department of Engi-neering Modelling, Via P. Bucci Cubo 39c, Rende 87036, Italy. E-mail: [email protected]
72
Downloaded By: [Lupi, Francesca Romana] At: 08:22 6 October 2010
Rheology of Heavy Crude O/W Concentrated Emulsions 73
2. Materials and Methods
2.1. Materials
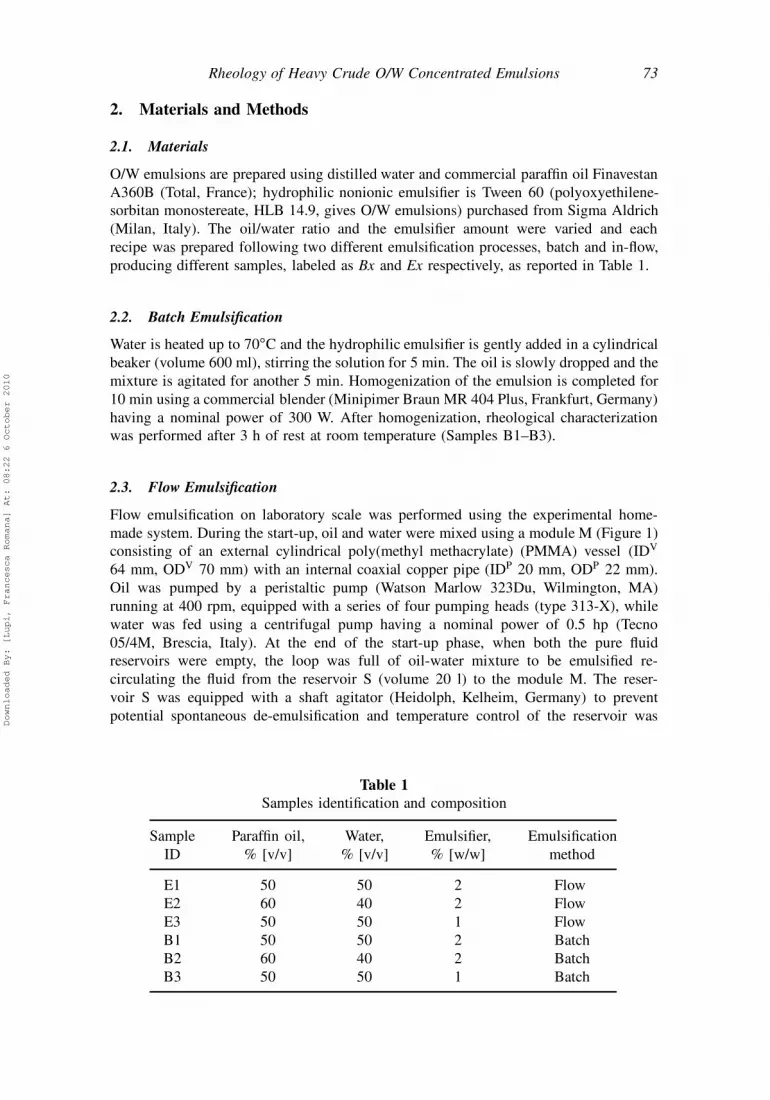
O/W emulsions are prepared using distilled water and commercial paraffin oil Finavestan
A360B (Total, France); hydrophilic nonionic emulsifier is Tween 60 (polyoxyethilene-
sorbitan monostereate, HLB 14.9, gives O/W emulsions) purchased from Sigma Aldrich
(Milan, Italy). The oil/water ratio and the emulsifier amount were varied and each
recipe was prepared following two different emulsification processes, batch and in-flow,
producing different samples, labeled as Bx and Ex respectively, as reported in Table 1.
2.2. Batch Emulsification
Water is heated up to 70ıC and the hydrophilic emulsifier is gently added in a cylindrical
beaker (volume 600 ml), stirring the solution for 5 min. The oil is slowly dropped and the
mixture is agitated for another 5 min. Homogenization of the emulsion is completed for
10 min using a commercial blender (Minipimer Braun MR 404 Plus, Frankfurt, Germany)
having a nominal power of 300 W. After homogenization, rheological characterization
was performed after 3 h of rest at room temperature (Samples B1–B3).
2.3. Flow Emulsification
Flow emulsification on laboratory scale was performed using the experimental home-
made system. During the start-up, oil and water were mixed using a module M (Figure 1)
consisting of an external cylindrical poly(methyl methacrylate) (PMMA) vessel (IDV
64 mm, ODV 70 mm) with an internal coaxial copper pipe (IDP 20 mm, ODP 22 mm).
Oil was pumped by a peristaltic pump (Watson Marlow 323Du, Wilmington, MA)
running at 400 rpm, equipped with a series of four pumping heads (type 313-X), while
water was fed using a centrifugal pump having a nominal power of 0.5 hp (Tecno
05/4M, Brescia, Italy). At the end of the start-up phase, when both the pure fluid
reservoirs were empty, the loop was full of oil-water mixture to be emulsified re-
circulating the fluid from the reservoir S (volume 20 l) to the module M. The reser-
voir S was equipped with a shaft agitator (Heidolph, Kelheim, Germany) to prevent
potential spontaneous de-emulsification and temperature control of the reservoir was
Table 1
Samples identification and composition
Sample
ID
Paraffin oil,
% [v/v]
Water,
% [v/v]
Emulsifier,
% [w/w]
Emulsification
method
E1 50 50 2 Flow
E2 60 40 2 Flow
E3 50 50 1 Flow
B1 50 50 2 Batch
B2 60 40 2 Batch
B3 50 50 1 Batch
Downloaded By: [Lupi, Francesca Romana] At: 08:22 6 October 2010
74 D. Gabriele et al.
Figure 1. Plant flowsheet.
guaranteed by cold water (15ıC) flowing in a coil from a thermostatic bath TC (Neslab,
Newington, NH). PP1 and PP2 pipelines (length 3.73 m and 1.75 m, respectively), were
made of Rilsan® (ID 10 mm). The sampling for rheological test was performed from
the reservoir S at different times (measured from start-up end on) as reported in Table 2
(Px samples), and for contrast phase microscopy tests (Leica DHIL, Solms, Germany) as
reported in Table 3 (Mx samples).
2.4. Rheological Characterization
Flow curves were obtained using a controlled strain rheometer ARES-RFS (TA Instru-
ment, New Castle, DE) equipped with a Couette cylinder geometry (internal bob diameter
32 mm, gap 1 mm). The shear rate range was 0.1–100 s�1 except when higher shear
rates (at least 1 s�1) were required to measure torque values within the instrument limits
(from 2 � 10�7 N � m to 0.1 N � m). Temperature was set at 25ıC using a thermostatic
bath (Julabo, San Diego, CA). Preliminary “step shear rate” test at 0.1 s�1 or 1 s�1, was
Table 2
Sampling time (min) for rheological
measurement (P) and for microscopy test (M)
during in-flow emulsification test
Sampling
label E1 E2 E3
P1 2 5 3
P2 15 19 16
P3 80 34 29
P4 180 185 100
M1 15 19 16
M2 80 46 29
M3 180 185 100
Start up time 5 4 5
Downloaded By: [Lupi, Francesca Romana] At: 08:22 6 October 2010
Rheology of Heavy Crude O/W Concentrated Emulsions 75
Table 3
Plateau viscosity of different in-flow
emulsification test
Sample
Viscosity,
Pa � s
Std. Dev.,
Pa � s
E1 (P4) 0.0083 0.0004
B1 0.0119 0.0005
E2 (P4) 0.0144 0.0002
B2 0.03055 0.0005
E3 (P4) 0.0107 0.0009
B3 0.0106 0.0003
performed to evaluate the time needed to reach the steady state before measurement. For
all samples, a time of 20 s was found to be sufficient to reach the time independent
viscosity value and steady shear viscosity was averaged over 10 s sampling time.
3. Results and Discussion
3.1. Rheological Test
The flow curves of batch preparation and of the samples collected during the in-flow
emulsification test are shown in Figures 2–4. Each plot also includes the constant viscosity
of pure paraffin oil (measured value 0.1570 ˙ 0.0002 Pa � s). Batch emulsions Bx
exhibited a constant viscosity in the investigated shear rate range. When the oil/water
Figure 2. Flow curve for test E1 compared to pure oil and batch emulsion.
Downloaded By: [Lupi, Francesca Romana] At: 08:22 6 October 2010
76 D. Gabriele et al.
Figure 3. Flow curve for test E2 compared to pure oil and batch emulsion.
ratio is considered (sample B1 and B2), a nonlinear increase in viscosity was observed
when increasing the oil fraction. As for the emulsifier effect (samples B1 and B3), a
decrease in viscosity was found when decreasing the emulsifier amount (Yaghi and Al-
Bemani, 2002). Indeed, it is known that a lower amount of emulsifier leads to bigger
droplets (with a lower surface to volume ratio) (Barnes, 2000) and, therefore, to lower
viscosity values as confirmed by some open literature finding (Ford et al., 1997). Referring
to the loop test, a marked time-dependence of the viscosity for early samples was found.
Figure 4. Flow curves for test E3 compared to paraffin oil and batch test.
Downloaded By: [Lupi, Francesca Romana] At: 08:22 6 October 2010
Rheology of Heavy Crude O/W Concentrated Emulsions 77
Moreover, as a result of the progressive emulsification process, the viscosity data showed
a less pronounced shear rate dependence when the emulsification time was increased
(i.e., residence time into the loop). It is noteworthy that within the investigated O/W
ratio range, emulsions show an apparent Newtonian behavior when samples are fully
emulsified (Pal, 2000; Romero et al., 2002). On the contrary, at the same O/W ratio, during
emulsification process, a shear rate-dependent behavior indicates a partial emulsification,
leading to an “apparent” time dependent behavior due to flow instability. Therefore,
referring to “in-flow” tests, samples showing shear rate-dependence of viscosity cannot be
quantitatively analyzed (samples P1–P3) and our analysis refers only to fully emulsified
material (samples P4) in comparison to batch samples (Table 3).
From Figure 2 it can be seen that for Sample E1 the “in-flow” test viscosity
value under-crossed the batch test value B1. This evidence can be explained because
viscosity is very sensitive to drop size distribution (Ford et al., 1997) and the average
drop size distribution in the “in-flow” test can be less narrow than that of the batch-
emulsification one. Drops of different dimensions allow a better dispersed phase packing
and, therefore, viscosity decreases below the batch sample value (Barnes, 2000), and
the observed viscosity decrease could be ascribed to the increased drop dimension (Ford
et al., 1997) due to coalescence phenomena induced by the shear effect during “in-flow”
test (Al-Mulla and Gupta, 2000). The analysis of E2 (oil-water ratio higher than E1) in
Figure 3 confirms this trend, with a final viscosity value greater than sample E1. On
the contrary, when the E3 sample is considered (lower emulsifier content than E1) in
Figure 4, an opposite behavior is observed: the plateau value of the viscosity (P4 after
100 min) did not significantly drop down to that of the batch sample, showing that with
the decrease of the emulsifiers amount, no significant effects are observed when changing
the emulsification method. A different explanation may support this evidence: if the role
of the emulsifier is considered, a smaller amount (E3) accelerates the emulsification
process but, with the increase of emulsification time, any drop in the viscosity of the
emulsion E3 is observed. It is attributed to the fact that lower emulsification availability
does not allow any further change of the drop size distribution. Still, comparing of the
plateau viscosity during loop test (P4) and batch (Table 3), it can be observed that for
sample E1 batch viscosity is higher than that of the in-flow because of the effect of the
higher emulsifier content. Higher emulsifier content promotes oil dispersion, decreases
average diameter, and increases the apparent viscosity, also for low emulsification times,
such as in the batch preparation. On the contrary, when “in-flow” process is considered,
a shear-induced coalescence is promoted by the higher number of (small) droplets, and
widening of the drop size distribution causes the decrease of the emulsion apparent
viscosity. Moreover, emulsions prepared with a very high shear rate seem to be bimodal
(Hénaut et al., 2009).
3.2. Microscopy Data
The viscosity data and the trend can be confirmed by the qualitative analysis made by
contrast phase microscopy. Samples have been analyzed after their dilution in water
in a volumetric proportion equal to 1:10 to improve a better visualization of droplets.
Data are reported in Figure 5, where label M1-M3 refers to the sampling time reported
in Table 2. It can be seen that sample E1-M1 and E3-M1 showed more pronounced
aggregates of disperses phase; on the contrary, sample E2-M1 shows small oil droplets,
and E2 viscosity data are less shear rate-dependent also for early loop residence time
(sample E2-P1), if compared to samples E1 and E3 having higher W/O ratio. In addition,
Downloaded By: [Lupi, Francesca Romana] At: 08:22 6 October 2010
78 D. Gabriele et al.
Figure 5. Droplets distribution from contrast phase microscopy for different sampling time.
Control bar is 100 �m.
when the effect of the emulsifier is considered (E1-P4 vs. E3-P4), it has been found that
the plateau viscosity is higher when the emulsifier amount (Table 1) is reduced. This can
be explained (Figure 5), because of the coarse grain of emulsion E1-P4, as shown by the
microscopy sample E1-M3, if compared to E3-M3: the lower the emulsion average drop
diameter, the higher the apparent Newtonian viscosity is (Ford et al., 1997).
4. Conclusions
In this article, a rheological approach to the study of concentrated O/W emulsion for
heavy crude oil transportation in pipelines is shown, comparing results of a lab scale
“loop emulsification” process to batch preparation ones. A constant viscosity, as shear
rate function, was found for all batch samples and for “in-flow” emulsions at long times,
while during emulsification in the loop plant a shear thinning behavior was observed
and this effect was mainly ascribed to the wideness of the drop size distribution curve.
A comparison of flow test results, including flow curves and microscopy, for samples
at a different percentage of emulsifier or oil/water ratio, shows that larger amounts of
emulsifier during prolonged emulsification could lead to a broader drop size distribution
and a lower viscosity as a consequence in comparison to the same O/W ratio sample but
with half the emulsifier amount. Therefore, lower plateau viscosity values are obtained
when increasing the amount of emulsifier, enhancing the effect of a wider drop size
distribution.
Downloaded By: [Lupi, Francesca Romana] At: 08:22 6 October 2010
Rheology of Heavy Crude O/W Concentrated Emulsions 79
References
Ahmed, N. S., Nassar, A. M., Zaki, N. N., and Gharieb, H. K. 1999. Formation of fluid heavy
oil-in-water emulsions for pipeline transportation. Fuel 78:593–600.
Al-Mulla, A., and Gupta R. K. 2000. Droplet coalescence in the shear flow of model emulsions.
Rheologica Acta. 39:20–25.
Barnes, H. A. 2000. A Handbook of Elementary Rheology. Aberystwyth, U.K.: The University of
Wales Institute of Non-Newtonian Fluid Mechanics.
Ford, D. L., Borwankar, R., Martin, R. W., and Holcomb, D. N. 1997. Dressing and Sauces in
Food Emulsions, Friberg, S. E., and Larsson, K. (Eds.). New York: Marcel Dekker Inc.
Hénaut, I., Courbaron, A.-C., and Argillier, J. F. 2009. Viscosity of concentrated emulsions: Relative
effect of granulometry and multiphase morphology. Pet. Sci. & Tech. 27:182–196.
Pal, R. 2000. Shear viscosity behaviour of emulsions of two immiscible liquids. J. Colloid Interface
Sci. 225:359–366.
Quiñones-Cisneros, S. E., Andersen, S. I., and Creek, J. 2005. Density and viscosity modeling and
characterization of heavy oils. Energy Fuels 19:1314–1318.
Romero, N., Cárdenas, A., Henríquez, M., and Rivas, H. 2002. Viscoelastic properties and stability
of highly concentrated bitumen in water emulsions. Colloids & Surfaces A: Physicochem.
Eng. Aspects 204:271–284.
Saniere, A., Hénaut, I., and Argillier, J. F. 2004. Pipeline Transportation of Heavy Oils: A Strategic,
Economic and Technological Challenge. Oil Gas Sci. Tech. 59:455–465.
Yaghi, B. M., and Al-Bemani, A. 2002. Heavy crude oil viscosity reduction. Energy Sources
24:93–102.
Downloaded By: [Lupi, Francesca Romana] At: 08:22 6 October 2010