Quantification of unadsorbed protein and surfactant emulsifiers in oil-in-water emulsions Claire Berton, Claude Genot, Marie-Hélène Ropers ⇑ UR1268 Biopolymères Interactions Assemblages, INRA, F-44316 Nantes, France article info Article history: Received 23 September 2010 Accepted 18 November 2010 Available online 27 November 2010 Keywords: Protein Surfactant Unadsorbed emulsifiers Interface Oil-in-water emulsion abstract Unadsorbed emulsifiers affect the physical and chemical behaviour of oil-in-water (O/W) emulsions. A simple methodology to quantify unadsorbed emulsifiers in the aqueous phase of O/W emulsions has been developed. Emulsions were centrifuged and filtered to separate the aqueous phase from the oil droplets and the concentration of unadsorbed emulsifiers in the aqueous phase determined. The quantification of unadsorbed surfactants based on the direct transesterification of their fatty acids was validated for Tween 20, Tween 80, citric acid ester (Citrem), Span 20 and monolauroyl glycerol. To determine unadsorbed proteins, results obtained with Folin–Ciocalteu reagent or UV-spectrophotometry were compared on emulsions stabilized by b-lactoglobulin (BLG), b-casein (BCN) or bovine serum albumin (BSA). The first method gave more accurate results especially during aging of emulsions in oxidative conditions. The whole methodology was applied to emulsions stabilized with single or mixed emulsifiers. This approach enables optimization of emulsion formulations and could be useful to follow changes in the levels of unadsorbed emulsifiers during physical or chemical aging processes. Ó 2010 Elsevier Inc. All rights reserved. 1. Introduction Oil-in-water (O/W) emulsions are dispersed systems stabilized with surface-active molecules called emulsifiers. Several kinds of emulsifiers exist, including proteins, polymers, ionic and non-ionic surfactants [1]. Emulsifiers adsorb at the oil–water interface where they decrease the free energy of the system allowing its stabiliza- tion. However, only a part of the emulsifier is actually located at the interface. An unadsorbed fraction is present in the aqueous phase either as monomers or as aggregates such as micelles [2]. Although unadsorbed emulsifiers do not directly stabilize the oil droplets, they participate to the physical and chemical properties of the systems. For example, they induce the depletion flocculation of emulsions [3–6]. Unadsorbed proteins protect lipid droplets from oxidation by scavenging free radicals and chelating metal ions while unadsorbed surfactants interfere with lipid oxidation by forming micelles that can also solubilise fatty acids or hydroper- oxides [2,7–12]. Lipid oxidation in emulsions can affect the concentrations of emulsifiers at the interface due to the formation of oxidation products that take place at the interface [13]. The amount of unadsorbed emulsifiers may also evolve during incuba- tion of emulsions, which modifies the physical and chemical char- acteristics of the system [14–16]. It is therefore interesting to measure unadsorbed emulsifiers not only in freshly prepared emulsions, but also along the incubation period. However, measurements of unadsorbed emulsifiers are rarely undertaken when experiments related to lipid oxidation are carried out. Two main strategies have been developed to measure unad- sorbed emulsifiers. The first one consists in evaluating directly the unadsorbed fraction through in situ measurement of a physical parameter that is modified upon the emulsifier adsorption and quantitative calibration. Accordingly, front-face fluorimetry can be used to directly evaluate unadsorbed fraction of bovine serum albumin in dodecane emulsions [17]. Unfortunately, the fluores- cence characteristics of emulsions depends both on the oil and the protein used [18] and the method failed to be generalized. The second strategy to evaluate unadsorbed emulsifier consists in separating the aqueous phase from the oil droplets covered by the adsorbed emulsifier and to quantify the emulsifier in one or both phases. The oil droplets are generally separated through cen- trifugation at moderate speed rate [19]. This step can be performed directly if the size of the oil droplets is sufficient to allow their creaming. If the emulsion contains small size droplets with density very close to the density of the aqueous phase density, these drop- lets do not cream. They can be separated thanks to dilution of the emulsion in sucrose solution to increase the density of the aqueous phase prior centrifugation that is performed on sucrose gradient [14,20,21]. This procedure also allows avoiding the presence of remaining unadsorbed protein in the creamed phase. The emulsi- fier is then measured either in one phase only, or in both phases (aqueous phase and creamed layer), which makes possible to 0021-9797/$ - see front matter Ó 2010 Elsevier Inc. All rights reserved. doi:10.1016/j.jcis.2010.11.055 ⇑ Corresponding author. Fax: +33 2 40 67 50 84. E-mail address: [email protected](M.-H. Ropers). Journal of Colloid and Interface Science 354 (2011) 739–748 Contents lists available at ScienceDirect Journal of Colloid and Interface Science www.elsevier.com/locate/jcis
Transcript
Journal of Colloid and Interface Science 354 (2011) 739–748
Contents lists available at ScienceDirect
Journal of Colloid and Interface Science
www.elsevier .com/locate / jc is
Quantification of unadsorbed protein and surfactant emulsifiersin oil-in-water emulsions
Claire Berton, Claude Genot, Marie-Hélène Ropers ⇑UR1268 Biopolymères Interactions Assemblages, INRA, F-44316 Nantes, France
a r t i c l e i n f o
Article history:Received 23 September 2010Accepted 18 November 2010Available online 27 November 2010
Unadsorbed emulsifiers affect the physical and chemical behaviour of oil-in-water (O/W) emulsions. Asimple methodology to quantify unadsorbed emulsifiers in the aqueous phase of O/W emulsions has beendeveloped. Emulsions were centrifuged and filtered to separate the aqueous phase from the oil dropletsand the concentration of unadsorbed emulsifiers in the aqueous phase determined. The quantification ofunadsorbed surfactants based on the direct transesterification of their fatty acids was validated for Tween20, Tween 80, citric acid ester (Citrem), Span 20 and monolauroyl glycerol. To determine unadsorbedproteins, results obtained with Folin–Ciocalteu reagent or UV-spectrophotometry were compared onemulsions stabilized by b-lactoglobulin (BLG), b-casein (BCN) or bovine serum albumin (BSA). The firstmethod gave more accurate results especially during aging of emulsions in oxidative conditions. Thewhole methodology was applied to emulsions stabilized with single or mixed emulsifiers. This approachenables optimization of emulsion formulations and could be useful to follow changes in the levels ofunadsorbed emulsifiers during physical or chemical aging processes.
� 2010 Elsevier Inc. All rights reserved.
1. Introduction
Oil-in-water (O/W) emulsions are dispersed systems stabilizedwith surface-active molecules called emulsifiers. Several kinds ofemulsifiers exist, including proteins, polymers, ionic and non-ionicsurfactants [1]. Emulsifiers adsorb at the oil–water interface wherethey decrease the free energy of the system allowing its stabiliza-tion. However, only a part of the emulsifier is actually located atthe interface. An unadsorbed fraction is present in the aqueousphase either as monomers or as aggregates such as micelles [2].Although unadsorbed emulsifiers do not directly stabilize the oildroplets, they participate to the physical and chemical propertiesof the systems. For example, they induce the depletion flocculationof emulsions [3–6]. Unadsorbed proteins protect lipid dropletsfrom oxidation by scavenging free radicals and chelating metalions while unadsorbed surfactants interfere with lipid oxidationby forming micelles that can also solubilise fatty acids or hydroper-oxides [2,7–12]. Lipid oxidation in emulsions can affect theconcentrations of emulsifiers at the interface due to the formationof oxidation products that take place at the interface [13]. Theamount of unadsorbed emulsifiers may also evolve during incuba-tion of emulsions, which modifies the physical and chemical char-acteristics of the system [14–16]. It is therefore interesting tomeasure unadsorbed emulsifiers not only in freshly prepared
ll rights reserved.
r (M.-H. Ropers).
emulsions, but also along the incubation period. However,measurements of unadsorbed emulsifiers are rarely undertakenwhen experiments related to lipid oxidation are carried out.
Two main strategies have been developed to measure unad-sorbed emulsifiers. The first one consists in evaluating directlythe unadsorbed fraction through in situ measurement of a physicalparameter that is modified upon the emulsifier adsorption andquantitative calibration. Accordingly, front-face fluorimetry canbe used to directly evaluate unadsorbed fraction of bovine serumalbumin in dodecane emulsions [17]. Unfortunately, the fluores-cence characteristics of emulsions depends both on the oil andthe protein used [18] and the method failed to be generalized.The second strategy to evaluate unadsorbed emulsifier consistsin separating the aqueous phase from the oil droplets covered bythe adsorbed emulsifier and to quantify the emulsifier in one orboth phases. The oil droplets are generally separated through cen-trifugation at moderate speed rate [19]. This step can be performeddirectly if the size of the oil droplets is sufficient to allow theircreaming. If the emulsion contains small size droplets with densityvery close to the density of the aqueous phase density, these drop-lets do not cream. They can be separated thanks to dilution of theemulsion in sucrose solution to increase the density of the aqueousphase prior centrifugation that is performed on sucrose gradient[14,20,21]. This procedure also allows avoiding the presence ofremaining unadsorbed protein in the creamed phase. The emulsi-fier is then measured either in one phase only, or in both phases(aqueous phase and creamed layer), which makes possible to
740 C. Berton et al. / Journal of Colloid and Interface Science 354 (2011) 739–748
calculate mass balance. A technique employing sodium dodecylsulfate–polyacrylamide gel electrophoresis (SDS–PAGE) on thecreamed phase of O/W emulsions and photometric densitometryhas been developed to determine the amount and composition ofadsorbed and unadsorbed proteins [22].
The current methods to quantify emulsifiers in aqueous solu-tions must be distinguished for proteins and surfactants. For pro-teins, the most frequent methods are based on the presence ofaromatic amino acids (spectrophotometric quantification [23]; col-orimetric quantification [24]), basic and hydrophobic amino acids(Coomassie Blue method [25]), the reactivity of peptide bonds(Biuret or bicinchoninic acid reaction [26,27]) or the determinationof total nitrogen (Kjedahl method [28]). These methods are suitablefor mostly soluble proteins [29]. The methods to determine con-centrations of surfactants are chosen according to the charge ofthe molecules. The concentration of non-ionic surfactants aredetermined according to the methods of Brown and Hayes [30]Crabb and Persinger [31]. The charged surfactants can be both sep-arated and quantified according to the method of Im et al. [32].These methods require numerous extraction steps with organicsolvents or specific equipments.
Our objective was to develop a simple methodology allowingthe quantification of unadsorbed food-grade emulsifiers in theaqueous phase of O/W emulsions during their aging whateverthe underlying destabilization phenomena: physical aging (coales-cence) or chemical aging (lipid oxidation). For this purpose, meth-ods allowing the quantification of ester surfactants or proteinswere chosen and optimized, when necessary. Sequential separa-tion of the aqueous phase followed by specific measurement ofthe unadsorbed emulsifiers was developed, considering both theconvenience of the procedure and the possible interferences dueto the small oil droplets, or to the aging of the emulsion. The quan-tification methods were applied to emulsions stabilized with singleor mixed emulsifiers, which finally enabled to optimize the emul-sion formulation or to characterize the evolution of unadsorbedemulsifiers during incubation in oxidative conditions.
2. Materials and methods
2.1. Materials
Rapeseed oil was purchased in a local supermarket. It wasstripped by means of either alumina (MP Alumina N-Super I, MPBiomedicals, France) to eliminate impurities and tocopherols, orsilica (Florisil, Sigma Aldrich, France) to eliminate impurities whileretaining tocopherols. This solvent-free procedure was adaptedfrom Maldonado-Valderrama et al. [33]. Briefly, approximately15 ml sorbent and 30 ml oil were mixed in a 50 ml-polypropylenecentrifuge tube. The mixture was vigorously shaken and the tubeswere then rotated in the dark at 4 �C for 24 h. The tubes were thencentrifuged (Jouan GT 422 centrifuge, Jouan, Inc., Winchester, VA)for 20 min at 2000�g at 20 �C to separate sorbent from strippedoil. Stripped oil was collected, centrifuged again in the same condi-tions and finally kept into amber glass vials after being placed un-der nitrogen flow for 10 min. Vials were hermetically sealed andstored at �20 �C.
Bovine serum albumin (BSA) fraction V was obtained from MPBiomedicals. b-casein (BCN) (purity P 98%) was purchased fromLactalis. b-lactoglobulin (BLG, purity > 99%) was purified from wheyprotein isolate (Prolacta 90, Lactalis) by selective precipitation [34].Tween 20 (grade Sigma Ultra), Tween 80 (grade Sigma Ultra),monolauroyl glycerol (MLG), Span 20, PIPES (1,4-piperazinedie-thanesulfonic acid), sodium carbonate (Na2CO3), potassium sodiumtartrate (C4H4KNaO6, 4H2O), copper(II) sulfate (CuSO4), Folin–Ciocalteu’s phenol reagent, ethylenediaminetetraacetic acid (EDTA)and iron(II) sulfate (FeSO4) were purchased from Sigma Aldrich
(France). NaCl, sodium dodecyl sulfate (SDS), heptadecanoic acid(C17:0, purity P 99.0%, Mw = 270.5 g/mol) and methyl heptadecan-oate (purity P 99.5%, Mw = 284.5 g/mol) were purchased fromFluka Chemika (France). Sodium hydroxide (NaOH) was purchasedfrom Merck. Monoheptadecanoyl glycerol (purity P 99.0%, Mw =344.48 g/mol) was purchased from Nu-Chek-Prep (Elysian, MN). Astandard mixture of fatty acid methyl esters (Sigma Chemical Co.L9405) was used for fatty acid identification. Citric acid ester(Citrem) was obtained from Danisco (Grindsted, Denmark). Hexaneof HPLC grade, toluene, methanol and acetone of analytical grade,and sulphuric acid 96% were purchased from Carlo Erba (France).The buffer was composed of NaCl (80 mM) and PIPES (10 mM),and was adjusted at pH 6.7.
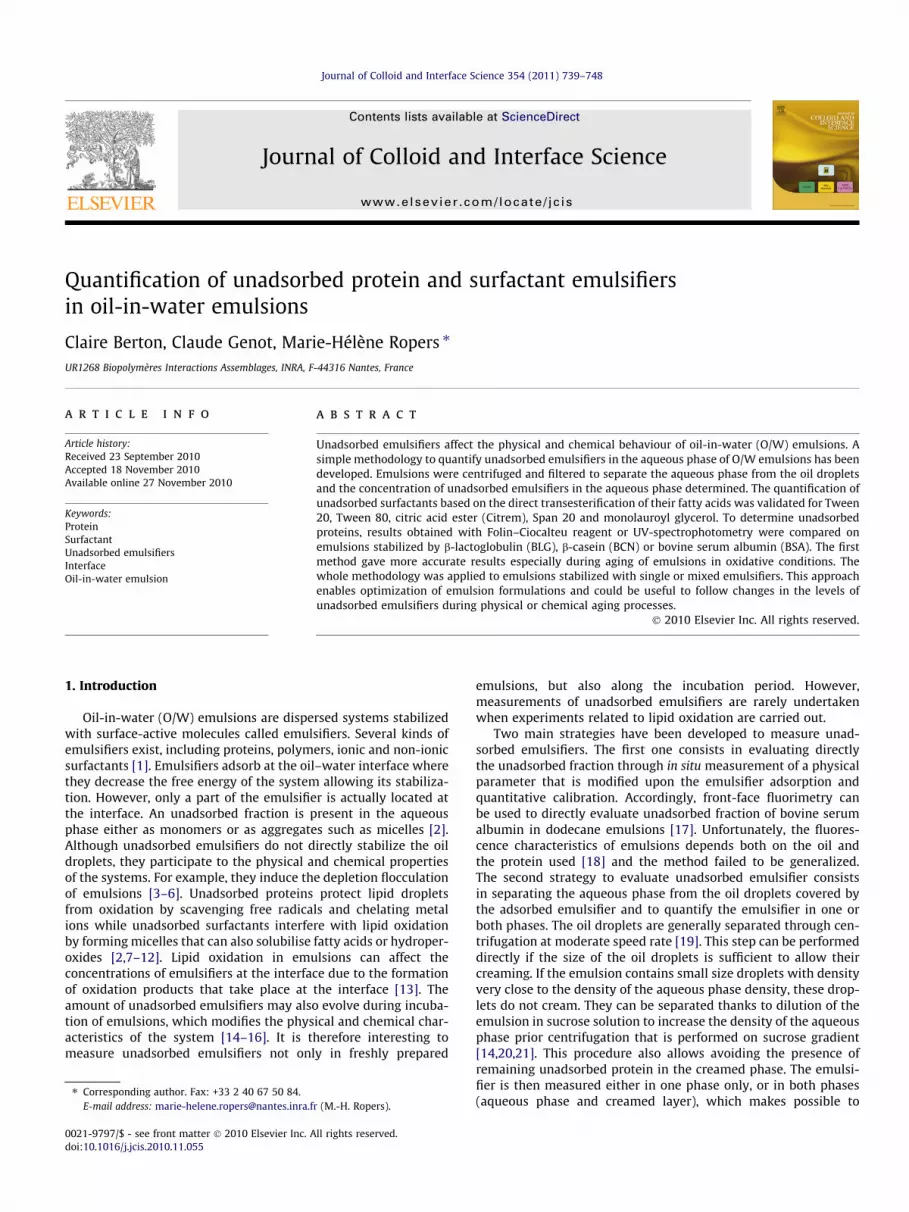
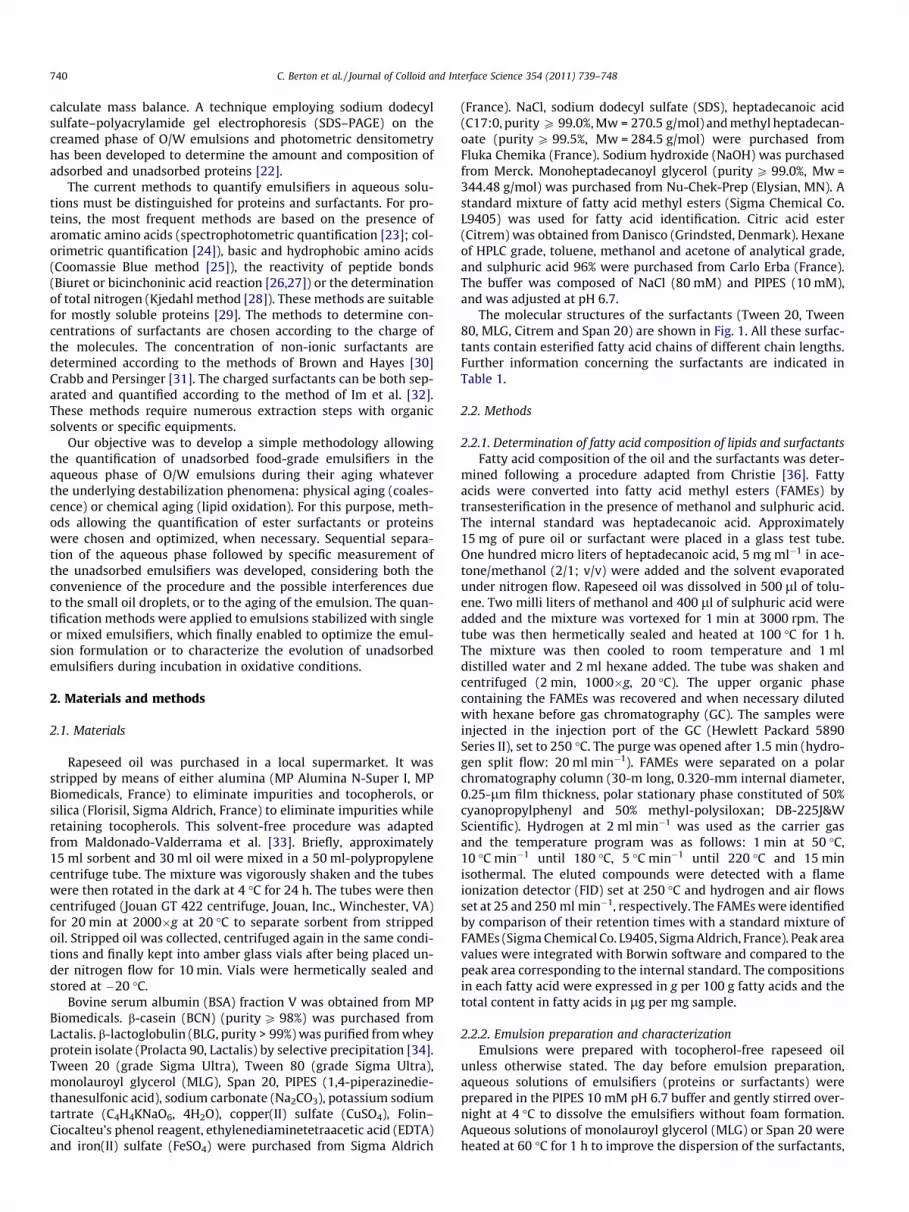
The molecular structures of the surfactants (Tween 20, Tween80, MLG, Citrem and Span 20) are shown in Fig. 1. All these surfac-tants contain esterified fatty acid chains of different chain lengths.Further information concerning the surfactants are indicated inTable 1.
2.2. Methods
2.2.1. Determination of fatty acid composition of lipids and surfactantsFatty acid composition of the oil and the surfactants was deter-
mined following a procedure adapted from Christie [36]. Fattyacids were converted into fatty acid methyl esters (FAMEs) bytransesterification in the presence of methanol and sulphuric acid.The internal standard was heptadecanoic acid. Approximately15 mg of pure oil or surfactant were placed in a glass test tube.One hundred micro liters of heptadecanoic acid, 5 mg ml�1 in ace-tone/methanol (2/1; v/v) were added and the solvent evaporatedunder nitrogen flow. Rapeseed oil was dissolved in 500 ll of tolu-ene. Two milli liters of methanol and 400 ll of sulphuric acid wereadded and the mixture was vortexed for 1 min at 3000 rpm. Thetube was then hermetically sealed and heated at 100 �C for 1 h.The mixture was then cooled to room temperature and 1 mldistilled water and 2 ml hexane added. The tube was shaken andcentrifuged (2 min, 1000�g, 20 �C). The upper organic phasecontaining the FAMEs was recovered and when necessary dilutedwith hexane before gas chromatography (GC). The samples wereinjected in the injection port of the GC (Hewlett Packard 5890Series II), set to 250 �C. The purge was opened after 1.5 min (hydro-gen split flow: 20 ml min�1). FAMEs were separated on a polarchromatography column (30-m long, 0.320-mm internal diameter,0.25-lm film thickness, polar stationary phase constituted of 50%cyanopropylphenyl and 50% methyl-polysiloxan; DB-225J&WScientific). Hydrogen at 2 ml min�1 was used as the carrier gasand the temperature program was as follows: 1 min at 50 �C,10 �C min�1 until 180 �C, 5 �C min�1 until 220 �C and 15 minisothermal. The eluted compounds were detected with a flameionization detector (FID) set at 250 �C and hydrogen and air flowsset at 25 and 250 ml min�1, respectively. The FAMEs were identifiedby comparison of their retention times with a standard mixture ofFAMEs (Sigma Chemical Co. L9405, Sigma Aldrich, France). Peak areavalues were integrated with Borwin software and compared to thepeak area corresponding to the internal standard. The compositionsin each fatty acid were expressed in g per 100 g fatty acids and thetotal content in fatty acids in lg per mg sample.
2.2.2. Emulsion preparation and characterizationEmulsions were prepared with tocopherol-free rapeseed oil
unless otherwise stated. The day before emulsion preparation,aqueous solutions of emulsifiers (proteins or surfactants) wereprepared in the PIPES 10 mM pH 6.7 buffer and gently stirred over-night at 4 �C to dissolve the emulsifiers without foam formation.Aqueous solutions of monolauroyl glycerol (MLG) or Span 20 wereheated at 60 �C for 1 h to improve the dispersion of the surfactants,
a Data provided by the suppliers.b From Hait & Moulik [35].
C. Berton et al. / Journal of Colloid and Interface Science 354 (2011) 739–748 741
then stirred overnight at room temperature. Citrem was incorpo-rated in the oil after being dissolved in dichloromethane. The sol-vent was evaporated under nitrogen flow at 35 �C for 1 h.
Oil-in-water (O/W) emulsions were composed of 15 g ofstripped oil and 35 g of aqueous solution. The two phases werepremixed for 3 min at 15,000 rpm using a rotor–stator homoge-nizer coupled with a 12-mm diameter head (Heidolph SilentCrusher, Schwabach, Germany). The coarse emulsions were thenhomogenized with a one-stage low-pressure valve homogenizer(A0812W-A-CD, Stansted Fluid Power, Stansted, UK) for either5 min at 35 bars (surfactants) or 10 min at 50 bars (proteins) toget similar distributions of droplet sizes.
The size distribution of the oil droplets in the emulsions wasdetermined immediately after homogenization and after 48 h ofstorage with a laser light scattering instrument (Saturn DigiSizer5200, Micromeritics, Norcross, USA). Emulsions were diluted 10times in 1% w/w SDS solution to separate flocculated oil droplets.The refractive index for rapeseed oil was 1.473 [37]. The emulsionsused to set up the methods of quantification of the emulsifiers inthe aqueous phase of emulsions had volume-surface mean diame-ter [d3,2] comprised between 1.5 and 2 lm and similar droplet sizedistributions.
The total mean interfacial area (SI) in a given volume of emul-sion was evaluated from the average droplet size and the mass pro-portion of oil in the emulsions as follows
SI ¼ sdroplet �moil
Vdroplet � qð1Þ
where sdroplet is the surface of one droplet considering its diameterequal to the measured [d3,2]), moil is the mass of oil in the same vol-ume of emulsion, Vdroplet is the volume of the droplet (calculatedfrom the [d3,2]) and q is the density of oil at room temperature(q = 0.92 for rapeseed oil according to Zhang et al. [37]).
2.2.3. Separation of aqueous phase from oil dropletsA 12-ml aliquot of emulsion was placed in a 15-ml polypropyl-
ene tube for centrifugation. The tube was then centrifuged (JouanGT 422 centrifuge, Jouan, Inc., Winchester, VA) for 45 min at3500�g at 20 �C to separate the aqueous phase containing unad-sorbed surfactant molecules from the oil droplets. The aqueousphase was then collected by cautiously boring a hole in the bottomof the centrifugation tube. Aqueous phases were then filteredthrough cellulose acetate membrane filters from 0.45 down to0.1 lm (Minisart High-Flow, Sartorius Stedim Biotech GmbH,
742 C. Berton et al. / Journal of Colloid and Interface Science 354 (2011) 739–748
Goettingen, Germany) and stored at either 4 �C if measurementscould be done within 2 days, or at �80 �C.
2.2.4. Physical characterization of the aqueous phasesDynamic light scattering (Zetasizer Nano ZS, Malvern Instru-
ments, UK) was used in backscattering mode with an angle of173�. Concerning the dispersed material, namely rapeseed oil, arefractive index of 1.473 and an absorption coefficient of 0.01 wereapplied. Concerning the dispersant phase, the parameters of purewater at 25 �C were applied (viscosity 0.8872 cP; refractive index1.330).
2.2.5. Measurement of surfactant concentrations in aqueous solutionsThe quantification is based on the direct transesterification in
the presence of an internal standard of the fatty chains of the sur-factants present in aqueous solutions, followed by detection of theresulting FAMEs by GC. The original transesterification procedure,developed by Christie [36] for pure lipids, was extended here toaqueous solutions of surfactants. The internal standard was chosenthrough following criteria: it should contain one fatty chain only,not be present in the measured surfactant and allow obtainingaccurate and linear calibration curve in a large range of surfactantconcentration. A sample (0.5 ml) of aqueous solution or aqueousphase of emulsion was introduced in a glass test tube and100 ll of internal standard solution were added (500 lg ml�1 inacetone/methanol; 2/1; v/v). The transesterification in the pres-ence of methanol and sulphuric acid and the FAMEs recoveringprotocol were then identical to the procedure previously described.
The method was first applied to aqueous solutions containingknown concentrations of surfactant. The integrated areas of theidentified fatty acids (Afatty acid) were calculated from the chro-matograms and divided by the area of the peak corresponding tothe selected internal standard (Ainternal standard). Calibration curvespresenting normalized integrated areas for a chosen fatty acid(Afatty acid/Ainternal standard) as a function of surfactant concentrationin the aqueous solution were established for each surfactant. Threeinternal standards were tested for the Tween 20 calibration curves,namely heptadecanoic acid (C17), methyl heptadecanoate(C17-CH3) and monoheptadecanoyl glycerol (C17-glycerol).
Then, the method was applied to aqueous phases of emulsions,containing unknown amounts of surfactants. The normalizedintegrated area for the chosen fatty acid (Afatty acid/Ainternal standard)was reported on the calibration curve previously established,
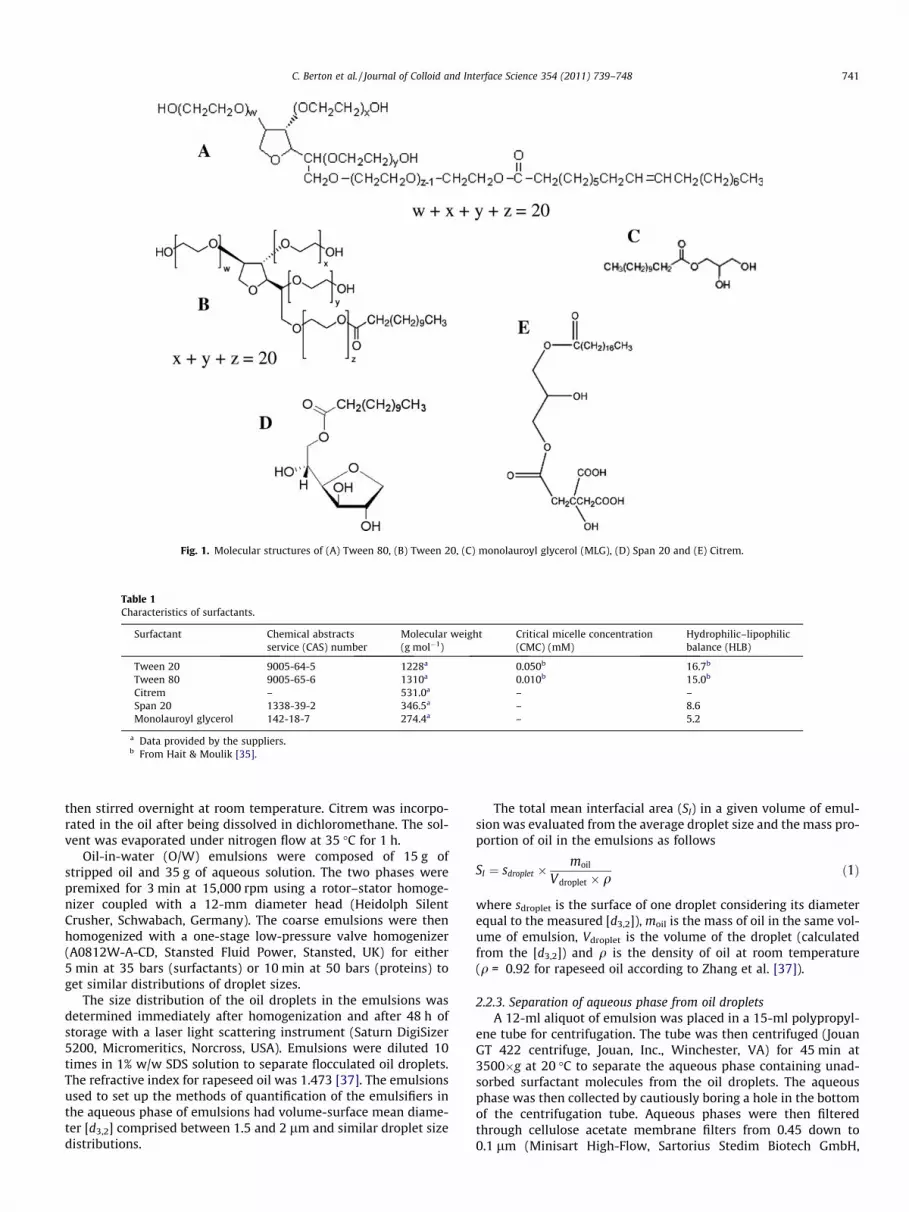
Table 2Fatty acid composition of surfactants and tocopherol-free rapeseed oil expressed in g per 1acids in the samples are expressed in mg total fatty acids per g sample. Values are means
Mono unsaturated fatty acids (MUFA)C16:1 n � 7 –C18:1 n � 9 0.27 ± 0.04C20:1 n � 9 –C22:1 n � 9 –
Poly unsaturated fatty acids (PUFA)C18:2 n � 6 –C18:3 n � 3 –
Fatty acid content (mg total fatty acids per g sample) 99.3 ± 2.6
which indicated the concentration of unadsorbed surfactant inthe aqueous phase.
The amount of residual oil in the filtered aqueous phases wasevaluated according to the area of the C18:2 peak, this fatty acidbeing present only in rapeseed oil. The calculation was performedas follows
Coil ¼AC18:2 �minternal standard
Ainternal standard� 100
pC18:2� 100
P� 1
Vð2Þ
where Coil is the concentration of residual oil in filteredaqueous phases (mg ml�1), AC18:2 is the area of the C18:2 peak,Ainternal standard is the area of the C17:0 peak, minternal standard is themass of C17:0 (mg), pC18:2 is the proportion of C18:2 in rapeseedoil (g per 100 g total fatty acids), P is the mass proportion of fattyacids in rapeseed oil (P = 84.2 g per 100 g as indicated in Table 2)and V is the volume of aqueous phase (ml).
The interfacial area corresponding to these residual droplets ina given volume of filtered aqueous phase was calculated accordingto Eq. (1).
2.2.6. Measurement of protein concentration in aqueous solutionsThe protein concentration was quantified according to either
the method described by Markwell et al. (1978) or by UV-spectro-photometric method. The method of Markwell et al. [38] consistsin a modification of the Lowry method for protein determination[24] , in which sodium dodecyl sulfate is added in the alkali reagentto allow the method to be used with membranes and lipoproteinswithout prior solubilisation or lipid extraction. During thecoloration of Folin’s reagent, the concentration of the PIPES bufferwas kept constant. Calibrations curves (concentration range:0–100 lg ml�1) were performed for the three proteins (BSA, BCNand BLG) at pH 6.7.
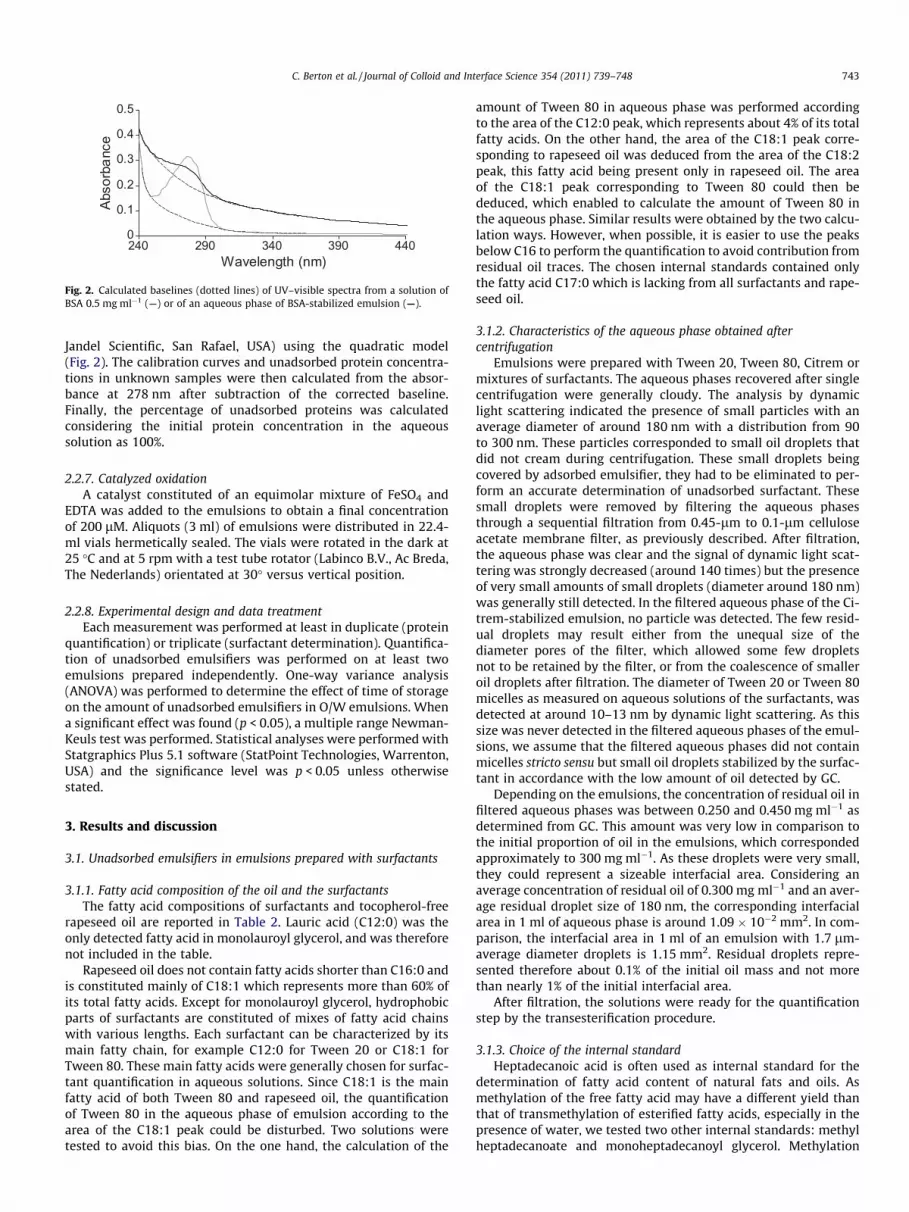
The UV-spectrophotometric determination of protein concen-tration was performed with a UV–visible spectrophotometer(Lambda 12, Perkin–Elmer, Norwalk, USA) coupled with the Lamb-da 12 software. UV–visible spectra were acquired directly fromaqueous phases containing unadsorbed proteins. Calibrations spec-tra were performed (concentration range: 0–1.5 mg ml�1) for thethree proteins. The spectra were acquired between 200 and600 nm with a scan speed of 240 nm min�1 and a sampling intervalof 1 nm. The spectral baseline drift, that was enhanced by the dif-fusion caused by small oil droplets remaining in the aqueousphases, was subtracted with the PeakFit software (version 4.00;
00 g identified fatty acids. Main fatty acids are indicated in bold. Total content of fatty± standard deviations of triplicate analysis.
Fig. 2. Calculated baselines (dotted lines) of UV–visible spectra from a solution ofBSA 0.5 mg ml�1 (—) or of an aqueous phase of BSA-stabilized emulsion (—).
C. Berton et al. / Journal of Colloid and Interface Science 354 (2011) 739–748 743
Jandel Scientific, San Rafael, USA) using the quadratic model(Fig. 2). The calibration curves and unadsorbed protein concentra-tions in unknown samples were then calculated from the absor-bance at 278 nm after subtraction of the corrected baseline.Finally, the percentage of unadsorbed proteins was calculatedconsidering the initial protein concentration in the aqueoussolution as 100%.
2.2.7. Catalyzed oxidationA catalyst constituted of an equimolar mixture of FeSO4 and
EDTA was added to the emulsions to obtain a final concentrationof 200 lM. Aliquots (3 ml) of emulsions were distributed in 22.4-ml vials hermetically sealed. The vials were rotated in the dark at25 �C and at 5 rpm with a test tube rotator (Labinco B.V., Ac Breda,The Nederlands) orientated at 30� versus vertical position.
2.2.8. Experimental design and data treatmentEach measurement was performed at least in duplicate (protein
quantification) or triplicate (surfactant determination). Quantifica-tion of unadsorbed emulsifiers was performed on at least twoemulsions prepared independently. One-way variance analysis(ANOVA) was performed to determine the effect of time of storageon the amount of unadsorbed emulsifiers in O/W emulsions. Whena significant effect was found (p < 0.05), a multiple range Newman-Keuls test was performed. Statistical analyses were performed withStatgraphics Plus 5.1 software (StatPoint Technologies, Warrenton,USA) and the significance level was p < 0.05 unless otherwisestated.
3. Results and discussion
3.1. Unadsorbed emulsifiers in emulsions prepared with surfactants
3.1.1. Fatty acid composition of the oil and the surfactantsThe fatty acid compositions of surfactants and tocopherol-free
rapeseed oil are reported in Table 2. Lauric acid (C12:0) was theonly detected fatty acid in monolauroyl glycerol, and was thereforenot included in the table.
Rapeseed oil does not contain fatty acids shorter than C16:0 andis constituted mainly of C18:1 which represents more than 60% ofits total fatty acids. Except for monolauroyl glycerol, hydrophobicparts of surfactants are constituted of mixes of fatty acid chainswith various lengths. Each surfactant can be characterized by itsmain fatty chain, for example C12:0 for Tween 20 or C18:1 forTween 80. These main fatty acids were generally chosen for surfac-tant quantification in aqueous solutions. Since C18:1 is the mainfatty acid of both Tween 80 and rapeseed oil, the quantificationof Tween 80 in the aqueous phase of emulsion according to thearea of the C18:1 peak could be disturbed. Two solutions weretested to avoid this bias. On the one hand, the calculation of the
amount of Tween 80 in aqueous phase was performed accordingto the area of the C12:0 peak, which represents about 4% of its totalfatty acids. On the other hand, the area of the C18:1 peak corre-sponding to rapeseed oil was deduced from the area of the C18:2peak, this fatty acid being present only in rapeseed oil. The areaof the C18:1 peak corresponding to Tween 80 could then bededuced, which enabled to calculate the amount of Tween 80 inthe aqueous phase. Similar results were obtained by the two calcu-lation ways. However, when possible, it is easier to use the peaksbelow C16 to perform the quantification to avoid contribution fromresidual oil traces. The chosen internal standards contained onlythe fatty acid C17:0 which is lacking from all surfactants and rape-seed oil.
3.1.2. Characteristics of the aqueous phase obtained aftercentrifugation
Emulsions were prepared with Tween 20, Tween 80, Citrem ormixtures of surfactants. The aqueous phases recovered after singlecentrifugation were generally cloudy. The analysis by dynamiclight scattering indicated the presence of small particles with anaverage diameter of around 180 nm with a distribution from 90to 300 nm. These particles corresponded to small oil droplets thatdid not cream during centrifugation. These small droplets beingcovered by adsorbed emulsifier, they had to be eliminated to per-form an accurate determination of unadsorbed surfactant. Thesesmall droplets were removed by filtering the aqueous phasesthrough a sequential filtration from 0.45-lm to 0.1-lm celluloseacetate membrane filter, as previously described. After filtration,the aqueous phase was clear and the signal of dynamic light scat-tering was strongly decreased (around 140 times) but the presenceof very small amounts of small droplets (diameter around 180 nm)was generally still detected. In the filtered aqueous phase of the Ci-trem-stabilized emulsion, no particle was detected. The few resid-ual droplets may result either from the unequal size of thediameter pores of the filter, which allowed some few dropletsnot to be retained by the filter, or from the coalescence of smalleroil droplets after filtration. The diameter of Tween 20 or Tween 80micelles as measured on aqueous solutions of the surfactants, wasdetected at around 10–13 nm by dynamic light scattering. As thissize was never detected in the filtered aqueous phases of the emul-sions, we assume that the filtered aqueous phases did not containmicelles stricto sensu but small oil droplets stabilized by the surfac-tant in accordance with the low amount of oil detected by GC.
Depending on the emulsions, the concentration of residual oil infiltered aqueous phases was between 0.250 and 0.450 mg ml�1 asdetermined from GC. This amount was very low in comparison tothe initial proportion of oil in the emulsions, which correspondedapproximately to 300 mg ml�1. As these droplets were very small,they could represent a sizeable interfacial area. Considering anaverage concentration of residual oil of 0.300 mg ml�1 and an aver-age residual droplet size of 180 nm, the corresponding interfacialarea in 1 ml of aqueous phase is around 1.09 � 10�2 mm2. In com-parison, the interfacial area in 1 ml of an emulsion with 1.7 lm-average diameter droplets is 1.15 mm2. Residual droplets repre-sented therefore about 0.1% of the initial oil mass and not morethan nearly 1% of the initial interfacial area.
After filtration, the solutions were ready for the quantificationstep by the transesterification procedure.
3.1.3. Choice of the internal standardHeptadecanoic acid is often used as internal standard for the
determination of fatty acid content of natural fats and oils. Asmethylation of the free fatty acid may have a different yield thanthat of transmethylation of esterified fatty acids, especially in thepresence of water, we tested two other internal standards: methylheptadecanoate and monoheptadecanoyl glycerol. Methylation
0
1
2
3
4
5
6
0 1 2 3 4 5 6Tween 20 concentration (g/l)
C12
pea
k ar
ea /
C17
pea
k ae
ra
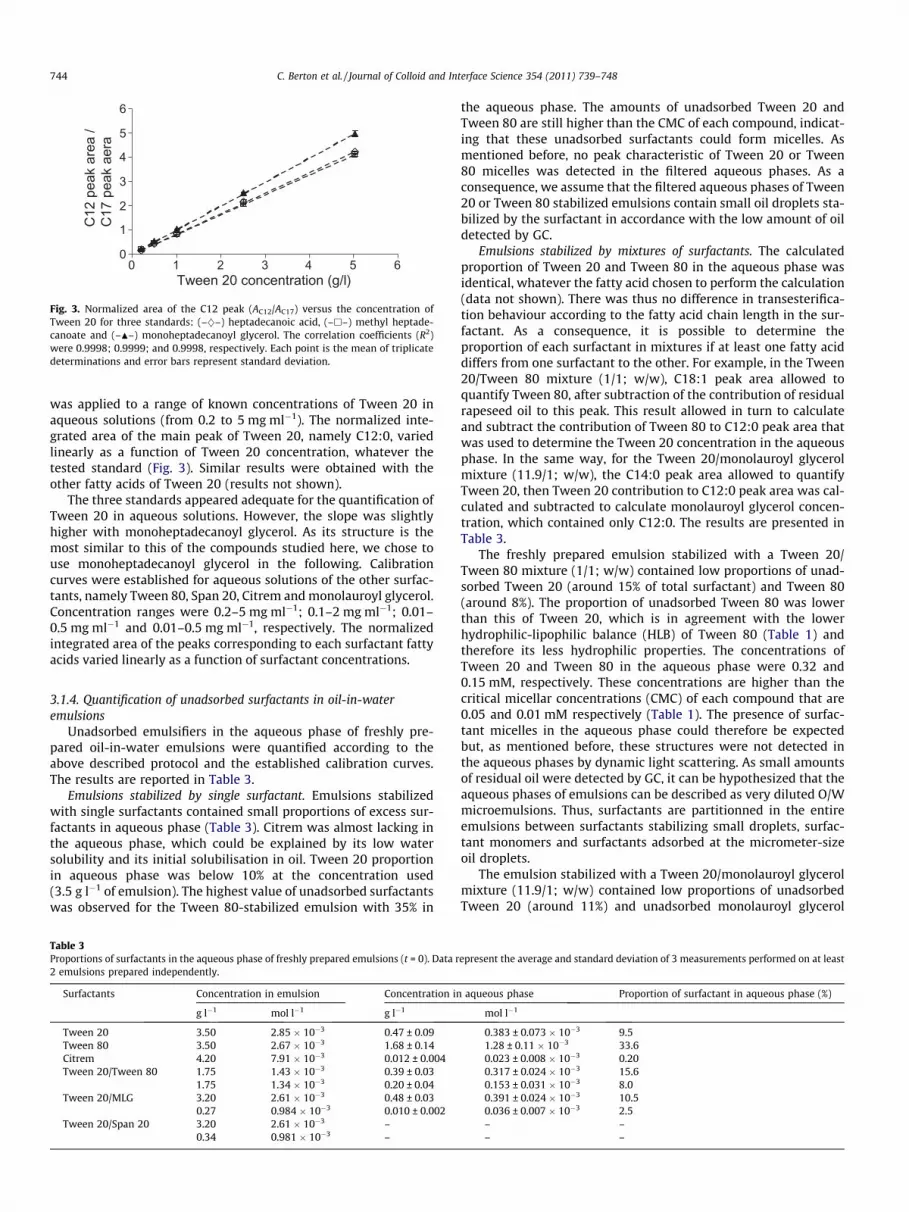
Fig. 3. Normalized area of the C12 peak (AC12/AC17) versus the concentration ofTween 20 for three standards: (–}–) heptadecanoic acid, (–h–) methyl heptade-canoate and (–N–) monoheptadecanoyl glycerol. The correlation coefficients (R2)were 0.9998; 0.9999; and 0.9998, respectively. Each point is the mean of triplicatedeterminations and error bars represent standard deviation.
744 C. Berton et al. / Journal of Colloid and Interface Science 354 (2011) 739–748
was applied to a range of known concentrations of Tween 20 inaqueous solutions (from 0.2 to 5 mg ml�1). The normalized inte-grated area of the main peak of Tween 20, namely C12:0, variedlinearly as a function of Tween 20 concentration, whatever thetested standard (Fig. 3). Similar results were obtained with theother fatty acids of Tween 20 (results not shown).
The three standards appeared adequate for the quantification ofTween 20 in aqueous solutions. However, the slope was slightlyhigher with monoheptadecanoyl glycerol. As its structure is themost similar to this of the compounds studied here, we chose touse monoheptadecanoyl glycerol in the following. Calibrationcurves were established for aqueous solutions of the other surfac-tants, namely Tween 80, Span 20, Citrem and monolauroyl glycerol.Concentration ranges were 0.2–5 mg ml�1; 0.1–2 mg ml�1; 0.01–0.5 mg ml�1 and 0.01–0.5 mg ml�1, respectively. The normalizedintegrated area of the peaks corresponding to each surfactant fattyacids varied linearly as a function of surfactant concentrations.
3.1.4. Quantification of unadsorbed surfactants in oil-in-wateremulsions
Unadsorbed emulsifiers in the aqueous phase of freshly pre-pared oil-in-water emulsions were quantified according to theabove described protocol and the established calibration curves.The results are reported in Table 3.
Emulsions stabilized by single surfactant. Emulsions stabilizedwith single surfactants contained small proportions of excess sur-factants in aqueous phase (Table 3). Citrem was almost lacking inthe aqueous phase, which could be explained by its low watersolubility and its initial solubilisation in oil. Tween 20 proportionin aqueous phase was below 10% at the concentration used(3.5 g l�1 of emulsion). The highest value of unadsorbed surfactantswas observed for the Tween 80-stabilized emulsion with 35% in
Table 3Proportions of surfactants in the aqueous phase of freshly prepared emulsions (t = 0). Data r2 emulsions prepared independently.
Surfactants Concentration in emulsion Concentration in
the aqueous phase. The amounts of unadsorbed Tween 20 andTween 80 are still higher than the CMC of each compound, indicat-ing that these unadsorbed surfactants could form micelles. Asmentioned before, no peak characteristic of Tween 20 or Tween80 micelles was detected in the filtered aqueous phases. As aconsequence, we assume that the filtered aqueous phases of Tween20 or Tween 80 stabilized emulsions contain small oil droplets sta-bilized by the surfactant in accordance with the low amount of oildetected by GC.
Emulsions stabilized by mixtures of surfactants. The calculatedproportion of Tween 20 and Tween 80 in the aqueous phase wasidentical, whatever the fatty acid chosen to perform the calculation(data not shown). There was thus no difference in transesterifica-tion behaviour according to the fatty acid chain length in the sur-factant. As a consequence, it is possible to determine theproportion of each surfactant in mixtures if at least one fatty aciddiffers from one surfactant to the other. For example, in the Tween20/Tween 80 mixture (1/1; w/w), C18:1 peak area allowed toquantify Tween 80, after subtraction of the contribution of residualrapeseed oil to this peak. This result allowed in turn to calculateand subtract the contribution of Tween 80 to C12:0 peak area thatwas used to determine the Tween 20 concentration in the aqueousphase. In the same way, for the Tween 20/monolauroyl glycerolmixture (11.9/1; w/w), the C14:0 peak area allowed to quantifyTween 20, then Tween 20 contribution to C12:0 peak area was cal-culated and subtracted to calculate monolauroyl glycerol concen-tration, which contained only C12:0. The results are presented inTable 3.
The freshly prepared emulsion stabilized with a Tween 20/Tween 80 mixture (1/1; w/w) contained low proportions of unad-sorbed Tween 20 (around 15% of total surfactant) and Tween 80(around 8%). The proportion of unadsorbed Tween 80 was lowerthan this of Tween 20, which is in agreement with the lowerhydrophilic-lipophilic balance (HLB) of Tween 80 (Table 1) andtherefore its less hydrophilic properties. The concentrations ofTween 20 and Tween 80 in the aqueous phase were 0.32 and0.15 mM, respectively. These concentrations are higher than thecritical micellar concentrations (CMC) of each compound that are0.05 and 0.01 mM respectively (Table 1). The presence of surfac-tant micelles in the aqueous phase could therefore be expectedbut, as mentioned before, these structures were not detected inthe aqueous phases by dynamic light scattering. As small amountsof residual oil were detected by GC, it can be hypothesized that theaqueous phases of emulsions can be described as very diluted O/Wmicroemulsions. Thus, surfactants are partitionned in the entireemulsions between surfactants stabilizing small droplets, surfac-tant monomers and surfactants adsorbed at the micrometer-sizeoil droplets.
The emulsion stabilized with a Tween 20/monolauroyl glycerolmixture (11.9/1; w/w) contained low proportions of unadsorbedTween 20 (around 11%) and unadsorbed monolauroyl glycerol
epresent the average and standard deviation of 3 measurements performed on at least
aqueous phase Proportion of surfactant in aqueous phase (%)
C. Berton et al. / Journal of Colloid and Interface Science 354 (2011) 739–748 745
(around 2.5%). In the case of mixtures of surfactants containing thesame fatty chains but in different proportions (Span 20/Tween 20for example), one can assume that the fatty acid distribution atthe interface for each surfactant was not modified by the presenceof the other. It should be thus possible to deduce the proportion ofeach compound using the responses given by C12 and C14 peakareas and their ratios, these fatty acids being the two main fattyacids of both Tween 20 and Span 20. However, for this particularmixture, the differences in fatty acid compositions were not sub-stantial enough to distinguish one contribution from another(Table 2). The transesterification method is thus not applicable todistinguish and quantify mixes of surfactants with similar fattyacid compositions.
3.2. Unadsorbed emulsifiers in emulsions prepared with proteins
The aqueous phases recovered after phase separation ofprotein-stabilized emulsions were turbid as those coming fromsurfactant-stabilized emulsions. The analysis by dynamic lightscattering also showed the presence in the aqueous phase of oildroplets of small diameter (around 150 nm with a distributionfrom around 100–200 nm). These droplets were removed bysequential filtrations through cellulose acetate membrane filtersfrom 0.45 down to 0.1 lm. The filtered aqueous phase was clearand the signal obtained by dynamic light scattering was around120 times reduced. Unadsorbed proteins in freshly prepared emul-sions were quantified according to the Markwell’s method andwith UV detection at 278 nm (Table 4).
The amounts of proteins in the aqueous phases of freshly pre-pared emulsions were calculated from the data obtained with thetwo methods. They were very similar for the BSA- and BLG-stabi-lized emulsions. In contrast, the aqueous concentration of BCN inaqueous phase measured with the Markwell’s method was signif-icantly (p < 0.05) higher than that determined by the spectroscopicUV method. This difference can be explained by several factors.First, among the three studied proteins, BCN possesses the lowestmolar extinction coefficient (UniProt protein knowledgebase).The spectrophotometric signal of this protein was therefore smallcompared to the diffusion signal caused by residual oil droplets.Since the corresponding standard deviation was low, it could be as-sumed that spectroscopic UV method was reproducible but not
Table 4Proportions of unadsorbed proteins in the aqueous phase of emulsions with an equivalent sperformed on 2–4 emulsions prepared independently. Concentrations of proteins were de
Protein Concentration in the emulsion (g l�1) Concentration in the aqueo
a The error on the expected concentrations (DC) has been calculated as follows: DC = Cthe balance, m is the weighted mass of pure emulsifier, DV is the inaccuracy of volume
accurate in comparison to Markwell’s method. The modificationof the spectra baseline induced by the residual small dropletswas particularly considerable in the case of the BCN-stabilizedemulsions, even if the preliminary filtration of the aqueous phaseenabled to eliminate a large proportion of such residual droplets.Markwell’s method is therefore more adequate to measure unad-sorbed proteins in aqueous phases of emulsions.
Spectrometric UV method and Markwell’s method do notenable to distinguish different proteins in an aqueous phase. How-ever, Hunt & Dalgleish described a method employing sodiumdodecyl sulfate–polyacrylamide gel electrophoresis (SDS–PAGE)and photometric densitometry to determine protein concentrationin the creamed phase of O/W emulsions stabilized with mixtures ofproteins [22]. This technique could be applied to aqueous phases ofsuch emulsions to evaluate the concentration of each protein.
The total or partial replacement of interfacial proteins bysurfactants in O/W emulsions is a well-known phenomenon[39–43]. It is therefore interesting to quantify the amount ofunadsorbed emulsifiers in emulsions stabilized with mixtures ofproteins and surfactants. Tested non-ionic surfactants (Tween 20and Tween 80) do not absorb light between 200 and 600 nm andthus are assumed not to interfere with UV determination of thesoluble proteins. In the same way, they were not listed as interfer-ing with the Folin–Ciocalteu reagent [44]. We verified, however,that the presence of Tween 20 in aqueous solution did not disturbprotein (BSA, BLG or BCN) quantification by Markwell’s method.We also checked that the presence of proteins (BSA, BLG or BCN)in the aqueous solutions did not disturb the transesterificationreaction, the GC analysis and the resulting quantification of Tween20. For this purpose, we prepared Tween 20/protein solutions ofknown concentrations and we measured by the above describedmethods the concentrations of Tween 20 and proteins (Table 5).The measured concentrations were very close to the expected con-centrations, for both the surfactant and the proteins, except for BSAwhom measured concentration in the presence of Tween 20 wasoverestimated by 15% compared to the expected value. Thus,transesterification can be used without any interference to quan-tify ester surfactants in an aqueous phase of emulsion containingproteins. In the same way, proteins can be quantified with satisfy-ing precision by UV spectrometry or Markwell’s method in thepresence of Tween surfactant. We however recommend users to
ize of droplets. Data represent the mean and standard deviation of 2–8 measurementstermined according to (a) Markwell’s method or (b) spectroscopic UV method.
us phase (g l�1) Proportion of proteins in the aqueous phase (%)
� ((Dm/m) + (DV/V)), where C is the expected concentration, Dm is the inaccuracy oftric flasks and V is the volume of prepared solution.
0
0.5
1
1.5
2
2.5
3
3.5
1 2 3 4 5 6Protein concentration in emulsion (g/l)
d3,2
(m
)
0
10
20
30
40
50
60 Proportion of unadsorbed proteins (%
)
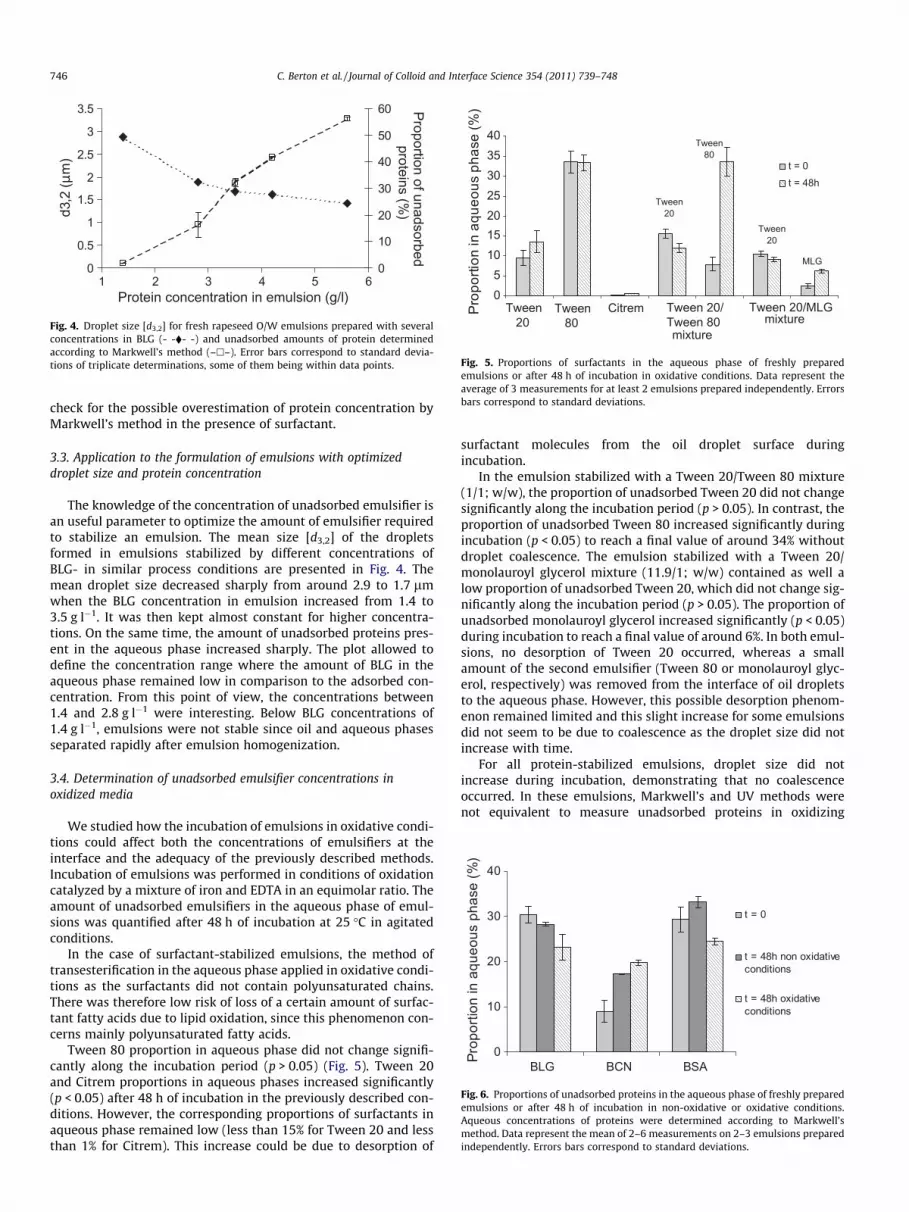
Fig. 4. Droplet size [d3,2] for fresh rapeseed O/W emulsions prepared with severalconcentrations in BLG (- -�- -) and unadsorbed amounts of protein determinedaccording to Markwell’s method (–h–). Error bars correspond to standard devia-tions of triplicate determinations, some of them being within data points.
05
10152025303540
Tween 20
Tween 80
CitremProp
ortio
n in
aqu
eous
pha
se (%
)
t = 0t = 48h
Tween 20/Tween 80mixture
Tween 20/MLG mixture
Tween 20
Tween 80
Tween 20
MLG
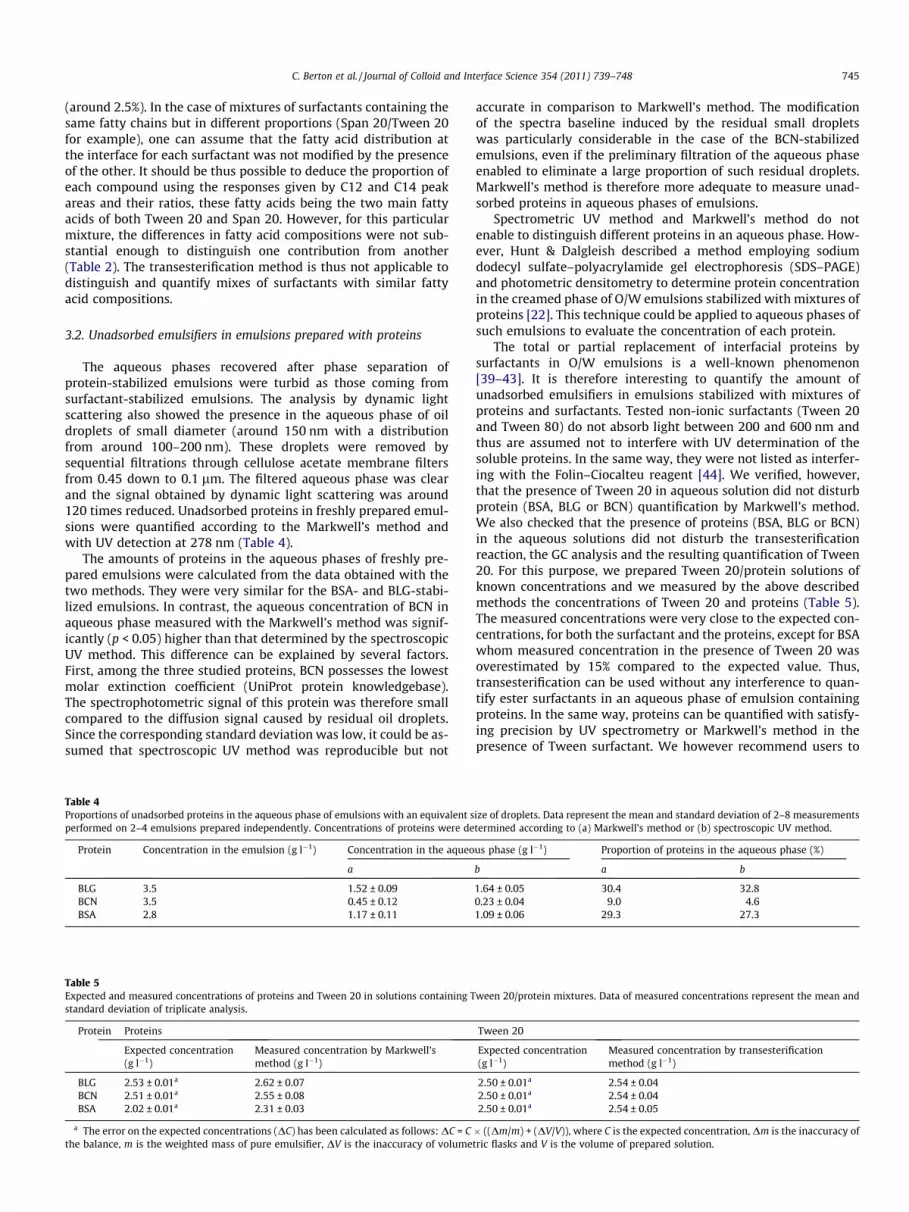
Fig. 5. Proportions of surfactants in the aqueous phase of freshly preparedemulsions or after 48 h of incubation in oxidative conditions. Data represent theaverage of 3 measurements for at least 2 emulsions prepared independently. Errorsbars correspond to standard deviations.
0
10
20
30
40
BLG BCN BSA
Prop
ortio
n in
aqu
eous
pha
se (%
)
t = 0
t = 48h non oxidativeconditions
t = 48h oxidativeconditions
Fig. 6. Proportions of unadsorbed proteins in the aqueous phase of freshly preparedemulsions or after 48 h of incubation in non-oxidative or oxidative conditions.Aqueous concentrations of proteins were determined according to Markwell’smethod. Data represent the mean of 2–6 measurements on 2–3 emulsions preparedindependently. Errors bars correspond to standard deviations.
746 C. Berton et al. / Journal of Colloid and Interface Science 354 (2011) 739–748
check for the possible overestimation of protein concentration byMarkwell’s method in the presence of surfactant.
3.3. Application to the formulation of emulsions with optimizeddroplet size and protein concentration
The knowledge of the concentration of unadsorbed emulsifier isan useful parameter to optimize the amount of emulsifier requiredto stabilize an emulsion. The mean size [d3,2] of the dropletsformed in emulsions stabilized by different concentrations ofBLG- in similar process conditions are presented in Fig. 4. Themean droplet size decreased sharply from around 2.9 to 1.7 lmwhen the BLG concentration in emulsion increased from 1.4 to3.5 g l�1. It was then kept almost constant for higher concentra-tions. On the same time, the amount of unadsorbed proteins pres-ent in the aqueous phase increased sharply. The plot allowed todefine the concentration range where the amount of BLG in theaqueous phase remained low in comparison to the adsorbed con-centration. From this point of view, the concentrations between1.4 and 2.8 g l�1 were interesting. Below BLG concentrations of1.4 g l�1, emulsions were not stable since oil and aqueous phasesseparated rapidly after emulsion homogenization.
3.4. Determination of unadsorbed emulsifier concentrations inoxidized media
We studied how the incubation of emulsions in oxidative condi-tions could affect both the concentrations of emulsifiers at theinterface and the adequacy of the previously described methods.Incubation of emulsions was performed in conditions of oxidationcatalyzed by a mixture of iron and EDTA in an equimolar ratio. Theamount of unadsorbed emulsifiers in the aqueous phase of emul-sions was quantified after 48 h of incubation at 25 �C in agitatedconditions.
In the case of surfactant-stabilized emulsions, the method oftransesterification in the aqueous phase applied in oxidative condi-tions as the surfactants did not contain polyunsaturated chains.There was therefore low risk of loss of a certain amount of surfac-tant fatty acids due to lipid oxidation, since this phenomenon con-cerns mainly polyunsaturated fatty acids.
Tween 80 proportion in aqueous phase did not change signifi-cantly along the incubation period (p > 0.05) (Fig. 5). Tween 20and Citrem proportions in aqueous phases increased significantly(p < 0.05) after 48 h of incubation in the previously described con-ditions. However, the corresponding proportions of surfactants inaqueous phase remained low (less than 15% for Tween 20 and lessthan 1% for Citrem). This increase could be due to desorption of
surfactant molecules from the oil droplet surface duringincubation.
In the emulsion stabilized with a Tween 20/Tween 80 mixture(1/1; w/w), the proportion of unadsorbed Tween 20 did not changesignificantly along the incubation period (p > 0.05). In contrast, theproportion of unadsorbed Tween 80 increased significantly duringincubation (p < 0.05) to reach a final value of around 34% withoutdroplet coalescence. The emulsion stabilized with a Tween 20/monolauroyl glycerol mixture (11.9/1; w/w) contained as well alow proportion of unadsorbed Tween 20, which did not change sig-nificantly along the incubation period (p > 0.05). The proportion ofunadsorbed monolauroyl glycerol increased significantly (p < 0.05)during incubation to reach a final value of around 6%. In both emul-sions, no desorption of Tween 20 occurred, whereas a smallamount of the second emulsifier (Tween 80 or monolauroyl glyc-erol, respectively) was removed from the interface of oil dropletsto the aqueous phase. However, this possible desorption phenom-enon remained limited and this slight increase for some emulsionsdid not seem to be due to coalescence as the droplet size did notincrease with time.
For all protein-stabilized emulsions, droplet size did notincrease during incubation, demonstrating that no coalescenceoccurred. In these emulsions, Markwell’s and UV methods werenot equivalent to measure unadsorbed proteins in oxidizing
Centrifugation
Filtration
Protein / Surfactant mixtures: Markwell +
Transesterification
Markwell
UV
UV method: less accurate for casein-stabilized emulsions
UV method : not adequate in oxidized emulsions
Direct aqueous transesterification + Gas chromatography
Surfactant mixtures: transesterification if different fatty acids
!
O/W emulsion
Unadsorbed emulsifiers
!
Proteins SurfactantsProteins + Surfactants
Aqueous phase
Protein mixtures: Electrophoresis (Hunt & Dalgleish1994)
!
!
Fig. 7. Summary scheme of the appropriate methodologies to quantify unadsorbed emulsifiers in the aqueous phase of O/W emulsions.
C. Berton et al. / Journal of Colloid and Interface Science 354 (2011) 739–748 747
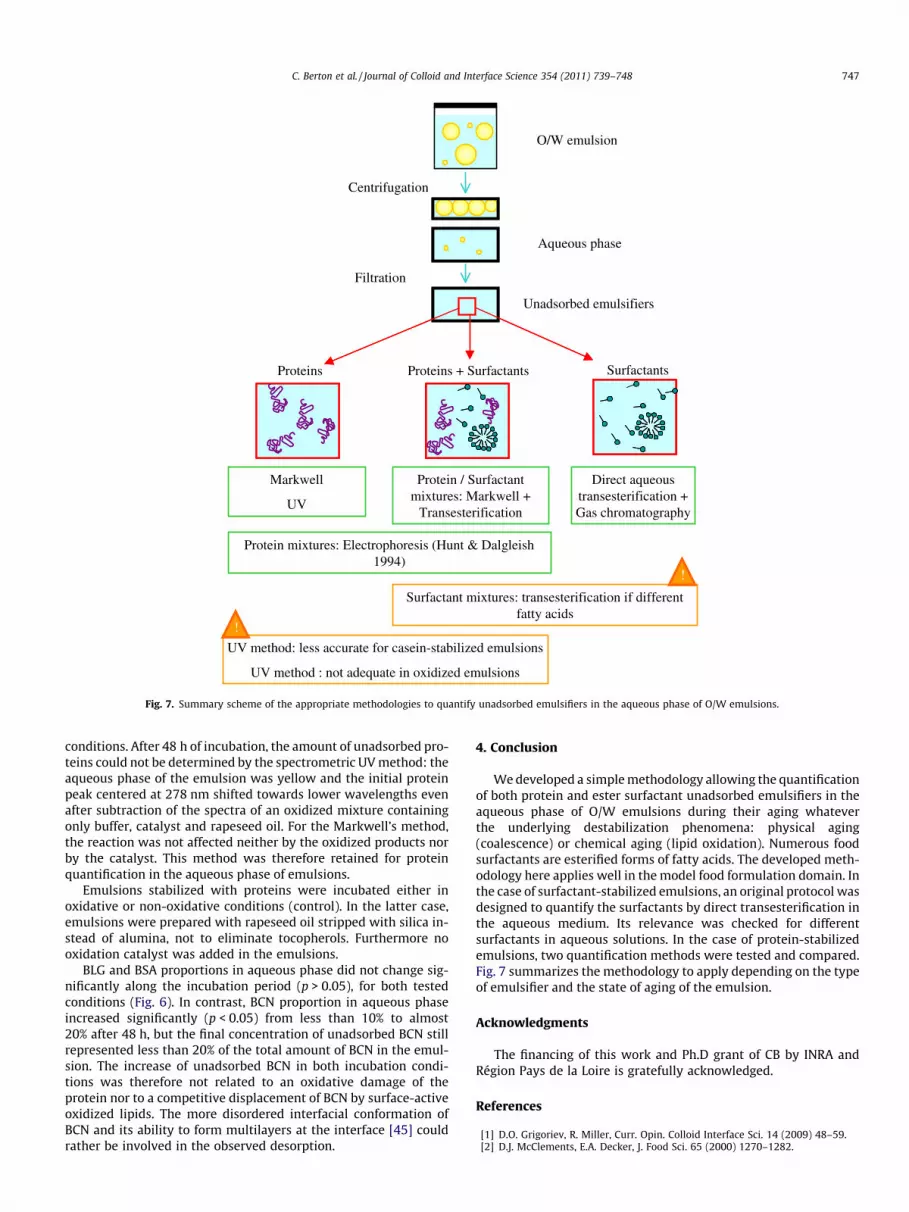
conditions. After 48 h of incubation, the amount of unadsorbed pro-teins could not be determined by the spectrometric UV method: theaqueous phase of the emulsion was yellow and the initial proteinpeak centered at 278 nm shifted towards lower wavelengths evenafter subtraction of the spectra of an oxidized mixture containingonly buffer, catalyst and rapeseed oil. For the Markwell’s method,the reaction was not affected neither by the oxidized products norby the catalyst. This method was therefore retained for proteinquantification in the aqueous phase of emulsions.
Emulsions stabilized with proteins were incubated either inoxidative or non-oxidative conditions (control). In the latter case,emulsions were prepared with rapeseed oil stripped with silica in-stead of alumina, not to eliminate tocopherols. Furthermore nooxidation catalyst was added in the emulsions.
BLG and BSA proportions in aqueous phase did not change sig-nificantly along the incubation period (p > 0.05), for both testedconditions (Fig. 6). In contrast, BCN proportion in aqueous phaseincreased significantly (p < 0.05) from less than 10% to almost20% after 48 h, but the final concentration of unadsorbed BCN stillrepresented less than 20% of the total amount of BCN in the emul-sion. The increase of unadsorbed BCN in both incubation condi-tions was therefore not related to an oxidative damage of theprotein nor to a competitive displacement of BCN by surface-activeoxidized lipids. The more disordered interfacial conformation ofBCN and its ability to form multilayers at the interface [45] couldrather be involved in the observed desorption.
4. Conclusion
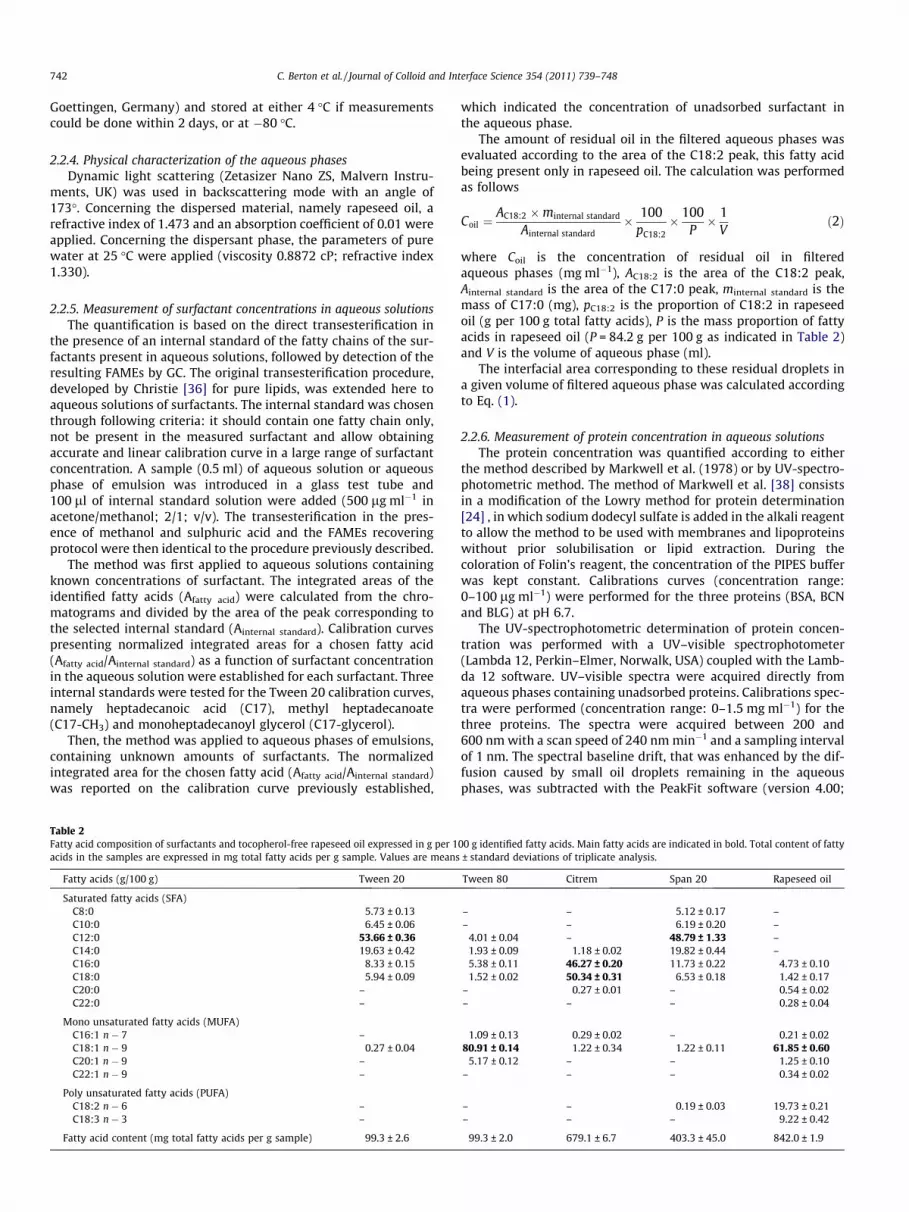
We developed a simple methodology allowing the quantificationof both protein and ester surfactant unadsorbed emulsifiers in theaqueous phase of O/W emulsions during their aging whateverthe underlying destabilization phenomena: physical aging(coalescence) or chemical aging (lipid oxidation). Numerous foodsurfactants are esterified forms of fatty acids. The developed meth-odology here applies well in the model food formulation domain. Inthe case of surfactant-stabilized emulsions, an original protocol wasdesigned to quantify the surfactants by direct transesterification inthe aqueous medium. Its relevance was checked for differentsurfactants in aqueous solutions. In the case of protein-stabilizedemulsions, two quantification methods were tested and compared.Fig. 7 summarizes the methodology to apply depending on the typeof emulsifier and the state of aging of the emulsion.
Acknowledgments
The financing of this work and Ph.D grant of CB by INRA andRégion Pays de la Loire is gratefully acknowledged.
748 C. Berton et al. / Journal of Colloid and Interface Science 354 (2011) 739–748
[3] E. Dickinson, M. Golding, Food Hydrocolloids 11 (1997) 13–18.[4] S. Dauphas, M. Amestoy, G. Llamas, M. Anton, A. Riaublanc, Food Hydrocolloids
22 (2008) 231–238.[5] A.Q. Ye, Food Chemistry 110 (2008) 946–952.[6] E. Dickinson, S.J. Radford, M. Golding, Food Hydrocolloids 17 (2003) 211–220.[7] J.L. Donnelly, E.A. Decker, D.J. McClements, J. Food Sci. 63 (1998) 997–1000.[8] L. Ponginebbi, W.W. Nawar, P. Chinachoti, J. Am Oil Chem. Soc. 76 (1999) 131–
138.[9] C.D. Nuchi, P. Hernandez, D.J. McClements, E.A. Decker, J. Agric. Food Chem. 50
(2002) 5445–5449.[10] M. Hu, D.J. McClements, E.A. Decker, J. Agric. Food Chem. 51 (2003) 1435–
1439.[11] A. Villiere, M. Viau, I. Bronnec, N. Moreau, C. Genot, J. Agric. Food Chem. 53
(2005) 1514–1520.[12] Y. Cheng, Y.L. Xiong, J. Chen, Food Chem. 120 (2010) 101–108.[13] C. Genot, A. Meynier, A. Riaublanc, in: A. Kamal-Eldin (Ed.), AOCS Press,
Champaign, 2003, pp 190–244.[14] S. Bongard, A. Meynier, A. Riaublanc, C. Genot, J. Food Nutr. Res. 48 (2009) 42–
303–311.[16] S.R. Euston, P.G. Mayhill, Food Res. Int. 34 (2001) 369–376.[17] C. Castelain, C. Genot, Biochim. Biophys. Acta, Gen. Subj. 1199 (1994) 59–64.[18] V. Rampon, C. Brossard, N. Mouhous-Riou, B. Bousseau, G. Llamas, C. Genot,
Adv. Colloid Interface Sci. 108 (2004) 87–94.[19] V. Rampon, C. Genot, A. Riaublanc, M. Anton, M.A.V. Axelos, D.J. McClements, J.
Agric. Food Chem. 51 (2003) 2482–2489.[20] S. Patton, G. Huston, Lipids 21 (1986) 170–174.[21] M. Le Denmat, M. Anton, V. Beaumal, Food Hydrocolloids 14 (2000) 539–549.[22] J.A. Hunt, D.G. Dalgleish, Food Hydrocolloids 8 (1994) 175–187.[23] E. Layne, Methods Enzymol. 10 (1957) 447–454.[24] O.H. Lowry, N.J. Rosebrough, A.L. Farr, R.J. Randall, J. Bio. Chem. 193 (1951)
Husband, A.R. Mackie, V.J. Morris, P.J. Wilde, Langmuir 24 (2008) 6759–6767.[34] P. Mailliart, B. Ribadeau-Dumas, J. Food Sci. 53 (1988) 743–745.[35] S.K. Hait, S.P. Moulik, J. Surfactants Deterg. 4 (2001) 303–309.[36] W.W. Christie, Gas chromatography and lipids: a practical guide, The Oily
Press, AYR, Scotland, 1989.[37] G. Zhang, Y. Ni, J. Churchill, S. Kokot, Talanta 70 (2006) 293–300.[38] M.A.K. Markwell, S.M. Haas, L.L. Bieber, N.E. Tolbert, Anal. Biochem. 87 (1978)
206–210.[39] J.L. Courthaudon, E. Dickinson, Y. Matsumura, D.C. Clark, Colloids Surf. 56
(1991) 293–300.[40] J.L. Courthaudon, E. Dickinson, D.G. Dalgleish, J. Colloid Interface Sci. 145
(1991) 390–395.[41] D.G. Dalgleish, M. Srinivasan, H. Singh, J. Agric. Food Chem. 43 (1995) 2351–
2355.[42] E. Dickinson, Acs Symposium Series 448 (1991) 114–129.[43] E. Dickinson, C. Ritzoulis, M.J.W. Povey, J. Colloid Interface Sci. 212 (1999) 466–