Production of aromatic green gasoline additives via catalytic pyrolysis of acidulated peanut oil soap stock R. Hilten ⇑ , R. Speir, J. Kastner, K.C. Das Dept. of Biological and Agricultural Engineering, Driftmier Engineering Center, University of Georgia, Athens, GA 30602, United States article info Article history: Received 21 February 2011 Received in revised form 3 June 2011 Accepted 13 June 2011 Available online 7 July 2011 Keywords: Catalytic pyrolysis Soap stock Waste oil Free fatty acid Peanut processing abstract Catalytic pyrolysis was used to generate gasoline-compatible fuel from peanut oil soap stock (PSS), a high free fatty acid feedstock, using a fixed-bed reactor at temperatures between 450 and 550 °C with a zeolite catalyst (HZSM-5). PSS fed at 81 g h 1 along with 100 mL min 1 inert gas was passed across a 15 g cata- lyst bed (WHSV = 5.4 h 1 , gas phase residence time = 34 s). Results indicate that fuel properties of PSS including viscosity, heating value, and O:C ratio were improved significantly. For PSS processed at 500 °C, viscosity was reduced from 59.6 to 0.9 mm 2 s 1 , heating value was increased from 35.8 to 39.3 MJ L 1 , and the O:C ratio was reduced from 0.07 to 0.02. Aromatic gasoline components (e.g., BTEX), were formed in concentrations as high as 94% (v/v) in catalytically-cracked PSS with yields ranging from 22% to 35% (v/v of PSS feed). Ó 2011 Elsevier Ltd. All rights reserved. 1. Introduction Fats and vegetable oils are common feedstocks for biofuel pro- duction, particularly for biodiesel. Biodiesel can be produced from a variety of oils containing mono- (free fatty acids or FFAs), di- and tri-glyceride (i.e. lipid) feedstocks. Although a wide variety of plant- and animal-derived feedstocks is available, the cost is highly variable with feedstock ranging from 0.20 to 2.0$ lb 1 (between 2000 and 2006) (Ash and Wittenberger, 2010) which can make the cost of biodiesel production unpredictable and often unprofit- able. In the US, soybean oil, containing lipids with mainly oleic and linoleic fatty acids, is a commonly-used feedstock. However, soy- bean oil is a traded commodity, and using soybean oil for biodiesel production directly competes with food uses, which increases the price for both uses. Mixtures of FFAs and lipids are common, espe- cially in waste fats and oils (e.g., yellow grease, tallow, and soap stock) resulting in a much lower feedstock quality and cost. The estimated production cost of biodiesel generated from soybean oil, yellow grease and petroleum in 2011 is 2.73$, 1.51$, and 0.76$ gal 1 , respectively (Radich, 1998). However, mixtures of FFAs and lipids, as in yellow grease, present difficulties in biodiesel syn- thesis, since separate catalytic steps are required; esterification of the FFAs using an acid catalyst followed by transesterification of the triglycerides using a base catalyst. An alternate method for producing biofuels from fats and oils is via a thermochemical pathway, such as pyrolysis or catalytic hydrotreatment. Kanellos (2007) indicates that commercial enti- ties have shown interest in pursuing the development of fuels from fats, including Tyson Foods and ConocoPhillips who, in a collabora- tive effort set a target of producing 175 million gallons of diesel from animal fats using conventional hydrotreatment processes in existing refineries in 2008. The article states that the thermal tech- nology used by Conoco, known as hydrotreatment, results in hydrocarbons of the desirable quality, although demand for pure hydrogen is high. However, this technology cannot be scaled down to distributed small units because of the difficulties in producing and handling hydrogen in small systems (Kanellos, 2007). Thus, there is a need to develop catalytic processes capable of transform- ing high FFA feedstocks to liquid fuels without the need for gaseous H 2 allowing for the design of distributed small or regional biorefineries. Many studies have demonstrated thermochemical conversion as a means to generate liquid fuel from mono- (free fatty acid or FFA), di-, and tri-glyceride (TG) feedstocks without costly hydrogen addition. Adebanjo et al. (2005) explored pyrolysis of animal fat (mainly saturated TGs), which generated an oil exhibiting a very similar cetane number and heat of combustion as those specified by ASTM for diesel fuel. Hilten et al. (2010) produced a gasoline- like fuel via pyrolysis and catalytic cracking of poultry processing waste containing FFAs, TGs, and protein. Other studies have pro- duced diesel-like fuels from pyrolysis of vegetable oil feedstocks, such as soybean oil (Lima et al., 2004; Wiggers et al., 2009). Many studies have added catalysts to the process in fixed-bed reactors to 0960-8524/$ - see front matter Ó 2011 Elsevier Ltd. All rights reserved. doi:10.1016/j.biortech.2011.06.049 ⇑ Corresponding author. Address: Bioconversion and Carbon Cycling Program, 597 D.W. Brooks Dr., Driftmier Engineering Center, University of Georgia, Athens, GA 30602, United States. Tel.: +1 706 542 0940; fax: +1 706 542 8806. E-mail address: [email protected](R. Hilten). Bioresource Technology 102 (2011) 8288–8294 Contents lists available at ScienceDirect Bioresource Technology journal homepage: www.elsevier.com/locate/biortech
Production of aromatic green gasoline additives via catalytic pyrolysisof acidulated peanut oil soap stock
R. Hilten ⇑, R. Speir, J. Kastner, K.C. DasDept. of Biological and Agricultural Engineering, Driftmier Engineering Center, University of Georgia, Athens, GA 30602, United States
a r t i c l e i n f o
Article history:Received 21 February 2011Received in revised form 3 June 2011Accepted 13 June 2011Available online 7 July 2011
Catalytic pyrolysis was used to generate gasoline-compatible fuel from peanut oil soap stock (PSS), a highfree fatty acid feedstock, using a fixed-bed reactor at temperatures between 450 and 550 �C with a zeolitecatalyst (HZSM-5). PSS fed at 81 g h�1 along with 100 mL min�1 inert gas was passed across a 15 g cata-lyst bed (WHSV = 5.4 h�1, gas phase residence time = 34 s). Results indicate that fuel properties of PSSincluding viscosity, heating value, and O:C ratio were improved significantly. For PSS processed at500 �C, viscosity was reduced from 59.6 to 0.9 mm2 s�1, heating value was increased from 35.8 to39.3 MJ L�1, and the O:C ratio was reduced from 0.07 to 0.02. Aromatic gasoline components (e.g., BTEX),were formed in concentrations as high as 94% (v/v) in catalytically-cracked PSS with yields ranging from22% to 35% (v/v of PSS feed).
� 2011 Elsevier Ltd. All rights reserved.
1. Introduction
Fats and vegetable oils are common feedstocks for biofuel pro-duction, particularly for biodiesel. Biodiesel can be produced froma variety of oils containing mono- (free fatty acids or FFAs), di- andtri-glyceride (i.e. lipid) feedstocks. Although a wide variety ofplant- and animal-derived feedstocks is available, the cost is highlyvariable with feedstock ranging from 0.20 to 2.0$ lb�1 (between2000 and 2006) (Ash and Wittenberger, 2010) which can makethe cost of biodiesel production unpredictable and often unprofit-able. In the US, soybean oil, containing lipids with mainly oleic andlinoleic fatty acids, is a commonly-used feedstock. However, soy-bean oil is a traded commodity, and using soybean oil for biodieselproduction directly competes with food uses, which increases theprice for both uses. Mixtures of FFAs and lipids are common, espe-cially in waste fats and oils (e.g., yellow grease, tallow, and soapstock) resulting in a much lower feedstock quality and cost. Theestimated production cost of biodiesel generated from soybeanoil, yellow grease and petroleum in 2011 is 2.73$, 1.51$, and0.76$ gal�1, respectively (Radich, 1998). However, mixtures of FFAsand lipids, as in yellow grease, present difficulties in biodiesel syn-thesis, since separate catalytic steps are required; esterification ofthe FFAs using an acid catalyst followed by transesterification ofthe triglycerides using a base catalyst.
ll rights reserved.
nd Carbon Cycling Program,niversity of Georgia, Athens,+1 706 542 8806.
An alternate method for producing biofuels from fats and oils isvia a thermochemical pathway, such as pyrolysis or catalytichydrotreatment. Kanellos (2007) indicates that commercial enti-ties have shown interest in pursuing the development of fuels fromfats, including Tyson Foods and ConocoPhillips who, in a collabora-tive effort set a target of producing 175 million gallons of dieselfrom animal fats using conventional hydrotreatment processes inexisting refineries in 2008. The article states that the thermal tech-nology used by Conoco, known as hydrotreatment, results inhydrocarbons of the desirable quality, although demand for purehydrogen is high. However, this technology cannot be scaled downto distributed small units because of the difficulties in producingand handling hydrogen in small systems (Kanellos, 2007). Thus,there is a need to develop catalytic processes capable of transform-ing high FFA feedstocks to liquid fuels without the need for gaseousH2 allowing for the design of distributed small or regionalbiorefineries.
Many studies have demonstrated thermochemical conversionas a means to generate liquid fuel from mono- (free fatty acid orFFA), di-, and tri-glyceride (TG) feedstocks without costly hydrogenaddition. Adebanjo et al. (2005) explored pyrolysis of animal fat(mainly saturated TGs), which generated an oil exhibiting a verysimilar cetane number and heat of combustion as those specifiedby ASTM for diesel fuel. Hilten et al. (2010) produced a gasoline-like fuel via pyrolysis and catalytic cracking of poultry processingwaste containing FFAs, TGs, and protein. Other studies have pro-duced diesel-like fuels from pyrolysis of vegetable oil feedstocks,such as soybean oil (Lima et al., 2004; Wiggers et al., 2009). Manystudies have added catalysts to the process in fixed-bed reactors to
R. Hilten et al. / Bioresource Technology 102 (2011) 8288–8294 8289
catalytically crack oils to produce fuels from plant-derived oils(Anjos et al., 1983; Dandik et al., 1998; Twaiq et al., 2003; Limaet al., 2004). Several studies (Twaiq et al., 1999, 2003, 2004; Tam-unaidu and Bhatia, 2007) have used catalytic cracking to generatehigh yields of liquid hydrocarbons from palm oil waste. For exam-ple, Twaiq et al. (2003) cracked palm oil using a mesoporous acidcatalyst and achieved an 80–90% yield of liquid hydrocarbons.Additionally, several studies have used solid acid zeolite catalyststo upgrade vegetable oils to liquid fuels via fluid catalytic cracking(FCC) (Li et al., 1999; Ooi et al., 2004; Padmaja et al., 2009). Crack-ing studies have used a variety of acidic mono- and bi-functionalcatalysts at various pore size and functionality. Catalysts used inprevious studies for cracking FFAs and TGs include MCM-41 (Twaiqet al., 2003), SBA-15 (Yean-Sang and Bhatia, 2007), and HZSM-5(Dandik et al., 1998; Twaiq et al., 2004). Basic catalysts such aspotassium carbonate (K2CO3) have also been used to upgrade veg-etable oils including soybean oil (Xu et al., 2010).
A wide variety of waste and by-product oils could potentially beutilized for biofuel production via thermochemical pathways. Forexample, during peanut processing, waste oils are generated thatcould conceivably be converted to liquid fuels. One such wastematerial is peanut oil soap stock (PSS), a peanut processing by-product containing high levels of free fatty acids and emulsifiedwater that is often underutilized due to the limited number of op-tions for processing to higher-value products. Generated duringvegetable oil refining, soap stock (SS) can be acidified to demulsifywater while concentrating free fatty acids (FFAs). The FFA mixture,acidulated peanut oil soap stock (a.k.a. acid oil), can subsequentlybe used as feedstock for biodiesel production. Although there issome industrial use of SS, it is sporadic, and thus price can signif-icantly fluctuate and generate little economic return (Haas et al.,2003). A potentially more favorable route would be to directly con-vert PSS into a value-added product, such as a liquid transportationfuel via a thermochemical pathway.
Few studies can be found that attempt catalytic pyrolysis as ameans to generate fuel or fuel additives from soap stock and nostudies were found that attempt the process with soap stock frompeanut-derived feedstock. One study found, Doll et al. (2008),generated biofuel from a soap stock (soybean-derived), but in anon-catalytic pyrolysis process. Use of catalysts for the conversionprocess could conceivably improve the process by both increasingyields and decreasing the temperature required for conversion.
For this study, we proposed to generate fuel quality productfrom a high FFA soap stock, PSS, by direct processing in a catalyticpyrolysis reactor. Using HZSM-5, an acidic microporous zeolite cat-alyst, we expected that the PSS upgrading process would result inthe formation of fuel-like hydrocarbons. Additionally, we proposedthat the fuel-like hydrocarbons would be in the form of aromatics(e.g., benzene, xylene, and toluene), components in gasoline repre-senting approximately 20% (v/v) (EPA, 2008), following severalproposed reaction pathways. The resulting product would be inthe form of a high-octane liquid fuel or fuel additive. Given our re-sults, we believe the process could easily be integrated into peanutprocessing plants with the resultant products used as process fuelor sold as liquid transportation fuel.
a Assuming an average chemical formula, C8H18.b Assuming an average chemical formula, C12H23.c By difference.d As received.e Dry basis.f Measured at 40 �C.
2. Materials and methods
2.1. Feedstock
Acidulated peanut oil soap stock (PSS) containing mainly freefatty acids (FFAs) was supplied by Golden Peanut Co., LLC. Table1 provides the fatty acid profile for PSS. Oleic and linoleic acidsare the main components in PSS. As such, a model compound mix-ture containing linoleic (70%) and oleic (30%) acid (denoted as LA
for the linoleic acid in the mixture)) was chosen for comparisonand supplied by Sigma–Aldrich. Table 2 provides additional com-positional data for PSS, LA, gasoline, biodiesel and No. 2 diesel.
2.2. Free fatty acid conversion to fuel
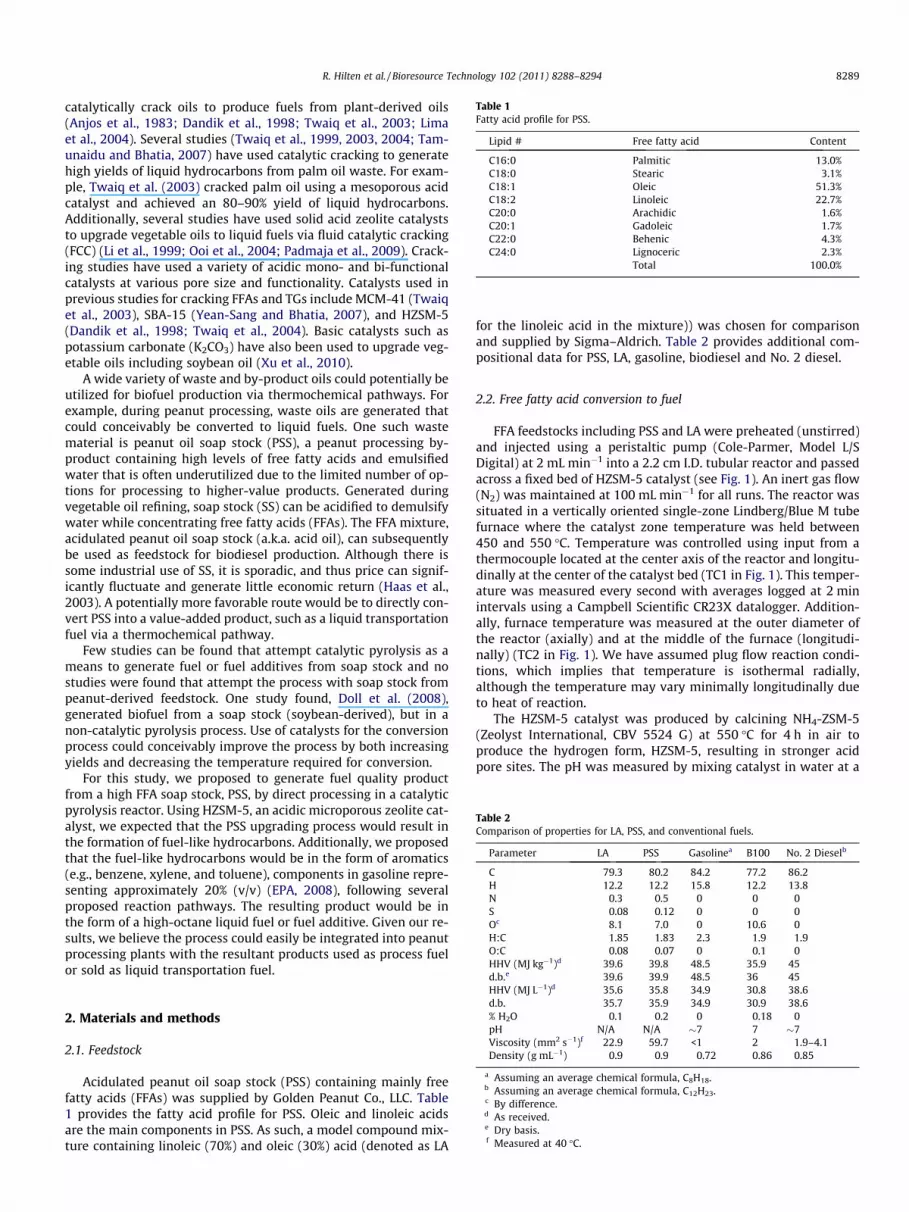
FFA feedstocks including PSS and LA were preheated (unstirred)and injected using a peristaltic pump (Cole-Parmer, Model L/SDigital) at 2 mL min�1 into a 2.2 cm I.D. tubular reactor and passedacross a fixed bed of HZSM-5 catalyst (see Fig. 1). An inert gas flow(N2) was maintained at 100 mL min�1 for all runs. The reactor wassituated in a vertically oriented single-zone Lindberg/Blue M tubefurnace where the catalyst zone temperature was held between450 and 550 �C. Temperature was controlled using input from athermocouple located at the center axis of the reactor and longitu-dinally at the center of the catalyst bed (TC1 in Fig. 1). This temper-ature was measured every second with averages logged at 2 minintervals using a Campbell Scientific CR23X datalogger. Addition-ally, furnace temperature was measured at the outer diameter ofthe reactor (axially) and at the middle of the furnace (longitudi-nally) (TC2 in Fig. 1). We have assumed plug flow reaction condi-tions, which implies that temperature is isothermal radially,although the temperature may vary minimally longitudinally dueto heat of reaction.
The HZSM-5 catalyst was produced by calcining NH4-ZSM-5(Zeolyst International, CBV 5524 G) at 550 �C for 4 h in air toproduce the hydrogen form, HZSM-5, resulting in stronger acidpore sites. The pH was measured by mixing catalyst in water at a
Fig. 1. Reactor setup showing (1) PSS vessel, (2) hot plate, (3) peristaltic pump, (4)stainless steel reactor with oil preheat zone, (5) catalyst bed, (6) tube furnace, (7)collection flask, (8) ice bath, (9) compressed N2 tank and thermocouples (TC1 andTC2).
8290 R. Hilten et al. / Bioresource Technology 102 (2011) 8288–8294
50:50 ratio and then measuring the pH of the water using astandard pH probe. As a result of the calcining process, the pHwas reduced from 4.98 to 3.06. The NH4-ZSM-5 catalyst was re-ceived from the manufacturer as a fine powder. The catalyst pow-der has published values of 425 m2 g�1, 5 lm, and 50 for surfacearea, particle size and SiO2/Al2O3 ratio, respectively. To minimizethe pressure drop across the catalyst bed, the catalyst was granu-lated by mixing with water, drying, crumbling, and sieving to thedesired size, �0.5–1 mm. Products were collected in a flask(Fig. 1-7) in an ice bath (Fig. 1-8).
PSS and LA were catalytically pyrolyzed using a reactor and pro-cess similar to that described by ASTM D5154, ‘‘Standard testmethod for determining activity and selectivity of fluid catalyticcracking (FCC) catalysts by microactivity testing.’’ For this work,changes that were made to the reactor described in ASTM D5154as follows: a peristaltic pump was used as opposed to a syringepump, the reactor size was increased to 25.4 mm O.D. (22.1 mmI.D.) as opposed to 18 mm O.D. (15.6 mm I.D.), fresh catalyst wasused in all experiments (i.e. no catalyst were reused) as opposedto equilibrium (i.e. previously-regenerated) catalyst, furnace tem-perature control was accomplished using one thermocouple as op-posed to three, catalyst temperature was monitored using onethermocouple as opposed to three, and a 15 g catalyst bed wasused as opposed to 4 g. During processing, the feedstock waspassed across a 15 g (7.5 cm depth, 28.5 cm3 volume) fixed bedof HZSM-5 maintained at 450, 500, or 550 �C.
Catalyst to oil ratio (C/O) is defined by ASTM D5154 as the massof catalyst in the bed divided by the mass of feed fed to the reactor,and was �0.4 (15 g) for the PSS and LA experiments. The weighthourly space velocity (WHSV, units are h�1), is defined as the oilfeed rate (2 mL min�1 or �81 g h�1 based on measured density) di-
vided by the mass of catalyst (g), and was 5.4 h�1. Catalyst contacttime (i.e. time on stream), is defined as 3600/(WHSV � C/O), andwas 1667 s (�30 min). Based on the catalyst bed height (7.5 cm)and carrier gas flowrate (100 mL min�1), the gas phase residencetime in the catalytic zone was approximately 34 s. Control runswere accomplished by passing feedstock across an empty bed ateach operating temperature (450, 500, and 550 �C) for comparisonto catalyzed runs.
Reactor and catalyst were weighed before and after each run todetermine the extent of residue formation. Residue was catego-rized and quantified as coke, char, or tar. Coke was consideredthe amount of material adhered to the catalyst after washing withacetone. Char was defined as the material that formed in the reac-tor, but not on the catalyst itself. Finally, tar was considered theacetone-soluble material that was removed from the catalyst bywashing. Liquid yield was categorized as either oily or aqueousphase. The percent yield of oily and aqueous phase was determinedrelative to the total amount of oil introduced to the reactor.
2.3. Product characterization methods
Product parameters assessed included chemical composition ofliquid product (via GC–MS, GC–FID) and gas (via GC–TCD), elemen-tal content (C, H, N, S and O), H:C and O:C ratio, higher heating va-lue (HHV), H2O content, viscosity and density (q), and pH.
The formation of desired compounds, particularly aromaticgreen gasoline-range hydrocarbons, was verified using a Agilent(model HP-6890) gas chromatograph containing an HP-5 MS col-umn, 30 m in length, with a 0.25 mm I.D. and 0.25 lm film thick-ness in conjunction with a Hewlett Packard mass spectrometer(model HP-5973) with a mass selective detector. The method usedwas as follows: inlet temperature of 230 �C, detector temperatureat 280 �C (MS interface temperature), a flow of 1 mL min�1 He,the oven initially at 40 �C for 2.5 min followed by a ramp at8 �C min�1 to 250 �C (held for 5 min). Masses were scanned from15 to 500 mass units. Sample size was 1 lL and was prepared foranalysis by diluting to 2.5% in a 50:50 acetone/methanol mixture.
Chromatograms and spectra were viewed and compounds wereidentified using Agilent Technologies software (MSD ChemStationD.03.00.611), which uses a probability-based matching (PBM)algorithm to match unknown spectra to those found in a library.The mass spectral library used was the National Institute of Stan-dards and Technology’s 1998 version (NIST 98).
BTEX compounds were quantified using a Hewlett PackardGC-FID (model HP-5890). The GC was equipped with an AgilentHP-5 column (crosslinked 5% PH ME Siloxane, 30 m �0.25 mm � 0.25 lm film thickness). A five-point standard calibra-tion curve was developed using a BTEX standard (containing ben-zene, toluene, ethylbenzene, and o-, m- and p-xylene) in methanol(Sigma–Aldrich). For the analysis, the inlet and detector tempera-tures were maintained at 220 and 230 �C, respectively. The oventemperature was held at 50 �C for 3 min, then ramped at8 �C min�1 to 180 �C and held for 1 min. The injection volumewas 1 lL. Samples were mixed in the same ratios as in the GC–MSanalysis (2.5% in 50:50 acetone:methanol). Yields were determinedrelative to the amount of feedstock injected and concentration wasdetermined relative to liquid product.
Measurement of elemental CHNS-O content was accomplishedby instrumental means using a CHNS analyzer (LECO, modelCHNS932) following a modified version of ASTM D5291. UsingCHNS results, oxygen was calculated by difference. Based onCHNS-O results, H:C and O:C ratios were obtained. The molar ratioof hydrogen to carbon is a good indicator of the existence of hydro-carbons in bio-oil. Given the average chemical formula of dode-cane, C12H23, diesel fuel has an H:C ratio of 1.92. This is expectedsince compounds comprising diesel are mostly long-chain
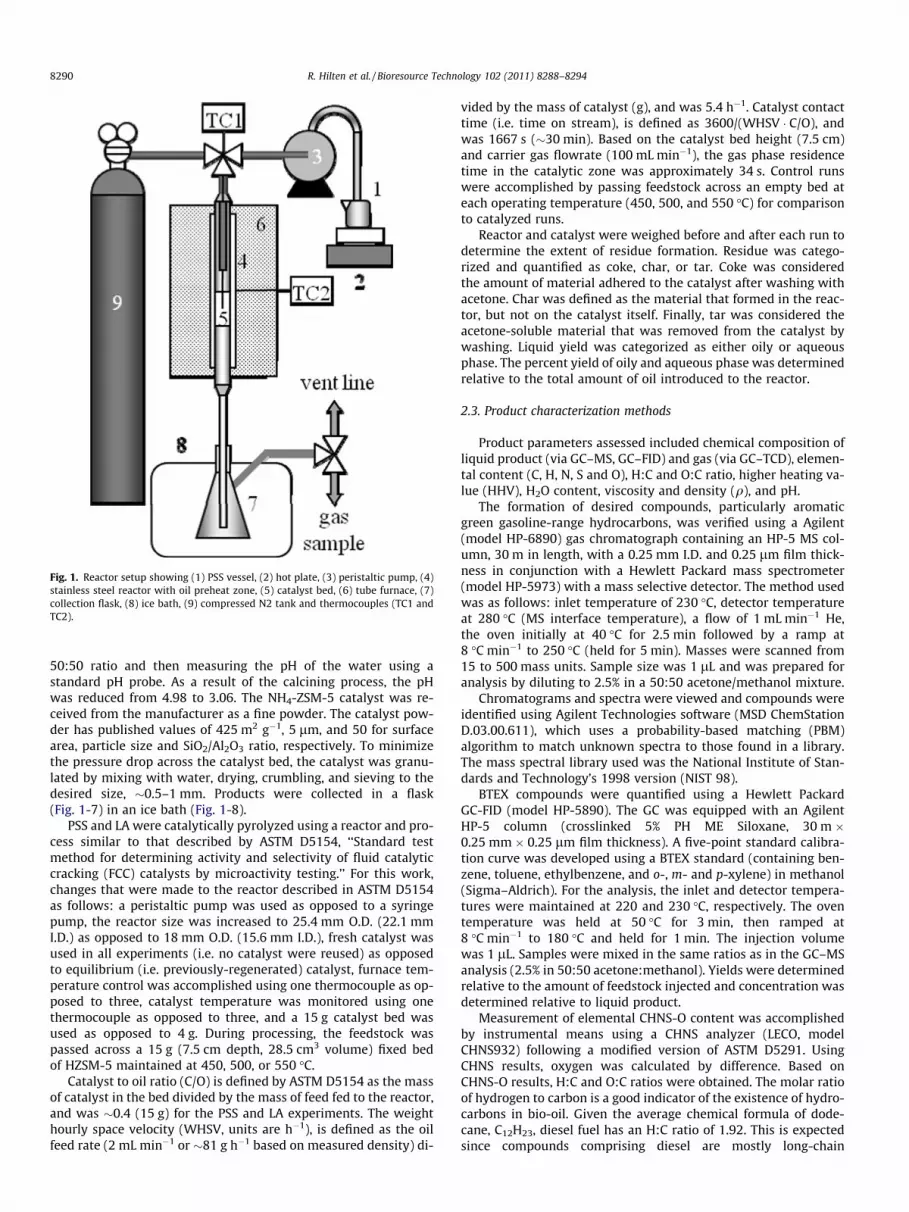
Fig. 2. Yield of products and co-products derived from FFA after catalytic pyrolysisat 500 �C.
R. Hilten et al. / Bioresource Technology 102 (2011) 8288–8294 8291
hydrocarbons where each ‘‘link’’ in the chain is composed of twohydrogen atoms attached to one carbon. Thus, the ratio shouldbe approximately 2. For biodiesel, H:C is approximately 1.9, butvaries with the level of saturation in the C–C bonds of the feedstockused to produce the material. For gasoline, H:C is approximately2.3 assuming an average chemical formula, C8H18 (octane). For un-leaded gasoline, the maximum allowable sulfur content is 0.035%.For ultra-low sulfur diesel, the maximum allowable sulfur contentis 0.0015%.
The ratio of oxygen to carbon, O:C, indicates the level of oxygen-ation in a material. For diesel fuel, the O:C ratio is essentially zero.Biodiesel FAMEs have an oxygen content of approximately 10%,resulting in an O:C ratio of 0.1. For gasoline, the ratio variesdepending on the amount of oxygenates added, which can includemethyl tert-butyl ether (MTBE), ethyl tert-butyl ether (ETBE), orethanol. Although fuel oxygenates increase combustion efficiencyof, the heating value is decreased resulting in lower fuel economy.For comparison purposes, we will assume the O:C ratio to be zerofor gasoline. However, reformulated gasoline (RFG), a fuel designedto reduce air pollution, has additives that raise oxygen content toaround 2% (EPA, 2006). Reducing the oxygen content in biofuelsis currently a primary goal for many researchers. Pyrolysis-derivedbio-oils are no exception with bio-oils commonly containing >20%oxygen by weight. Catalytic upgrading using solid acid zeolites isone proposed method to decrease oxygen content and improveheating value.
HHV was determined by combusting a 0.5 g sample in a bombcalorimeter (Ika model C2000) following ASTM D240. It wasdesired to upgrade PSS such that the HHV was similar to that ofconventional fuels. The HHV for diesel is about 45 MJ kg�1 or38.6 MJ L�1. Biodiesel’s HHV is usually between 36 and 40 MJ kg�1
or 31–34 MJ L�1. For gasoline, the value is 48.5 MJ kg�1
(34.9 MJ L�1).Water content in the oils was determined by Karl Fischer titra-
tion using a Mettler–Toledo titrator (model DL31), following ASTME203 guidelines. Water content in diesel and gasoline is essentially0.0%, while in biodiesel, it is substantially less than 1%.
Dynamic viscosity was measured using a Brookfield (model DV-I+) rotational viscometer with a ULA-ZY low-volume adapter. Kine-matic viscosity was calculated by dividing dynamic viscosity bydensity as measured by a 2 mL Gay–Lussac pycnometer. Viscosityis important, since engine components (e.g., injectors, pumps,and filters) are sized based on fuel properties such as viscosity.Higher viscosity fuels require larger fuel lines, more robust fuel fil-ters, and larger injectors. According to ASTM D975, the acceptablerange for diesel fuel kinematic viscosity is 1.9–4.1 mm2 s�1 mea-sured at 40 �C. For biodiesel, kinematic viscosity can be as highas 6.0 mm2 s�1, and for gasoline kinematic viscosity should be lessthan 1 mm2 s�1. The suggested density for diesel and gasoline is0.85 and 0.72 g mL�1, respectively.
The pH of liquid product was measured directly using a Met-tler–Toledo pH meter and probe. For fuels including diesel, biodie-sel, and gasoline, pH values are near-neutral.
3. Results and discussion
3.1. Free fatty acid conversion to fuel
Generally, cracking processes generate five products including afuel-like oil, an acetone-soluble tar, reactor char, catalyst coke, anaqueous phase liquid, and non-condensable gases. Fig. 2 illustratesthe effect of catalyst, HZSM-5, on the yield of products and co-products from the catalytic cracking of PSS at 500 �C. No tar wasrecovered from LA or PSS upgrading. Other pyrolysis temperaturesindicated similar trends in terms of product and by-product yield.
The addition of catalyst affected PSS and LA similarly, with compa-rable drops in yield of oily product and an increase in non-con-densable gas formation although the quality of the product wasgreatly improved (see Section 3.2). Feedstock significantly influ-enced char, oil, and aqueous phase yield at a = 0.05 and gas yieldat a = 0.1, but it did not significantly affect coke yield at a = 0.1.Specifically for PSS, char and gas yields were higher and oily andaqueous phase yields were lower relative to LA. With increasingconversion temperature, oil yield was significantly decreased whilegas and coke yield were significantly increased at a = 0.05 and 0.1,respectively, but did not significantly affect char or aqueous prod-uct yield at a = 0.1. The presence of HZSM-5 catalyst significantlyincreases coke, char, aqueous phase, and gas yield while signifi-cantly decreasing oil yield at a = 0.05 (Fig. 2). Additionally, noaqueous phase was formed for samples processed at 500 �C inthe absence of catalyst.
3.2. Product characterization
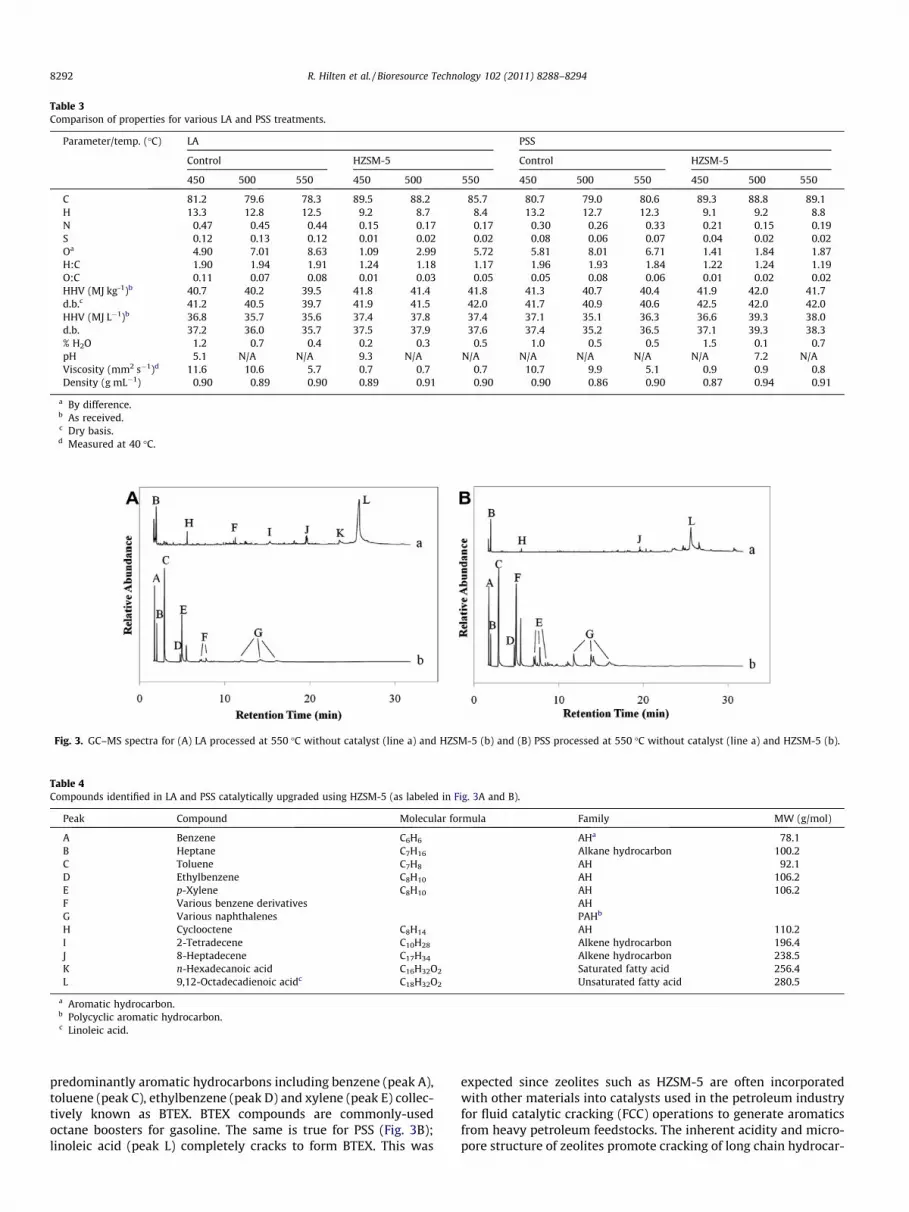
Although the yield of oily product decreased with the additionof catalyst, the quality of PSS oil was significantly improved dueto catalytic cracking. Table 3 gives characterization results for bothPSS and LA processed at 450, 500, and 550 �C with and without cat-alyst. The carbon content significantly increased for HZSM-5-pro-cessed PSS and LA at a = 0.05. More importantly, oxygen contentdeclined significantly, which led to significantly higher heating val-ues. Another major improvement was a significant decrease in vis-cosity relative to unprocessed PSS and LA (compare Tables 2 and 3).After processing with HZSM-5, viscosity values for both PSS and LAwere in the range required for gasoline and significantly lowerthan values for materials processed at temperature without cata-lyst. Also, for catalytically-processed material, sulfur content waswithin specifications for gasoline (<0.035%) for all feedstock/tem-perature combinations excluding PSS at 450 �C while control(non-catalyzed) products were not. From this observation, it is evi-dent that HZSM-5 also promotes desulfurization thereby improv-ing fuel properties.
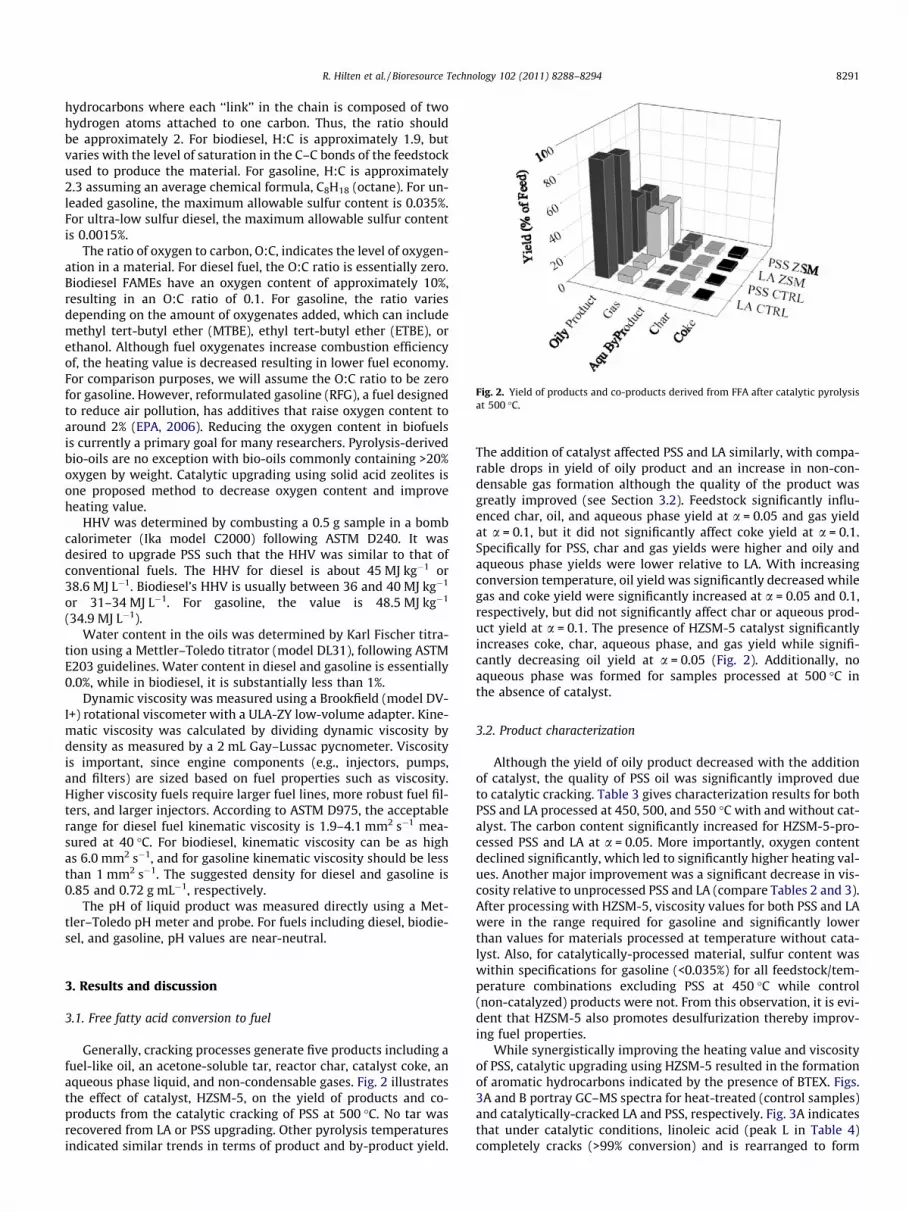
While synergistically improving the heating value and viscosityof PSS, catalytic upgrading using HZSM-5 resulted in the formationof aromatic hydrocarbons indicated by the presence of BTEX. Figs.3A and B portray GC–MS spectra for heat-treated (control samples)and catalytically-cracked LA and PSS, respectively. Fig. 3A indicatesthat under catalytic conditions, linoleic acid (peak L in Table 4)completely cracks (>99% conversion) and is rearranged to form
Table 3Comparison of properties for various LA and PSS treatments.
a By difference.b As received.c Dry basis.d Measured at 40 �C.
Fig. 3. GC–MS spectra for (A) LA processed at 550 �C without catalyst (line a) and HZSM-5 (b) and (B) PSS processed at 550 �C without catalyst (line a) and HZSM-5 (b).
Table 4Compounds identified in LA and PSS catalytically upgraded using HZSM-5 (as labeled in Fig. 3A and B).
Peak Compound Molecular formula Family MW (g/mol)
A Benzene C6H6 AHa 78.1B Heptane C7H16 Alkane hydrocarbon 100.2C Toluene C7H8 AH 92.1D Ethylbenzene C8H10 AH 106.2E p-Xylene C8H10 AH 106.2F Various benzene derivatives AHG Various naphthalenes PAHb
a Aromatic hydrocarbon.b Polycyclic aromatic hydrocarbon.c Linoleic acid.
8292 R. Hilten et al. / Bioresource Technology 102 (2011) 8288–8294
predominantly aromatic hydrocarbons including benzene (peak A),toluene (peak C), ethylbenzene (peak D) and xylene (peak E) collec-tively known as BTEX. BTEX compounds are commonly-usedoctane boosters for gasoline. The same is true for PSS (Fig. 3B);linoleic acid (peak L) completely cracks to form BTEX. This was
expected since zeolites such as HZSM-5 are often incorporatedwith other materials into catalysts used in the petroleum industryfor fluid catalytic cracking (FCC) operations to generate aromaticsfrom heavy petroleum feedstocks. The inherent acidity and micro-pore structure of zeolites promote cracking of long chain hydrocar-
R. Hilten et al. / Bioresource Technology 102 (2011) 8288–8294 8293
bons and size-selection end-product molecules, leading to the for-mation of high octane product (Blauwhoff et al., 1999).
The formation of BTEX has been proposed to form via two reac-tion pathways involving either a carbenium or carbonium ion reac-tion mechanism. This pathways has been suggested in Blauwhoffet al. (1999) and Benson et al. (2008). For oleic acid ((9Z)-octa-dec-9-enoic acid), as an example, the carbenium ion reaction path-way begins with a Brønsted acid site initiation step driven by aprotonation mechanism on the catalyst surface as follows:
The next step, propagation via hydride transfer, involves thereaction of the carbenium ion with another oleic acid moleculeto form a paraffin (stearic acid) and another carbenium ion asfollows:
CH3 � ðCH2Þ7 � CH2 � CHþ�ðCH2Þ7 � COOHþ CH3
� ðCH2Þ7 � CH@CH� ðCH2Þ7 � COOH
! CH3 � ðCH2Þ7 � CH2 � CH2 � ðCH2Þ7 � COOHþ CH3
� ðCH2Þ7 � CH2 � CHþ�ðCH2Þ7 � COOH ð2Þ
Next, a b-scission cracking step forms another carbenium ionand an olefin as follows:
The carbenium ion is then free to react with another oleic acidmolecule or enter the catalyst pore spaces where cyclization andaromatization occur:
CH3 � ðCH2Þ6 � CHþ2 ! CH3 � CH@CH
� C6H6 ðð1EÞ-prop-1-en-1-ylbenzeneÞð4Þ
CH3 � ðCH2Þ6 � CHþ2 ! CH2@CH2 � CH3 � CH3
� C6H6 ðbut-3-en-1-ylbenzeneÞ ð5Þ
Alternately, following the carbonium ion pathway, the initiationstep for the reaction is catalyzed by a Brønsted acid on a surfacesite as follows:
CH3 � ðCH2Þ7 � CH@CH� ð9m2Þ7 � COOHþHZ
! CH3 � ðCH2Þ7 � CH3 � Cþ�ðCH2Þ7 � COOHþ Z� ð6Þ
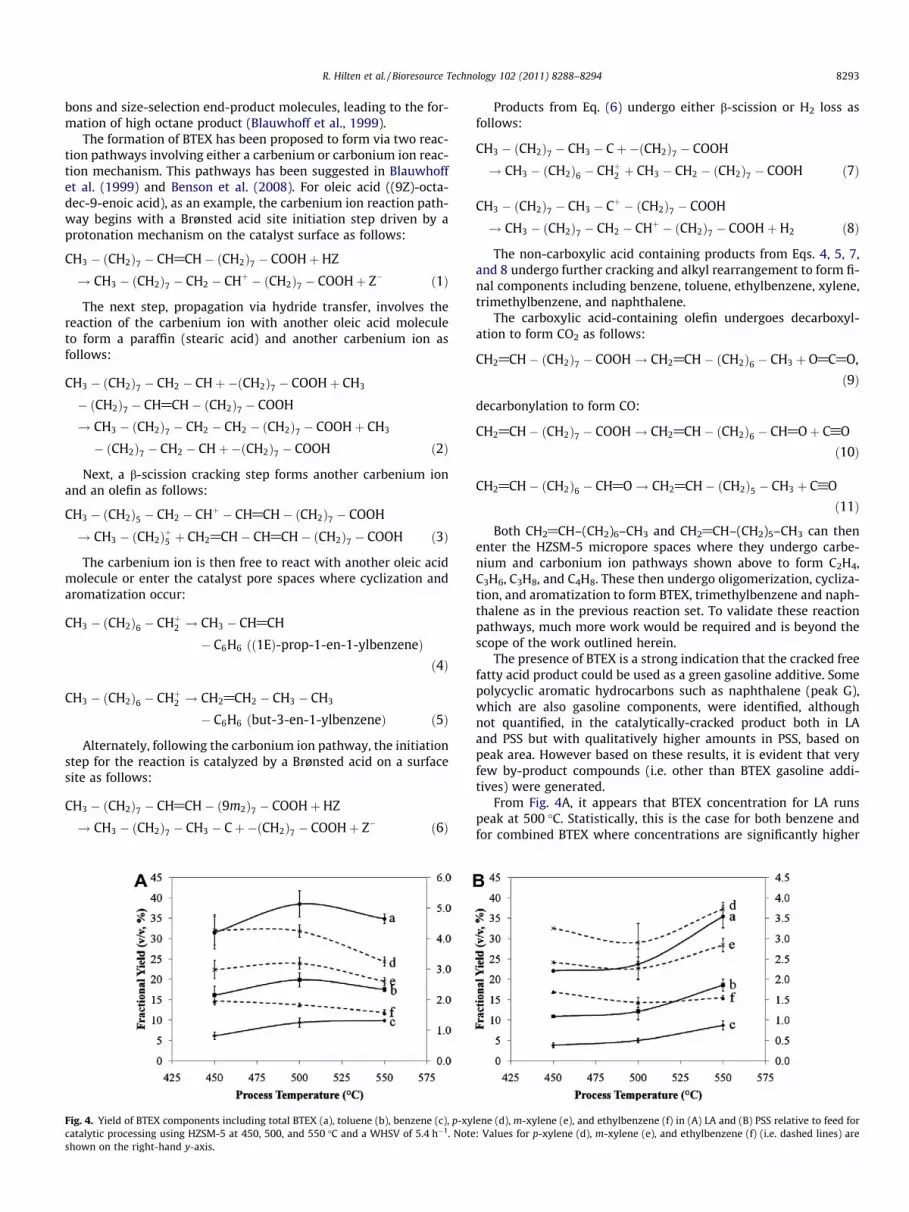
Fig. 4. Yield of BTEX components including total BTEX (a), toluene (b), benzene (c), p-xycatalytic processing using HZSM-5 at 450, 500, and 550 �C and a WHSV of 5.4 h�1. Noteshown on the right-hand y-axis.
Products from Eq. (6) undergo either b-scission or H2 loss asfollows:
The non-carboxylic acid containing products from Eqs. 4, 5, 7,and 8 undergo further cracking and alkyl rearrangement to form fi-nal components including benzene, toluene, ethylbenzene, xylene,trimethylbenzene, and naphthalene.
The carboxylic acid-containing olefin undergoes decarboxyl-ation to form CO2 as follows:
Both CH2@CH–(CH2)6–CH3 and CH2@CH–(CH2)5–CH3 can thenenter the HZSM-5 micropore spaces where they undergo carbe-nium and carbonium ion pathways shown above to form C2H4,C3H6, C3H8, and C4H8. These then undergo oligomerization, cycliza-tion, and aromatization to form BTEX, trimethylbenzene and naph-thalene as in the previous reaction set. To validate these reactionpathways, much more work would be required and is beyond thescope of the work outlined herein.
The presence of BTEX is a strong indication that the cracked freefatty acid product could be used as a green gasoline additive. Somepolycyclic aromatic hydrocarbons such as naphthalene (peak G),which are also gasoline components, were identified, althoughnot quantified, in the catalytically-cracked product both in LAand PSS but with qualitatively higher amounts in PSS, based onpeak area. However based on these results, it is evident that veryfew by-product compounds (i.e. other than BTEX gasoline addi-tives) were generated.
From Fig. 4A, it appears that BTEX concentration for LA runspeak at 500 �C. Statistically, this is the case for both benzene andfor combined BTEX where concentrations are significantly higher
lene (d), m-xylene (e), and ethylbenzene (f) in (A) LA and (B) PSS relative to feed for: Values for p-xylene (d), m-xylene (e), and ethylbenzene (f) (i.e. dashed lines) are
8294 R. Hilten et al. / Bioresource Technology 102 (2011) 8288–8294
than for 450 or 550 �C processing. For toluene, the yield at 500 �C issignificantly higher (p < 0.05) than at 450 �C, but not significantlyhigher than at 550 �C. The remaining BTEX components show nosignificant difference in concentration due to process temperature.As seen in Fig. 4B, yields of benzene and toluene and total BTEXgenerally increased with increasing pyrolysis temperature forPSS. There was a statistically significant increase in benzene con-centration in PSS when process temperature was increased from450 to 500 �C (p < 0.001) and from 500 to 550 �C (p < 0.001), butnot from 450 to 500 �C (p = 0.173). The same was true for both tol-uene and total BTEX. For LA, the optimum temperature for BTEXformation appeared to be 500 �C, while for PSS, the optimum inthe temperature range of the study was 550 �C. However, sinceBTEX yields were still increasing at 550 �C, the peak yields may oc-cur at higher temperatures and is currently under investigation.The increase in benzene concentration at the expense of tolueneand xylene, as in LA processing (Fig. 4A) indicates that methylatedaromatics, such as xylene, are undergoing further reactions (re-moval of side chains) due to higher temperature resulting in great-er formation the simplest aromatic, benzene. We propose that theincrease in benzene formation occurred as a result of catalyticdealkylation of xylene and toluene as described in Weigert andRagosta (1993) and Al-Khattaf (2006). The reaction is as followsfor toluene (Ph-CH3) dealkylation:
Ph� CH3 þH2O! PhHþ COþ 2H2 ð12Þ
Water for the reaction is derived from various cracking reac-tions. For xylene, the reaction above would occur twice sequen-tially; once to form toluene from xylene and once to formbenzene from toluene. For PSS, if reactor residence times were in-creased or reaction temperature was increased, an increase in theyield of benzene relative to other BTEX compounds would likelybe evident.
4. Conclusions
Our results demonstrate that green gasoline additives com-posed primarily of BTEX and with fuel properties comparable togasoline can be generated from peanut soapstock. Biofuel yieldsranged from 38 to 45% (w/w) with BTEX selectivity approaching94% (v/v of product). By-product yields including non-condensablegas, catalyst coke and char were low. Processing PSS at 500 �C withHZSM-5 improved fuel properties relative to PSS feed as follows:
– kinematic viscosity was reduced 98% from 59.6 to 0.9 mm2 s�1,– heating value was increased 10% from 35.8 to 39.3 MJ L�1, and– O:C ratio was reduced 71% from 0.07 to 0.02.
Acknowledgements
The authors thank industry collaborator, DuBoise White ofGolden Peanut Co. (Alpharetta, GA), for supplying PSS feedstockand feedstock characterization for material used for the work. Also,we thank Andrew Smola and Joby Miller for their work to analyze
materials. The work was funded by the State of Georgia’s FoodIndustry Partnership Program (FY2010). The funding agencyplayed no role in the study design, in the collection, analysis andinterpretation of data, in the writing of the report, or in the deci-sion to submit this paper for publication.
References
Adebanjo, A.O., Dalai, A.K., Bakhshi, N.N., 2005. Production of diesel-like fuel andother value-added chemicals from pyrolysis of animal fat. Energy Fuels 19 (4),1735–1741.
Al-Khattaf, S., 2006. Catalytic transformation of toluene over a high-acidity Y-zeolite based catalyst. Energy Fuels 20, 946–954.
Anjos, J., Gonzalez, W., Lam, Y., Frety, R., 1983. Catalytic decomposition of vegetableoil. Applied Catalysis 5, 299–308.
Ash, M., Wittenberger, K., 2010. Oil Crops Outlook. USDA Report OCS-10j, 18 pp.Benson, T., Hernandez, R., White, M., French, W., Alley, E., Holmes, W., Thompson, B.,
2008. Heterogeneous cracking of an unsaturated fatty acid and reactionintermediates on H+ZSM-5 catalyst. Clean 36 (8), 652–656.
Blauwhoff, P., Gosselink, J., Kieffer, E., Sie, S., Stork, W., 1999. Zeolites as Catalysts inIndustrial Processes. In: Weitkamp, J., Puppe, L. (Eds.), Catalysis and Zeolites:Fundamentals and Applications. Springer-Verlag, Berlin, pp. 437–538.
Dandik, L., Aksoy, H., Erdem-Senatalar, A., 1998. Catalytic conversion of used oil tohydrocarbon fuels in a fractionating pyrolysis reactor. Energy Fuels 12, 1148–1152.
Doll, K., Sharma, B., Suarez, P., Erhan, S., 2008. Comparing biofuels obtained frompyrolysis, of soybean oil or soapstock, with traditional soybean biodiesel:density, kinematic viscosity, and surface tensions. Energy Fuels 22 (3), 2061–2066.
EPA, 2006. 1995-2006 RFG Surveys by Area. US Environmental Protection Agency.EPA, 2008. Fuel Trends Report: Gasoline 1995-2005. Report number EPA420-R-08-
002. US Environmental Protection Agency.Haas, M., Michalski, P., Runyon, S., Nunez, A., Scott, K., 2003. Production of FAME
from acid oil, a by-product of vegetable oil refining. JAOCS 80 (1), 97–102.Hilten, R., Speir, R., Kastner, J., Das, K.C., 2010. Production of fuel from the catalytic
cracking of pyrolyzed poultry DAF skimmings. J. Anal. Appl. Pyrol. 88, 30–38.Kanellos, M., 2007. ‘‘Tyson, ConocoPhillips link up for biodiesel.’’ CNETnews.com.Li, H., Shen, B., Kabalu, J.C., Nchare, M., 1999. Enhancing the production of biofuels
from cottonseed oil by fixed-fluidized bed catalytic cracking. Renewable Energy34, 1033–1039.
Lima, D., Soares, V., Ribeiro, E., Carvalho, D., Cordoso, E., Rassi, F., Mundim, K., Rubim,J., Suarez, P., 2004. Diesel-like fuel obtained by pyrolysis of vegetable oils. J.Anal. Appl. Pyrolysis 71, 987–996.
Ooi, Y., Zakaria, R., Mohamed, A., Bhatia, S., 2004. Catalytic conversion of palm oil-based fatty acid mixture to liquid fuel. Biomass Bioenergy 27, 477–484.
Padmaja, K., Atheya, N., Bhatnagar, A., 2009. Upgrading of Candelilla biocrude tohydrocarbon fuels by fluid catalytic cracking. Biomass Bioenergy 33, 1664–1669.
Radich, A., 1998. Biodiesel Performance, Costs, and Use. Energy InformationAdministration.
Tamunaidu, P., Bhatia, S., 2007. Catalytic cracking of palm oil for the production ofbiofuels: optimization studies. Bioresour. Technol. 98, 3593–3601.
Twaiq, F., Zabidi, N.A.M., Bhatia, S., 1999. Catalytic conversion of palm oil tohydrocarbons: performance of various zeolite catalysts. Ind. Eng. Chem. Res. 38,3230–3238.
Twaiq, F., Mohamed, A., Bhatia, S., 2003. Liquid hydrocarbon fuels from palm oil bycatalytic cracking over aluminosilicate mesoporous catalysts with various Si/Alratios. Microporous Mesoporous Mater. 64 (1–3), 95–107.
Twaiq, F.A.A., Mohamad, A.R., Bhatia, S., 2004. Performance of composite catalysts inpalm oil cracking for the production of liquid fuels and chemicals. Fuel Process.Technol. 85 (11), 1283–1300.
Wiggers, V., Meier, H., Wisniewski, A., Barros, A., Maciel, M., 2009. Biofuels fromcontinuous fast pyrolysis of soybean oil: a pilot plant study. Bioresour. Technol.100, 6570–6577.
Xu, J., Jiang, J., Sun, Y., Chen, J., 2010. Production of hydrocarbon fuels from pyrolysisusing a basic catalyst. Bioresour. Technol. 101, 9803–9806.
Yean-Sang, O., Bhatia, S., 2007. Aluminum-containing SBA-15 as cracking catalystfor the production of biofuel from waste used palm oil. Micropor. Mesopor.Mater. 102, 310–317.