See discussions, stats, and author profiles for this publication at: https://www.researchgate.net/publication/258640738 Olive (Olea europaea L.) Tree Nitrogen Status Is a Key Factor for Olive Oil Quality ARTICLE in JOURNAL OF AGRICULTURAL AND FOOD CHEMISTRY · NOVEMBER 2013 Impact Factor: 2.91 · DOI: 10.1021/jf4031585 · Source: PubMed CITATIONS 4 READS 177 8 AUTHORS, INCLUDING: Zohar Kerem Hebrew University of Jerusalem 87 PUBLICATIONS 2,601 CITATIONS SEE PROFILE Alon Ben-Gal Agricultural Research Organization ARO 108 PUBLICATIONS 1,281 CITATIONS SEE PROFILE Amnon Schwartz Hebrew University of Jerusalem 70 PUBLICATIONS 1,878 CITATIONS SEE PROFILE Uri Yermiyahu Agricultural Research Organization ARO 53 PUBLICATIONS 876 CITATIONS SEE PROFILE Available from: Alon Ben-Gal Retrieved on: 04 February 2016
Olive (Olea europaea L.) Tree Nitrogen Status Is a Key Factor for OliveOil QualityRan Erel,†,§ Zohar Kerem,∥ Alon Ben-Gal,† Arnon Dag,‡ Amnon Schwartz,§ Isaac Zipori,‡ Loai Basheer,∥
and Uri Yermiyahu*,†
†Institute of Soil, Water and Environmental Sciences and ‡Institute of Plant Sciences, Gilat Research Center, Agricultural ResearchOrganization, Mobile Post Negev 2, 85280, Israel§Institute of Plant Sciences and Genetics in Agriculture, and ∥Institute of Biochemistry, Food Science and Nutrition, The Robert H.Smith Faculty of Agriculture, Food and Environment, The Hebrew University of Jerusalem, P.O. Box 12, Rehovot 76100, Israel
*S Supporting Information
ABSTRACT: The influence of macronutrient status on olive oil properties was studied for three years. Data were analyzed by amultivariate model considering N, P, K, and fruiting year as explanatory factors. Oil quality parameters were primarily associatedwith N concentration in leaves and fruits which increased with N in irrigation solution. The effect of P on oil quality was mainlyindirect since increased P availability increased N accumulation. The potassium level had negligible effects. The oil phenoliccontent decreased linearly as a function of increased leaf N, indicating protein−phenol competition in leaves. The overallsaturation level of the fatty acids decreased with fruit N, resulting in increased polyunsaturated fatty acids. Free fatty acidsincreased with increased levels of fruit N. High fruit load tended to reduce fruit N and subsequently improve oil quality. Theeffect of N on oil properties depended solely on its concentration in leaves or fruits, regardless of the cause.
Public perception of its gastronomic and health-related benefitshas led to continual increases in the global consumption ofvirgin olive oil (VOO). The growing demand for VOO has ledto the intensification of olive cultivation.1 Unlike most othervegetable oils, VOO is extracted solely by physical meanswithout the use of industrial solvents. Hence, VOO preservesboth the unique flavor and beneficial minor compounds. Inparticular, VOO has been found to reduce the risk ofcardiovascular diseases, cancer, obesity, type II diabetes, andmetabolic syndrome.2 The health properties of VOO arerelated to three major characteristics: the first, a highproportion of monounsaturated fatty acid (MUFA), namely,oleic fatty acid,3 the second, the existence of powerfulantioxidants, mainly phenolic compounds,4 and the third, thepresence of a variety of minor compounds beneficial to healthincluding sterols, carotenoids, squalene, and tocopherols.5
Many environmental, horticultural, and genetic factors mayalter olive oil properties. The most acknowledged are variety,climate, irrigation, fruit maturity level, pest damage, harvestmethod, and oil extraction method.6,7 Mineral nutrition has nottraditionally been considered to play a major role regarding oilquality.7,8 Since proper nutrition is essential for high yields,9
most of the trials regarding olive mineral nutrition examinednutritional effects on productivity rather than on quality. Anumber of studies are responsible for the general belief thatfertilization has an insignificant effect on oil quality. Inglese etal.10 and Ferreira et al.11 did not find any changes in fatty acidcomposition in response to nitrogen (N), phosphorus (P), andpotassium (K) application. Similarly, no effect on oil qualitywas found subsequent to urea application12 or for foliar N
application on FFA and oil fatty acid composition.13 In contrastto the above, recent studies indicate that macronutrients mayhave an effect on some VOO quality properties.14−17 In a long-term N trial, Fernandez-Escobar et al.14,18 reported that high Nfertilization caused a decrease in polyphenol content and thus adecrease in oil stability. In another experiment, using a modernfertigation system, the researchers found that increasingamounts of N, P, and K led to decreased polyphenols,bitterness, and oil stability.15 The percentage of MUFAdecreased, and consequently, the portion of polyunsaturatedfatty acids (PUFA) increased with increased fertigationconcentrations. Similarly, in a controlled container experiment,Dag et al.16 reported decreased oleic percentage andpolyphenol content in response to high levels of N and P,while K had only a minor effect. Recently, foliar nutrientapplication was reported to elevate the level of phytosterols anddecrease polyphenol content of olive oil.17 Interestingly, similarto that reported for olive oil, increasing N application wasfound to reduce phenol content and the oleic portion also inwalnut kernels.19
The references cited above indicate that present availableknowledge regarding the effect of mineral nutrition on oilquality is limited and inconsistent. The different conclusionsfound in the various studies have a number of explanations.One reason for the inconsistencies may be due to the essentialdifferences between traditional and modern cultivation systems,
Received: July 24, 2013Revised: September 30, 2013Accepted: October 30, 2013
for which nutrient availability and uniformity are significantlydifferent. This is especially true when taking into accountfertigation compared to traditional methods of drylandfertilization.20 Another potential complicating factor is thedependence of tree response to mineral nutrition on additionalaspects including: soil type,21 fruit load,22 and climate. Perhapsthe most compelling reason for the conflicting findingsregarding mineral nutrition is the way fertilization is beingassessed. The traditional way of examining nutritional effects inresponse to fertilizer application dose is problematic. Mineralstaken up and accumulating in the tree may be influenced by anumber of factors including fertilizer composition, applicationmethods (fertigation, soil application, or foliar spray), timing,soil physical and chemical properties, tree nutritional status, orenvironmental conditions. In particular, water availability ishighly important for determining plant response to miner-als.23,20 It is therefore necessary to evaluate tree nutritionalstatus rather than application rate when studying response tominerals.Leaf analysis is considered to be the best method for
diagnosing nutritional status in olives.24,25 However, fruitnutritional level is expected to be more relevant than leafconcentration regarding the examination of nutrient status onoil properties26 since the fruit is the site of oil biosynthesis.Another level of difficulty in studying the influence of mineralnutrition on oil quality is that interactions between minerals
frequently occur. Manipulation of a single mineral can directlyor indirectly affect the nutritional level of other minerals,23
making interpretation challenging. Therefore, assessment of theeffect of nutrients on oil quality must include consideration ofnutritional levels of each of the main minerals. In a previouspaper, we presented an analysis of the effect of single-factors N,P, and K on VOO quality for a single season.26 The aim of thepresent study was to further evaluate the effect of the threemajor nutrients and their interactions on VOO quality overmultiple fruiting years. To accomplish this, we investigated theeffect of mineral levels in fruits and leaves on oil obtained fromtrees receiving various fertilizer concentrations in theirirrigation solution. The data collected in the first season wasreprocessed and integrated with results from the following twoseasons. Naturally, during the three examined seasons trees haddifferent fruit bearing levels. A multivariate statistical model wasused in order to capture the interactions between N, P, and Knutritional levels in fruits and leaves on the major VOO qualityparameters.
■ MATERIALS AND METHODSPlant Material and Experimental Design. Olives (cv. Barnea)
were grown in containers at the Gilat Research Center, Israel. Twoyear old plants were planted in February 2006 in 60-L containers filledwith type 4 (4−6 mm) granular perlite. Initially, the trees wereirrigated excessively via a drip system twice a day with a nutrient
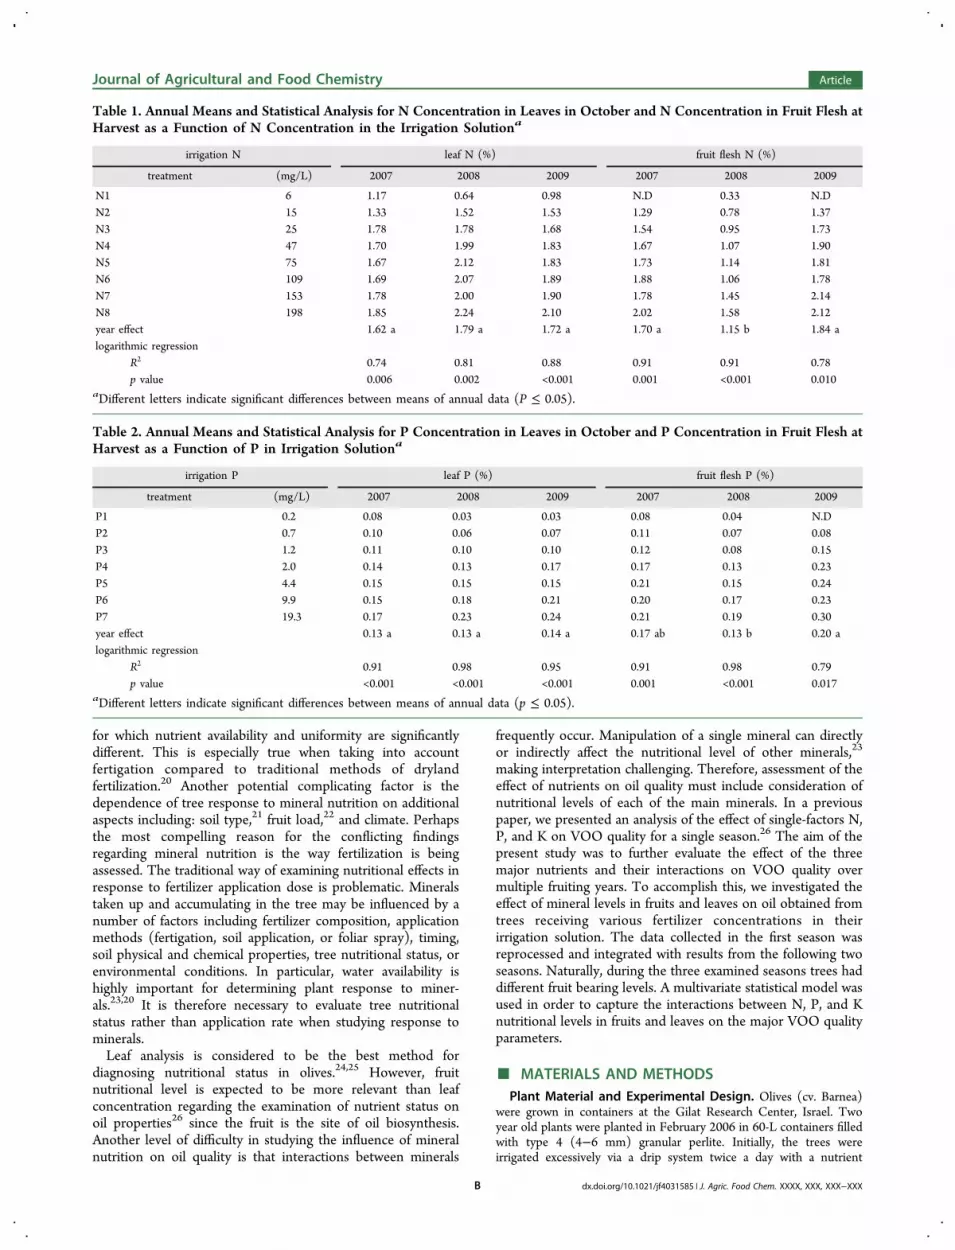
Table 1. Annual Means and Statistical Analysis for N Concentration in Leaves in October and N Concentration in Fruit Flesh atHarvest as a Function of N Concentration in the Irrigation Solutiona
aDifferent letters indicate significant differences between means of annual data (P ≤ 0.05).
Table 2. Annual Means and Statistical Analysis for P Concentration in Leaves in October and P Concentration in Fruit Flesh atHarvest as a Function of P in Irrigation Solutiona
aDifferent letters indicate significant differences between means of annual data (p ≤ 0.05).
Journal of Agricultural and Food Chemistry Article
dx.doi.org/10.1021/jf4031585 | J. Agric. Food Chem. XXXX, XXX, XXX−XXXB
solution containing 83, 16, and 69 mg/L of N, P, and K, respectively.Differential nutrient-irrigation treatments were initiated in September,2006. Average nutrient concentrations in irrigation solutions arepresented in Tables 1, 2, and 3 for the N, P, and K treatments,respectively. The 20 treatments included eight levels of N, seven levelsof P, and seven levels of K, with one of the treatments (N5, P6, andK6) common to all three variables. For each treatment, only onemineral was subject to manipulation. The concentrations of theremaining minerals were set to 70, 10, and 100 mg/L N, P, and K,respectively. The experiment used a randomized block design with sixreplicates. Following the first harvest on November, 2007, three treesper treatment were transplanted into 500 l containers filled with perlitesubstrate for two more seasons. Detailed experimental set upinformation and fertilizer composition are described by Erel et al.27,28
Fruit and Leaf Analysis. Fruits were harvested manually duringOctober−November of each fruiting year. Each tree was harvestedindependently when its maturity index reached ∼2.5 according to theIOC method.29 A sample of fruits was taken for mineral analysis. Afterthe stones were removed, fruit flesh was rinsed for 15 s in deionizedwater, dried at 60 °C, and ground to powder. Total N, P, and Kcontent was determined after digestion with sulfuric acid and hydrogenperoxide. The concentrations of N and P were determined with anautoanalyzer (Lachat Instruments, Milwaukee, Wisconsin, U.S.A.), andK content was determined with a flame photometer (Corning 400,Corning Inc., New York, U.S.A.). Leaf samples were taken close to theharvest in early November according to the common protocol.30 Theyoungest fully developed leaves were collected from the middleportion of nonbearing branches. Sampled leaves were washed, dried,and digested as described for fruits.Oil Extraction and Quality. Cold-pressed oil was obtained from
representative 1 kg fruit samples using an ‘Abencor’ laboratory mill(mc2 Ingenieria y Sistemas, Seville, Spain) in accordance with theprotocol described by Ben-David et al.31 Determination of free fattyacid (FFA) and peroxide value was carried out according to ISO 660and 3960, respectively. Total polyphenols, expressed as gallic acidequivalents (mg/kg), were determined with a UV visible spectropho-tometer (Beckman Coulter, Inc. Fullerton, CA, U.S.A.) at 765 nmusing the Folin−Ciocalteu reagent. Fatty acid composition wasdetermined by gas chromatography (GC) as fatty acid methyl esters(FAMEs). FAMEs were prepared according to AOCS protocol No. Ce2-66 (97). GC analysis was performed in accordance with ISO 5508,using an Agilent Technologies (model 6890N) GC with a flameionization detector and the recommended capillary column (60 m,0.25 mm id, 0.25 μm film thickness; Quadrex Corporation,Woodbridge, CT, U.S.A.).Data Analysis. Data were analyzed using JMP 10.0 software (SAS
Institute Inc., Cary, NC, U.S.A.). The effect of fruiting year on leaf andfruit N, P, and K was tested by Tukey’s honest significance test.Initially, the combined relationships of a single mineral level (fruit fleshor leaves), fruiting year, and the measured oil quality parameter were
determined using two-way ANOVA. The model includes datacomposed of all of the measured trees, and each point in the modelrepresents the average of six trees in 2007 and three trees in 2008 and2009 (sum of 240 measurements). Subsequently, all of the minerals,fruiting years, and interactions were examined in a multifactorialmodel. Only significant correlations between mineral level and qualityparameters were considered. Linear regression of combined data waspresented only when there was an insignificant effect of fruiting year;otherwise, regression was presented for each year separately.Interaction between the variables was not significant and thereforenot presented. Because of multiple factor comparisons andinteractions, the default p value for significance was set for 0.01.
■ RESULTSThe data incorporate the three years of study and the threeelements. Each symbol in Figures 1−5 represents an average of
six replicates in 2007 and three replicates in 2008 and 2009. Atthe lowest N and P levels, missing data is due to the fact thatsome of the nutrient-deficient trees did not produce enoughfruits to obtain oil. Regardless of the nutritional level, in all oils,the FFA, peroxide values and delta-K were well withinacceptable IOC thresholds of 0.8%, 20 meq O2/kg, and 0.01for extra VOO. No major effect on peroxide value or delta-Kwas found (see Supporting Information, Tables S4 and S5).
Mineral Accumulation in Fruits and Leaves. July isconsidered to be the accepted period for leaf analysis in
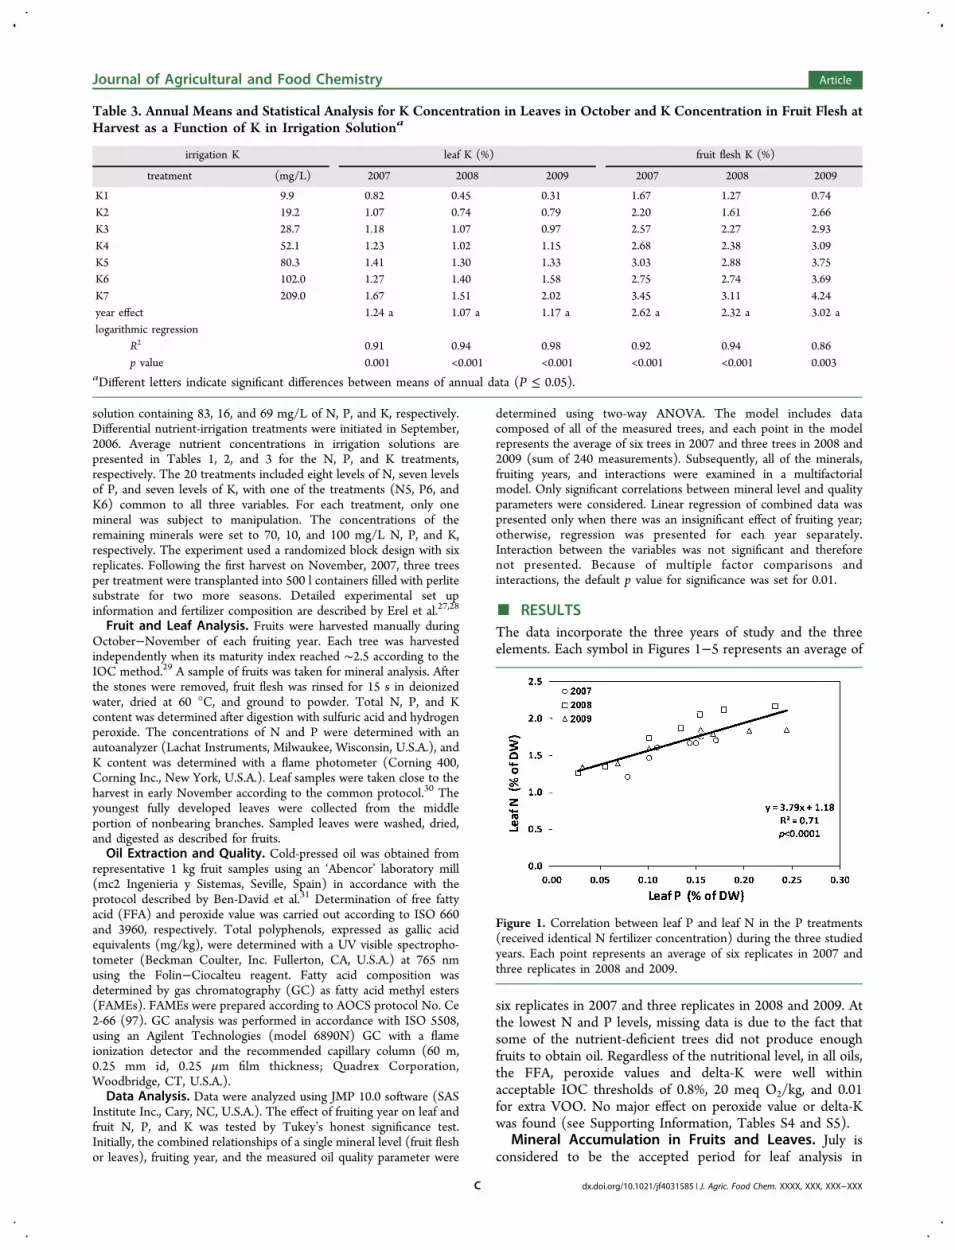
Table 3. Annual Means and Statistical Analysis for K Concentration in Leaves in October and K Concentration in Fruit Flesh atHarvest as a Function of K in Irrigation Solutiona
aDifferent letters indicate significant differences between means of annual data (P ≤ 0.05).
Figure 1. Correlation between leaf P and leaf N in the P treatments(received identical N fertilizer concentration) during the three studiedyears. Each point represents an average of six replicates in 2007 andthree replicates in 2008 and 2009.
Journal of Agricultural and Food Chemistry Article
dx.doi.org/10.1021/jf4031585 | J. Agric. Food Chem. XXXX, XXX, XXX−XXXC
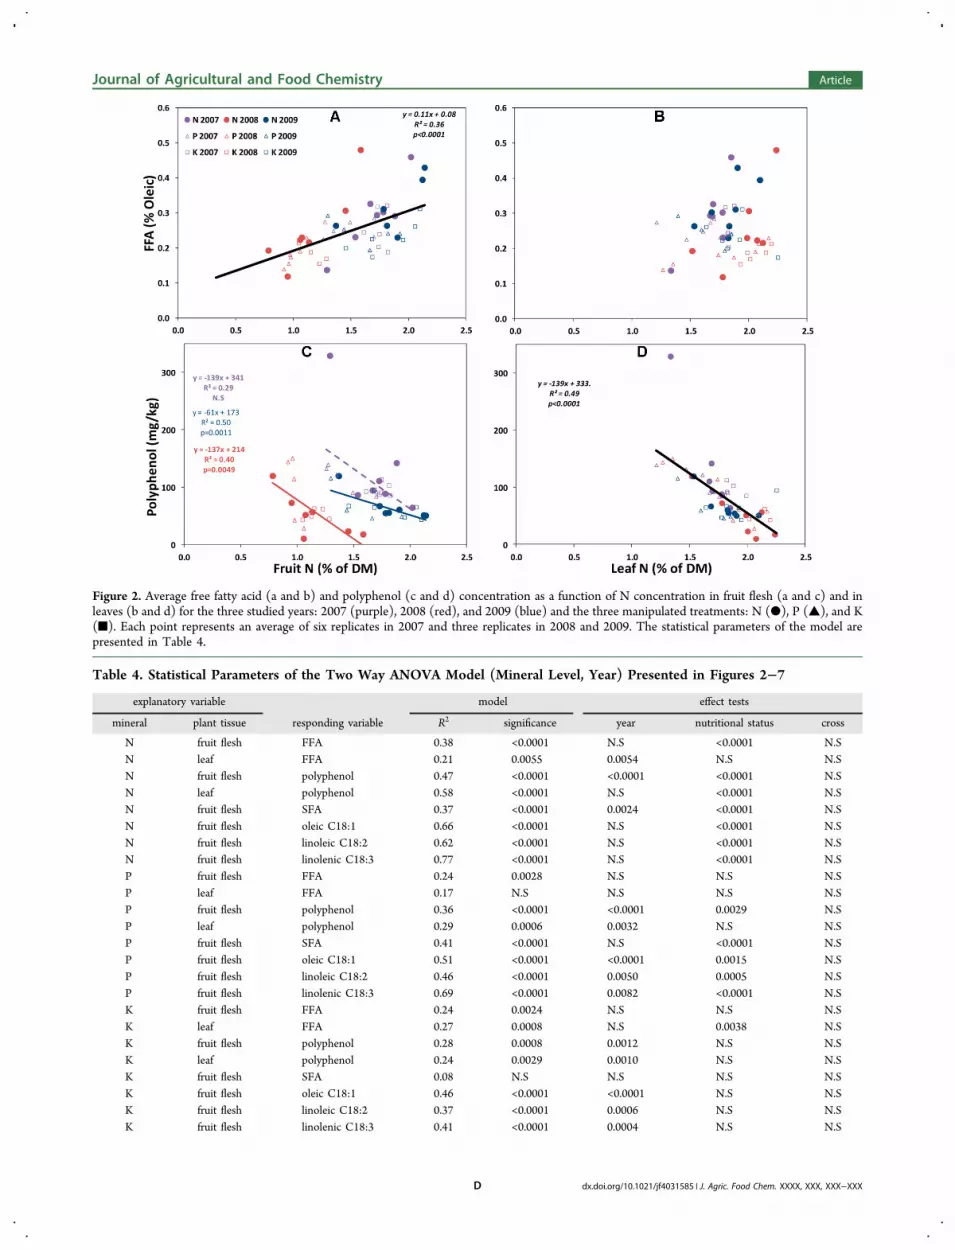
Figure 2. Average free fatty acid (a and b) and polyphenol (c and d) concentration as a function of N concentration in fruit flesh (a and c) and inleaves (b and d) for the three studied years: 2007 (purple), 2008 (red), and 2009 (blue) and the three manipulated treatments: N (●), P (▲), and K(■). Each point represents an average of six replicates in 2007 and three replicates in 2008 and 2009. The statistical parameters of the model arepresented in Table 4.
Table 4. Statistical Parameters of the Two Way ANOVA Model (Mineral Level, Year) Presented in Figures 2−7
explanatory variable model effect tests
mineral plant tissue responding variable R2 significance year nutritional status cross
Journal of Agricultural and Food Chemistry Article
dx.doi.org/10.1021/jf4031585 | J. Agric. Food Chem. XXXX, XXX, XXX−XXXD
olives.24 However, in order to enable comparison with fruitmineral concentration and oil properties, leaf sampling andanalysis were conducted in October each year and arepresented in Tables 1−3. Logarithmic regression best describedthe relationship between mineral concentrations in irrigationsolution to those in plant tissue for all 18 comparisons (Tables1−3). As a function of N concentration in irrigation solution,leaf N ranged from 0.64 to 2.24%. Nitrogen in fruit flesh wascomparable to leaf N with the exception of 2008 when Nconcentration in fruit was slightly lower than leaf N. Leaf Pranged between 0.03 and 0.24%, while P in fruit flesh wasinconsistent. Fruit P was higher in 2007 and 2009 and relativelylow in 2008. Leaf K ranged from 0.31 to 2.02%, while K in fruitflesh was consistently higher, approximately double that inleaves.Over the three years, no significant effect of fruiting year on
leaf mineral content was found. Conversely, fruit mineralconcentrations were lowest in 2008 for each of the threestudied minerals (Tables 1−3). The most pronounced fruitingyear effect was found for N with fruit levels in 2008 beingsignificantly lower than that in 2007 and 2009 (Table 1). FruitP was significantly lower in 2008 compared to that in 2009, andfruit K had an insignificant fruiting year effect.Although only one mineral was subject to change in each
treatment, a strong positive interaction between P and N wasrepeatedly measured. Nitrogen concentration in leaves and infruit flesh consistently increased with the concentration of P inirrigation solution. The increases in N accumulation with Papplication persisted in spite of the fixed N concentration inirrigation solution. As a result of this enhanced N uptake in
response to P, a linear correlation was found between leaf P andleaf N in the P treatments (Figure 1). The relationship betweenleaf P and leaf N was consistent over the three seasons. Thedata clearly indicate that P availability increased N accumu-lation throughout the range of P investigated. The significanteffect of fruiting year on fruit mineral concentrations (Tables1−2) raises the need to assess the fruiting year as anexplanatory factor. Two-way ANOVA model results arepresented in Figures 2−7, and the model’s statistical parametersare shown in Table 4.
Effect of N and Fruiting Year on FFA and PolyphenolContent. For all of the measured treatments and seasons, FFAwas relatively low, lower than the threshold of 0.8% for extraVOO. FFA increased continuously from ∼0.15 to ∼0.45% withincreased fruit N, while fruiting year had no significant effect(Figure 2a). Four measurements were exceptionally high,exceeding 0.4%. These values were measured for the highest Nlevels: N8 in 2007, N8 in 2008, N7, and N8 in 2009. In each ofthe fruiting years, the highest FFA was measured for the highestfruit N. Unlike fruit N, leaf N was not significantly correlated toFFA. In 2008, average FFA values were somewhat lowercompared to those in 2007 and 2009 (Figure 2b).Both fruit N and fruiting year were significantly associated
with polyphenol content in oil (Figure 2c). In each year,independently, polyphenol decreased with fruit N, but theeffect was inconsistent and significant only in two fruiting years.When examining polyphenol level against leaf N, a robustcontinuous correlation was found, and no fruiting year effectwas discernible (Figure 2d). For the three studied seasons,
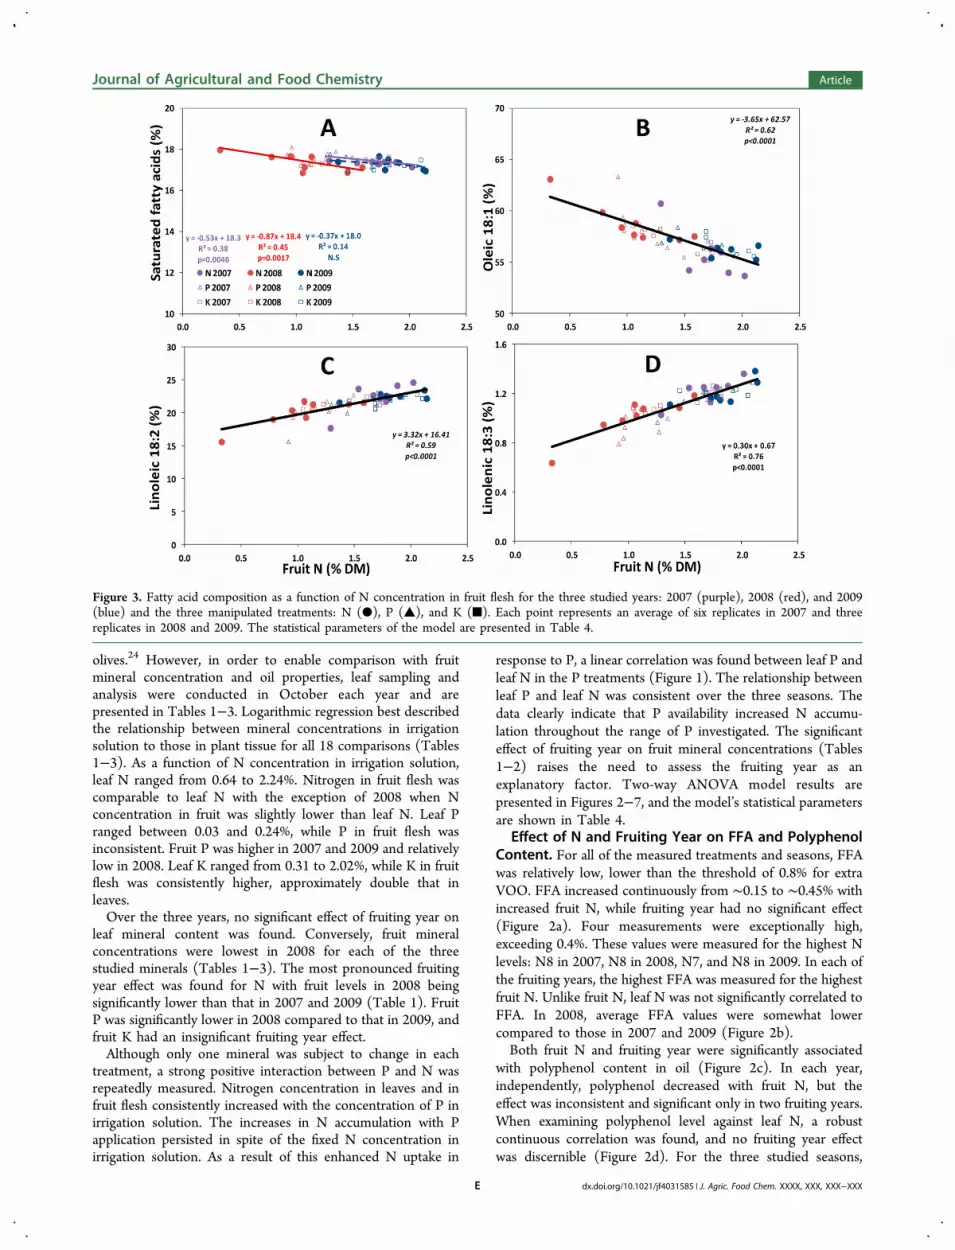
Figure 3. Fatty acid composition as a function of N concentration in fruit flesh for the three studied years: 2007 (purple), 2008 (red), and 2009(blue) and the three manipulated treatments: N (●), P (▲), and K (■). Each point represents an average of six replicates in 2007 and threereplicates in 2008 and 2009. The statistical parameters of the model are presented in Table 4.
Journal of Agricultural and Food Chemistry Article
dx.doi.org/10.1021/jf4031585 | J. Agric. Food Chem. XXXX, XXX, XXX−XXXE
lowest polyphenol concentration corresponded to the highestleaf N concentration.Effect of N and Fruiting Year on Oil Composition. The
following results refer to the major components of fatty acids:saturated (palmitic C16:0 + stearic C18:0), oleic (C18:1),linoleic (C18:2), and linolenic (C18:3). These four compo-nents account for 98−99% of the fatty acid profile. Full fattyacid profiles for the different treatments are presented in TablesS1−S3 in the Supporting Information.The percentage of saturated fatty acids was significantly and
negatively associated with fruit N in two out of the threeseasons and was significantly affected by fruiting year (Figure3A and Table 4). Although significant, the range of saturatedfatty acid percentage was quite narrow, from 18% for the lowestfruit N to 16.9% in the high fruit N range. Fruit N hadsubstantial negative effect on the main monounsaturated fattyacid, oleic acid. The percentage of oleic acid decreased by 10%,from more than 60% when fruit N < 1% to 53−56% when fruitN > 2%. Solid positive linear responses to increased fruit Nwere found regarding linoleic (C18:2, Figure 3C) and linolenic(C18:3, Figure 3D) fatty acids. The proportion of linoleic acidranged between 15.6 and 24.6%, and linolenic percentageincreased from 0.6 to 1.4% as fruit N increased.Effect of P and Fruiting Year on FFA, Polyphenol
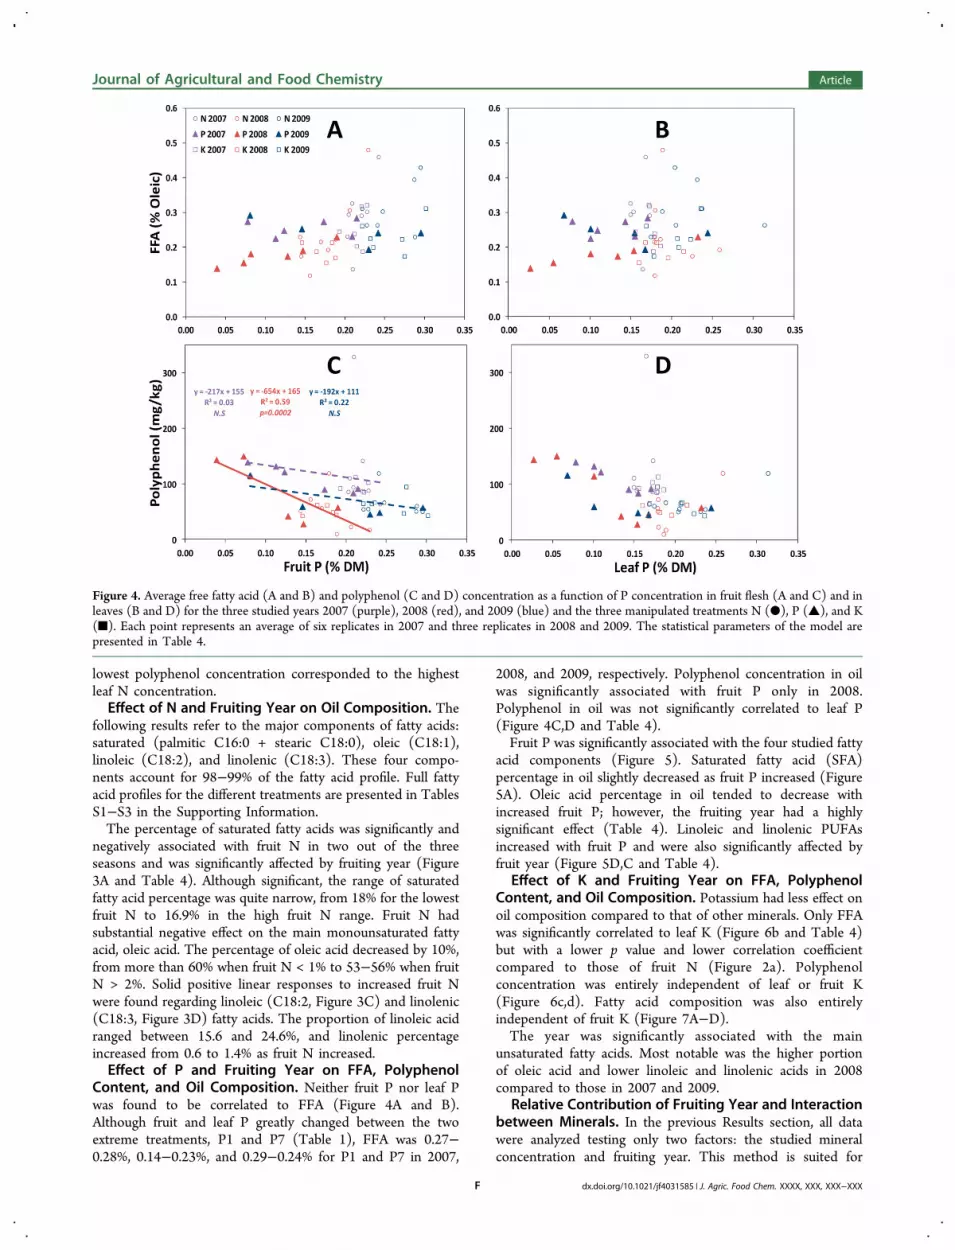
Content, and Oil Composition. Neither fruit P nor leaf Pwas found to be correlated to FFA (Figure 4A and B).Although fruit and leaf P greatly changed between the twoextreme treatments, P1 and P7 (Table 1), FFA was 0.27−0.28%, 0.14−0.23%, and 0.29−0.24% for P1 and P7 in 2007,
2008, and 2009, respectively. Polyphenol concentration in oilwas significantly associated with fruit P only in 2008.Polyphenol in oil was not significantly correlated to leaf P(Figure 4C,D and Table 4).Fruit P was significantly associated with the four studied fatty
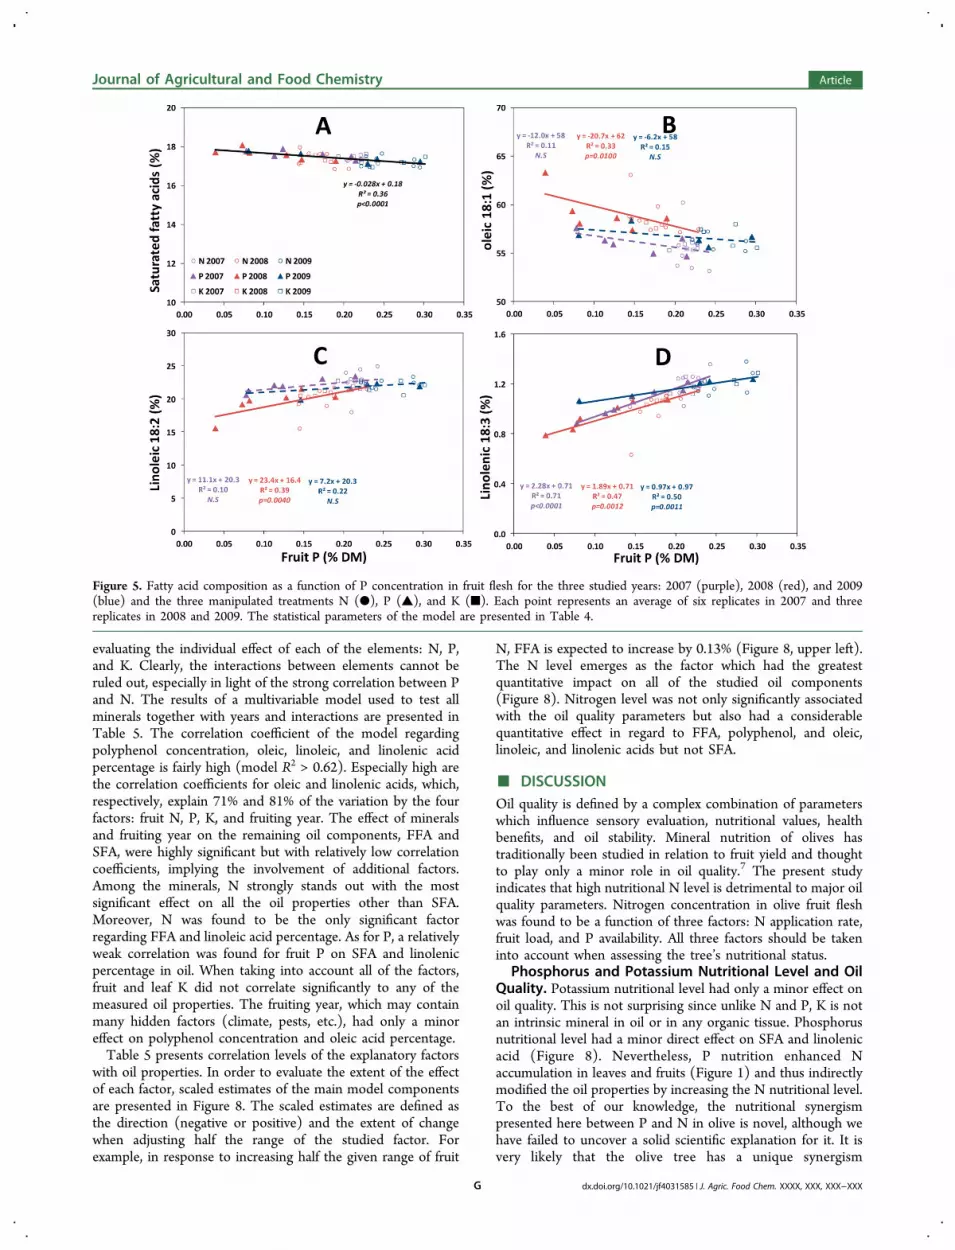
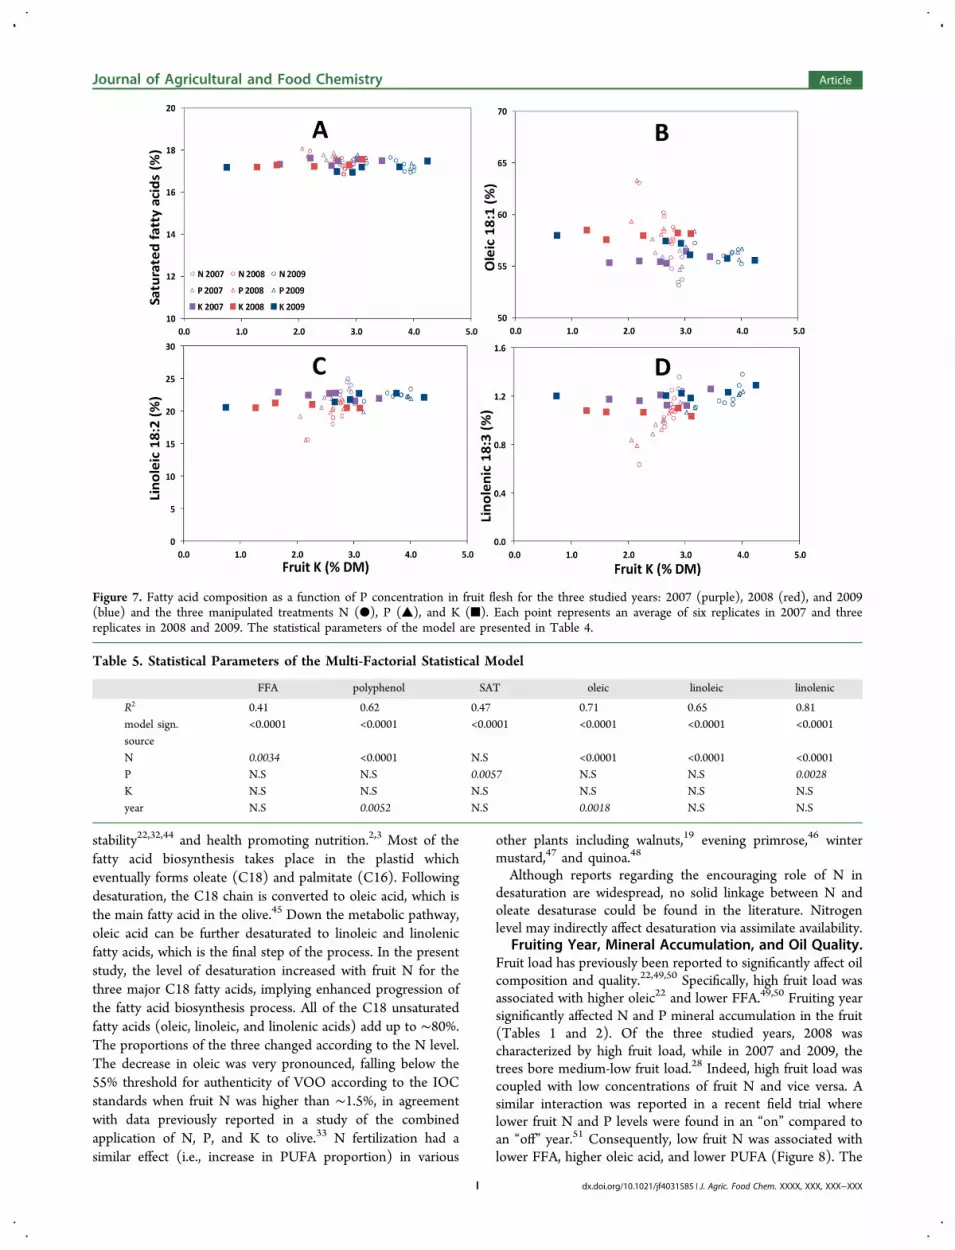
acid components (Figure 5). Saturated fatty acid (SFA)percentage in oil slightly decreased as fruit P increased (Figure5A). Oleic acid percentage in oil tended to decrease withincreased fruit P; however, the fruiting year had a highlysignificant effect (Table 4). Linoleic and linolenic PUFAsincreased with fruit P and were also significantly affected byfruit year (Figure 5D,C and Table 4).
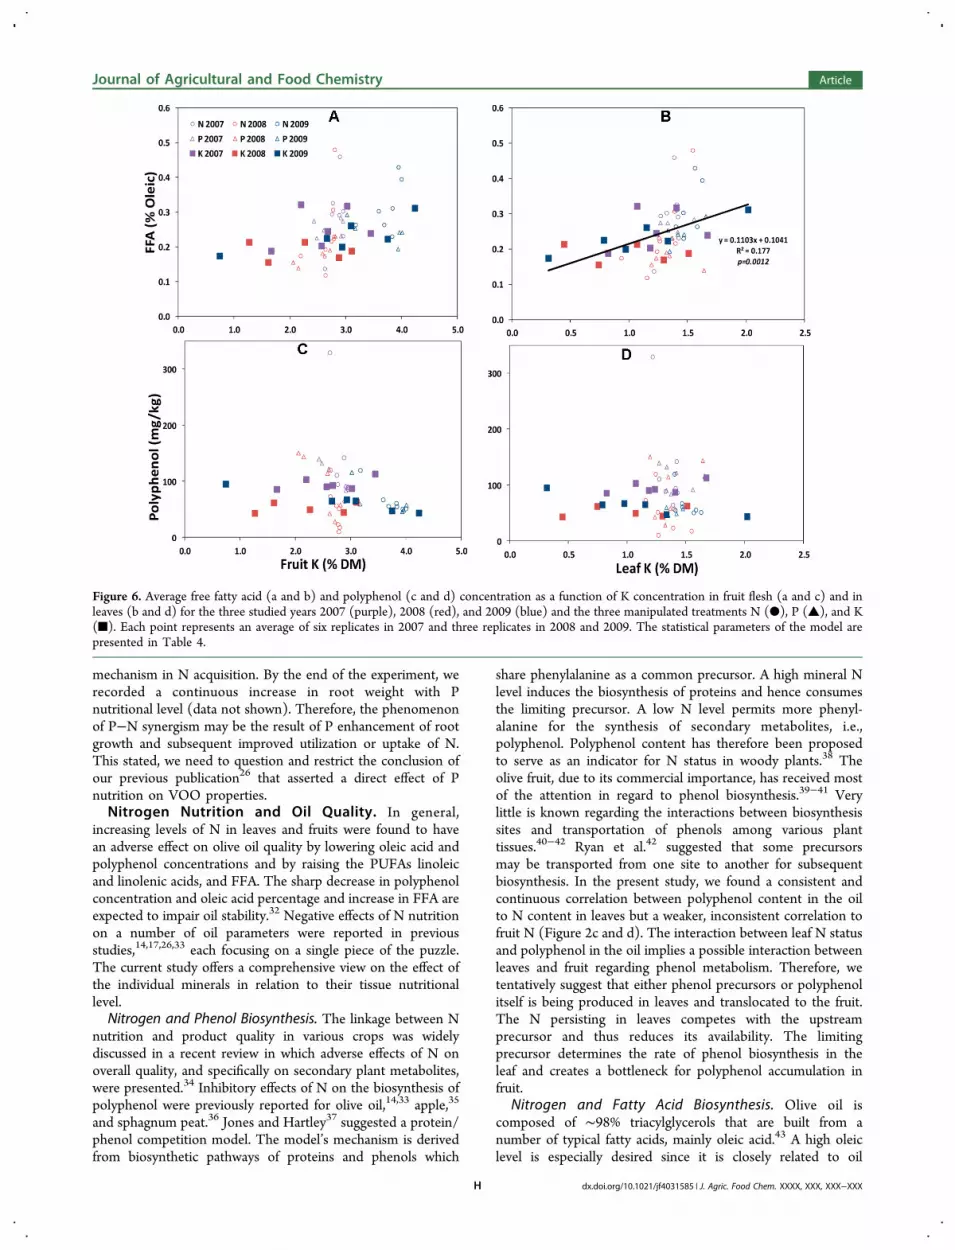
Effect of K and Fruiting Year on FFA, PolyphenolContent, and Oil Composition. Potassium had less effect onoil composition compared to that of other minerals. Only FFAwas significantly correlated to leaf K (Figure 6b and Table 4)but with a lower p value and lower correlation coefficientcompared to those of fruit N (Figure 2a). Polyphenolconcentration was entirely independent of leaf or fruit K(Figure 6c,d). Fatty acid composition was also entirelyindependent of fruit K (Figure 7A−D).The year was significantly associated with the main
unsaturated fatty acids. Most notable was the higher portionof oleic acid and lower linoleic and linolenic acids in 2008compared to those in 2007 and 2009.
Relative Contribution of Fruiting Year and Interactionbetween Minerals. In the previous Results section, all datawere analyzed testing only two factors: the studied mineralconcentration and fruiting year. This method is suited for
Figure 4. Average free fatty acid (A and B) and polyphenol (C and D) concentration as a function of P concentration in fruit flesh (A and C) and inleaves (B and D) for the three studied years 2007 (purple), 2008 (red), and 2009 (blue) and the three manipulated treatments N (●), P (▲), and K(■). Each point represents an average of six replicates in 2007 and three replicates in 2008 and 2009. The statistical parameters of the model arepresented in Table 4.
Journal of Agricultural and Food Chemistry Article
dx.doi.org/10.1021/jf4031585 | J. Agric. Food Chem. XXXX, XXX, XXX−XXXF
evaluating the individual effect of each of the elements: N, P,and K. Clearly, the interactions between elements cannot beruled out, especially in light of the strong correlation between Pand N. The results of a multivariable model used to test allminerals together with years and interactions are presented inTable 5. The correlation coefficient of the model regardingpolyphenol concentration, oleic, linoleic, and linolenic acidpercentage is fairly high (model R2 > 0.62). Especially high arethe correlation coefficients for oleic and linolenic acids, which,respectively, explain 71% and 81% of the variation by the fourfactors: fruit N, P, K, and fruiting year. The effect of mineralsand fruiting year on the remaining oil components, FFA andSFA, were highly significant but with relatively low correlationcoefficients, implying the involvement of additional factors.Among the minerals, N strongly stands out with the mostsignificant effect on all the oil properties other than SFA.Moreover, N was found to be the only significant factorregarding FFA and linoleic acid percentage. As for P, a relativelyweak correlation was found for fruit P on SFA and linolenicpercentage in oil. When taking into account all of the factors,fruit and leaf K did not correlate significantly to any of themeasured oil properties. The fruiting year, which may containmany hidden factors (climate, pests, etc.), had only a minoreffect on polyphenol concentration and oleic acid percentage.Table 5 presents correlation levels of the explanatory factors
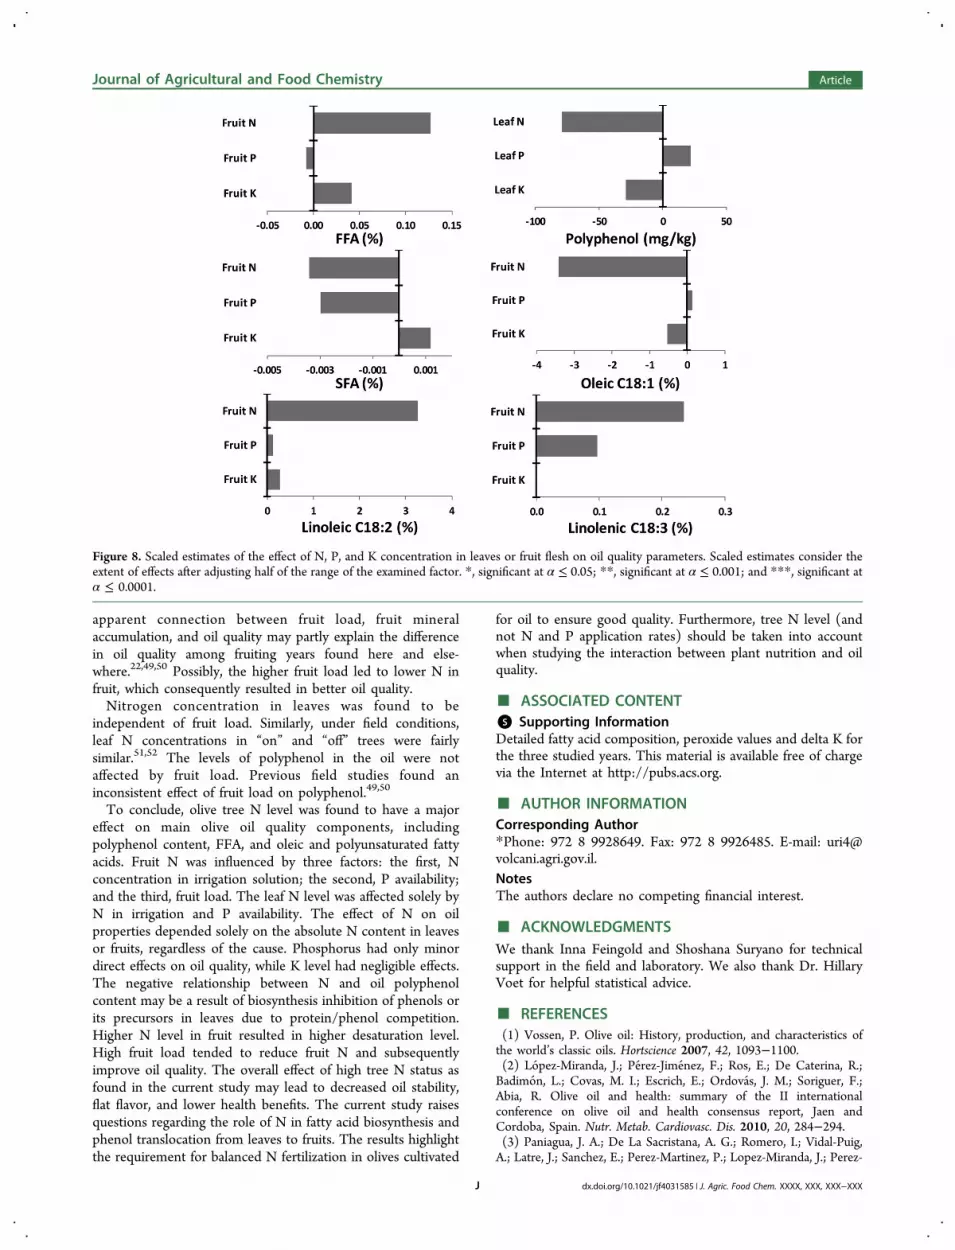
with oil properties. In order to evaluate the extent of the effectof each factor, scaled estimates of the main model componentsare presented in Figure 8. The scaled estimates are defined asthe direction (negative or positive) and the extent of changewhen adjusting half the range of the studied factor. Forexample, in response to increasing half the given range of fruit
N, FFA is expected to increase by 0.13% (Figure 8, upper left).The N level emerges as the factor which had the greatestquantitative impact on all of the studied oil components(Figure 8). Nitrogen level was not only significantly associatedwith the oil quality parameters but also had a considerablequantitative effect in regard to FFA, polyphenol, and oleic,linoleic, and linolenic acids but not SFA.
■ DISCUSSIONOil quality is defined by a complex combination of parameterswhich influence sensory evaluation, nutritional values, healthbenefits, and oil stability. Mineral nutrition of olives hastraditionally been studied in relation to fruit yield and thoughtto play only a minor role in oil quality.7 The present studyindicates that high nutritional N level is detrimental to major oilquality parameters. Nitrogen concentration in olive fruit fleshwas found to be a function of three factors: N application rate,fruit load, and P availability. All three factors should be takeninto account when assessing the tree’s nutritional status.
Phosphorus and Potassium Nutritional Level and OilQuality. Potassium nutritional level had only a minor effect onoil quality. This is not surprising since unlike N and P, K is notan intrinsic mineral in oil or in any organic tissue. Phosphorusnutritional level had a minor direct effect on SFA and linolenicacid (Figure 8). Nevertheless, P nutrition enhanced Naccumulation in leaves and fruits (Figure 1) and thus indirectlymodified the oil properties by increasing the N nutritional level.To the best of our knowledge, the nutritional synergismpresented here between P and N in olive is novel, although wehave failed to uncover a solid scientific explanation for it. It isvery likely that the olive tree has a unique synergism
Figure 5. Fatty acid composition as a function of P concentration in fruit flesh for the three studied years: 2007 (purple), 2008 (red), and 2009(blue) and the three manipulated treatments N (●), P (▲), and K (■). Each point represents an average of six replicates in 2007 and threereplicates in 2008 and 2009. The statistical parameters of the model are presented in Table 4.
Journal of Agricultural and Food Chemistry Article
dx.doi.org/10.1021/jf4031585 | J. Agric. Food Chem. XXXX, XXX, XXX−XXXG
mechanism in N acquisition. By the end of the experiment, werecorded a continuous increase in root weight with Pnutritional level (data not shown). Therefore, the phenomenonof P−N synergism may be the result of P enhancement of rootgrowth and subsequent improved utilization or uptake of N.This stated, we need to question and restrict the conclusion ofour previous publication26 that asserted a direct effect of Pnutrition on VOO properties.Nitrogen Nutrition and Oil Quality. In general,
increasing levels of N in leaves and fruits were found to havean adverse effect on olive oil quality by lowering oleic acid andpolyphenol concentrations and by raising the PUFAs linoleicand linolenic acids, and FFA. The sharp decrease in polyphenolconcentration and oleic acid percentage and increase in FFA areexpected to impair oil stability.32 Negative effects of N nutritionon a number of oil parameters were reported in previousstudies,14,17,26,33 each focusing on a single piece of the puzzle.The current study offers a comprehensive view on the effect ofthe individual minerals in relation to their tissue nutritionallevel.Nitrogen and Phenol Biosynthesis. The linkage between N
nutrition and product quality in various crops was widelydiscussed in a recent review in which adverse effects of N onoverall quality, and specifically on secondary plant metabolites,were presented.34 Inhibitory effects of N on the biosynthesis ofpolyphenol were previously reported for olive oil,14,33 apple,35
and sphagnum peat.36 Jones and Hartley37 suggested a protein/phenol competition model. The model’s mechanism is derivedfrom biosynthetic pathways of proteins and phenols which
share phenylalanine as a common precursor. A high mineral Nlevel induces the biosynthesis of proteins and hence consumesthe limiting precursor. A low N level permits more phenyl-alanine for the synthesis of secondary metabolites, i.e.,polyphenol. Polyphenol content has therefore been proposedto serve as an indicator for N status in woody plants.38 Theolive fruit, due to its commercial importance, has received mostof the attention in regard to phenol biosynthesis.39−41 Verylittle is known regarding the interactions between biosynthesissites and transportation of phenols among various planttissues.40−42 Ryan et al.42 suggested that some precursorsmay be transported from one site to another for subsequentbiosynthesis. In the present study, we found a consistent andcontinuous correlation between polyphenol content in the oilto N content in leaves but a weaker, inconsistent correlation tofruit N (Figure 2c and d). The interaction between leaf N statusand polyphenol in the oil implies a possible interaction betweenleaves and fruit regarding phenol metabolism. Therefore, wetentatively suggest that either phenol precursors or polyphenolitself is being produced in leaves and translocated to the fruit.The N persisting in leaves competes with the upstreamprecursor and thus reduces its availability. The limitingprecursor determines the rate of phenol biosynthesis in theleaf and creates a bottleneck for polyphenol accumulation infruit.
Nitrogen and Fatty Acid Biosynthesis. Olive oil iscomposed of ∼98% triacylglycerols that are built from anumber of typical fatty acids, mainly oleic acid.43 A high oleiclevel is especially desired since it is closely related to oil
Figure 6. Average free fatty acid (a and b) and polyphenol (c and d) concentration as a function of K concentration in fruit flesh (a and c) and inleaves (b and d) for the three studied years 2007 (purple), 2008 (red), and 2009 (blue) and the three manipulated treatments N (●), P (▲), and K(■). Each point represents an average of six replicates in 2007 and three replicates in 2008 and 2009. The statistical parameters of the model arepresented in Table 4.
Journal of Agricultural and Food Chemistry Article
dx.doi.org/10.1021/jf4031585 | J. Agric. Food Chem. XXXX, XXX, XXX−XXXH
stability22,32,44 and health promoting nutrition.2,3 Most of thefatty acid biosynthesis takes place in the plastid whicheventually forms oleate (C18) and palmitate (C16). Followingdesaturation, the C18 chain is converted to oleic acid, which isthe main fatty acid in the olive.45 Down the metabolic pathway,oleic acid can be further desaturated to linoleic and linolenicfatty acids, which is the final step of the process. In the presentstudy, the level of desaturation increased with fruit N for thethree major C18 fatty acids, implying enhanced progression ofthe fatty acid biosynthesis process. All of the C18 unsaturatedfatty acids (oleic, linoleic, and linolenic acids) add up to ∼80%.The proportions of the three changed according to the N level.The decrease in oleic was very pronounced, falling below the55% threshold for authenticity of VOO according to the IOCstandards when fruit N was higher than ∼1.5%, in agreementwith data previously reported in a study of the combinedapplication of N, P, and K to olive.33 N fertilization had asimilar effect (i.e., increase in PUFA proportion) in various
other plants including walnuts,19 evening primrose,46 wintermustard,47 and quinoa.48
Although reports regarding the encouraging role of N indesaturation are widespread, no solid linkage between N andoleate desaturase could be found in the literature. Nitrogenlevel may indirectly affect desaturation via assimilate availability.
Fruiting Year, Mineral Accumulation, and Oil Quality.Fruit load has previously been reported to significantly affect oilcomposition and quality.22,49,50 Specifically, high fruit load wasassociated with higher oleic22 and lower FFA.49,50 Fruiting yearsignificantly affected N and P mineral accumulation in the fruit(Tables 1 and 2). Of the three studied years, 2008 wascharacterized by high fruit load, while in 2007 and 2009, thetrees bore medium-low fruit load.28 Indeed, high fruit load wascoupled with low concentrations of fruit N and vice versa. Asimilar interaction was reported in a recent field trial wherelower fruit N and P levels were found in an “on” compared toan “off” year.51 Consequently, low fruit N was associated withlower FFA, higher oleic acid, and lower PUFA (Figure 8). The
Figure 7. Fatty acid composition as a function of P concentration in fruit flesh for the three studied years: 2007 (purple), 2008 (red), and 2009(blue) and the three manipulated treatments N (●), P (▲), and K (■). Each point represents an average of six replicates in 2007 and threereplicates in 2008 and 2009. The statistical parameters of the model are presented in Table 4.
Table 5. Statistical Parameters of the Multi-Factorial Statistical Model
Journal of Agricultural and Food Chemistry Article
dx.doi.org/10.1021/jf4031585 | J. Agric. Food Chem. XXXX, XXX, XXX−XXXI
apparent connection between fruit load, fruit mineralaccumulation, and oil quality may partly explain the differencein oil quality among fruiting years found here and else-where.22,49,50 Possibly, the higher fruit load led to lower N infruit, which consequently resulted in better oil quality.Nitrogen concentration in leaves was found to be
independent of fruit load. Similarly, under field conditions,leaf N concentrations in “on” and “off” trees were fairlysimilar.51,52 The levels of polyphenol in the oil were notaffected by fruit load. Previous field studies found aninconsistent effect of fruit load on polyphenol.49,50
To conclude, olive tree N level was found to have a majoreffect on main olive oil quality components, includingpolyphenol content, FFA, and oleic and polyunsaturated fattyacids. Fruit N was influenced by three factors: the first, Nconcentration in irrigation solution; the second, P availability;and the third, fruit load. The leaf N level was affected solely byN in irrigation and P availability. The effect of N on oilproperties depended solely on the absolute N content in leavesor fruits, regardless of the cause. Phosphorus had only minordirect effects on oil quality, while K level had negligible effects.The negative relationship between N and oil polyphenolcontent may be a result of biosynthesis inhibition of phenols orits precursors in leaves due to protein/phenol competition.Higher N level in fruit resulted in higher desaturation level.High fruit load tended to reduce fruit N and subsequentlyimprove oil quality. The overall effect of high tree N status asfound in the current study may lead to decreased oil stability,flat flavor, and lower health benefits. The current study raisesquestions regarding the role of N in fatty acid biosynthesis andphenol translocation from leaves to fruits. The results highlightthe requirement for balanced N fertilization in olives cultivated
for oil to ensure good quality. Furthermore, tree N level (andnot N and P application rates) should be taken into accountwhen studying the interaction between plant nutrition and oilquality.
■ ASSOCIATED CONTENT*S Supporting InformationDetailed fatty acid composition, peroxide values and delta K forthe three studied years. This material is available free of chargevia the Internet at http://pubs.acs.org.
■ ACKNOWLEDGMENTSWe thank Inna Feingold and Shoshana Suryano for technicalsupport in the field and laboratory. We also thank Dr. HillaryVoet for helpful statistical advice.
■ REFERENCES(1) Vossen, P. Olive oil: History, production, and characteristics ofthe world’s classic oils. Hortscience 2007, 42, 1093−1100.(2) Lopez-Miranda, J.; Perez-Jimenez, F.; Ros, E.; De Caterina, R.;Badimon, L.; Covas, M. I.; Escrich, E.; Ordovas, J. M.; Soriguer, F.;Abia, R. Olive oil and health: summary of the II internationalconference on olive oil and health consensus report, Jaen andCordoba, Spain. Nutr. Metab. Cardiovasc. Dis. 2010, 20, 284−294.(3) Paniagua, J. A.; De La Sacristana, A. G.; Romero, I.; Vidal-Puig,A.; Latre, J.; Sanchez, E.; Perez-Martinez, P.; Lopez-Miranda, J.; Perez-
Figure 8. Scaled estimates of the effect of N, P, and K concentration in leaves or fruit flesh on oil quality parameters. Scaled estimates consider theextent of effects after adjusting half of the range of the examined factor. *, significant at α ≤ 0.05; **, significant at α ≤ 0.001; and ***, significant atα ≤ 0.0001.
Journal of Agricultural and Food Chemistry Article
dx.doi.org/10.1021/jf4031585 | J. Agric. Food Chem. XXXX, XXX, XXX−XXXJ
Jimenez, F. Monounsaturated fat−rich diet prevents central body fatdistribution and decreases postprandial adiponectin expressioninduced by a carbohydrate-rich diet in insulin-resistant subjects.Diabetes Care 2007, 30, 1717−1723.(4) Servili, M.; Selvaggini, R.; Esposto, S.; Taticchi, A.; Montedoro,G.; Morozzi, G. Health and sensory properties of virgin olive oilhydrophilic phenols: agronomic and technological aspects ofproduction that affect their occurrence in the oil. J. Chromatogr., A2004, 1054, 113−127.(5) Covas, M. I.; Ruiz-Gutierrez, V.; Torre, R.; Kafatos, A.; Lamuela-Raventos, R. M.; Osada, J.; Owen, R. W.; Visioli, F. Minor componentsof olive oil: evidence to date of health benefits in humans. Nutr. rev.2006, 64, S20−S30.(6) Aparicio, R.; Luna, G. Characterisation of monovarietal virginolive oils. Eur. J. Lipid Sci. Technol. 2002, 104, 614−627.(7) Uceda, M.; M, H.; Aguilera, M. P. Olive Oil Quality. In OliveGrowing, 5th ed.; Barranco, D., Fernandez-Escobar, R., Rallo, L., Eds.;RIRDC: Pendle Hill, Australia, 2010; pp 619−646.(8) Fiorino, P.; Alessandri, S.; Cert, A.; Dikmen, I.; Rahmani, M.Tecnicas agronomicas y caracteristicas del aceite de oliva. In LaEnciclopedia del Olivo; COI Plaza & Janes: Barcelona, Spain, 1996; pp195−222.(9) Therios, I. N. Olives; CABI: Wallingford, U.K., 2009; Vol. 18,Crop Production Science in Horticulture.(10) Inglese, P.; Gullo, G.; Pace, L. Fruit growth and olive oil qualityin relation to foliar nutrition and time of application. Acta Hortic. 2002,586, 507−509.(11) Ferreira, J.; Uceda, M.; Frias, L.; Garcia, A.; Fernandez, A.Influencia de Los Fertilizantes en el Rendimiento en Aciete del Fruto y en laComposicion de Acidos Grasos del Aceite Optenido; ColloquieInternationale Oleicole: Bergamon, France, 1978.(12) Alcubilla, M.; Gracia, M.; Romero, M.; Espada, J.; Betran, J. E.M. Fertilizacion nitrogenada en el olivo cv. Empeltre II. Composicionpolifenolica de hojas y frutos y calidad del aceite. Comunicaciones al IXSimposio Iberico sobre nutricion mineral de las plantas; InstitucionFernando el Catolico: Zaragoza, Spain, 2002; pp 243−246.(13) Wiesman, Z.; Ronen, A.; Ankarion, Y.; Novikov, V.; Maranz, S.;Chpagain, B.; Abramovich, Z. Effect of olive-nutri-vant on yield andquality of olives and oil. Acta Hortic. 2002, 594, 557−562.(14) Fernandez-Escobar, R.; Beltran, G.; Sanchez-Zamora, M. A.;Garcia-Novelo, J.; Aguilera, M. P.; Uceda, M. Olive oil qualitydecreases with nitrogen over-fertilization. Hortscience 2006, 41, 215−219.(15) Morales-Sillero, A.; Jimenez, R.; Fernandez, J. E.; Troncoso, A.;Beltran, G. Influence of fertigation in ‘Manzanilla de Sevilla’ olive oilquality. Hortscience 2007, 42, 1157−1162.(16) Dag, A.; Ben-David, E.; Kerem, Z.; Ben-Gal, A.; Erel, R.;Basheer, L.; Yermiyahu, U. Olive oil composition as a function ofnitrogen, phosphorus and potassium plant nutrition. J. Sci. Food Agric.2009, 89, 1871−1878.(17) Tekaya, M.; Mechri, B.; Bchir, A.; Attia, F.; Cheheb, H.; Daassa,M.; Hammami, M. Effect of nutrient-based fertilisers of olive trees onolive oil quality. J. Sci. Food Agric. 2013, 93, 2045−2052.(18) Fernandez-Escobar, R.; Marin, L.; Sanchez-Zamora, M.; García-Novelo, J.; Molina-Soria, C.; Parra, M. Long-term effects of Nfertilization on cropping and growth of olive trees and on Naccumulation in soil profile. Eur. J. Agron. 2009, 31, 223−232.(19) Verardo, V.; Riciputi, Y.; Sorrenti, G.; Ornaghi, P.; Marangoni,B.; Caboni, M. F. Effect of nitrogen fertilisation rates on the content offatty acids, sterols, tocopherols and phenolic compounds, and on theoxidative stability of walnuts. LWT-Food Sci. Technol. 2013, 50, 732−738.(20) Bar-Yosef, B. Advances in fertigation. Adv. Agron. 1999, 65, 1−77.(21) Hartmann, H. T. Some responses of the olive to nitrogenfertilizers. Proc. Am. Soc. Hortic. Sci. 1958, 72, 257−266.(22) Beltran, G.; del Rio, C.; Sanchez, S.; Martínez, L. Influence ofharvest date and crop yield on the fatty acid composition of virginolive oils from cv. Picual. J. Agric. Food Chem. 2004, 52, 3434−3440.
(23) Marschner, H. Mineral Nutrition of Higher Plants. 2nd ed.;Academic Press: London, 1995.(24) Fernandez-Escobar, R. Fertilization. In Olive Growing, 5th ed.;Barranco, D., Fernandez-Escobar, R., Rallo, L., Eds.; RIRDC: PendleHill, Australia, 2010; pp 267−297.(25) Fernandez-Escobar, R.; Parra, M. A.; Navarro, C.; Arquero, O.Foliar diagnosis as a guide to olive fertilization. Span. J. Agric. Res.2009, 7, 212−223.(26) Dag, A.; Ben-David, E.; Kerem, Z.; Ben-Gal, A.; Erel, R.;Basheer, L.; Yermiyahu, U. Olive oil composition as a function ofnitrogen, phosphorus and potassium plant nutrition. J. Sci. Food Agric.2009, 89, 1871−1878.(27) Erel, R.; Dag, A.; Ben-Gal, A.; Schwartz, A.; Yermiyahu, U.Flowering and fruit set of olive trees in response to nitrogen,phosphorus, and potassium. J. Am. Soc. Hortic. Sci. 2008, 133, 639−647.(28) Erel, R.; Yermiyahu, U.; Van Opstal, J.; Ben-Gal, A.; Schwartz,A.; Dag, A. The importance of olive (Olea europaea L.) tree nutritionalstatus on its productivity. Sci. Hortic. 2013, 159, 8−18.(29) IOOC Document 6; International Olive Oil Council: Madrid,Spain, 1984.(30) Beutel, J.; Uriu, K.; Lilleland, O. Leaf Analysis for CaliforniaDeciduous Fruits. In Soil and Plant Tissue Testing in California,Reisenauer, H. M., Ed.; University of California: Berkeley, CA, 1983;Bul. 1879; pp 15−17.(31) Ben-David, E.; Kerem, Z.; Zipori, I.; Weissbein, S.; Basheer, L.;Bustan, A.; Dag, A. Optimization of the Abencor system to extractolive oil from irrigated orchards. Eur. J. Lipid Sci. Technol. 2010, 112,1158−1165.(32) Aparicio, R.; Roda, L.; Albi, M. A.; Gutierrez, F. Effect of variouscompounds on virgin olive oil stability measured by Rancimat. J. Agric.Food Chem. 1999, 47, 4150−4155.(33) Morales-Sillero, A.; Jimenez, R.; Troncoso, A.; Fernandez, J. E.;Beltran, G. Influence of Fertigation in ‘Manzanilla de Sevilla’ Olive OilQuality. HortScience 2007, 42, 1157−1162.(34) Stefanelli, D.; Goodwin, I.; Jones, R. Minimal nitrogen andwater use in horticulture: Effects on quality and content of selectednutrients. Food Res. Int. 2010, 43, 1833−1843.(35) Leser, C.; Treutter, D. Effects of nitrogen supply on growth,contents of phenolic compounds and pathogen (scab) resistance ofapple trees. Physiol. Plant. 2005, 123, 49−56.(36) Bragazza, L.; Freeman, C. High nitrogen availability reducespolyphenol content in Sphagnum peat. Sci. Total Environ. 2007, 377,439−443.(37) Jones, C. G.; Hartley, S. E. A protein competition model ofphenolic allocation. Oikos 1999, 27−44.(38) Meyer, S.; Cerovic, Z.; Goulas, Y.; Montpied, P.; Demontes-Mainard, S.; Bidel, L.; Moya, I.; Dreyer, E. Relationships betweenoptically assessed polyphenols and chlorophyll contents, and leaf massper area ratio in woody plants: a signature of the carbon−nitrogenbalance within leaves? Plant Cell Environ. 2006, 29, 1338−1348.(39) Ryan, D.; Antolovich, M.; Herlt, T.; Prenzler, P. D.; Lavee, S.;Robards, K. Identification of phenolic compounds in tissues of thenovel olive cultivar Hardy’s Mammoth. J. Agric. Food Chem. 2002, 50,6716−6724.(40) Ryan, D.; Prenzler, P. D.; Lavee, S.; Antolovich, M.; Robards, K.Quantitative changes in phenolic content during physiologicaldevelopment of the olive (Olea europaea) cultivar Hardy’s Mammoth.J. Agric. Food Chem. 2003, 51, 2532−2538.(41) Gutierrez-Rosales, F.; Romero, M. P.; Casanovas, M.; Motilva,M. J.; Mínguez-Mosquera, M. I. Metabolites involved in oleuropeinaccumulation and degradation in fruits of Olea europaea L.: Hojiblancaand Arbequina varieties. J. Agric. Food Chem. 2010, 58, 12924−12933.(42) Ryan, D.; Antolovich, M.; Prenzler, P.; Robards, K.; Lavee, S.Biotransformations of phenolic compounds in Olea europaea L. Sci.Hortic. 2002, 92, 147−176.(43) Conde, C.; Delrot, S.; Geros, H. Physiological, biochemical andmolecular changes occurring during olive development and ripening. J.Plant Physiol. 2008, 165, 1545−1562.
Journal of Agricultural and Food Chemistry Article
dx.doi.org/10.1021/jf4031585 | J. Agric. Food Chem. XXXX, XXX, XXX−XXXK
(44) Gutierrez, F.; Jimenez, B.; Ruiz, A.; Albi, M. Effect of oliveripeness on the oxidative stability of virgin olive oil extracted from thevarieties Picual and Hojiblanca and on the different componentsinvolved. J. Agric. Food Chem. 1999, 47, 121−127.(45) Harwood, J. L. Recent advances in the biosynthesis of plant fattyacids. Biochim. Biophys. Acta 1996, 1301, 7−56.(46) Ghasemnezhad, A.; Honermeier, B. Yield, oil constituents, andprotein content of evening primrose (Oenothera biennis L.) seedsdepending on harvest time, harvest method and nitrogen application.Ind. Crop. Prod. 2008, 28, 17−23.(47) Zheljazkov, V. D.; Vick, B.; Ebelhar, M. W.; Buehring, N.;Astatkie, T. Nitrogen applications modify seed and oil yields and fattyacid composition of winter mustard. Ind. Crop. Prod. 2012, 36, 28−32.(48) Thanapornpoonpong, S. Effect of Nitrogen Fertilizer onNitrogen Assimilation and Seed Quality of Amaranth (Amaranthusspp.) and Quinoa (Chenopodium quinoa Willd). Ph.D. Thesis, Georg-August-University of Gottingen, Gottingen Germany, 2004.(49) Ben-Gal, A.; Dag, A.; Basheer, L.; Yermiyahu, U.; Zipori, I.;Kerem, Z. The influence of bearing cycles on olive oil quality responseto irrigation. J. Agric. Food Chem. 2011, 59, 11667−11675.(50) Dag, A.; Kerem, Z.; Yogev, N.; Zipori, I.; Lavee, S.; Ben-David,E. Influence of time of harvest and maturity index on olive oil yield andquality. Sci. Hortic. 2011, 127, 358−366.(51) Bustan, A.; Avni, A.; Yermiyahu, U.; Ben-Gal, A.; Riov, J.; Erel,R.; Zipori, I.; Dag, A. Interactions between fruit load andmacroelement concentrations in fertigated olive (Olea europaea L.)trees under arid saline conditions. Sci. Hortic. 2013, 152, 44−55.(52) Gucci, R.; Caruso, G.; Sebastiani, L. Seasonal changes in leafnitrogen of olive trees grown under different irrigation regimes andcrop level. J. Plant Nutr. 2010, 33, 1849−1859.
Journal of Agricultural and Food Chemistry Article
dx.doi.org/10.1021/jf4031585 | J. Agric. Food Chem. XXXX, XXX, XXX−XXXL