Page 1
Seediscussions,stats,andauthorprofilesforthispublicationat:https://www.researchgate.net/publication/7827473
Oliveoilmilleffluentsasafeedstockforproductionofbiodegradablepolymers.WaterRes39:2076-2084
ARTICLEinWATERRESEARCH·JUNE2005
ImpactFactor:5.53·DOI:10.1016/j.watres.2005.03.011·Source:PubMed
CITATIONS
118
READS
75
6AUTHORS,INCLUDING:
DavideDionisi
UniversityofAberdeen
34PUBLICATIONS999CITATIONS
SEEPROFILE
MarcoPetrangeliPapini
SapienzaUniversityofRome
60PUBLICATIONS1,131CITATIONS
SEEPROFILE
FulvioCarrasco
EscuelaSuperiorPolitécnicadelLitora…
123PUBLICATIONS1,952CITATIONS
SEEPROFILE
Allin-textreferencesunderlinedinbluearelinkedtopublicationsonResearchGate,
lettingyouaccessandreadthemimmediately.
Availablefrom:MarcoPetrangeliPapini
Retrievedon:04February2016
Page 2
ARTICLE IN PRESS
0043-1354/$ - se
doi:10.1016/j.w
�CorrespondE-mail addr
Water Research 39 (2005) 2076–2084
www.elsevier.com/locate/watres
Olive oil mill effluents as a feedstock for production ofbiodegradable polymers
D. Dionisia,�, G. Caruccia, M. Petrangeli Papinia, C. Riccardib, M. Majonea,F. Carrascoc
aDepartment of Chemistry, University of Rome ‘‘La Sapienza’’, Piazzale Aldo Moro, 5, Rome 00185, ItalybNational Institute for Safety and Health (ISPESL), Via Urbana, 167, Rome 00184, Italy
cDepartment of Chemical Engineering, University of Girona, Campus Montilivi, Girona 17071, Spain
Received 3 November 2004; received in revised form 24 February 2005
Abstract
The aim of the present paper was to study the feasibility of using olive oil mill effluents (OMEs) as a substrate in
biodegradable polymer production. OMEs were anaerobically fermented to obtain volatile fatty acids (VFAs), which
are the most highly used substrate for polyhydroxyalkanotes (PHAs) production. The anaerobic fermentation step was
studied both without pretreatment and with different pretreatments (i.e., centrifugation, bentonite addition, and
bentonite addition followed by centrifugation) and at various concentrations (28.5, 36.7 and 70.4 gCODL�1). During
fermentation, VFA concentration was determined (7–16 gCODL�1) as well as the corresponding yield with respect to
initial COD (22–44%). At all initial concentrations, centrifugation pretreatment (with or without previous addition of
bentonite) significantly increased the final VFA concentration and yield, whereas the addition of bentonite alone had no
influence. Moreover, centrifugation pretreatment led to a different acid distribution, which affected the hydroxyvalerate
(HV) content within the obtained copolymer poly b-(hydroxybutyrate-hydroxyvalerate) [P(HB-HV)]. OMEs were
tested for PHA production by using a mixed culture from an aerobic SBR. Centrifuged OMEs, both with or without
fermentation, were tested. PHAs were produced from both matrices, but with fermented OMEs PHA production was
much higher, because of the higher VFA concentration. The initial specific rate of PHA production obtained with
fermented OMEs was approximately 420mg CODgCOD�1 h�1 and the maximum HV content within the copolymer
was about 11% (on a molar basis). The HV monomer was produced only until propionic acid remained present in the
medium.
r 2005 Elsevier Ltd. All rights reserved.
Keywords: Oil mill effluents; Volatile fatty acids; Polyhydroxyalkanoates; Pretreatments; Acidogenic fermentation; Polymer storage
1. Introduction
Bioplastics are attracting much interest as alternatives
to traditional plastics, this is due to the fact that they are
e front matter r 2005 Elsevier Ltd. All rights reserve
atres.2005.03.011
ing author. Fax: +3906490631.
ess: [email protected] (D. Dionisi).
biodegradable and can be formed from renewable
resources. Among the biodegradable plastics polyhy-
droxyalkanoates (PHAs), and in particular the copoly-
mer poly b-(hydroxybutyrate-hydroxyvalerate) [P(HB-
HV)], are the most promising. P(HB-HV) has similar
properties to polypropylene, it can be processed in the
same way and it could have the same wide range of
d.
Page 3
ARTICLE IN PRESSD. Dionisi et al. / Water Research 39 (2005) 2076–2084 2077
application (Lee, 1996; Carrasco et al., 2004). However,
until now production of P(HB-HV) has proven to be
much more costly than traditional oil-derived plastics
and this has hindered its use becoming more widespread
(Salehizadeh and van Loosdrecht, 2004). Hence, there is
a potential for widening the market for PHAs, provided
that their cost decreases.
One of the most relevant costs in the production of
PHAs is the cost of the substrate (Lee, 1996; Choi and
Lee, 2000), which is usually pure (e.g. glucose and
propionate for P(HB-HV) production). In recent years,
the use of organic wastes (such as swine waste liquor,
palm oil mill effluents, and vegetable and fruit wastes) is
being studied as an alternative substrate for PHA
production (Hassan et al., 1996, 1997a, b; Meesters,
1998; Reis et al., 2003; Salehizadeh and van Loosdrecht,
2004).
Olive oil mill effluents (OMEs) can also be considered
as an alternative, no-cost substrate for PHA production.
OMEs cause serious environmental pollution due to
their high level of production (about 30 millionm3/year
in Mediterranean countries) and COD content
(100–200 gCODL�1). Up to now, the processes used
to treat OMEs are considerably diversified: combustion
fluidized bed (Cliffe and Patumsawad, 2001), anaerobic
filter (Borja and Banks, 1995), anaerobic digestion and
codigestion (Andreozzi et al., 1998; Angelidaki and
Ahring, 1997), UASB (Saatci et al., 2003), membrane
technology (Ahmad et al., 2003), pond system (Chin et
al., 1996), ozonation reactor (Andreozzi et al., 1998),
and activated carbon bed (Galiatsatou et al., 2002).
From the point-of-view of PHA production, their
high COD content can be an advantage due to the
possibility of fermenting OMEs at high rates to produce
volatile fatty acids (VFAs) (Beccari et al., 1996), which
in turn can be used for PHA production. Indeed, the
acidogenic fermentation step is not inhibited to a great
extent by OME lipidic and phenolic substances, which,
on the other hand, inhibit the further step of methano-
genesis (Beccari et al., 1999). Another advantage of
OMEs with respect to other organic wastes is that they
are a liquid stream and can therefore be easily pumped
and treated in slurry-phase bioreactors. There is a lack
of experimental data on the feasibility of using
fermented OMEs for PHA production, however.
A new process (Dionisi et al., 2004) was proposed for
the production of biodegradable PHAs from wastes, by
using a combination of anaerobic and aerobic steps. The
proposed process has three sequential steps. In the first
step, acidogenic fermentation transforms highly concen-
trated biodegradable waste into a mixture of organic
acids. In the second step, an aerobically activated sludge
process is operated at medium–high organic load by
periodic feeding in a Sequencing Batch Reactor (SBR) in
order to enrich and produce a sludge with a high storage
response. The produced excess sludge has a high storage
response that is exploited in a third step, this is operated
in batch but at a considerably higher organic load in
order to saturate the sludge storage capacity. The PHA-
rich sludge then flows downstream for processing for
PHA extraction and purification. This process has only
been previously studied with reference to steps 2 and 3,
however, with only synthetic mixtures of organic acids
being used as the feed (Dionisi et al., 2004). Experi-
mental studies on applications with real waste matrices
are therefore lacking.
The aim of this study was at to examine the
production of PHAs from OMEs, with both the
fermentation step (step 1) and the PHA production step
(step 3) being investigated. In the fermentation step,
VFA production rates and yields were studied for OMEs
with and without different pretreatments (bentonite
addition, centrifugation, or bentonite addition followed
by centrifugation). The PHA production stage was
investigated by means of batch tests performed by using
a mixed culture enriched in a SBR fed with a mixture of
organic acids (step 2, Dionisi et al., 2004). The
production rates and the composition of the biodegrad-
able polymer were also investigated in comparison with
synthetic substrates to which the enriched biomass had
been acclimated.
2. Experimental methods
2.1. OME characterization
Fresh OMEs were obtained from an olive continuous
centrifuge processing plant. The OMEs were character-
ized as follows: pH ¼ 5.2, total COD ¼ 113.8 gL�1,
soluble COD (filtered at 0.22 mm) ¼ 34.5 gL�1, soluble
polyphenols¼ 2.2gL�1, soluble carbohydrates ¼ 3.1gL�1,
Kjeldhal nitrogen ¼ 2gL�1 and lipids ¼ 11.1gL�1.
2.2. Pretreatment tests
The OMEs were brought to pH 6.5 by adding CaO.
They were then used directly for fermentation tests (see
Section 2.3) or pretreated according to three different
procedures. The first type of pretreatment was carried
out by the addition of bentonite (B-3378 Sigma) (up to
10 gL–1, Beccari et al., 2001). The bentonite–OME
slurry was magnetically stirred for 2 h, then it was left
for 24 h. The bentonite–OME slurry was either recov-
ered and used in its entirety for fermentation tests
(OME–B) or it was pretreated further by centrifuging
(5000 rpm for 15min), and the supernatant was used in
the fermentation tests (second type of pretreatment,
OME–BC). The third type of pretreatment was the
direct centrifugation of OME with no previous addition
of bentonite (OME–C). The supernatant was recovered
and used for fementation tests, also in this case.
Page 4
ARTICLE IN PRESSD. Dionisi et al. / Water Research 39 (2005) 2076–20842078
2.3. Biotreatability tests
Batch tests were carried out in 500mL glass bottles
with perforated screw caps and latex under-caps. These
bottles were filled with 200mL of slurry with the
following composition: OMEs or pretreated OMEs
(50–130mL), inoculum (10–20mL, up to 10% of total
COD) and distilled water (as required for a final volume
of 200mL). Within the given ranges, the added volume
of OMEs or pretreated OMEs varied for the different
series of fermentation tests (see below) and for the
different pretreatments, being adjusted in order to reach
the desired COD at the beginning of the test. In order to
produce and maintain anaerobic conditions, each bottle
was fluxed with CO2–N2 (at the beginning of the test as
well as after each sampling). Inoculum was obtained
from an anaerobic digester treating lipid-rich food
factory effluents. Bottles were kept at 25 1C under
continuous agitation at 150 rpm in a thermostatic bath
(Dubnoff BSD/D). For all OME samples, the initial pH
was brought to 6.5 by the addition of CaO. Three
different series (I–III) of fermentation tests were
performed at various initial concentrations (28.5, 70.4
and 36.7 gCODL�1, respectively). The highest concen-
tration (70.4 gCODL�1) corresponded to the lowest
OME dilution that could be successfully treated under
methanogenic conditions (Beccari et al., 2001). All
bottles had the same initial COD within each series.
2.4. Polymer production tests
Two different OME matrices were used for PHA
production tests: (1) centrifuged and fermented OME
and (2) only centrifuged OME (without fermentation).
The biomass for PHA production tests was an activated
sludge enriched under ‘‘feast and famine’’ aerobic
conditions in a SBR. The operating conditions of the
SBR were the same as in a previous study (Dionisi et al.,
2004): the feed was a mixture of acetic, lactic and
propionic acids (40%, 40% and 20%, respectively, on a
COD basis) and the organic load rate was
8.5 gCODL�1 d�1. In perfoming the PHA production
tests, the biomass was withdrawn from the SBR at the
end of the cycle, and diluted to the chosen concentration
(about 300mgVSSL�1). A fixed volume (70mL) of the
chosen OMEs was then added to the biomass. The tests
were carried out at a pH of 7.5 and a temperature of
25 1C. Samples were taken at regular intervals during the
test in order to determine the VFA and PHA contents.
The oxygen uptake rate (OUR) was evaluated by
interrupting aeration for short periods and measuring
oxygen concentration as a function of time. Initial rates
of VFA removal and PHA formation were calculated by
linear regression of concentration vs time data and were
expressed as specific rates with respect to the initial
biomass concentration. The biomass concentration was
calculated as gCODL�1 by using a conversion factor of
1.42 gCODgVSS�1. Refer to Dionisi et al. (2004) for
further details regarding the performance of the test.
2.5. Analyses
In order to determine polyphenols in the liquid phase
the Folin Ciocalteau method was used. Lipids were
evaluated by gravimetric analysis. Carbohydrates were
analyzed by spectrophotometry upon color development
by reaction with phenol and sulfuric acid. VFA and
lactic acid were determined by GC (Perkin Elmer,
column: packed stationary phase Carbograph 1 AL 80/
120, L ¼ 2:4m, D ¼ 3:2mm, carrier N2, detector FID,
internal standard: acrylic acid). PHB and P(HB-HV)
were hydrolyzed and esterified to 3-hydroxyacyl methyl
esters and then determined by GC (Perkin Elmer,
stationary phase 2% Reoplex 400 on 80/120 Chromo-
sorb GAW, L ¼ 1:83m, D ¼ 2mm, gas carrier N2
detector FID, internal standard: benzoic acid). HB and
HV monomers were converted into COD units accord-
ing to oxidation stoichiometry: 1.38mgCODmg(HB)�1
and 1.63mgCODmg(HV)�1.
In biotreatability tests, the gaseous phase was
analyzed for methane and hydrogen content by GC
(Varian 3400, 2mm packed column, stationary pha-
se ¼ Carbopack B 1%, gas carrier He, FID, injector and
detector T ¼ 260 1C, isotherm mode ¼ 80 1C). More
detailed descriptions of the analytical methods are
reported elsewhere (Beccari et al., 1999; Dionisi et al.,
2004). COD, N-NH3 and solid measurements were made
according to APHA–AWWA–WPCF procedures
(1992).
3. Results and discussion
3.1. Pretreatment effects on COD removal from OME
Total COD removal (mean value of three replicates)
was determined for each pretreatment. Centrifugation
(C) and addition of bentonite followed by centrifugation
(BC) showed similar COD removal efficiency: 55.8%
and 57.7%, respectively (Table 1). When bentonite was
added without subsequent separation (B) there was no
COD removal as it remained in the slurry and, even if
partially adsorbed on bentonite, was potentially avail-
able for the subsequent fermentation step.
3.2. Pretreatment effect on rate and yield of VFA
production
Two series of fermentation tests were performed
simultaneously to evaluate the effect of bentonite at
initial concentrations of 28.5 gCODL�1 (Series I) and
70.4 gCODL�1 (Series II), respectively. At both initial
Page 5
ARTICLE IN PRESS
18.0
16.0
14.012.0
10.0
8.0
6.0
4.0
2.0
0.00 5 10 15 20 25 30 35 40 45 50
Time (days)V
FA p
rodu
ctio
n, g
CO
D/L
Series I, OMESeries I, OME-BSeries I, OME-BCSeries II, OMESeries II, OME-B
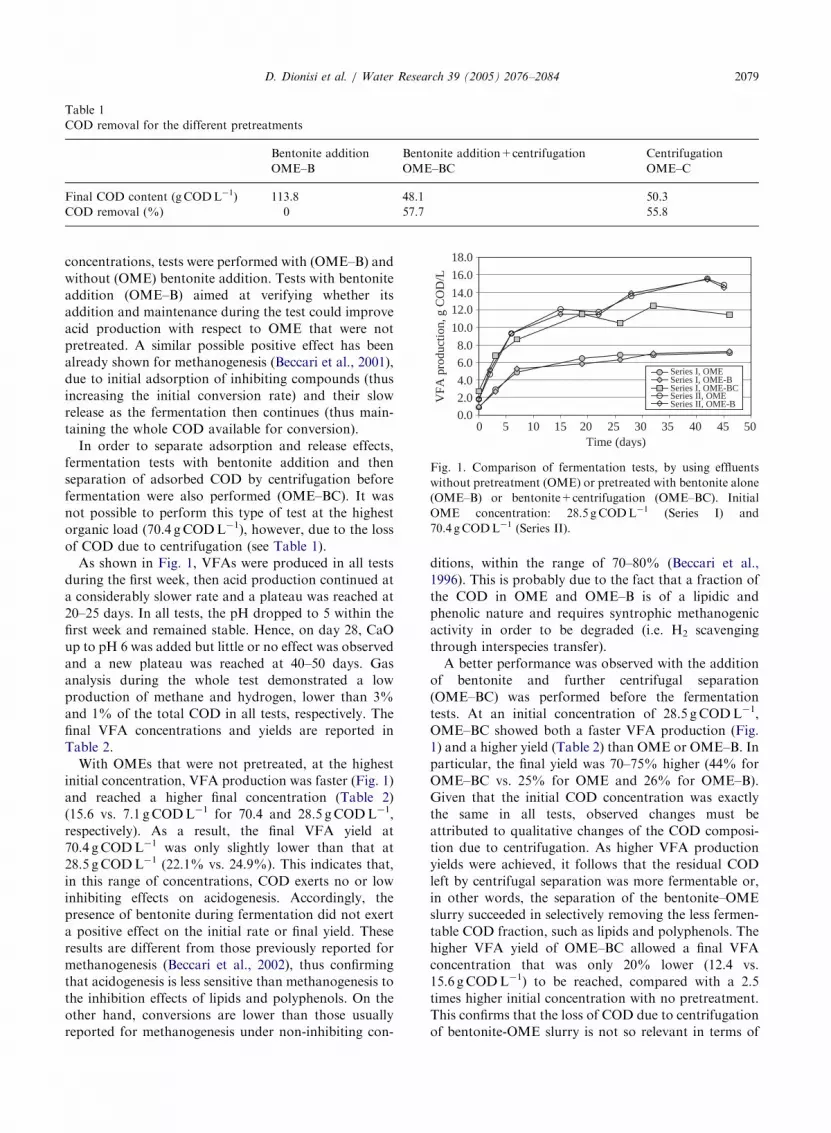
Fig. 1. Comparison of fermentation tests, by using effluents
without pretreatment (OME) or pretreated with bentonite alone
(OME–B) or bentonite+centrifugation (OME–BC). Initial
OME concentration: 28.5 gCODL�1 (Series I) and
70.4 gCODL�1 (Series II).
Table 1
COD removal for the different pretreatments
Bentonite addition
OME–B
Bentonite addition+centrifugation
OME–BC
Centrifugation
OME–C
Final COD content (gCODL�1) 113.8 48.1 50.3
COD removal (%) 0 57.7 55.8
D. Dionisi et al. / Water Research 39 (2005) 2076–2084 2079
concentrations, tests were performed with (OME–B) and
without (OME) bentonite addition. Tests with bentonite
addition (OME–B) aimed at verifying whether its
addition and maintenance during the test could improve
acid production with respect to OME that were not
pretreated. A similar possible positive effect has been
already shown for methanogenesis (Beccari et al., 2001),
due to initial adsorption of inhibiting compounds (thus
increasing the initial conversion rate) and their slow
release as the fermentation then continues (thus main-
taining the whole COD available for conversion).
In order to separate adsorption and release effects,
fermentation tests with bentonite addition and then
separation of adsorbed COD by centrifugation before
fermentation were also performed (OME–BC). It was
not possible to perform this type of test at the highest
organic load (70.4 gCODL�1), however, due to the loss
of COD due to centrifugation (see Table 1).
As shown in Fig. 1, VFAs were produced in all tests
during the first week, then acid production continued at
a considerably slower rate and a plateau was reached at
20–25 days. In all tests, the pH dropped to 5 within the
first week and remained stable. Hence, on day 28, CaO
up to pH 6 was added but little or no effect was observed
and a new plateau was reached at 40–50 days. Gas
analysis during the whole test demonstrated a low
production of methane and hydrogen, lower than 3%
and 1% of the total COD in all tests, respectively. The
final VFA concentrations and yields are reported in
Table 2.
With OMEs that were not pretreated, at the highest
initial concentration, VFA production was faster (Fig. 1)
and reached a higher final concentration (Table 2)
(15.6 vs. 7.1 gCODL�1 for 70.4 and 28.5 gCODL�1,
respectively). As a result, the final VFA yield at
70.4 gCODL�1 was only slightly lower than that at
28.5 gCODL�1 (22.1% vs. 24.9%). This indicates that,
in this range of concentrations, COD exerts no or low
inhibiting effects on acidogenesis. Accordingly, the
presence of bentonite during fermentation did not exert
a positive effect on the initial rate or final yield. These
results are different from those previously reported for
methanogenesis (Beccari et al., 2002), thus confirming
that acidogenesis is less sensitive than methanogenesis to
the inhibition effects of lipids and polyphenols. On the
other hand, conversions are lower than those usually
reported for methanogenesis under non-inhibiting con-
ditions, within the range of 70–80% (Beccari et al.,
1996). This is probably due to the fact that a fraction of
the COD in OME and OME–B is of a lipidic and
phenolic nature and requires syntrophic methanogenic
activity in order to be degraded (i.e. H2 scavenging
through interspecies transfer).
A better performance was observed with the addition
of bentonite and further centrifugal separation
(OME–BC) was performed before the fermentation
tests. At an initial concentration of 28.5 gCODL�1,
OME–BC showed both a faster VFA production (Fig.
1) and a higher yield (Table 2) than OME or OME–B. In
particular, the final yield was 70–75% higher (44% for
OME–BC vs. 25% for OME and 26% for OME–B).
Given that the initial COD concentration was exactly
the same in all tests, observed changes must be
attributed to qualitative changes of the COD composi-
tion due to centrifugation. As higher VFA production
yields were achieved, it follows that the residual COD
left by centrifugal separation was more fermentable or,
in other words, the separation of the bentonite–OME
slurry succeeded in selectively removing the less fermen-
table COD fraction, such as lipids and polyphenols. The
higher VFA yield of OME–BC allowed a final VFA
concentration that was only 20% lower (12.4 vs.
15.6 gCODL�1) to be reached, compared with a 2.5
times higher initial concentration with no pretreatment.
This confirms that the loss of COD due to centrifugation
of bentonite-OME slurry is not so relevant in terms of
Page 6
ARTICLE IN PRESS
Table 2
VFA production and distribution of acids, at different initial concentrations and for various pretreatments, at the end of fermentation
(OME: without pretreatment, OME–B: bentonite addition, OME–C: centrifugation, OME–BC: bentonite addition+centrifugation)
Series I Series II Series III
OME OME–B OME–BC OME OME–B OME OME–BC OME–C
Initial OME (gCODL�1) 28.5 28.5 28.5 70.4 70.4 36.7 36.7 36.7
Produced VFA (gCODL�1) 7.1 7.3 12.4 15.6 15.5 9.2 12.0 13.0
VFA yield (%) 24.9 25.9 43.6 22.1 22.0 25.2 32.5 35.6
% of each acid within VFA
Acetic acid 53.4 52.7 54.4 54.1 51.7 46.7 31.6 38.7
Propionic acid 14.7 14.0 7.1 9.8 9.0 16.4 9.5 9.9
Isobutyric acid 0.4 0.1 2.5 0.3 0.1 0.0 2.0 2.7
Butyric acid 27.4 29.5 39.5 37.3 36.3 21.8 54.4 46.7
Valeric acid 4.1 3.7 0.5 3.4 2.9 15.1 2.5 2.1
14.0
12.0
10.0
8.0
6.0
4.0
2.0
0.00 5 10 15 20 25 30 35 40
Time (days)
VFA
pro
duct
ion,
g C
OD
/L
Series III, OME
Series III, OME-C
Series III, OME-BC
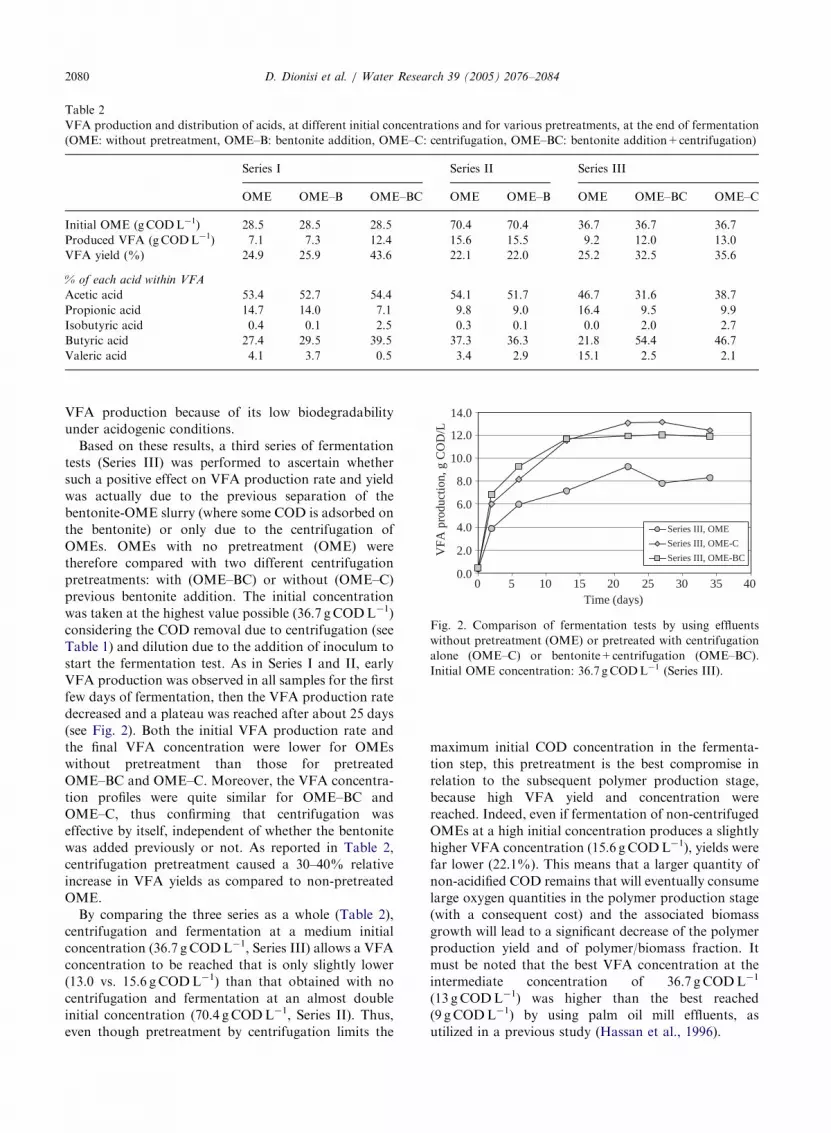
Fig. 2. Comparison of fermentation tests by using effluents
without pretreatment (OME) or pretreated with centrifugation
alone (OME–C) or bentonite+centrifugation (OME–BC).
Initial OME concentration: 36.7 gCODL�1 (Series III).
D. Dionisi et al. / Water Research 39 (2005) 2076–20842080
VFA production because of its low biodegradability
under acidogenic conditions.
Based on these results, a third series of fermentation
tests (Series III) was performed to ascertain whether
such a positive effect on VFA production rate and yield
was actually due to the previous separation of the
bentonite-OME slurry (where some COD is adsorbed on
the bentonite) or only due to the centrifugation of
OMEs. OMEs with no pretreatment (OME) were
therefore compared with two different centrifugation
pretreatments: with (OME–BC) or without (OME–C)
previous bentonite addition. The initial concentration
was taken at the highest value possible (36.7 gCODL�1)
considering the COD removal due to centrifugation (see
Table 1) and dilution due to the addition of inoculum to
start the fermentation test. As in Series I and II, early
VFA production was observed in all samples for the first
few days of fermentation, then the VFA production rate
decreased and a plateau was reached after about 25 days
(see Fig. 2). Both the initial VFA production rate and
the final VFA concentration were lower for OMEs
without pretreatment than those for pretreated
OME–BC and OME–C. Moreover, the VFA concentra-
tion profiles were quite similar for OME–BC and
OME–C, thus confirming that centrifugation was
effective by itself, independent of whether the bentonite
was added previously or not. As reported in Table 2,
centrifugation pretreatment caused a 30–40% relative
increase in VFA yields as compared to non-pretreated
OME.
By comparing the three series as a whole (Table 2),
centrifugation and fermentation at a medium initial
concentration (36.7 gCODL�1, Series III) allows a VFA
concentration to be reached that is only slightly lower
(13.0 vs. 15.6 gCODL�1) than that obtained with no
centrifugation and fermentation at an almost double
initial concentration (70.4 gCODL�1, Series II). Thus,
even though pretreatment by centrifugation limits the
maximum initial COD concentration in the fermenta-
tion step, this pretreatment is the best compromise in
relation to the subsequent polymer production stage,
because high VFA yield and concentration were
reached. Indeed, even if fermentation of non-centrifuged
OMEs at a high initial concentration produces a slightly
higher VFA concentration (15.6 gCODL�1), yields were
far lower (22.1%). This means that a larger quantity of
non-acidified COD remains that will eventually consume
large oxygen quantities in the polymer production stage
(with a consequent cost) and the associated biomass
growth will lead to a significant decrease of the polymer
production yield and of polymer/biomass fraction. It
must be noted that the best VFA concentration at the
intermediate concentration of 36.7 gCODL�1
(13 gCODL�1) was higher than the best reached
(9 gCODL�1) by using palm oil mill effluents, as
utilized in a previous study (Hassan et al., 1996).
Page 7
ARTICLE IN PRESS
0.8
0.7
0.6
0.5
0.4
0.3
0.2
0.1
0-50 0 50 100 150 200 250 300 350 400
Time (min)
But
yric
and
ace
tic a
cid
(g C
OD
L-1
)
0
0.01
0.02
0.03
0.04
0.05
0.06
0.07
0.08
Pro
pion
ic a
nd is
obut
yric
aci
d(g
CO
D L
-1)
acetic acidbutyric acidpropionic acidisobutyric acid
0
100
200
300
400
500
600
-50 0 50 100 150 200 250 300 350 400Time (min)
HB
(m
g C
OD
L-1
)
0
5
10
15
20
25
30
35
40
45
HV
(m
g C
OD
L-1
)
HBHV
0
10
20
30
40
50
60
-50 0 50 100 150 200 250 300 350 400Time (min)
OU
R (
mgO
2 L-1
h-1
)
(A)
(B)
(C)
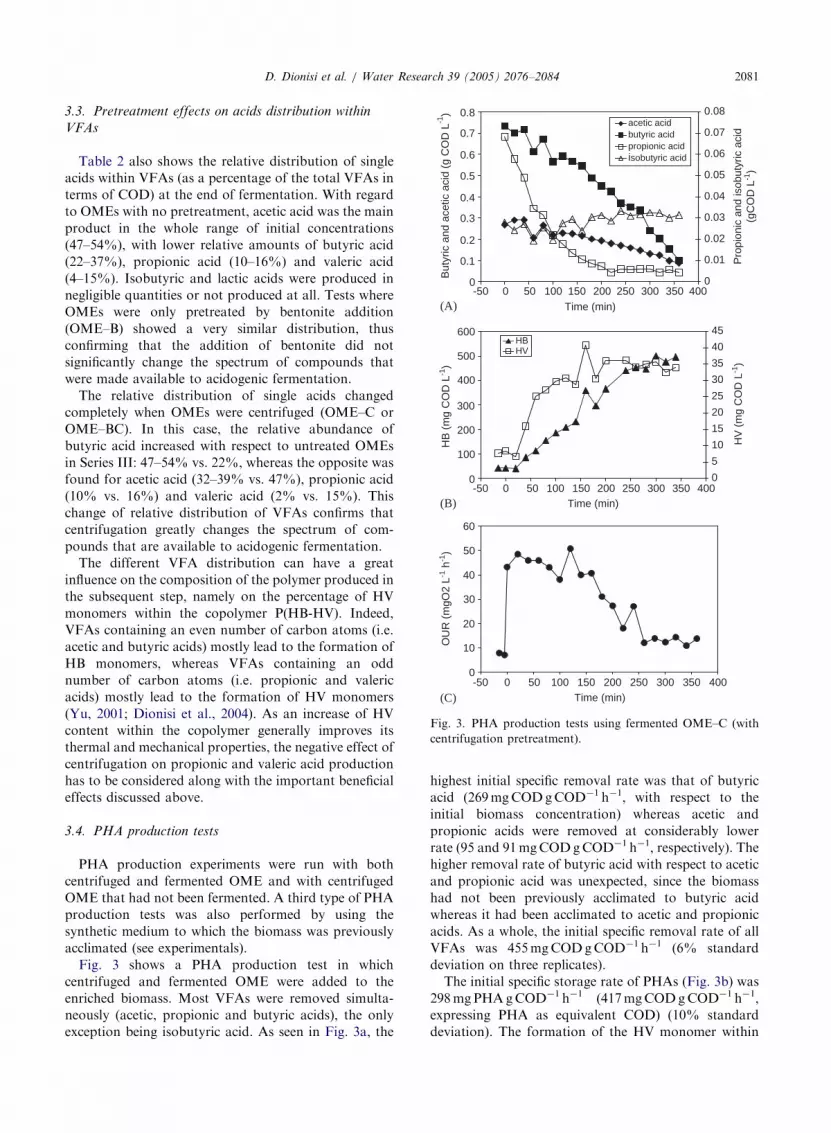
Fig. 3. PHA production tests using fermented OME–C (with
centrifugation pretreatment).
D. Dionisi et al. / Water Research 39 (2005) 2076–2084 2081
3.3. Pretreatment effects on acids distribution within
VFAs
Table 2 also shows the relative distribution of single
acids within VFAs (as a percentage of the total VFAs in
terms of COD) at the end of fermentation. With regard
to OMEs with no pretreatment, acetic acid was the main
product in the whole range of initial concentrations
(47–54%), with lower relative amounts of butyric acid
(22–37%), propionic acid (10–16%) and valeric acid
(4–15%). Isobutyric and lactic acids were produced in
negligible quantities or not produced at all. Tests where
OMEs were only pretreated by bentonite addition
(OME–B) showed a very similar distribution, thus
confirming that the addition of bentonite did not
significantly change the spectrum of compounds that
were made available to acidogenic fermentation.
The relative distribution of single acids changed
completely when OMEs were centrifuged (OME–C or
OME–BC). In this case, the relative abundance of
butyric acid increased with respect to untreated OMEs
in Series III: 47–54% vs. 22%, whereas the opposite was
found for acetic acid (32–39% vs. 47%), propionic acid
(10% vs. 16%) and valeric acid (2% vs. 15%). This
change of relative distribution of VFAs confirms that
centrifugation greatly changes the spectrum of com-
pounds that are available to acidogenic fermentation.
The different VFA distribution can have a great
influence on the composition of the polymer produced in
the subsequent step, namely on the percentage of HV
monomers within the copolymer P(HB-HV). Indeed,
VFAs containing an even number of carbon atoms (i.e.
acetic and butyric acids) mostly lead to the formation of
HB monomers, whereas VFAs containing an odd
number of carbon atoms (i.e. propionic and valeric
acids) mostly lead to the formation of HV monomers
(Yu, 2001; Dionisi et al., 2004). As an increase of HV
content within the copolymer generally improves its
thermal and mechanical properties, the negative effect of
centrifugation on propionic and valeric acid production
has to be considered along with the important beneficial
effects discussed above.
3.4. PHA production tests
PHA production experiments were run with both
centrifuged and fermented OME and with centrifuged
OME that had not been fermented. A third type of PHA
production tests was also performed by using the
synthetic medium to which the biomass was previously
acclimated (see experimentals).
Fig. 3 shows a PHA production test in which
centrifuged and fermented OME were added to the
enriched biomass. Most VFAs were removed simulta-
neously (acetic, propionic and butyric acids), the only
exception being isobutyric acid. As seen in Fig. 3a, the
highest initial specific removal rate was that of butyric
acid (269mgCODgCOD�1 h�1, with respect to the
initial biomass concentration) whereas acetic and
propionic acids were removed at considerably lower
rate (95 and 91mgCODgCOD�1 h�1, respectively). The
higher removal rate of butyric acid with respect to acetic
and propionic acid was unexpected, since the biomass
had not been previously acclimated to butyric acid
whereas it had been acclimated to acetic and propionic
acids. As a whole, the initial specific removal rate of all
VFAs was 455mgCODgCOD�1 h�1 (6% standard
deviation on three replicates).
The initial specific storage rate of PHAs (Fig. 3b) was
298mgPHAgCOD�1 h�1 (417mgCODgCOD�1 h�1,
expressing PHA as equivalent COD) (10% standard
deviation). The formation of the HV monomer within
Page 8
ARTICLE IN PRESS
0
500
400
300
200
100
600
0 50 100 150 200 250 300 350 400
Time (min)
0 50 100 150 200 250 300 350 400
Time (h)
Tot
al P
HA
s (
mgC
OD
L-1
)
Synthetic substrates
Fermented OMEs
0
500
3000
2500
2000
1500
1000R
emov
ed o
rgan
ic a
cids
(VF
As
+ L
actic
aci
d) (
mgC
OD
L-1
)
Synthetic substrates
Fermented OMEs
(A)
(B)
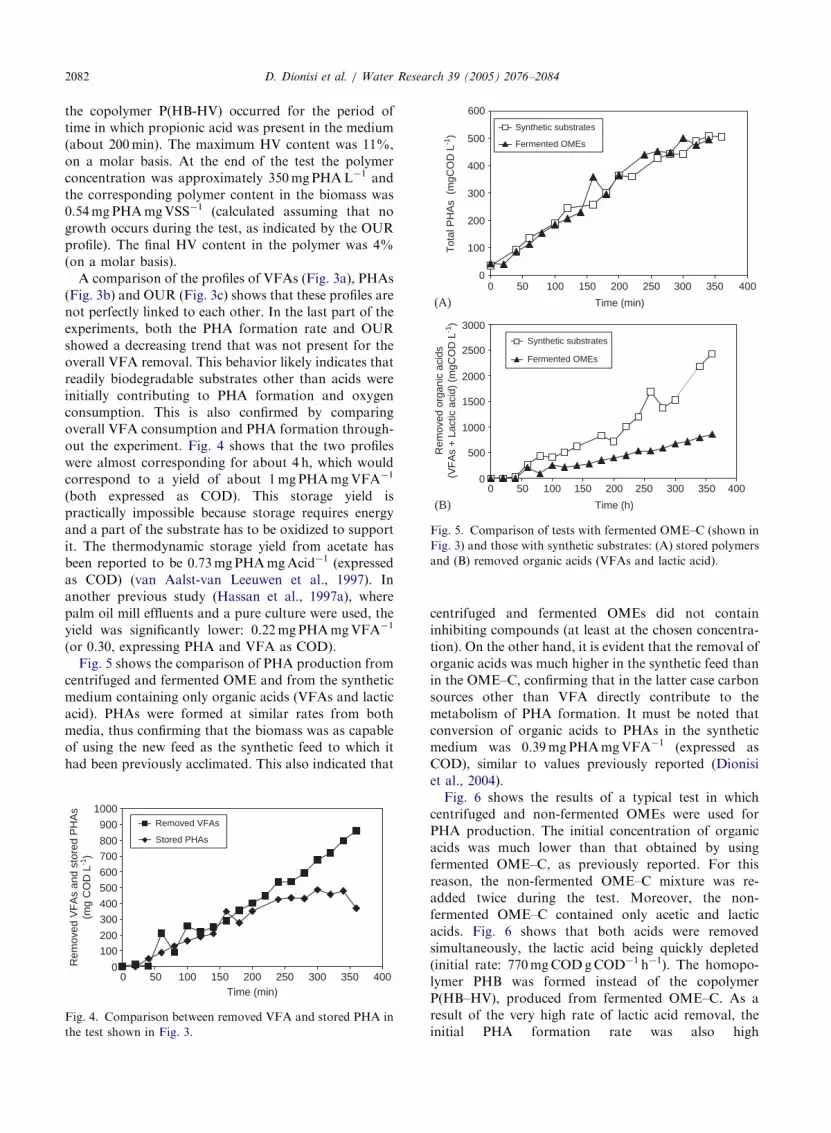
Fig. 5. Comparison of tests with fermented OME–C (shown in
Fig. 3) and those with synthetic substrates: (A) stored polymers
and (B) removed organic acids (VFAs and lactic acid).
D. Dionisi et al. / Water Research 39 (2005) 2076–20842082
the copolymer P(HB-HV) occurred for the period of
time in which propionic acid was present in the medium
(about 200min). The maximum HV content was 11%,
on a molar basis. At the end of the test the polymer
concentration was approximately 350mgPHAL�1 and
the corresponding polymer content in the biomass was
0.54mgPHAmgVSS�1 (calculated assuming that no
growth occurs during the test, as indicated by the OUR
profile). The final HV content in the polymer was 4%
(on a molar basis).
A comparison of the profiles of VFAs (Fig. 3a), PHAs
(Fig. 3b) and OUR (Fig. 3c) shows that these profiles are
not perfectly linked to each other. In the last part of the
experiments, both the PHA formation rate and OUR
showed a decreasing trend that was not present for the
overall VFA removal. This behavior likely indicates that
readily biodegradable substrates other than acids were
initially contributing to PHA formation and oxygen
consumption. This is also confirmed by comparing
overall VFA consumption and PHA formation through-
out the experiment. Fig. 4 shows that the two profiles
were almost corresponding for about 4 h, which would
correspond to a yield of about 1mgPHAmgVFA�1
(both expressed as COD). This storage yield is
practically impossible because storage requires energy
and a part of the substrate has to be oxidized to support
it. The thermodynamic storage yield from acetate has
been reported to be 0.73mgPHAmgAcid�1 (expressed
as COD) (van Aalst-van Leeuwen et al., 1997). In
another previous study (Hassan et al., 1997a), where
palm oil mill effluents and a pure culture were used, the
yield was significantly lower: 0.22mgPHAmgVFA�1
(or 0.30, expressing PHA and VFA as COD).
Fig. 5 shows the comparison of PHA production from
centrifuged and fermented OME and from the synthetic
medium containing only organic acids (VFAs and lactic
acid). PHAs were formed at similar rates from both
media, thus confirming that the biomass was as capable
of using the new feed as the synthetic feed to which it
had been previously acclimated. This also indicated that
0
100
200
300
400
500
600
700
800
900
1000
0 50 100 150 200 250 300 350 400Time (min)
Rem
oved
VF
As
and
stor
ed P
HA
s(m
g C
OD
L-1
)
Removed VFAs
Stored PHAs
Fig. 4. Comparison between removed VFA and stored PHA in
the test shown in Fig. 3.
centrifuged and fermented OMEs did not contain
inhibiting compounds (at least at the chosen concentra-
tion). On the other hand, it is evident that the removal of
organic acids was much higher in the synthetic feed than
in the OME–C, confirming that in the latter case carbon
sources other than VFA directly contribute to the
metabolism of PHA formation. It must be noted that
conversion of organic acids to PHAs in the synthetic
medium was 0.39mgPHAmgVFA�1 (expressed as
COD), similar to values previously reported (Dionisi
et al., 2004).
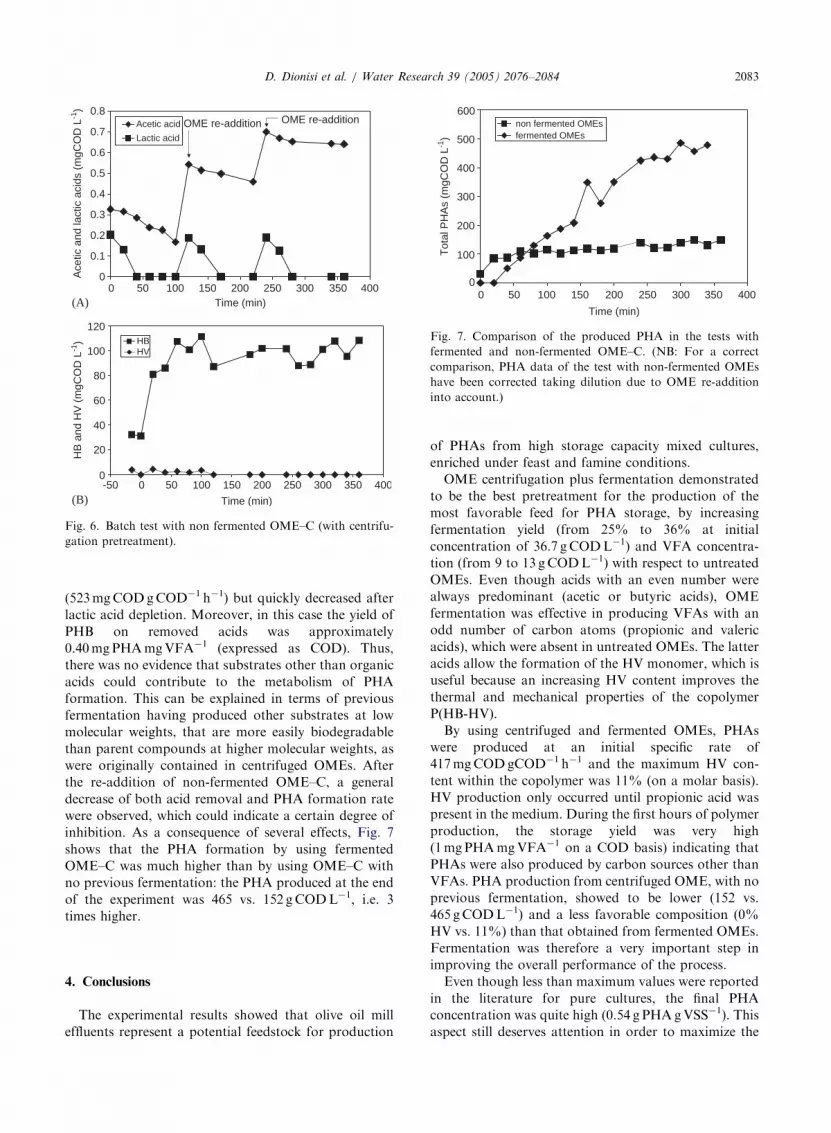
Fig. 6 shows the results of a typical test in which
centrifuged and non-fermented OMEs were used for
PHA production. The initial concentration of organic
acids was much lower than that obtained by using
fermented OME–C, as previously reported. For this
reason, the non-fermented OME–C mixture was re-
added twice during the test. Moreover, the non-
fermented OME–C contained only acetic and lactic
acids. Fig. 6 shows that both acids were removed
simultaneously, the lactic acid being quickly depleted
(initial rate: 770mgCODgCOD�1 h�1). The homopo-
lymer PHB was formed instead of the copolymer
P(HB–HV), produced from fermented OME–C. As a
result of the very high rate of lactic acid removal, the
initial PHA formation rate was also high
Page 9
ARTICLE IN PRESS
0.8
0.7
0.6
0.5
0.4
0.3
0.2
0.1
00 50 100 150 200 250 300 350 400
Time (min)
Ace
tic a
nd la
ctic
aci
ds (
mgC
OD
L-1
)
Acetic acid
Lactic acid
OME re-addition OME re-addition
0
20
40
60
80
100
120
-50 0 50 100 150 200 250 300 350 400
Time (min)
HB
and
HV
(m
gCO
D L
-1) HB
HV
(A)
(B)
Fig. 6. Batch test with non fermented OME–C (with centrifu-
gation pretreatment).
0
600
500
400
300
200
100
0 50 100 150 200 250 300 350 400
Time (min)
Tot
al P
HA
s (m
gCO
D L
-1)
non fermented OMEsfermented OMEs
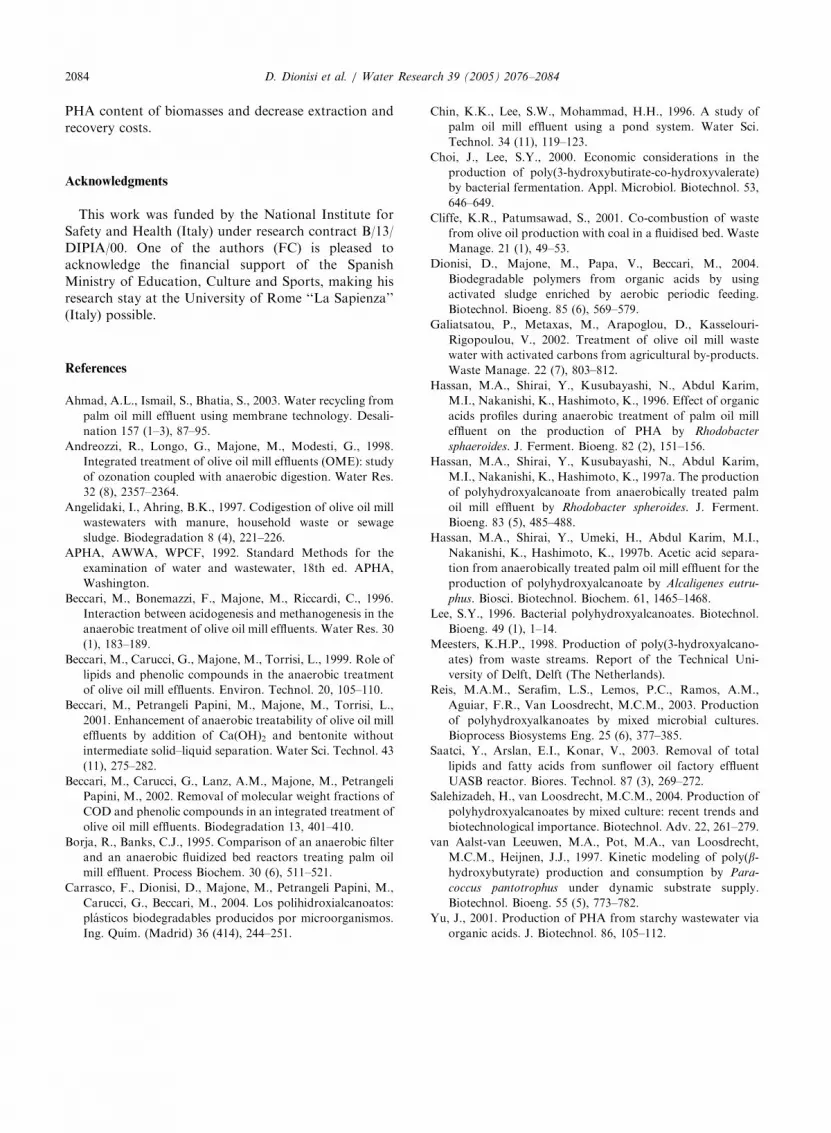
Fig. 7. Comparison of the produced PHA in the tests with
fermented and non-fermented OME–C. (NB: For a correct
comparison, PHA data of the test with non-fermented OMEs
have been corrected taking dilution due to OME re-addition
into account.)
D. Dionisi et al. / Water Research 39 (2005) 2076–2084 2083
(523mgCODgCOD�1 h�1) but quickly decreased after
lactic acid depletion. Moreover, in this case the yield of
PHB on removed acids was approximately
0.40mgPHAmgVFA�1 (expressed as COD). Thus,
there was no evidence that substrates other than organic
acids could contribute to the metabolism of PHA
formation. This can be explained in terms of previous
fermentation having produced other substrates at low
molecular weights, that are more easily biodegradable
than parent compounds at higher molecular weights, as
were originally contained in centrifuged OMEs. After
the re-addition of non-fermented OME–C, a general
decrease of both acid removal and PHA formation rate
were observed, which could indicate a certain degree of
inhibition. As a consequence of several effects, Fig. 7
shows that the PHA formation by using fermented
OME–C was much higher than by using OME–C with
no previous fermentation: the PHA produced at the end
of the experiment was 465 vs. 152 gCODL�1, i.e. 3
times higher.
4. Conclusions
The experimental results showed that olive oil mill
effluents represent a potential feedstock for production
of PHAs from high storage capacity mixed cultures,
enriched under feast and famine conditions.
OME centrifugation plus fermentation demonstrated
to be the best pretreatment for the production of the
most favorable feed for PHA storage, by increasing
fermentation yield (from 25% to 36% at initial
concentration of 36.7 gCODL�1) and VFA concentra-
tion (from 9 to 13 gCODL�1) with respect to untreated
OMEs. Even though acids with an even number were
always predominant (acetic or butyric acids), OME
fermentation was effective in producing VFAs with an
odd number of carbon atoms (propionic and valeric
acids), which were absent in untreated OMEs. The latter
acids allow the formation of the HV monomer, which is
useful because an increasing HV content improves the
thermal and mechanical properties of the copolymer
P(HB-HV).
By using centrifuged and fermented OMEs, PHAs
were produced at an initial specific rate of
417mgCODgCOD�1 h�1 and the maximum HV con-
tent within the copolymer was 11% (on a molar basis).
HV production only occurred until propionic acid was
present in the medium. During the first hours of polymer
production, the storage yield was very high
(1mgPHAmgVFA�1 on a COD basis) indicating that
PHAs were also produced by carbon sources other than
VFAs. PHA production from centrifuged OME, with no
previous fermentation, showed to be lower (152 vs.
465 gCODL�1) and a less favorable composition (0%
HV vs. 11%) than that obtained from fermented OMEs.
Fermentation was therefore a very important step in
improving the overall performance of the process.
Even though less than maximum values were reported
in the literature for pure cultures, the final PHA
concentration was quite high (0.54 g PHAgVSS�1). This
aspect still deserves attention in order to maximize the
Page 10
ARTICLE IN PRESSD. Dionisi et al. / Water Research 39 (2005) 2076–20842084
PHA content of biomasses and decrease extraction and
recovery costs.
Acknowledgments
This work was funded by the National Institute for
Safety and Health (Italy) under research contract B/13/
DIPIA/00. One of the authors (FC) is pleased to
acknowledge the financial support of the Spanish
Ministry of Education, Culture and Sports, making his
research stay at the University of Rome ‘‘La Sapienza’’
(Italy) possible.
References
Ahmad, A.L., Ismail, S., Bhatia, S., 2003. Water recycling from
palm oil mill effluent using membrane technology. Desali-
nation 157 (1–3), 87–95.
Andreozzi, R., Longo, G., Majone, M., Modesti, G., 1998.
Integrated treatment of olive oil mill effluents (OME): study
of ozonation coupled with anaerobic digestion. Water Res.
32 (8), 2357–2364.
Angelidaki, I., Ahring, B.K., 1997. Codigestion of olive oil mill
wastewaters with manure, household waste or sewage
sludge. Biodegradation 8 (4), 221–226.
APHA, AWWA, WPCF, 1992. Standard Methods for the
examination of water and wastewater, 18th ed. APHA,
Washington.
Beccari, M., Bonemazzi, F., Majone, M., Riccardi, C., 1996.
Interaction between acidogenesis and methanogenesis in the
anaerobic treatment of olive oil mill effluents. Water Res. 30
(1), 183–189.
Beccari, M., Carucci, G., Majone, M., Torrisi, L., 1999. Role of
lipids and phenolic compounds in the anaerobic treatment
of olive oil mill effluents. Environ. Technol. 20, 105–110.
Beccari, M., Petrangeli Papini, M., Majone, M., Torrisi, L.,
2001. Enhancement of anaerobic treatability of olive oil mill
effluents by addition of Ca(OH)2 and bentonite without
intermediate solid–liquid separation. Water Sci. Technol. 43
(11), 275–282.
Beccari, M., Carucci, G., Lanz, A.M., Majone, M., Petrangeli
Papini, M., 2002. Removal of molecular weight fractions of
COD and phenolic compounds in an integrated treatment of
olive oil mill effluents. Biodegradation 13, 401–410.
Borja, R., Banks, C.J., 1995. Comparison of an anaerobic filter
and an anaerobic fluidized bed reactors treating palm oil
mill effluent. Process Biochem. 30 (6), 511–521.
Carrasco, F., Dionisi, D., Majone, M., Petrangeli Papini, M.,
Carucci, G., Beccari, M., 2004. Los polihidroxialcanoatos:
plasticos biodegradables producidos por microorganismos.
Ing. Quım. (Madrid) 36 (414), 244–251.
Chin, K.K., Lee, S.W., Mohammad, H.H., 1996. A study of
palm oil mill effluent using a pond system. Water Sci.
Technol. 34 (11), 119–123.
Choi, J., Lee, S.Y., 2000. Economic considerations in the
production of poly(3-hydroxybutirate-co-hydroxyvalerate)
by bacterial fermentation. Appl. Microbiol. Biotechnol. 53,
646–649.
Cliffe, K.R., Patumsawad, S., 2001. Co-combustion of waste
from olive oil production with coal in a fluidised bed. Waste
Manage. 21 (1), 49–53.
Dionisi, D., Majone, M., Papa, V., Beccari, M., 2004.
Biodegradable polymers from organic acids by using
activated sludge enriched by aerobic periodic feeding.
Biotechnol. Bioeng. 85 (6), 569–579.
Galiatsatou, P., Metaxas, M., Arapoglou, D., Kasselouri-
Rigopoulou, V., 2002. Treatment of olive oil mill waste
water with activated carbons from agricultural by-products.
Waste Manage. 22 (7), 803–812.
Hassan, M.A., Shirai, Y., Kusubayashi, N., Abdul Karim,
M.I., Nakanishi, K., Hashimoto, K., 1996. Effect of organic
acids profiles during anaerobic treatment of palm oil mill
effluent on the production of PHA by Rhodobacter
sphaeroides. J. Ferment. Bioeng. 82 (2), 151–156.
Hassan, M.A., Shirai, Y., Kusubayashi, N., Abdul Karim,
M.I., Nakanishi, K., Hashimoto, K., 1997a. The production
of polyhydroxyalcanoate from anaerobically treated palm
oil mill effluent by Rhodobacter spheroides. J. Ferment.
Bioeng. 83 (5), 485–488.
Hassan, M.A., Shirai, Y., Umeki, H., Abdul Karim, M.I.,
Nakanishi, K., Hashimoto, K., 1997b. Acetic acid separa-
tion from anaerobically treated palm oil mill effluent for the
production of polyhydroxyalcanoate by Alcaligenes eutru-
phus. Biosci. Biotechnol. Biochem. 61, 1465–1468.
Lee, S.Y., 1996. Bacterial polyhydroxyalcanoates. Biotechnol.
Bioeng. 49 (1), 1–14.
Meesters, K.H.P., 1998. Production of poly(3-hydroxyalcano-
ates) from waste streams. Report of the Technical Uni-
versity of Delft, Delft (The Netherlands).
Reis, M.A.M., Serafim, L.S., Lemos, P.C., Ramos, A.M.,
Aguiar, F.R., Van Loosdrecht, M.C.M., 2003. Production
of polyhydroxyalkanoates by mixed microbial cultures.
Bioprocess Biosystems Eng. 25 (6), 377–385.
Saatci, Y., Arslan, E.I., Konar, V., 2003. Removal of total
lipids and fatty acids from sunflower oil factory effluent
UASB reactor. Biores. Technol. 87 (3), 269–272.
Salehizadeh, H., van Loosdrecht, M.C.M., 2004. Production of
polyhydroxyalcanoates by mixed culture: recent trends and
biotechnological importance. Biotechnol. Adv. 22, 261–279.
van Aalst-van Leeuwen, M.A., Pot, M.A., van Loosdrecht,
M.C.M., Heijnen, J.J., 1997. Kinetic modeling of poly(b-hydroxybutyrate) production and consumption by Para-
coccus pantotrophus under dynamic substrate supply.
Biotechnol. Bioeng. 55 (5), 773–782.
Yu, J., 2001. Production of PHA from starchy wastewater via
organic acids. J. Biotechnol. 86, 105–112.