Aplinkos tyrimai, inžinerija ir vadyba, 2005.Nr.3(33), P.73-79 ISSN 1392-1649 Environmental research, engineering and management, 2005.No.3(33), P.73-79 Experience, reviews, discussions _______________________________________________________________________________ Oil Spill Monitoring in the Southeastern Baltic Sea A. G. Kostianoy 1 , S. A. Lebedev 2, 3 , K. Ts. Litovchenko 4 , S. V. Stanichny 5 , O. E. Pichuzhkina 6 1 P.P. Shirshov Institute of Oceanology, Russian Academy of Sciences 2 Geophysical Center, Russian Academy of Sciences 3 State Oceanographic Institute, Russia 4 Russian Research Institute of Space Device Engineering 5 Marine Hydrophysical Institute, National Academy of Sciences of the Ukraine, 6 LUKOIL-Kaliningradmorneft, Russia, (received in April, 2005; accepted in September, 2005) Increased shipping activities in the Baltic Sea, including oil transport and oil handled in harbors and new oil terminals, have a number of negative impacts on the marine environment, ecosystems and coastal zone. In June 2003 LUKOIL-Kaliningradmorneft initiated a pilot project, aimed to the complex monitoring of the southeastern Baltic Sea, in connection with the beginning of oil production at the continental shelf of Russia in March 2004. A monitoring was performed on the base of satellite remote sensing of oil spills, SST, sea level, chlorophyll concentration, mesoscale dynamics, wind and waves. A number of oil spills has been detected. Keywords: Baltic Sea, satellite monitoring, marine environment, oil spills and pollution, SAR imagery. 1. Introduction In recent years a number of new oil terminals have been built in the Baltic Sea area, resulting in increased transport of oil by ships and, consequently, an increased risk of accidents (Fig.1, Table 1). Transportation is a reason of 45 % of the oil in the sea while an offshore production is a source of only 2 % of the oil pollution in the World Ocean. In the Baltic Sea about 2 000 large ships and tankers are at sea every day. According to Global Marine Oil Pollution Information Gateway (2004) major oil spills in the region in 1977 - 2002 resulted from the following ship accidents: Tsesis (1977, off Nynäshamn, Sweden. Spill: 1 000 tonnes.), Antonio Gramsci (1979, off Ventspils, Latvia. Spill: 5 500 tonnes. New incident in 1985, off Porvoo, Finland. Spill: 580 tonnes.), Jose Marti (1981, off Dalarö, Sweden. Spill: 1 000 tonnes.), Globe Asimi (1982, off Klaipeda, Lithuania. Spill: 16,000 tonnes.), Sivona (1984, in The Sound, Sweden. Spill: 800 tonnes), Volgoneft (1990, off Karlskrona, Sweden. Spill: 1,000 tonnes.), Baltic Carrier (2001, international waters between Denmark and Germany. Spill: 2 700 tonnes.). As concerns oil exploitation at sea and on the coast, offshore operations have been taking place for some years in Polish waters (two jack-up rigs); until recently Germany operated two platforms very close to the coast; in March 2004 Russia started to drill for oil in the waters between the Kaliningrad area (Russian
Transcript
Aplinkos tyrimai, inžinerija ir vadyba, 2005.Nr.3(33), P.73-79 ISSN 1392-1649 Environmental research, engineering and management, 2005.No.3(33), P.73-79
Experience, reviews, discussions _______________________________________________________________________________ Oil Spill Monitoring in the Southeastern Baltic Sea A. G. Kostianoy1, S. A. Lebedev2, 3, K. Ts. Litovchenko4, S. V. Stanichny5, O. E. Pichuzhkina6 1 P.P. Shirshov Institute of Oceanology, Russian Academy of Sciences 2 Geophysical Center, Russian Academy of Sciences 3 State Oceanographic Institute, Russia 4 Russian Research Institute of Space Device Engineering 5 Marine Hydrophysical Institute, National Academy of Sciences of the Ukraine, 6 LUKOIL-Kaliningradmorneft, Russia,
(received in April, 2005; accepted in September, 2005)
Increased shipping activities in the Baltic Sea, including oil transport and oil handled in harbors and
new oil terminals, have a number of negative impacts on the marine environment, ecosystems and coastal zone. In June 2003 LUKOIL-Kaliningradmorneft initiated a pilot project, aimed to the complex monitoring of the southeastern Baltic Sea, in connection with the beginning of oil production at the continental shelf of Russia in March 2004. A monitoring was performed on the base of satellite remote sensing of oil spills, SST, sea level, chlorophyll concentration, mesoscale dynamics, wind and waves. A number of oil spills has been detected.
Keywords: Baltic Sea, satellite monitoring, marine environment, oil spills and pollution, SAR imagery. 1. Introduction
In recent years a number of new oil terminals
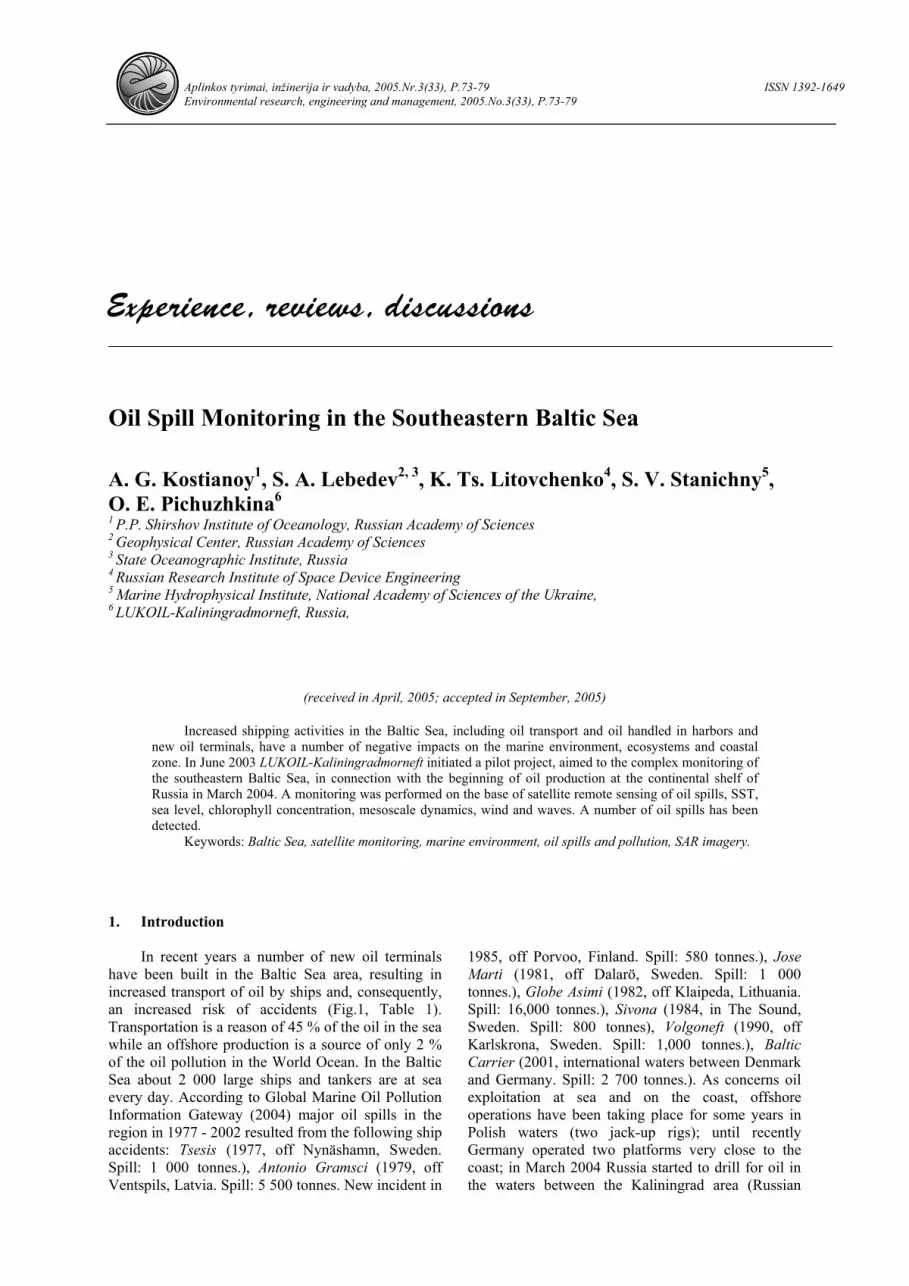
have been built in the Baltic Sea area, resulting in increased transport of oil by ships and, consequently, an increased risk of accidents (Fig.1, Table 1). Transportation is a reason of 45 % of the oil in the sea while an offshore production is a source of only 2 % of the oil pollution in the World Ocean. In the Baltic Sea about 2 000 large ships and tankers are at sea every day. According to Global Marine Oil Pollution Information Gateway (2004) major oil spills in the region in 1977 - 2002 resulted from the following ship accidents: Tsesis (1977, off Nynäshamn, Sweden. Spill: 1 000 tonnes.), Antonio Gramsci (1979, off Ventspils, Latvia. Spill: 5 500 tonnes. New incident in
1985, off Porvoo, Finland. Spill: 580 tonnes.), Jose Marti (1981, off Dalarö, Sweden. Spill: 1 000 tonnes.), Globe Asimi (1982, off Klaipeda, Lithuania. Spill: 16,000 tonnes.), Sivona (1984, in The Sound, Sweden. Spill: 800 tonnes), Volgoneft (1990, off Karlskrona, Sweden. Spill: 1,000 tonnes.), Baltic Carrier (2001, international waters between Denmark and Germany. Spill: 2 700 tonnes.). As concerns oil exploitation at sea and on the coast, offshore operations have been taking place for some years in Polish waters (two jack-up rigs); until recently Germany operated two platforms very close to the coast; in March 2004 Russia started to drill for oil in the waters between the Kaliningrad area (Russian
A. G. Kostianoy, S. A. Lebedev, K. Ts. Litovchenko, S. V. Stanichny, O. E. Pichuzhkina
74
Federation) and Lithuania, as well as there are Latvian plans to drill for oil in the waters between Latvia and Lithuania (Marine Oil Pollution Information Gateway, 2004).
Thus, shipping activities, including oil transport and oil handled in harbors, have major negative impact on the marine environment and coastal zone in the Baltic Sea. Oil and oily residue discharges from ships represent a significant threat to marine ecosystems. These discharges may occur during normal activities or may be accidental or illegal. Oil spills cause the contamination of seawater, shores, and beaches, which may persist for several months and represent a threat to marine resources. One of the main tasks in the ecological monitoring of the Baltic Sea is an operational satellite and aerial detection of
oil spillages, determination of their characteristics, establishment of the pollution sources and forecast of probable trajectories of the oil spill transport (Table 2 and 3). So far as the Baltic Sea ecosystem undergoes growing human-induced impacts, especially associated with an increasing oil transport and production, further research of the links between physical, chemical and biological parameters of the ecosystem, a complex monitoring of the Baltic Sea state, and especially, the oil spills monitoring are of a great importance. Oil spill behavior, modeling, prevention, effects, control and cleanup techniques require supplementary information about a large number of complex physical, chemical and biological processes and phenomena.
10° 15° 20° 25° 30°
10° 15° 20° 25° 30°
55°
60°
65°
55°
60°
65°
S W
E
D
E
N
F I N
L A
N D
ESTONIA
LATVIA
LITHUANIA
POLANDGERMANY
DEN
MAR
KN
O R
W A
Y
RUSSIA
RUSSIA BELARUS
18° 20° 22° 24°
18° 20° 22° 24°
54°
55°
56°
57°
58°
54°
55°
56°
57°
58°
RIGA
Ventspils
Liepaja
Klaipeda
Kaliningrad
Gdansk
Kravtsovskoye ( D-6 )
L A T V I A
L I T H U A N I A
P O L A N D
R U S S I A
(a) (b)
Fig.1. Map of oil spills detected in the Baltic Sea (a) and in the southeastern Baltic Sea (b) in 1989-2002 (HELCOM, 2002). Category 1 (0 ) - <1 m3, category 2 (+ ) - 1 m3 < 10 m3, category 3 (- ) - 10 m3 < 100 m3, category 4 (' ) - >100 m3
Table 1. Oil transportation volumes of certain Baltic oil terminals in 1997, 2000 and 2015 (Rytkönen et al., 2002)
Country / port / terminal 1997 2000 2015 Estonia / Muuga 9.2 17.8 24.0 Finland / Hamina 1.2 1.3 1.5 Finland / Porvoo 13.3 (other 5) 13.6 15.0 Latvia / Riga 1.3 3.0 5.0 Latvia / Ventspils 19.05 26.7 30.0 Latvia / Liepaja – 0.1 0.5 Lithuania / Klaipeda 1.7 5.2 8.0 Lithuania / Butinge – 3.5 8.0 Russia / St. Petersburg 3.5 7.5 10.0 Russia / Primorsk – – 24.0 Russia / Batareinaya – – 6.0 Russia / Kaliningrad 0.3 1.1 2.0
Total (million tons) 54.5 79.8 134.0
Oil Spill Monitoring in the Southeastern Baltic Sea
75
Table 2. Number of flight hours of aerial surveillance on oil spills in the Baltic Sea in 1989-2002 (HELCOM, 2002)
Total number 5513 4815 5273 5171 4785 5511 3553 3474 3680 5002 4833 5230 4837 4864 Table 3. Number of approved oil spills in the Baltic Sea in 1989-2002 (HELCOM, 2002)
Total number 763 424 373 544 461 588 649 478 438 454 488 472 390 345 2. Materials, methods, results and discussion
Since 1993 there has been no more regular aerial
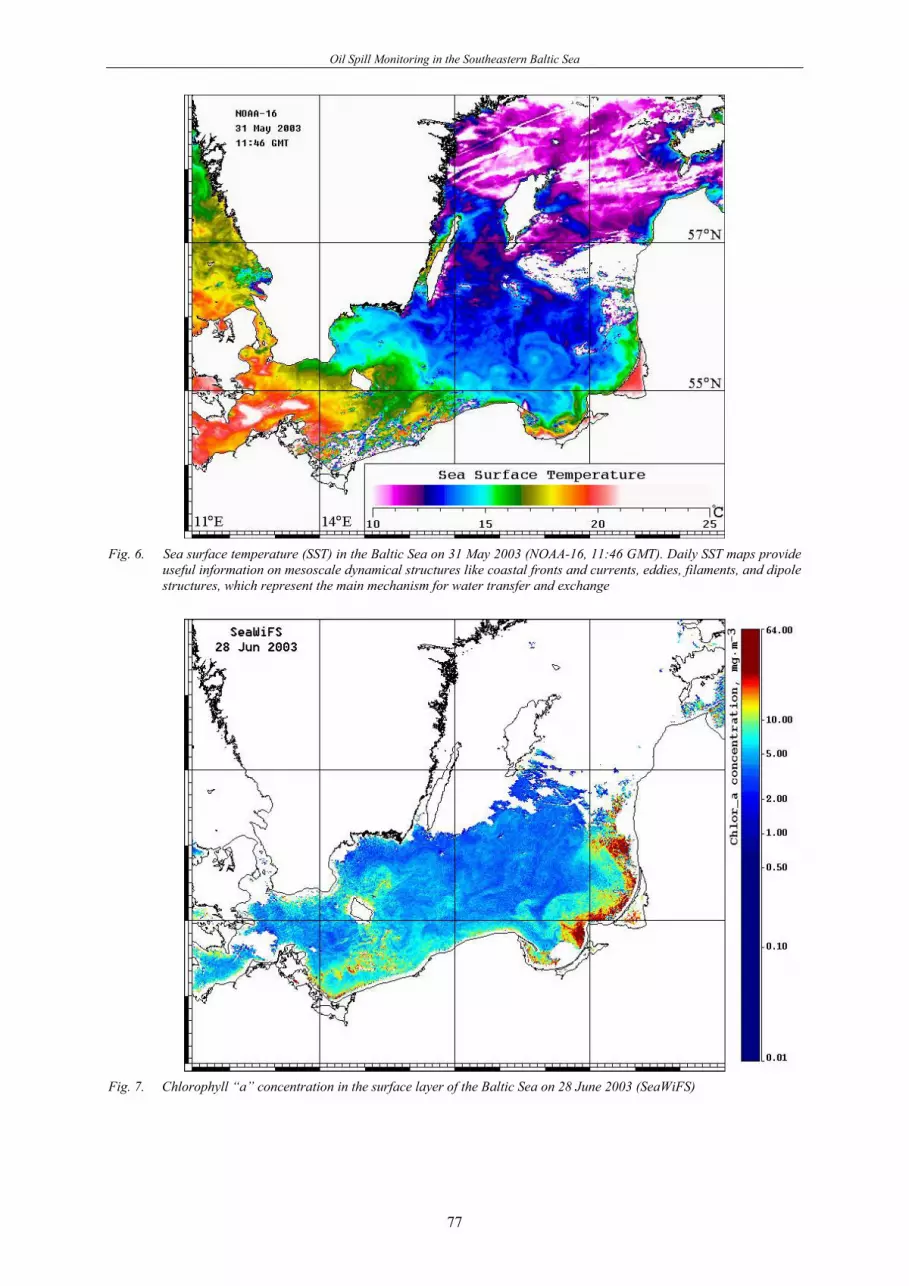
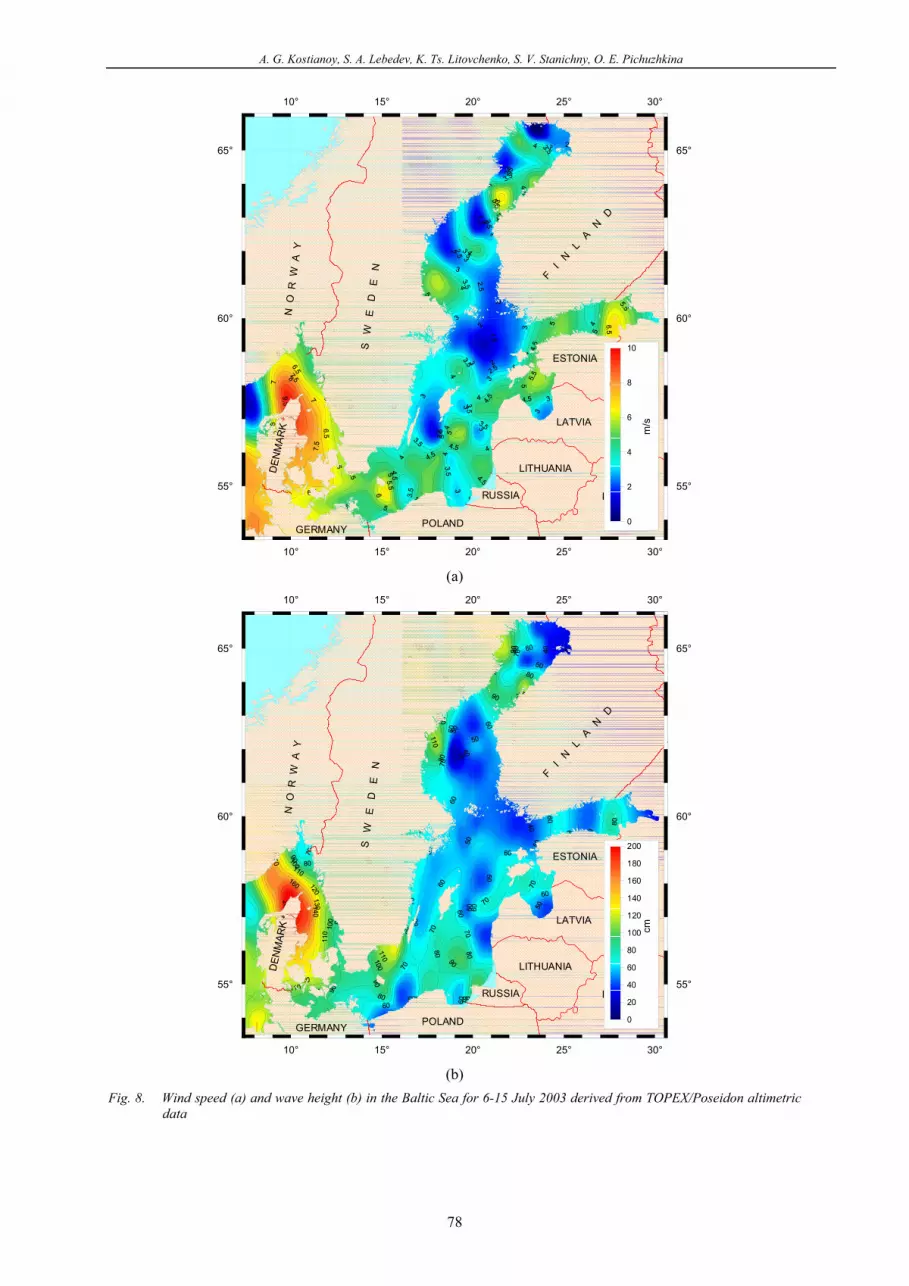
surveillance of the oil spills in the Russian sector of the southeastern Baltic Sea (Table 2 and 3). In June 2003 LUKOIL-Kaliningradmorneft initiated a pilot project, aimed to the complex monitoring of the southeastern Baltic Sea, in connection with the beginning of oil production at the continental shelf of Russia in March 2004. This was a basic motivation for the renewal of the complex ecological research in the southeastern Baltic Sea, including satellite monitoring of oil spills and other parameters of the sea state and mesoscale dynamics. It was performed on the base of satellite remote sensing (AVHRR NOAA, SeaWiFS, MODIS, TOPEX/Poseidon, Jason-1, SAR imagery of ERS-2 and ENVISAT) of SST, sea level, chlorophyll concentration, mesoscale dynamics, wind and waves, and oil spills. The monitoring revealed a number of oil spills of different origin that was detected by the analysis of satellite Synthetic Aperture Radar (SAR) imagery (Fig. 2 - 5), as well as demonstrated the capabilities and advantages of the complex satellite monitoring of the southeastern Baltic Sea. Remote sensing offers a number of different methods for acquiring information on the state of the open sea (ocean) and coastal regions in remote and often inaccessible areas. Scanning radiometers collect sea surface temperature data (Fig. 6) and different optical characteristics of the sea surface (Fig. 7), which provide important information on mesoscale water dynamics, scatterometers collect wind speed and direction information, altimeters measure sea level anomalies, wave height, and identify wind speed (Fig. 8). SAR sensors, sensitive to spatially varying sea surface roughness patterns and modified by oil spills, have an advantage over optical sensors in the oil spill
detection as they can provide data in cloudy conditions and during darkness (night). The original focus of the ERS-1, ERS-2 and ENVISAT missions was in SAR measurements of ocean surface currents, fronts, eddies, internal waves, directional ocean wave spectra, sea floor topography, snow cover and ice sheet dynamics, as well as oil slick monitoring and ship detection (http://envisat.esa.int). For oil spills, complex remote sensing and meteorological data can provide information on the speed, direction and trajectory of oil movement through multi-temporal imaging (movies) and input to drift prediction models, and may assist in operational targeting cleanup and control efforts. All the above mentioned information is required for complex ecological monitoring, offshore engineering activities, operational fisheries surveillance and storm forecasts.
3. Conclusions
ENVISAT SAR provides new capabilities to monitor oil spills, in particular, in the Baltic Sea. Combined with satellite remote sensing (AVHRR NOAA, SeaWiFS, MODIS, TOPEX/Poseidon, Jason-1) of SST, sea level, chlorophyll concentration, mesoscale dynamics, wind and waves, this observational system represents a powerful method for long-term monitoring of ecological state over global to regional scales, as well as smaller areas of particular interest, such as the southeastern Baltic Sea. The growing availability of sea observation data should encourage interest, involvement and investment by the Baltic states authorities with responsibility for the environment, pollution control, meteorology, coastal protection, transport, fisheries and hazard management, and private companies operating in the sea and coastal zone.
A. G. Kostianoy, S. A. Lebedev, K. Ts. Litovchenko, S. V. Stanichny, O. E. Pichuzhkina
76
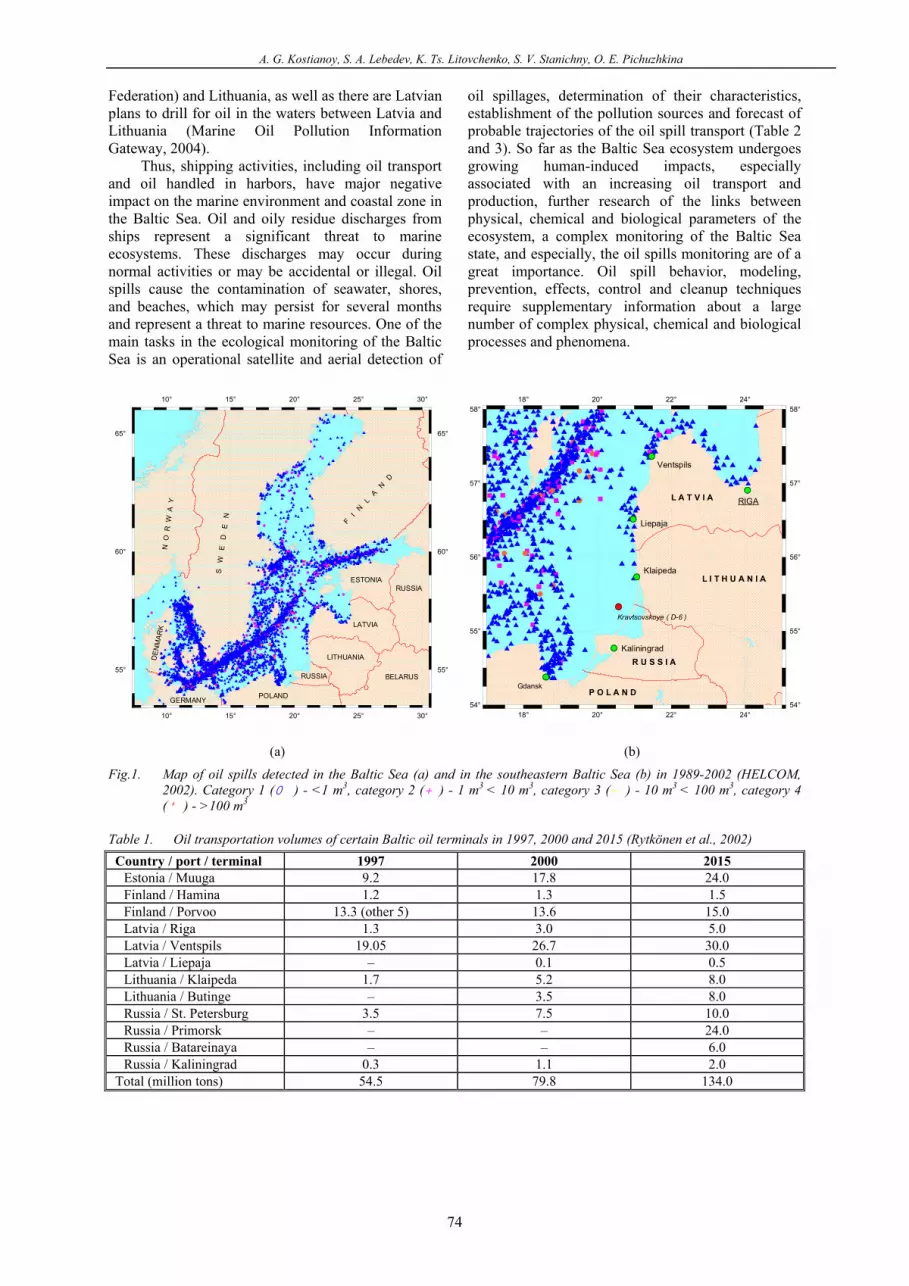
Fig. 2. SAR image of the southeastern Baltic Sea on 5 May
2003 (ENVISAT IMAGE MODE, ENVISAT Catalogue, http://muis-env.esrin.esa.it, ESA). Dark spots in red circles are probably due to oil contamination
Fig. 3. ERS-2 SAR image of the area southward of Gotland Island on 8 June 2003 (ERS-2 Catalogue, http://odisseo.esrin.esa.it/eoli/, ESA). Discharge of oil-products from the ships
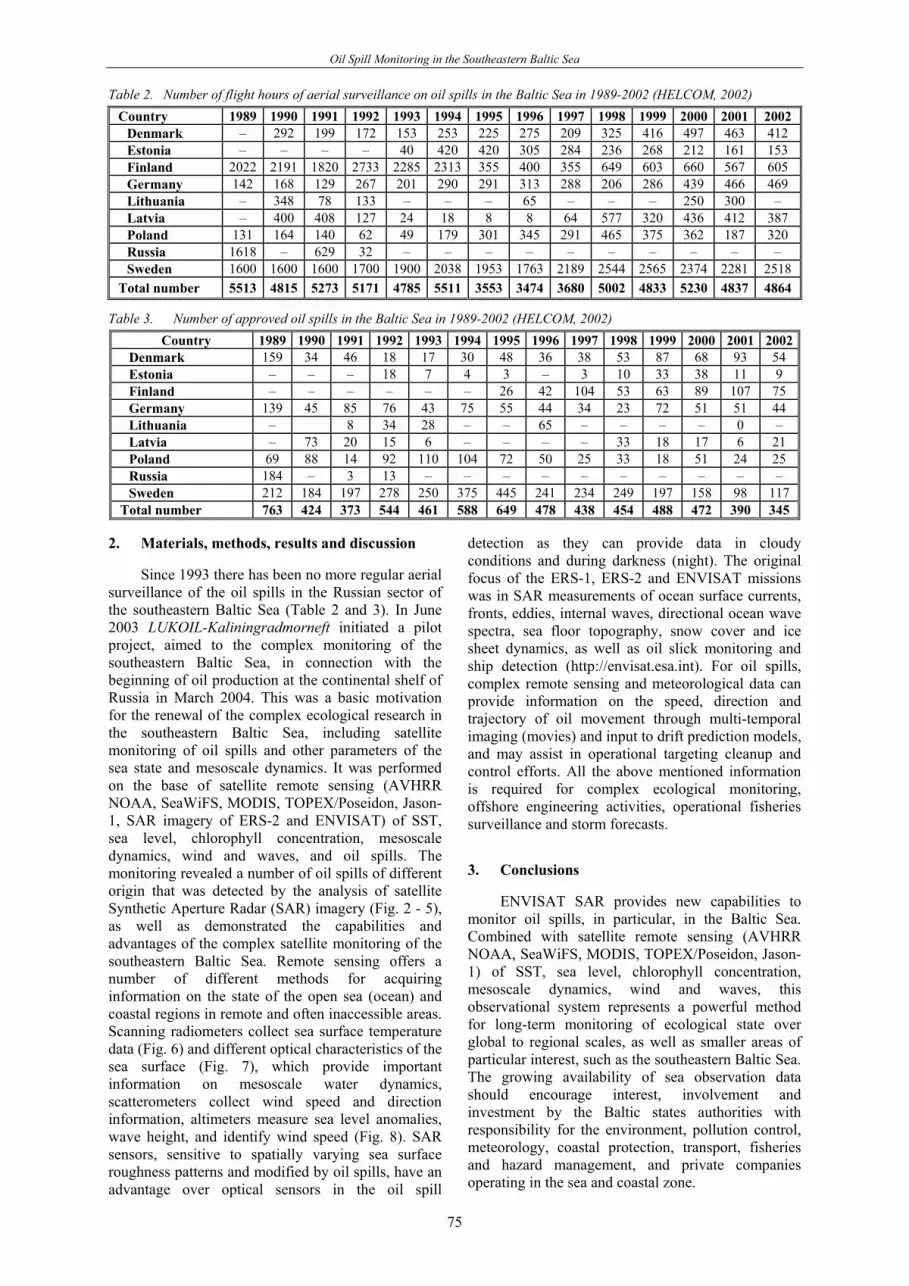
Fig. 4. ERS-2 SAR image of the southeastern Baltic Sea on
27 July 2003 (ERS-2 Catalogue, http://odisseo.esrin.esa.it/eoli/, ESA). Remains of the oil spills detected near Svetlogorsk and Curonian Spit on 15 July 2003
Fig. 5. SAR image of the southeastern Baltic Sea on 15 August 2003 (ENVISAT IMAGE MODE, ENVISAT Catalogue, http://muis-env.esrin.esa.it, ESA). Dark spots represent oil spills
Oil Spill Monitoring in the Southeastern Baltic Sea
77
Fig. 6. Sea surface temperature (SST) in the Baltic Sea on 31 May 2003 (NOAA-16, 11:46 GMT). Daily SST maps provide useful information on mesoscale dynamical structures like coastal fronts and currents, eddies, filaments, and dipole structures, which represent the main mechanism for water transfer and exchange
Fig. 7. Chlorophyll “a” concentration in the surface layer of the Baltic Sea on 28 June 2003 (SeaWiFS)
A. G. Kostianoy, S. A. Lebedev, K. Ts. Litovchenko, S. V. Stanichny, O. E. Pichuzhkina
78
10° 15° 20° 25° 30°
10° 15° 20° 25° 30°
55°
60°
65°
55°
60°
65°
S W
E
D
E N F I
N L
A N
D
ESTONIA
LATVIA
LITHUANIA
POLANDGERMANY
DEN
MAR
KN
O R
W A
Y
RUSSIA
RUSSIA BELARUS
0
2
4
6
8
10
m/s
(a)
10° 15° 20° 25° 30°
10° 15° 20° 25° 30°
55°
60°
65°
55°
60°
65°
S W
E
D
E N F I
N L
A N
D
ESTONIA
LATVIA
LITHUANIA
POLANDGERMANY
DEN
MAR
KN
O R
W A
Y
RUSSIA
RUSSIA BELARUS
0
20
40
60
80
100
120
140
160
180
200
cm
(b)
Fig. 8. Wind speed (a) and wave height (b) in the Baltic Sea for 6-15 July 2003 derived from TOPEX/Poseidon altimetric data
Oil Spill Monitoring in the Southeastern Baltic Sea
79
Acknowledgements
This work was initiated and supported by LUKOIL-Kaliningradmorneft. References 1. Global Marine Oil Pollution Information Gateway,
Sukselainen J., 2002. Statistical Analyses of the Baltic Maritime Traffic. Finnish Environment Institute and Ministry of Traffic and Communications. Research report No.VAL34-012344, 153 pp.
A. G. Kostianoy, P.P. Shirshov Institute of Oceanology, Russian Academy of Sciences. Address: Nakhimovsky Pr. 36, Moscow, 117997, Russia. E-mail: [email protected] S. A. Lebedev, Geophysical Center, Russian Academy of Sciences. Address: Molodezhnaya str. 3, Moscow, 117236, Russia
S. A. Lebedev, State Oceanographic Institute. Address: Kropotkinsky Per. 6, Moscow,
119838, Russia.
K. Ts. Litovchenko, Russian Research Institute of Space Device Engineering. Address: Aviamotornaya str. 53, Moscow,
111250, Russia. S. V. Stanichny, Marine Hydrophysical Institute, National Academy of Sciences of the Ukraine. Address: Kapitanskaya str. 2, Sevastopol, 335000, Ukraine.
O. E. Pichuzhkina LUKOIL-Kaliningradmorneft. Address: Kievskaya str. 23, Kaliningrad, 236039, Russia.
Naftos išsiliejimo stebėsena Pietrytinėje Baltijos jūros dalyje A. G. Kostianoy1, S. A. Lebedev2, 3, K. Ts. Litovchenko4, S. V. Stanichny5, O. E. Pichuzhkina6 1 P.P. Širšovo okeanologijos institutas, Rusijos mokslų akademija 2 Geofizikos centras, Rusijos mokslų akademija 3 Valstybinis okeanografijos institutas, Rusija 4 Rusijos erdvinių prietaisų inžinerijos tyrimų institutas 5 Jūros hidrofizikos institutas, Ukrainos nacionalinė mokslų akademija 6 LUKOIL-Kaliningradmorneft, Rusija
(gauta 2005 m. balandžio mėn.; atiduota spaudai 2005 m. rugsėjo mėn.)
Suintensyvėjusi laivininkystė Baltijos jūroje, naftos transportavimas bei jos tvarkymas
uostuose ir naujuose naftos terminaluose, daro neigiamą įtaką jūros aplinkai, ekosistemoms bei pakrantės zonai. 2003 m. birželio mėn. LUKOIL-Kaliningradmorneft pradėjo pilotinį projektą, kuriuo buvo siekiama kompleksiškai stebėti Pietrytinę Baltijos jūros dalį, atsižvelgiant į naftos gamybos kontinentiniame Rusijos šelfe pradžią 2004 m. gegužės mėn. Stebėsena buvo atliekama remiantis palydoviniais naftos išsiliejimų stebėjimais, duomenimis apie jūros lygį, chlorofilo koncentracijas, mezoskalės dinamiką, vėją ir bangas. Buvo nustatyta eilė naftos išsiliejimo atvejų.