Chemical Engineering Science 56 (2001) 5801–5814 www.elsevier.com/locate/ces Natural gas production from hydrate decomposition by depressurization Chuang Ji a; b , Goodarz Ahmadi a; b , Duane H. Smith a ; ∗ a National Energy Technology Laboratory, US Department of Energy, Morgantown, WV 26507-0880, USA b Department of Mechanical and Aeronautical Engineering, Clarkson University, Potsdam, NY 13699-5725, USA Received 10 March 2000; received in revised form 23 October 2000; accepted 24 April 2001 Abstract This paper presents a parametric study of natural gas production from the decomposition of methane hydrate in a conned reservoir by a depressurizing well. The one-dimensional linearized model suggested by Makogon is used in the analysis. For dierent well pressures and reservoir temperatures, distributions of temperature and pressure in the porous layer of methane hydrate and in the gas region are evaluated. The distance of the decomposition front from the well and the natural gas output as functions of time are also computed. Time evolutions of the resulting temperature and pressure proles in the hydrate reservoir under various conditions are presented. Eects of variations in reservoir porosity and zone permeability are also studied. It is shown that the gas production rate is a sensitive function of well pressure, reservoir temperature and zone permeability. ? 2001 Elsevier Science Ltd. All rights reserved. Keywords: Hydrate dissociation; Natural gas production; Depressurizing well; Hydrate reservoir 1. Introduction Natural gas hydrates are solid molecular compounds of water with natural gas that are formed under certain thermodynamic conditions. World reserves of natural gas trapped in the hydrate state have been estimated to be several times the known reserves of conventional natural gas (Makogon, 1997). Therefore, developing methods for commercial production of natural gas from hydrates is attracting considerable attention. All known methods of decomposition of hydrates are based on shifting the thermodynamic equilibrium in a three-phase system (water–hydrate–gas), which can be achieved by • increasing the system temperature above the tempera- ture of hydrate formation at a specied pressure; • decreasing the system pressure below the pressure of hydrate formation at a specied temperature; or ∗ Corresponding author. Tel.: +1-304-285-4799; fax: +1-304- 285-4469. E-mail address: [email protected] (D. H. Smith). • injecting inhibitors such as methanol to shift the pressure–temperature equilibrium. The case that a well is drilled into a hydrate reservoir and initiates a depressurization is considered in this study. Extensive reviews of hydrate formation and decompo- sition processes were reported by Makogon (1997) and Sloan (1998). Thermodynamic modeling of the hydrate decomposition process by depressurization has been stud- ied by a number of authors. Assuming that the process of hydrate decomposition by a pressure decrease is anal- ogous to the process of solid melting, Makogon (1974, 1997) used the classical Stefan’s problem for melting to describe the process of hydrate decomposition. The lin- earized governing equations for the movement of natural gas in a porous medium coupled with heat transfer were solved, and self-similar solutions for the pressure distri- butions were obtained. The release of water during the hydrate decomposition, however, was neglected in this model. Verigin, Khabibullin, and Khalikov (1980) considered the eect of water ow and developed a more accurate model. In this model the gas and water mass balance at 0009-2509/01/$ - see front matter ? 2001 Elsevier Science Ltd. All rights reserved. PII:S0009-2509(01)00265-2
Transcript
Chemical Engineering Science 56 (2001) 5801–5814www.elsevier.com/locate/ces
Natural gas production from hydrate decompositionby depressurization
Chuang Jia;b, Goodarz Ahmadia;b, Duane H. Smitha ; ∗aNational Energy Technology Laboratory, US Department of Energy, Morgantown, WV 26507-0880, USA
bDepartment of Mechanical and Aeronautical Engineering, Clarkson University, Potsdam, NY 13699-5725, USA
Received 10 March 2000; received in revised form 23 October 2000; accepted 24 April 2001
Abstract
This paper presents a parametric study of natural gas production from the decomposition of methane hydrate in a con3nedreservoir by a depressurizing well. The one-dimensional linearized model suggested by Makogon is used in the analysis. Fordi7erent well pressures and reservoir temperatures, distributions of temperature and pressure in the porous layer of methane hydrateand in the gas region are evaluated. The distance of the decomposition front from the well and the natural gas output as functionsof time are also computed. Time evolutions of the resulting temperature and pressure pro3les in the hydrate reservoir under variousconditions are presented. E7ects of variations in reservoir porosity and zone permeability are also studied. It is shown that the gasproduction rate is a sensitive function of well pressure, reservoir temperature and zone permeability. ? 2001 Elsevier Science Ltd.All rights reserved.
Keywords: Hydrate dissociation; Natural gas production; Depressurizing well; Hydrate reservoir
1. Introduction
Natural gas hydrates are solid molecular compoundsof water with natural gas that are formed under certainthermodynamic conditions. World reserves of natural gastrapped in the hydrate state have been estimated to beseveral times the known reserves of conventional naturalgas (Makogon, 1997). Therefore, developing methods forcommercial production of natural gas from hydrates isattracting considerable attention.All known methods of decomposition of hydrates are
based on shifting the thermodynamic equilibrium in athree-phase system (water–hydrate–gas), which can beachieved by
• increasing the system temperature above the tempera-ture of hydrate formation at a speci3ed pressure;
• decreasing the system pressure below the pressure ofhydrate formation at a speci3ed temperature; or
∗ Corresponding author. Tel.: +1-304-285-4799; fax: +1-304-285-4469.E-mail address: [email protected] (D. H. Smith).
• injecting inhibitors such as methanol to shift thepressure–temperature equilibrium.
The case that a well is drilled into a hydrate reservoir andinitiates a depressurization is considered in this study.Extensive reviews of hydrate formation and decompo-
sition processes were reported by Makogon (1997) andSloan (1998). Thermodynamic modeling of the hydratedecomposition process by depressurization has been stud-ied by a number of authors. Assuming that the processof hydrate decomposition by a pressure decrease is anal-ogous to the process of solid melting, Makogon (1974,1997) used the classical Stefan’s problem for melting todescribe the process of hydrate decomposition. The lin-earized governing equations for the movement of naturalgas in a porous medium coupled with heat transfer weresolved, and self-similar solutions for the pressure distri-butions were obtained. The release of water during thehydrate decomposition, however, was neglected in thismodel.Verigin, Khabibullin, and Khalikov (1980) considered
the e7ect of water Fow and developed a more accuratemodel. In this model the gas and water mass balance at
0009-2509/01/$ - see front matter ? 2001 Elsevier Science Ltd. All rights reserved.PII: S 0009-2509(01)00265-2
5802 C. Ji et al. / Chemical Engineering Science 56 (2001) 5801–5814
the surface of decomposition were considered separately.The water produced from the hydrate dissociation wasassumed to be stationary and not to a7ect the Fow ofnatural gas. The change of temperature of the hydratelayer during the movement of natural gas, however, wasnot considered in these earlier models.Holder, Angert, and Godbole (1982) considered the
variation of temperature during the hydrate decomposi-tion in their study. They used the conduction heat transferequation for evaluating the temperature distribution in ahydrate layer. The continuity equation was used to de-scribe the natural gas Fow, in which the pressure gradi-ent and the gas Fow velocity were connected by Darcy’slaw. An empirical formula was used to calculate the dis-sociation enthalpy for hydrates. The movement velocityof the surface of decomposition, which reFected the rateof hydrate dissociation at the surface, was determined bythe magnitude of the dissociation enthalpy and the tem-perature gradient in the hydrate layer.Burshears, O’Brien, and Malone (1986) extended the
model of Holder et al. (1982) and considered the inFu-ence of water transport in the layer, in addition to thenatural gas Fow. They also included the e7ect of waterthat is produced by the dissociated hydrate. However, theconnective heat transfer in the area where gas and watercoexist was not considered. Selim and Sloan (1989) con-sidered the convective-conductive heat transfer in theirone-dimensional model. Under the assumption that thewater in the reservoir remained motionless and the welltemperature was kept constant, they obtained an analyt-ical expression for the temperature distribution in thereservoir.Kamath (1983) used a modi3ed Clausius–Clapeyron
equation to obtain the enthalpy of dissociation for hy-drates of di7erent gases. He studied the process of hy-drate dissociation by heating. Hot water was used in theexperiment, and the results showed that the rate of heattransfer and the rate of hydrate dissociation were powerlaw functions of the temperature di7erence. This researchalso revealed additional details about the process of heattransfer at the hydrate dissociation interface. Recent stud-ies on geological aspects of hydrates were reported inAGU (1999).Makogon (1997) summarized the study of Bondarev
and Cherskiy, where the e7ects of heat transfer in theporous medium were included. The energy equation wasused to describe the thermal condition of natural gas inthe porous layer. The conductive and convective heattransfer, as well as the e7ects of the throttling processwere included. Makogon (1997) reported analytical ex-pressions for the one-dimensional temperature and pres-sure pro3les that were obtained after linearization of thegoverning equations.Lysne (1994) studied the water and gas Fows during
the dissociation of hydrate in a pipe. Tsypkin (2000) alsodescribed the movement of water and gas in the reser-
voir using a multiphase one-dimensional model. He ob-tained similarity solutions for temperature and pressuredistributions by a perturbation method. Masuda et al.(1999) treated the process of hydrate dissociation as aKim, Bishnoi, Heidemann, and Rizvi (1987) kinetic pro-cess. In this model the rate of dissociation is related tothe di7erence between the equilibrium pressure and gaspressure. Their numerical results were in agreement withtheir experimental data. Moridis, Apps, Pruess, and Myer(1998) added a module for hydrate dissociation into theTOUGH2 general-purpose reservoir simulator. The Fowof gas and water were considered and the conductive–convective heat transfer equation was used.Durgut and Parlaktuna (1996) simulated natural gas
production by hot water injection into the hydrate reser-voir. Their developed two-dimensional model includedheat conduction and convection, and both water and gasFows. More recently Swinkels and Drenth (1999) stud-ied the behavior of a hydrate-capped gas reservoir using athree-dimensional thermal reservoir simulator. They con-cluded that the simulation could provide insight into theprocess and for economical evaluation of production sce-narios. They also noted that the gas production from thehydrate cap might become thermally limited.In the present work we are concerned with the follow-
ing questions:
• Can natural gas be produced by depressurizationthrough drilling a well into a hydrate reservoir?
• What are the parameters that control the natural gasproduction rate? In particular, is the gas productionthermally controlled?
We used the combined models of Verigin et al. (1980)and Bondarev and Cherskiy as reported by Makogon(1997). In this model, the Fuid energy equation is usedto describe the temperature and pressure distributions ofthe natural gas in the porous layer. The conductive andconvective heat transfer, as well as the e7ects of the throt-tling process were also included. Assuming the hydratelayer also contained pressurized natural gas, Makogon(1997) linearized the governing equations and obtaineda set of self-similar solutions for temperature and pres-sure distributions in the reservoir. The results lead to asystem of coupled algebraic equations for the location ofthe decomposition front, and the temperature and pres-sure at the front. The numerical simulation of the results,however, has not appeared in the literature (Makogon,1998). In the present work, the corresponding system ofalgebraic equations (with minor corrections) is solved byan iterative scheme. For several well pressures and reser-voir temperatures, numerical results for time evolutionof pressure and temperature pro3les in the hydrate reser-voir, as well the location of the front and the natural gasproduction rate are obtained. The sensitivity of the nat-ural gas production from hydrate by depressurization to
C. Ji et al. / Chemical Engineering Science 56 (2001) 5801–5814 5803
variations of reservoir parameters is studied. In particu-lar, e7ects of reservoir porosity and permeability in boththe gas and the hydrate regions on gas production rate andpressure and temperature distributions across the reser-voir are studied. The results are presented in graphicalform and discussed.
2. Hydrate decomposition model
In this study the decomposition of methane hydrate ina reservoir due to depressurization is considered. Chem-ical reaction of methane with water to from hydrate isrepresented by
(CH4)gas + 6(H2O)water ↔ (CH4 • 6H2O)solid :
When the pressure decreases or the temperature rises, thereaction reverses and the hydrate decomposes into CH4
and water.Suppose there is a large pressurized methane hy-
drate reservoir underground. It is assumed that solidhydrate and natural gas exist in the porous layer atthe reservoir pressure Pe and reservoir temperature Te.Hydrate is stable at this pressure and temperature atthe initial time. When a well is drilled into the reser-voir, the pressure in the well drops to a certain valuePG ¡PD ¡Pe, where PD is the decomposition pres-sure of the hydrate at the dissociation temperature, TD.At this moment the hydrate near the well becomes un-stable and begins to decompose into natural gas andwater. The process of hydrate decomposition then ex-pands outward with time. It is assumed that the hydratedecomposition in a porous medium does not occur inthe entire volume, but in a certain narrow region whichcan be treated as a surface, the so-called decompositionfront. This moving front separates the volume of the
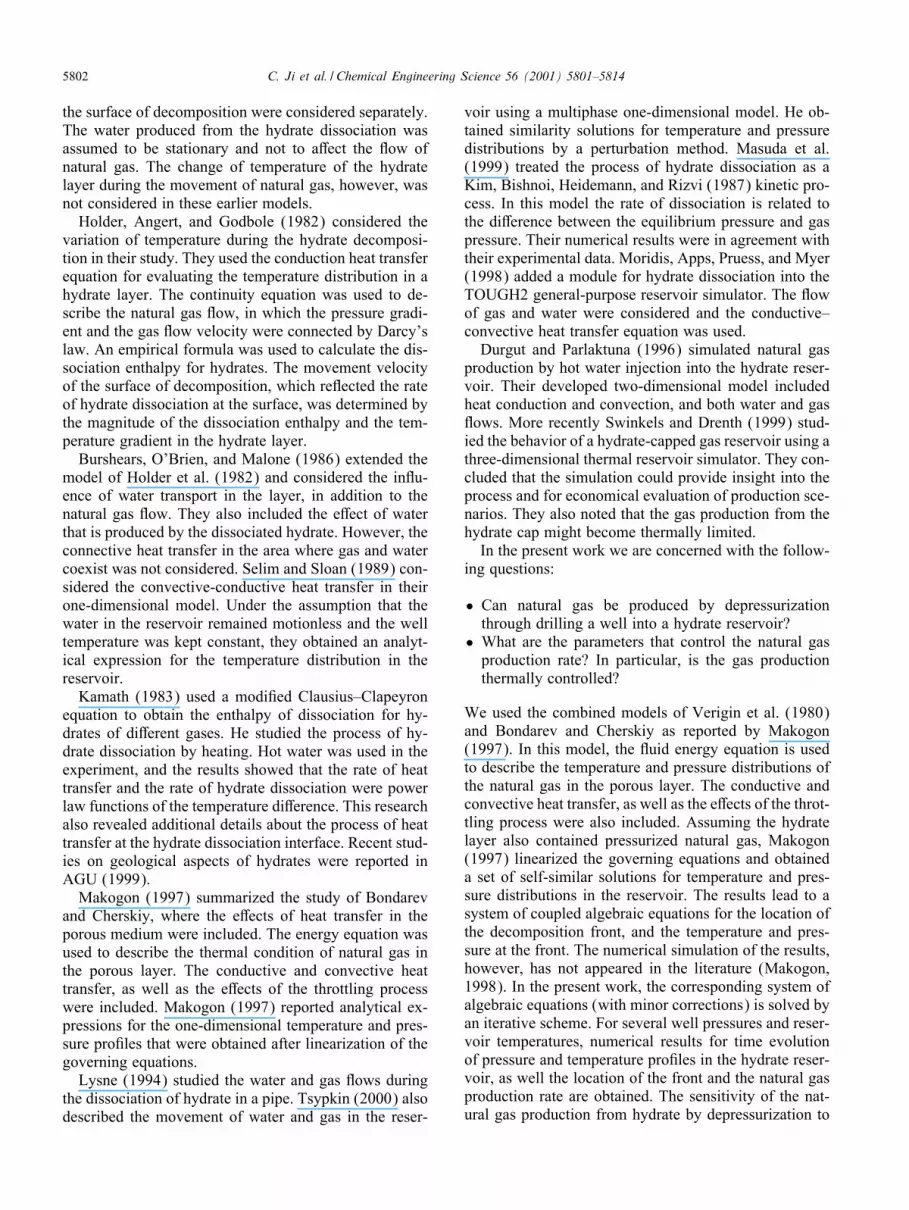
Fig. 1. Schematics of the hydrate reservoir for the one-dimensional model.
reservoir into two zones with di7erent phases. In thenear-well zone only natural gas and water exist, while inthe zone further away from the well only the solid hydrateand natural gas exist. Pressures and temperatures in thesetwo zones gradually decrease, and the natural gas movestowards the well because of the pressure gradient, whilethe decomposition front moves in the opposite direction.It should be emphasized that the model proposed by
Makogon (1997) and used in this study involves severalimportant assumptions. One is that the pressure and tem-perature at any point on the decomposition front are theequilibrium pressure, PD, and temperature, TD, for dis-sociation of methane hydrate. Furthermore, the hydratereservoir is assumed to be porous and contain natural gas.As the dissociation front moves outward, heat must besupplied to the front because of the endothermic natureof the hydrate decomposition process. Makogon (1997)suggested that heat conduction is negligible when com-pared with convection, and heat must be supplied from thereservoir for dissociation to continue. The other assump-tions are that during hydrate decomposition the front is asource of mass that releases water and methane gas, themovement of water in the porous medium is negligible,and the permeability is constant.
3. Mathematical model
In this section, the mathematical formations suggestedby Makogon (1997) are summarized. Consider a hy-drate reservoir with a well as shown in Fig. 1. For aone-dimensional model the distribution of pressure in thelayer is described using an analog of the classical Ste-fan’s problem for melting:
5804 C. Ji et al. / Chemical Engineering Science 56 (2001) 5801–5814
where
1 = (1− �); (2)
2 = (1− �); (3)
where � is viscosity of gas, kn is gas permeability in zone1 or 2, Pn is the pressure in zone 1 or 2, is porosity,� is the water saturation, and � is the hydrate saturation.In Eq. (1) and in the subsequent analysis, n=1 corre-sponds to the region 0¡x¡l(t), and n=2 to the regionl(t)¡x¡∞, where l(t) is the distance of dissociationfront from the origin (located at the well).The boundary conditions are
P1(0; t)=PG; P2(x; 0)=P2(∞; t)=Pe; (4)
P1(l(t); t)=P2(l(t); t)=PD(TD); (5)
T2(x; 0)=T2(∞; t)=Te; (6)
T1(l(t); t)=T2(l(t); t); (7)
where Pn is pressure in zone 1 or 2, Tn is temperature inzone 1 or 2, PD is pressure at the decomposition front,and TD is temperature at the front. As noted before, it isassumed that PD and TD are the equilibrium pressure andtemperature for dissociation of methane hydrate.The relation between temperature TD and pressure PD
on the decomposition front in terms of the phase equilib-rium between natural gas and hydrate is
log10 PD = a(TD − T0) + b(TD − T0)2 + c; (8)
where T0 is 273:15 K and a; b; c are empirical con-stants that depend on the hydrate composition. Values ofa; b, and c are obtained from the equilibrium pressure–temperature data of methane hydrate (Makogon, 1997).Using the least square 3t method we get:
a=0:0342=K; b=0:0005=K2; c=6:4804;
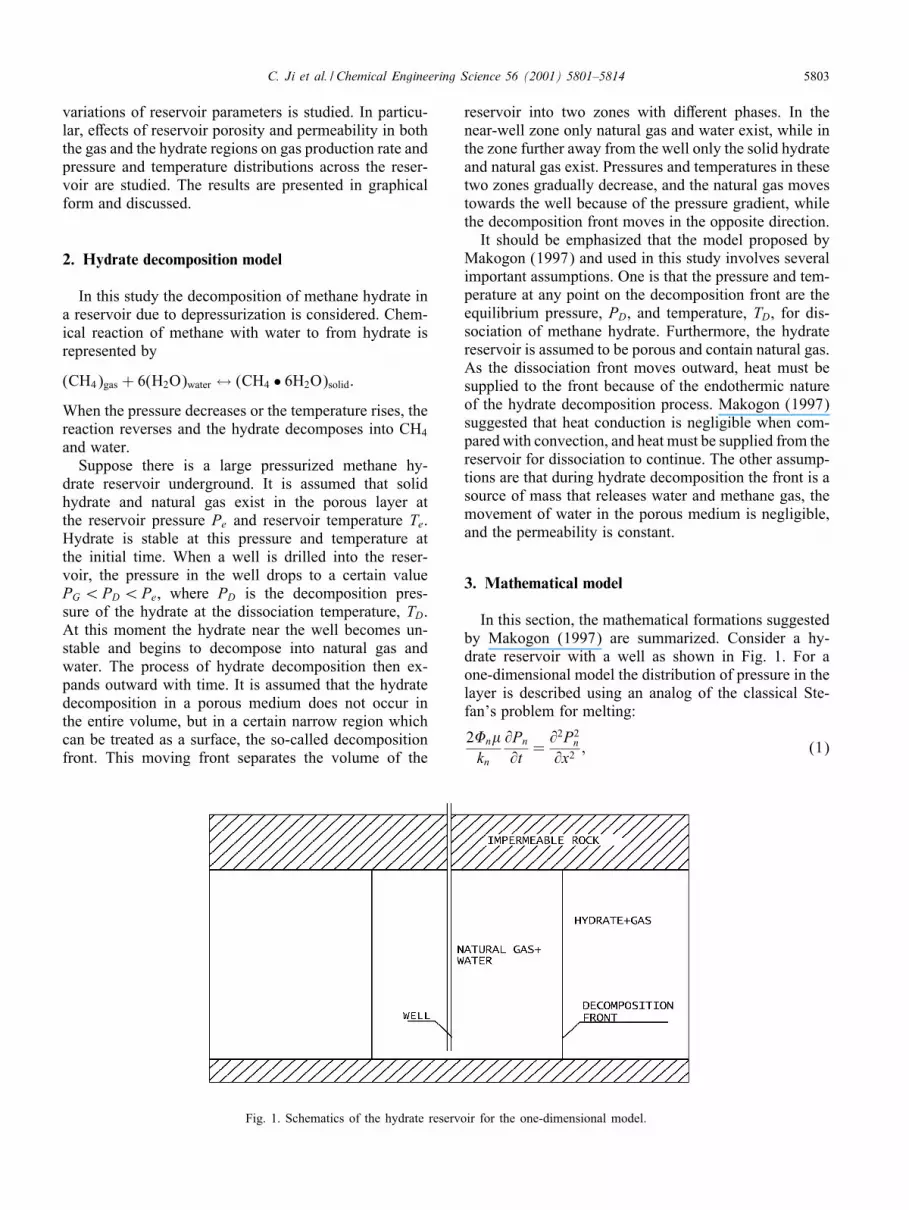
where in Eq. (8) PD is in Pa.Fig. 2 compares the result of prediction of Eq. (8)
with the data obtained by Marshall, Saito, and Kobayashi(1964). It is observed that the 3t is in good agreementwith the data in the range of variables considered.The mass balance for gas at the decomposition front,
l(t), as obtained by Verigin et al. (1980) is
�1�1 − �2�2 =− [���3 − (1− �)�1 + (1− �)�2]dldt;
(9)
where �1 is the density of natural gas in zone 1, �2 is thedensity of natural gas in zone 2, and �3 is the density ofhydrate, � is the mass fraction of gas in methane hydrate.Here �1 and �2 are the velocities of natural gas in zones1 and 2, and � is the mass fraction of gas in the hydrate.
Fig. 2. Equilibrium of pressure–temperature of methane hydrate, andvariations of P–T during the dissociation process for the well pressureof 2 MPa and reservoir pressure of 15 MPa with di7erent reservoirtemperatures.
The densities of the natural gas in zones 1 and 2 at thedecomposition front are the same. i.e.,
�1(l; t)=�2(l; t)=�0PDT0
zP0TD; (10)
where z is the gas compressibility, and �0 is the gas den-sity at atmospheric pressure P0 and temperature T0.Substituting (10) into (9), it follows that:
�1(l; t)− �2(l; t)=−[��
�3P0TD
�0PDT0z − (� − �)
]dldt:
(11)
The mass balance equation for water is given as
�W�=(1− �)�3�; (12)
where �W is the density of water.The temperature 3eld of the gas-saturated layer is
governed by the convective–conductive heat transferequation that includes a temperature change because ofthrottling and adiabatic e7ects. i.e.,
an@2Tn
@x2=
@Tn
@t− cvkn
cn�@Pn
@x
(@Tn
@x− �
@Pn
@x
)− �
ncvcn
@Pn
@t;
(13)
where an is the heat di7usivity, cn is the heat capacity,cv is the constant volume heat capacity of gas, � is thethrottling coeOcient, and � is the adiabatic coeOcient ofthe gas. Note that the Joule–Thompson throttling processis accounted for in Eq. (13).
C. Ji et al. / Chemical Engineering Science 56 (2001) 5801–5814 5805
Eq. (1) may be linearized as
@P2n
@t= n
@2P2n
@x2; (15)
where
1 =k1PG
(1− �)�; 2 =
k2Pe
(1− �)�: (16)
Self-similar solutions of Eq. (15) with boundary condi-tions (4)–(7) as obtained by Makogon (1997) are givenas
P21 =P2
G − (P2G − P2
D)erf !1erf �1
; (17)
P22 =P2
e − (P2e − P2
D)erfc !2erfc �2
; (18)
where
!n=x
2√ nt
; �n=√
"4 n
; (19)
l(t)=√"t: (20)
Here, " is a constant (to be determined) and the errorfunction and complementary error function are de3ned as
erf (#)=2√$
∫ #
0e−�2 d�; erfc(#)=1− erf (#):
(21)
Under the condition that the hydrate reservoir containsnatural gas, neglecting the conductive heat transfer in theporous medium, which is much smaller than the convec-tive heat transfer, Eq. (13) becomes:
@Tn
@t− cvkn
cn�@Pn
@x
(@Tn
@x− �
@Pn
@x
)− �
ncvcn
@Pn
@t=0:
(22)
Solutions to the linearized form of Eq. (22) satisfyingthe boundary conditions (4)–(7) are given as (Makogon,1997),
T1 =TD + A1� [erf!1 − erf�1
+(��B1 − 1
)('1(!1)−'1(�1))
]; (23)
T2 =Te − A2�[erfc !2 +
(��B2 − 1
)'2(!2)
]; (24)
where
'1(#1)=2√$
∫ #1
0
�e−�2
�+ C1e−�2d�;
'2(#2)=2√$
∫ ∞
#2
�e−�2
�+ C2e−�2d�; (25)
A1 =1
2 erf �1P2D − P2
G
PG; A2 =
12 erfc �2
P2e − P2
D
Pe;
(26)
B1 =1cvc1
; B22cvc2
; (27)
C1 =P2D − P2
G
PG
cvc1
12√$ erf �1
k1� 1
;
C2 =P2e − P2
D
Pe
cvc2
12√$ erfc �2
k2� 2
: (28)
The values of pressure PD and temperature TD at the de-composition front, and the constant ", which determinesthe motion of the decomposition front, are still unknownand must be evaluated numerically for given set of con-ditions. From the evaluation of Eq. (24) at the decompo-sition front (i.e. !2 = �2), it followed that:
TD =Te − A2�[erfc �2 +
(��B2 − 1
)'2(�2)
]: (29)
The equilibrium pressure PD and the equilibrium tem-perature TD are related through Eq. (8). SubstituteEqs. (17) and (18) into Eq. (11), we obtain the equationfor determining the constant ". i.e.,
k1P2D − P2
G√$ 1
e−�21
erf �1− k2
P2e − P2
D√$ 2
e−�22
erfc �2=A
√"; (30)
where
A=[��
�3P0TD
�0T0z − (� − �)PD
]�: (31)
Eqs. (8), (29) and (30) are three non-linear coupledequations for determining "; TD and PD. An iterativescheme is used for evaluating the numerical values ofthese parameters. It is important to note that in this modelthe resulting dissociation pressure and temperature are3xed and depend only on the well pressure, and the reser-voir pressure and temperature. The production rate ofmethane gas per unit length of the well is then given as
Q=k1�@P1(0; t)
@x=
k1�P2D − P2
G
PG
1erf�1
12√$ 1t
: (32)
Eq. (32) clearly shows that the well production rate de-creases inversely with the square root of time, and in-creases with reservoir permeability.It should be noted here that the linearization model
suggested by Makogon (1997) and used in here neglectsthe heat conduction in the entire reservoir. Thus, the en-ergy balance at the dissociation front cannot be enforced.While this is a limitation of the approach, many featuresof the hydrate reservoir behavior can be examined usingthe linearized solutions.
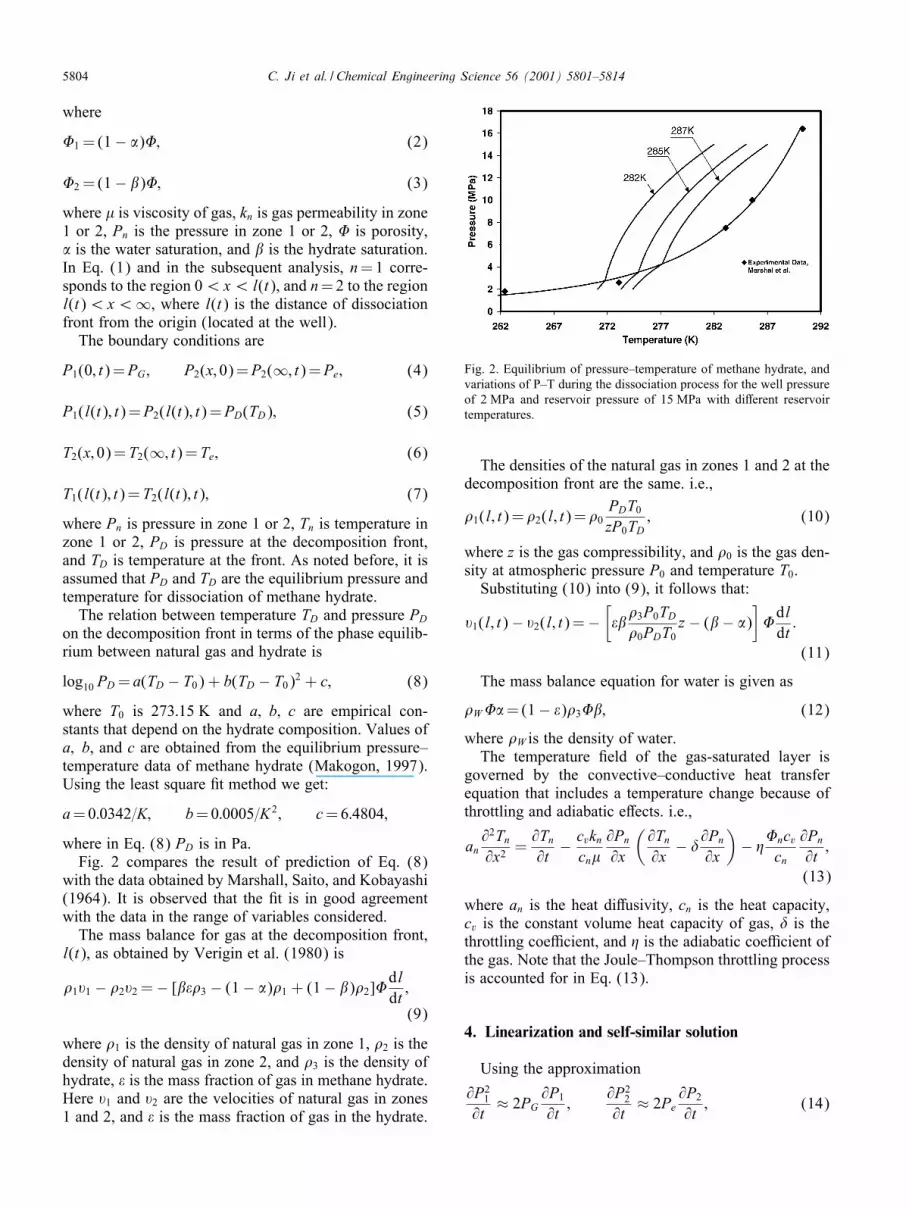
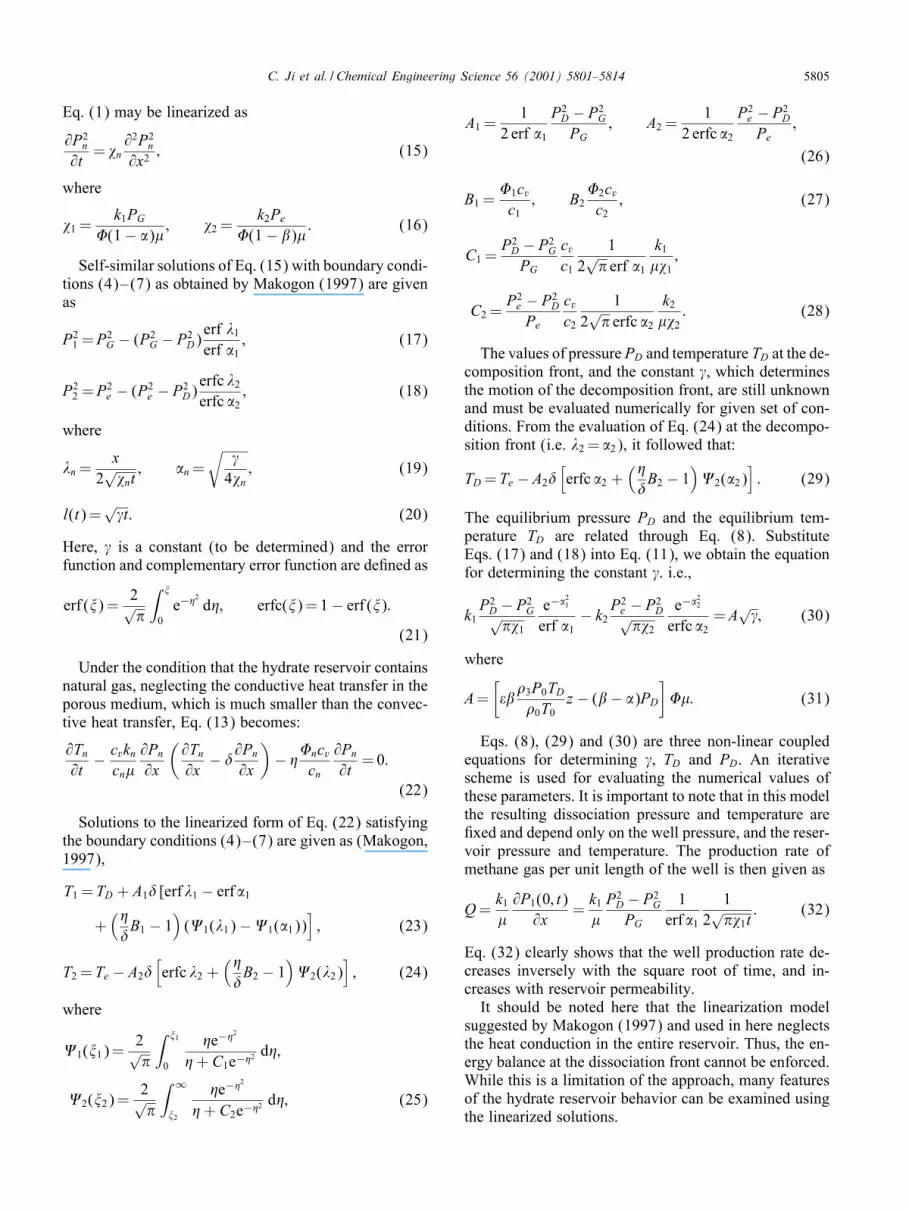
Fig. 3. Time variations of pressure and temperature in the reservoir for a well pressure of 2 MPa and a reservoir temperature of 287 K.
5. Results
This section presents numerical results for the timeevolution of pressure and temperature pro3les in a hy-drate reservoir under various conditions. In addition, timevariations of methane gas production, and location of thedissociation front are also evaluated. A set of paramet-ric study is performed and the sensitivity of natural gasproduction to various reservoir parameters is discussed.Unless stated otherwise, the conditions listed in notationand an initial reservoir pressure of 15 MPa are used inthe simulation.
5.1. Well pressure and reservoir temperature
For di7erent values of well pressure and initial reser-voir temperature, the solutions to Eqs. (8), (29) and (30)are obtained. The resulting values of dissociating temper-ature and pressure at the front and the parameter " withan error bound of 0.1% are listed in Table 1.For given reservoir pressure and temperature and well
pressure, the present linearized one-dimensional modelleads to 3xed values of dissociation-front pressure andtemperature. Table 1 also shows that when the well pres-sure changes, the dissociation pressure and temperaturechange only slightly. The value of parameter ", whichcontrols the movement of the front and the gas produc-tion rate, decreases sharply with increase of well pressure.
The dissociation pressure and temperature are, however,sensitive functions of reservoir temperature. A decreaseof 2 K in the reservoir temperature drops the dissociationpressure by about 0:8 MPa, and reduces parameter " byabout 62%. An additional 5 K drop in the reservoir tem-perature leads to a reduction of dissociation pressure byabout 1:2 MPa and reduces " by a factor of 6.5.For a well pressure of 2 MPa, Fig. 3 shows varia-
tions of reservoir pressure and temperature at di7erenttimes. As noted before, the hydrate reservoir is dividedinto two zones by the decomposition front, and the tem-perature variations in the two zones are quite di7erent.Fig. 3a shows that the temperature decreases graduallyfrom the undisturbed reservoir value far from the frontto the decomposition temperature at the front. The tem-perature gradient in the hydrate zone is largest near thefront. In the gas zone, the temperature varies sharply anddecreases to its minimum value at the well. The temper-ature pro3les in the hydrate and the gas zones are alsoself-similar, and evolve with time as the decompositionfront moves outward.The corresponding pressure pro3les for di7erent times
under the same conditions of Fig. 3a are presented inFig. 3b. The pressure decreases gradually from the reser-voir pressure to the decomposition pressure at the front,and then decreases toward the well to its minimum valueat the well. For the present assumed condition that thezone permeabilities in the hydrate and the gas region are
C. Ji et al. / Chemical Engineering Science 56 (2001) 5801–5814 5807
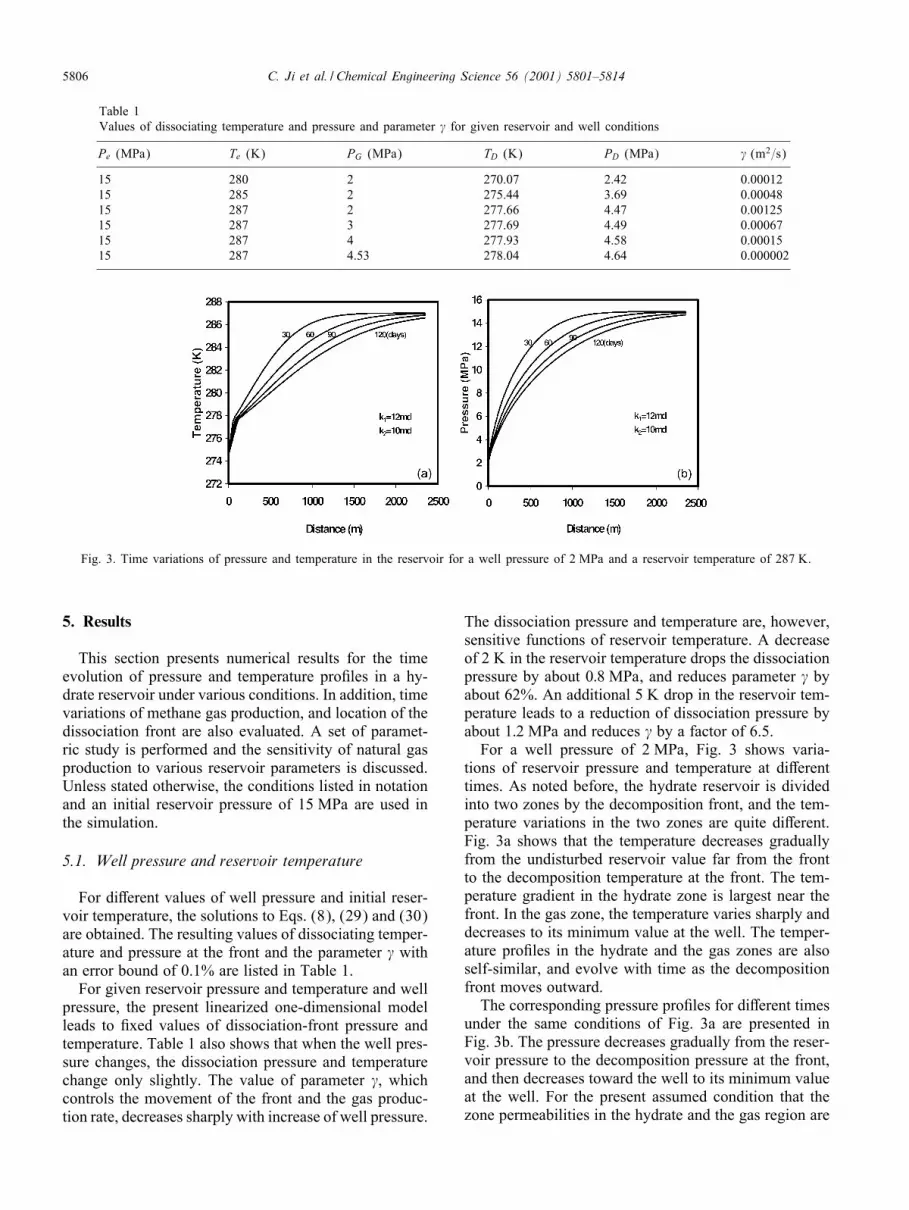
Fig. 4. Mass Fux and velocity pro3les for a reservoir temperature of 287 K and a well pressure of 2 MPa.
Fig. 5. Time variations of temperature and pressure in the reservoir for a well pressure of 4 MPa and a reservoir temperature of 287 K.
comparable, the change of slope of the pressure pro3le atthe front is hardly noticeable. For the case that the per-meability in the gas zone is much larger than that in thehydrate zone, Ahmadi, Ji, and Smith (2000) reported asigni3cant change of slope of the pressure pro3le at thedecomposition front. Fig. 3b also shows that the pressurepro3les for di7erent times are self-similar in each zone,and expand outward as the decomposition front movesaway from the well.Fig. 4 shows time evolutions of gas mass Fux (in
kg=m2s) and gas velocity (in m=s) across the reservoirfor a well pressure of 2 MPa. Fig. 4a shows that there isa jump in the mass Fux due to hydrate dissociation at thefront. The jump moves outward with time as the decom-position front penetrates deeper into the hydrate reser-voir. It is also noticed that for the one-dimension model,the gas mass Fux in the reservoir and the amount of nat-ural gas generated due to hydrate dissociation decreasewith time. Fig. 4b shows the time variation of natural gasvelocity toward the well. It is seen that the gas velocityvaries signi3cantly across the reservoir. Natural gas ve-locity increases towards the well and a velocity jump atthe decomposition front.
Fig. 5 shows the pressure and temperature pro3lesfor a well pressure of 4 MPa. The reservoir pressureand temperature are kept constant at 15 MPa and 287 K.Except for the slower movement of the front, variations ofpressure and temperature pro3les in this 3gure are quitesimilar to those shown in Figs. 3. Fig. 5 shows that thedissociation front is at about 30 m after 120 days. In com-parison, for a well pressure of 2 MPa, the front would beat 110 m under the same conditions. In the hydrate zone,the pressure and temperature decrease from their reser-voir values at large distances to the dissociation valuesat the front. Other features of pressure and temperaturepro3les in the hydrate zone are quite similar to those forlower well pressures. Comparatively, large gradients oc-cur near the front on the hydrate side. The pressure andtemperature in the gas region then decrease rather sharplytoward their minimum values at the well. For the wellpressure of 4 MPa, the dissociation pressure and temper-ature at the front become close to the well pressure andtemperature.Fig. 6 shows variations of non-dimensional tempera-
ture and pressure pro3les versus the similarity variable!1 as given by Eqs. (17), (18), (23) and (24). Here the
5808 C. Ji et al. / Chemical Engineering Science 56 (2001) 5801–5814
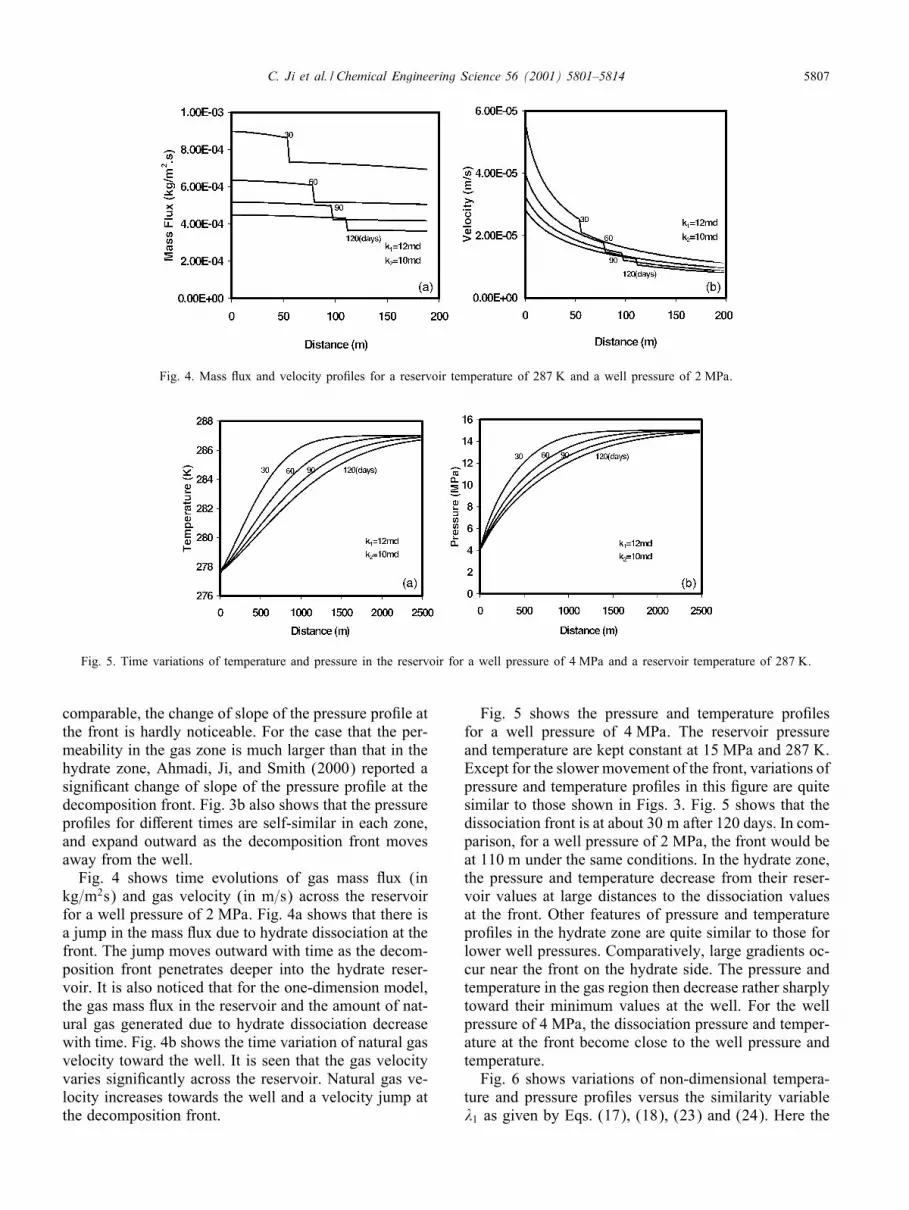
Fig. 6. Non-dimensional temperature and pressure pro3les versus similarity variable !1 for di7erent well pressures for a reservoir temperatureof 287 K and a reservoir pressure of 15 MPa.
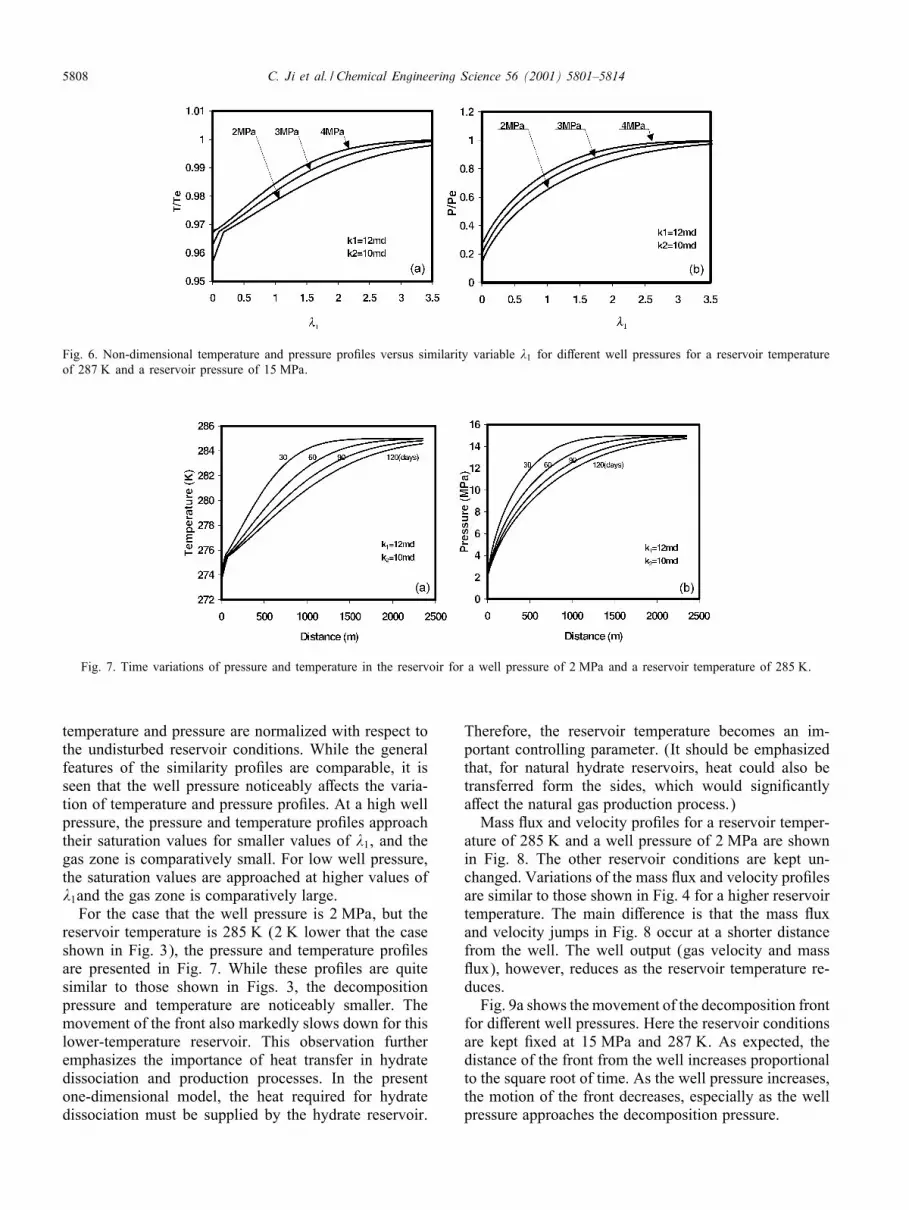
Fig. 7. Time variations of pressure and temperature in the reservoir for a well pressure of 2 MPa and a reservoir temperature of 285 K.
temperature and pressure are normalized with respect tothe undisturbed reservoir conditions. While the generalfeatures of the similarity pro3les are comparable, it isseen that the well pressure noticeably a7ects the varia-tion of temperature and pressure pro3les. At a high wellpressure, the pressure and temperature pro3les approachtheir saturation values for smaller values of !1, and thegas zone is comparatively small. For low well pressure,the saturation values are approached at higher values of!1and the gas zone is comparatively large.For the case that the well pressure is 2 MPa, but the
reservoir temperature is 285 K (2 K lower that the caseshown in Fig. 3), the pressure and temperature pro3lesare presented in Fig. 7. While these pro3les are quitesimilar to those shown in Figs. 3, the decompositionpressure and temperature are noticeably smaller. Themovement of the front also markedly slows down for thislower-temperature reservoir. This observation furtheremphasizes the importance of heat transfer in hydratedissociation and production processes. In the presentone-dimensional model, the heat required for hydratedissociation must be supplied by the hydrate reservoir.
Therefore, the reservoir temperature becomes an im-portant controlling parameter. (It should be emphasizedthat, for natural hydrate reservoirs, heat could also betransferred form the sides, which would signi3cantlya7ect the natural gas production process.)Mass Fux and velocity pro3les for a reservoir temper-
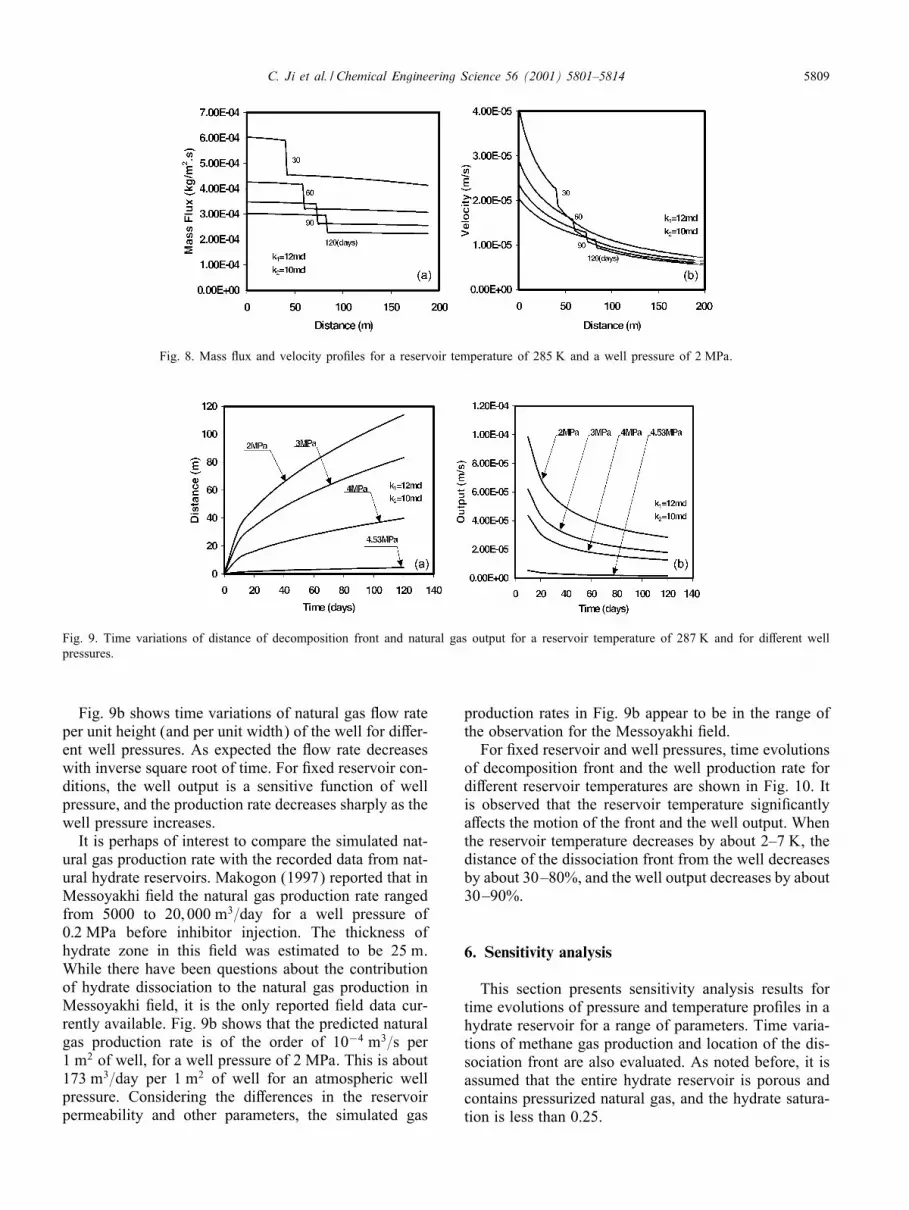
ature of 285 K and a well pressure of 2 MPa are shownin Fig. 8. The other reservoir conditions are kept un-changed. Variations of the mass Fux and velocity pro3lesare similar to those shown in Fig. 4 for a higher reservoirtemperature. The main di7erence is that the mass Fuxand velocity jumps in Fig. 8 occur at a shorter distancefrom the well. The well output (gas velocity and massFux), however, reduces as the reservoir temperature re-duces.Fig. 9a shows the movement of the decomposition front
for di7erent well pressures. Here the reservoir conditionsare kept 3xed at 15 MPa and 287 K. As expected, thedistance of the front from the well increases proportionalto the square root of time. As the well pressure increases,the motion of the front decreases, especially as the wellpressure approaches the decomposition pressure.
C. Ji et al. / Chemical Engineering Science 56 (2001) 5801–5814 5809
Fig. 8. Mass Fux and velocity pro3les for a reservoir temperature of 285 K and a well pressure of 2 MPa.
Fig. 9. Time variations of distance of decomposition front and natural gas output for a reservoir temperature of 287 K and for di7erent wellpressures.
Fig. 9b shows time variations of natural gas Fow rateper unit height (and per unit width) of the well for di7er-ent well pressures. As expected the Fow rate decreaseswith inverse square root of time. For 3xed reservoir con-ditions, the well output is a sensitive function of wellpressure, and the production rate decreases sharply as thewell pressure increases.It is perhaps of interest to compare the simulated nat-
ural gas production rate with the recorded data from nat-ural hydrate reservoirs. Makogon (1997) reported that inMessoyakhi 3eld the natural gas production rate rangedfrom 5000 to 20; 000 m3=day for a well pressure of0:2 MPa before inhibitor injection. The thickness ofhydrate zone in this 3eld was estimated to be 25 m.While there have been questions about the contributionof hydrate dissociation to the natural gas production inMessoyakhi 3eld, it is the only reported 3eld data cur-rently available. Fig. 9b shows that the predicted naturalgas production rate is of the order of 10−4 m3=s per1 m2 of well, for a well pressure of 2 MPa. This is about173 m3=day per 1 m2 of well for an atmospheric wellpressure. Considering the di7erences in the reservoirpermeability and other parameters, the simulated gas
production rates in Fig. 9b appear to be in the range ofthe observation for the Messoyakhi 3eld.For 3xed reservoir and well pressures, time evolutions
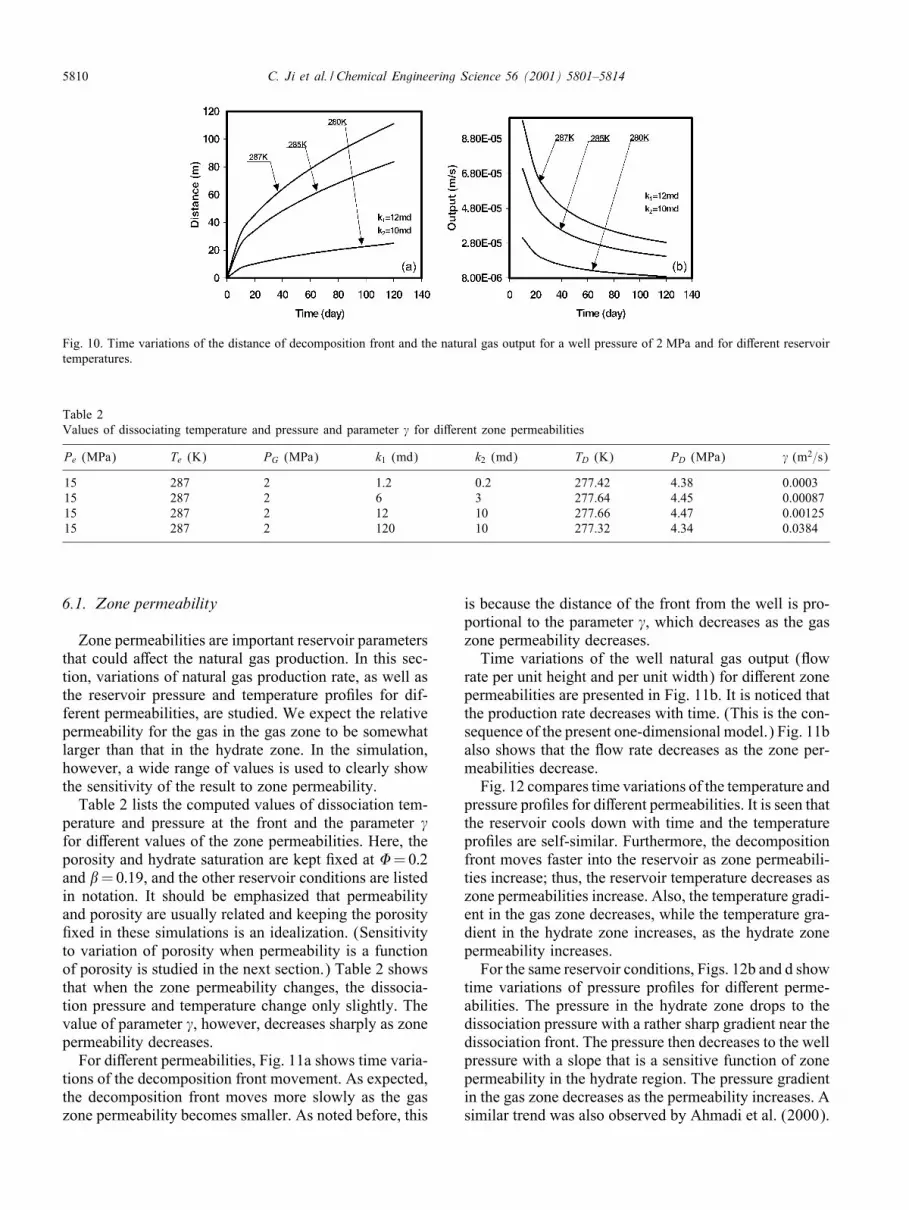
of decomposition front and the well production rate fordi7erent reservoir temperatures are shown in Fig. 10. Itis observed that the reservoir temperature signi3cantlya7ects the motion of the front and the well output. Whenthe reservoir temperature decreases by about 2–7 K, thedistance of the dissociation front from the well decreasesby about 30–80%, and the well output decreases by about30–90%.
6. Sensitivity analysis
This section presents sensitivity analysis results fortime evolutions of pressure and temperature pro3les in ahydrate reservoir for a range of parameters. Time varia-tions of methane gas production and location of the dis-sociation front are also evaluated. As noted before, it isassumed that the entire hydrate reservoir is porous andcontains pressurized natural gas, and the hydrate satura-tion is less than 0.25.
5810 C. Ji et al. / Chemical Engineering Science 56 (2001) 5801–5814
Fig. 10. Time variations of the distance of decomposition front and the natural gas output for a well pressure of 2 MPa and for di7erent reservoirtemperatures.
Table 2Values of dissociating temperature and pressure and parameter " for di7erent zone permeabilities
Pe (MPa) Te (K) PG (MPa) k1 (md) k2 (md) TD (K) PD (MPa) " (m2=s)
Zone permeabilities are important reservoir parametersthat could a7ect the natural gas production. In this sec-tion, variations of natural gas production rate, as well asthe reservoir pressure and temperature pro3les for dif-ferent permeabilities, are studied. We expect the relativepermeability for the gas in the gas zone to be somewhatlarger than that in the hydrate zone. In the simulation,however, a wide range of values is used to clearly showthe sensitivity of the result to zone permeability.Table 2 lists the computed values of dissociation tem-
perature and pressure at the front and the parameter "for di7erent values of the zone permeabilities. Here, theporosity and hydrate saturation are kept 3xed at =0:2and �=0:19, and the other reservoir conditions are listedin notation. It should be emphasized that permeabilityand porosity are usually related and keeping the porosity3xed in these simulations is an idealization. (Sensitivityto variation of porosity when permeability is a functionof porosity is studied in the next section.) Table 2 showsthat when the zone permeability changes, the dissocia-tion pressure and temperature change only slightly. Thevalue of parameter ", however, decreases sharply as zonepermeability decreases.For di7erent permeabilities, Fig. 11a shows time varia-
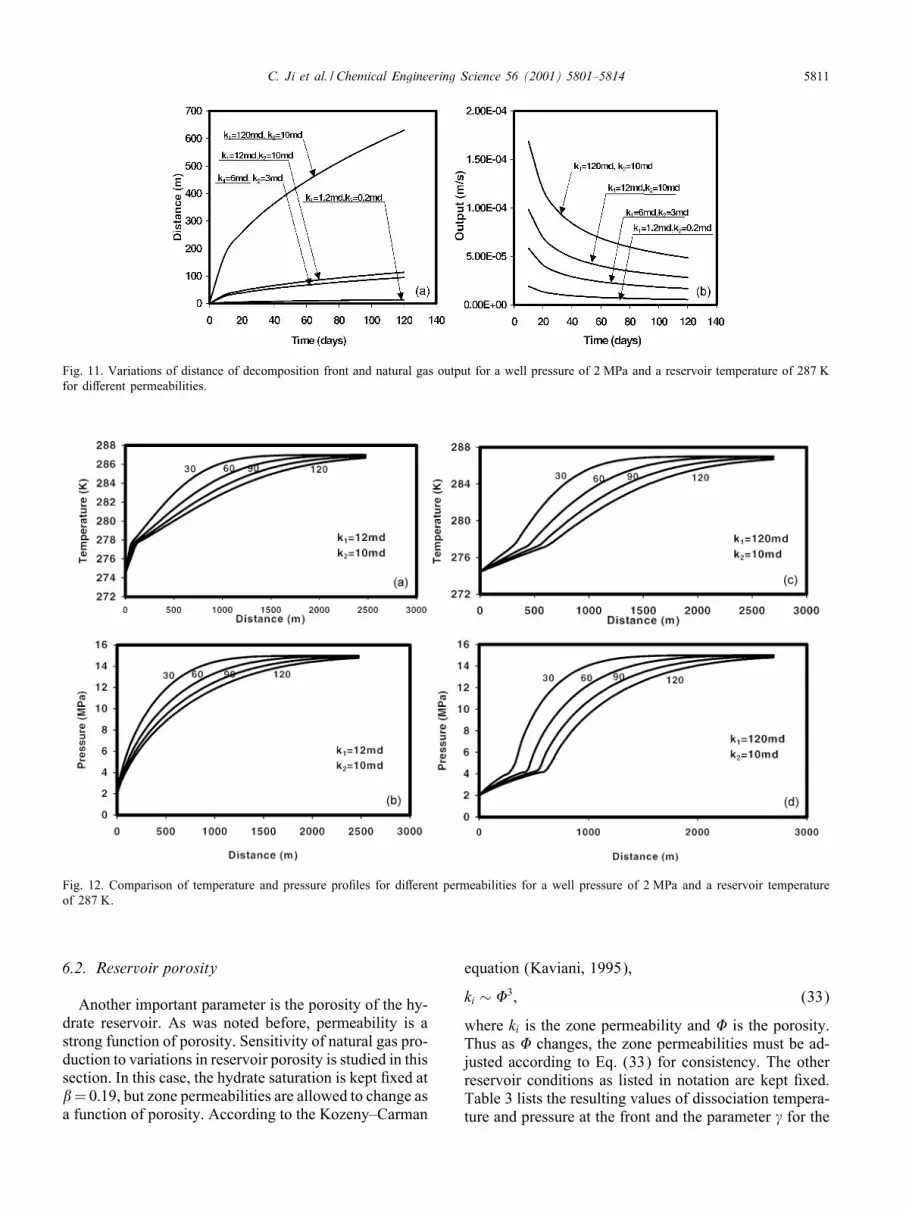
tions of the decomposition front movement. As expected,the decomposition front moves more slowly as the gaszone permeability becomes smaller. As noted before, this
is because the distance of the front from the well is pro-portional to the parameter ", which decreases as the gaszone permeability decreases.Time variations of the well natural gas output (Fow
rate per unit height and per unit width) for di7erent zonepermeabilities are presented in Fig. 11b. It is noticed thatthe production rate decreases with time. (This is the con-sequence of the present one-dimensional model.) Fig. 11balso shows that the Fow rate decreases as the zone per-meabilities decrease.Fig. 12 compares time variations of the temperature and
pressure pro3les for di7erent permeabilities. It is seen thatthe reservoir cools down with time and the temperaturepro3les are self-similar. Furthermore, the decompositionfront moves faster into the reservoir as zone permeabili-ties increase; thus, the reservoir temperature decreases aszone permeabilities increase. Also, the temperature gradi-ent in the gas zone decreases, while the temperature gra-dient in the hydrate zone increases, as the hydrate zonepermeability increases.For the same reservoir conditions, Figs. 12b and d show
time variations of pressure pro3les for di7erent perme-abilities. The pressure in the hydrate zone drops to thedissociation pressure with a rather sharp gradient near thedissociation front. The pressure then decreases to the wellpressure with a slope that is a sensitive function of zonepermeability in the hydrate region. The pressure gradientin the gas zone decreases as the permeability increases. Asimilar trend was also observed by Ahmadi et al. (2000).
C. Ji et al. / Chemical Engineering Science 56 (2001) 5801–5814 5811
Fig. 11. Variations of distance of decomposition front and natural gas output for a well pressure of 2 MPa and a reservoir temperature of 287 Kfor di7erent permeabilities.
Fig. 12. Comparison of temperature and pressure pro3les for di7erent permeabilities for a well pressure of 2 MPa and a reservoir temperatureof 287 K.
6.2. Reservoir porosity
Another important parameter is the porosity of the hy-drate reservoir. As was noted before, permeability is astrong function of porosity. Sensitivity of natural gas pro-duction to variations in reservoir porosity is studied in thissection. In this case, the hydrate saturation is kept 3xed at�=0:19, but zone permeabilities are allowed to change asa function of porosity. According to the Kozeny–Carman
equation (Kaviani, 1995),
ki ∼ 3; (33)
where ki is the zone permeability and is the porosity.Thus as changes, the zone permeabilities must be ad-justed according to Eq. (33) for consistency. The otherreservoir conditions as listed in notation are kept 3xed.Table 3 lists the resulting values of dissociation tempera-ture and pressure at the front and the parameter " for the
5812 C. Ji et al. / Chemical Engineering Science 56 (2001) 5801–5814
Table 3Values of dissociating temperature and pressure and parameter " for di7erent reservoir porosities
Pe Te (K) PG (MPa) k1 (md) k2 (md) TD (K) PD (MPa) " (m2=s)
Fig. 13. Variations of distance of decomposition front and natural gas output for a well pressure of 2 MPa and a reservoir temperature of 287 Kfor di7erent porosities.
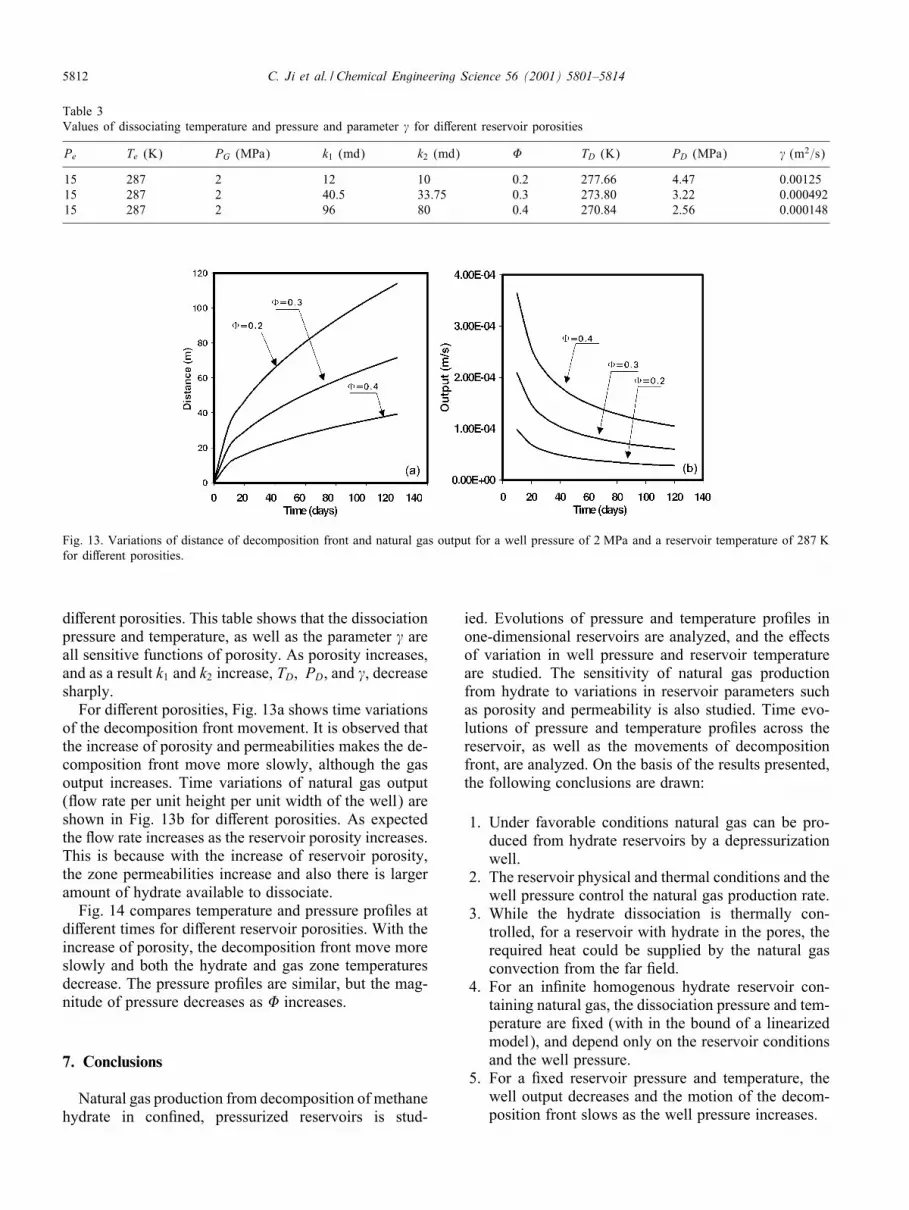
di7erent porosities. This table shows that the dissociationpressure and temperature, as well as the parameter " areall sensitive functions of porosity. As porosity increases,and as a result k1 and k2 increase, TD; PD, and ", decreasesharply.For di7erent porosities, Fig. 13a shows time variations
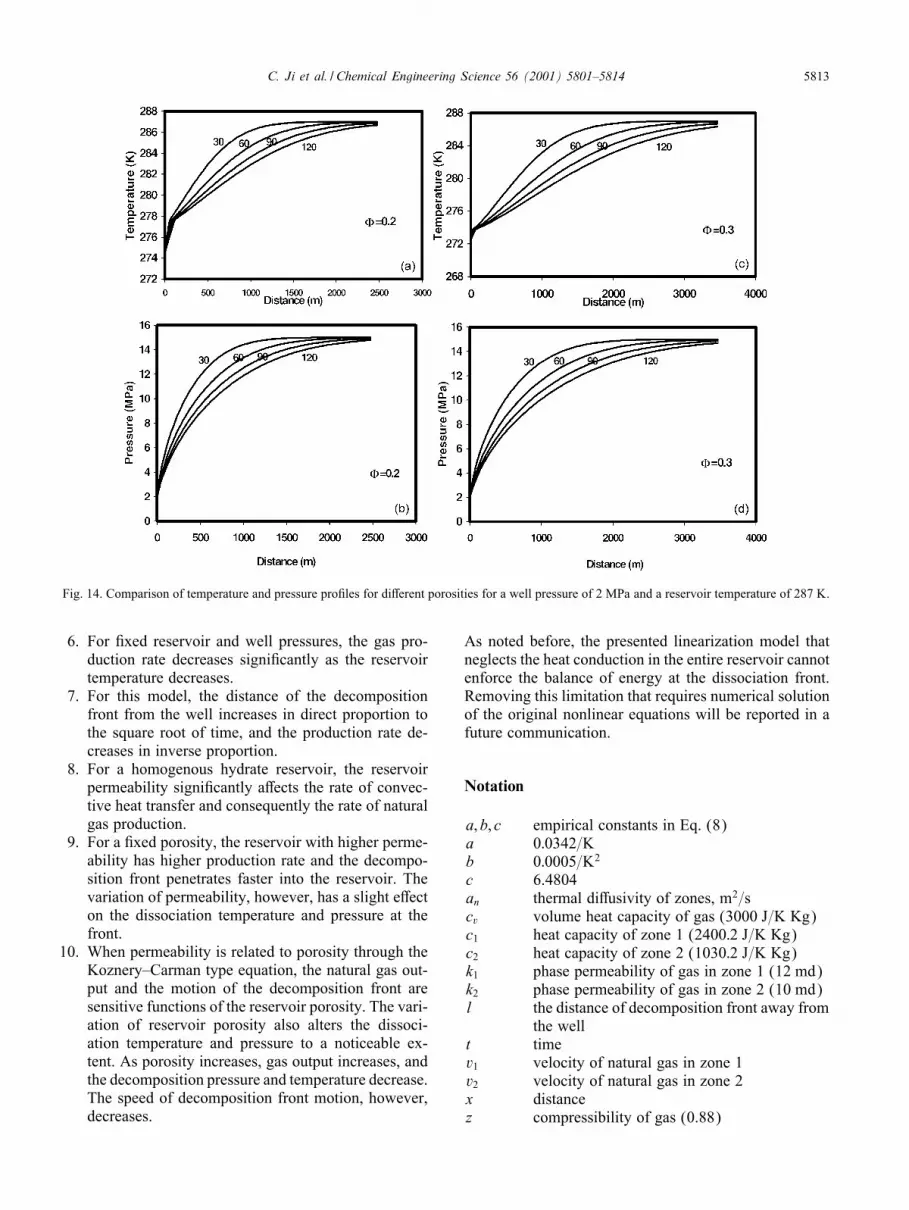
of the decomposition front movement. It is observed thatthe increase of porosity and permeabilities makes the de-composition front move more slowly, although the gasoutput increases. Time variations of natural gas output(Fow rate per unit height per unit width of the well) areshown in Fig. 13b for di7erent porosities. As expectedthe Fow rate increases as the reservoir porosity increases.This is because with the increase of reservoir porosity,the zone permeabilities increase and also there is largeramount of hydrate available to dissociate.Fig. 14 compares temperature and pressure pro3les at
di7erent times for di7erent reservoir porosities. With theincrease of porosity, the decomposition front move moreslowly and both the hydrate and gas zone temperaturesdecrease. The pressure pro3les are similar, but the mag-nitude of pressure decreases as increases.
7. Conclusions
Natural gas production from decomposition of methanehydrate in con3ned, pressurized reservoirs is stud-
ied. Evolutions of pressure and temperature pro3les inone-dimensional reservoirs are analyzed, and the e7ectsof variation in well pressure and reservoir temperatureare studied. The sensitivity of natural gas productionfrom hydrate to variations in reservoir parameters suchas porosity and permeability is also studied. Time evo-lutions of pressure and temperature pro3les across thereservoir, as well as the movements of decompositionfront, are analyzed. On the basis of the results presented,the following conclusions are drawn:
1. Under favorable conditions natural gas can be pro-duced from hydrate reservoirs by a depressurizationwell.
2. The reservoir physical and thermal conditions and thewell pressure control the natural gas production rate.
3. While the hydrate dissociation is thermally con-trolled, for a reservoir with hydrate in the pores, therequired heat could be supplied by the natural gasconvection from the far 3eld.
4. For an in3nite homogenous hydrate reservoir con-taining natural gas, the dissociation pressure and tem-perature are 3xed (with in the bound of a linearizedmodel), and depend only on the reservoir conditionsand the well pressure.
5. For a 3xed reservoir pressure and temperature, thewell output decreases and the motion of the decom-position front slows as the well pressure increases.
C. Ji et al. / Chemical Engineering Science 56 (2001) 5801–5814 5813
Fig. 14. Comparison of temperature and pressure pro3les for di7erent porosities for a well pressure of 2 MPa and a reservoir temperature of 287 K.
6. For 3xed reservoir and well pressures, the gas pro-duction rate decreases signi3cantly as the reservoirtemperature decreases.
7. For this model, the distance of the decompositionfront from the well increases in direct proportion tothe square root of time, and the production rate de-creases in inverse proportion.
8. For a homogenous hydrate reservoir, the reservoirpermeability signi3cantly a7ects the rate of convec-tive heat transfer and consequently the rate of naturalgas production.
9. For a 3xed porosity, the reservoir with higher perme-ability has higher production rate and the decompo-sition front penetrates faster into the reservoir. Thevariation of permeability, however, has a slight e7ecton the dissociation temperature and pressure at thefront.
10. When permeability is related to porosity through theKoznery–Carman type equation, the natural gas out-put and the motion of the decomposition front aresensitive functions of the reservoir porosity. The vari-ation of reservoir porosity also alters the dissoci-ation temperature and pressure to a noticeable ex-tent. As porosity increases, gas output increases, andthe decomposition pressure and temperature decrease.The speed of decomposition front motion, however,decreases.
As noted before, the presented linearization model thatneglects the heat conduction in the entire reservoir cannotenforce the balance of energy at the dissociation front.Removing this limitation that requires numerical solutionof the original nonlinear equations will be reported in afuture communication.
Notation
a; b; c empirical constants in Eq. (8)a 0:0342=Kb 0:0005=K2
c 6.4804an thermal di7usivity of zones, m2=scv volume heat capacity of gas (3000 J=K Kg)c1 heat capacity of zone 1 (2400:2 J=K Kg)c2 heat capacity of zone 2 (1030:2 J=K Kg)k1 phase permeability of gas in zone 1 (12 md)k2 phase permeability of gas in zone 2 (10 md)l the distance of decomposition front away from
the wellt timev1 velocity of natural gas in zone 1v2 velocity of natural gas in zone 2x distancez compressibility of gas (0.88)
5814 C. Ji et al. / Chemical Engineering Science 56 (2001) 5801–5814
P0 atmospheric pressure (1:01× 105 Pa)PD hydrate decomposition pressurePe reservoir pressure at initial time (15 MPa)PG pressure at the well, MPaPn pressure in zone 1 or 2Q gas production rate per unit length of wellTD hydrate decomposition temperature, KTe reservoir temperature at initial time, KTn temperature in zone 1 or 2T0 reference temperature (273:15 K)
Greek letters
� water content of pores (0.15)� hydrate saturation of a layer (0.19)" constant related to movement of decomposi-
tion front� throttling coeOcient of gas (8× 10⁻⁷ K=Pa)� mass fraction of gas in methane hydrate
(0.129)� adiabatic coeOcient of gas (3:2× 10⁻⁶ K=Pa)� viscosity of gas (methane) (1:5× 10⁻⁵ Pa S)�0 density of methane gas at atmospheric pressure
P0 and temperature T0.(0:706 kg=m3)
�3 density of hydrate (0:91× 103 kg=m3)�W density of water (1:0× 103 kg=m3) porosity (0.2)1 (1− �), content of free gas at zone 12 (1− �), content of free gas at zone 2
Acknowledgements
The support of the OOce of Fossil Energy, US De-partment of Energy and Clarkson University is gratefullyacknowledged. The work of GA was also supported by agrant form US Department of Energy.
References
AGU, (1999). American Geophysical Union, Mineralogical Societyof America, and Geochemical Society, Spring Meeting, Boston,MA, June 1–4.
Ahmadi, G., Ji, C., & Smith, D. H. (2000). A simple model for naturalgas production from hydrate decomposition. In G. D. Holder, &P. R. Bishnoi (Eds.), Gas hydrates: Challenges for the future, Vol.912 (pp. 420–427). New York: New York Academy of Sciences.
Burshears, M., O’Brien, T. J., & Malone, R. D. (1986). Amulti-phase, multi-dimensional, variable composition simulation
of gas production from a conventional gas reservoir in contactwith hydrates, Proceedings of Unconventional Gas TechnologySymposium, Louisville, KY, May 18–21, Society of PetroleumEngineers, SPE Paper 15246.
Durgut, I., & Parlaktuna, M. (1996). A numerical method for thegas production process in gas hydrate reservoirs. Proceedings ofthe Second International Conference on Natural Gas Hydrates,Toulouse, France, June 2–6.
Holder, G. D., Angert, P. F., & Godbole, S. P. (1982). Simulationof gas production from a reservoir containing both gas hydratesand free natural gas. Proceedings of 57th Society of PetroleumEngineers Technology Conference, New Orleans, September26–29, SPE Paper 11005.
Kamath, V. (1983). Study of heat transfer characteristics duringdissociation of gas hydrates in porous media. Ph.D. Thesis,University of Pittsburgh, Pittsburgh, PA.
Kaviani, M. (1995). Principle of heat transfer in porous media. NewYork: Springer.
Kim, H. C., Bishnoi, P. R., Heidemann, R. A., & Rizvi, S. S. H.(1987). Kinetics of methane hydrate decomposition. ChemicalEngineering Science, 42, 1645–1653.
Lysne, D. (1994). Hydrate plug dissociation by pressure reduction. InE. D. Sloan Jr., J. Happel, & M. A. Hnatow (Eds.), InternationalConference on Natural Gas Hydrates, Vol. 715 (pp. 714–717).New York: Academy of Science.
Makogon, Y. F. (1974). Hydrates of natural gas (Translated formRussian by Cieslesicz, W.J.) Tulsa, OK: Penn Well.
Makogon, Y. F. (1997). Hydrates of hydrocarbons. Tulsa, OK: PennWell.
Makogon, Y. F. (1998). Private communication.Marshall, D. R., Saito, S., & Kobayashi, R. (1964). Hydrates at high
pressure: Part I, methane–water, argon–water, and nitrogen–watersystems. A.I.Ch.E. Journal, 10, 202–205.
Masuda, Y., Fujinaga, Y., Naganawa, S., Fujita, K., Sato, K.,& Hayashi, Y. (1999). Modeling and experimental studies ondissociation of methane gas hydrates in berea sandstone cores.Proceedings of the Third International Conference on NaturalGas Hydrates, Salt Lake City, UT, July 18–22.
Moridis, G., Apps, J., Pruess, K., & Myer, L. (1998). EOSHYDR:A TOUGH2 module for CH4-hydrate release and Fow inthe subsurface. LBNL-42386, Lawrence Berkeley NationalLaboratory, Berkeley, CA.
Selim, M. S., & Sloan, E. D. (1989). Heat and mass transfer duringthe dissociation of hydrates in porous media. A.I.Ch.E. Journal,35, 1049–1052.
Sloan Jr., E. D. (1998). Clathrate hydrates of natural gases(2nd ed). New York: Marcel Dekker.
Swinkels, W. J. A. M., & Drenth, R. J. J. (1999). Thermal reservoirsimulation model of production from naturally occuring gashydrate accumulations. Proceedings 1999 SPE Annual TechnicalConference, Houston, TX, October 1999, SPE Paper 56550.
Tsypkin, G. (2000). Mathematical models of gas hydrates dissociationin porous media. In G. D. Holder, & P. R. Bishnoi (Eds.), Gashydrates: Challenges for the future, Vol. 912 (pp. 428–436).New York: New York Academy of Sciences.
Verigin, N. N., Khabibullin, I. L., & Khalikov, G. A. (1980).Izvestiya Akademii NaukSSSR, Mekhanika Zhidkosti Gaza. No. 1,p. 174.