SCRS/2010/070 Collect. Vol. Sci. Pap. ICCAT, 66(3): 1170-1203 (2011) 1170 INDICES OF STOCK STATUS FROM THE 2009 CANADIAN BLUEFIN TUNA FISHERY Stacey D. Paul, Alex Hanke, Angelia S.M. Vanderlaan, Dheeraj Busawon and John D. Neilson 1 SUMMARY Updated standardized relative abundance indices are presented for Canadian bluefin tuna fisheries in the Gulf of St. Lawrence (1981-2009) and off southwest Nova Scotia (1988-2009) based on data from commercial log records. Methods used were as in the 2008 bluefin tuna stock assessment. A step-wise regression was used to determine the most appropriate delta lognormal-binomial model specifications for standardizing both CPUE series. CPUEs in the Gulf of St. Lawrence have increased slightly from 1997 to 2003, rapidly increased in 2004 and remained high. Catch rates in 2009 were exceptionally high. The southwest Nova Scotia series has had a fairly stable trend through the mid- to late 1990s, and have been increasing since 2004. The spatial distribution of the Canadian fisheries has not changed significantly, but there were once again anecdotal reports of tuna occurring in areas where they have not been observed in many years (for example, the Baie des Chaleurs in the western Gulf of St. Lawrence). The median weights of the catch in the southern Gulf of St. Lawrence and Southwest Nova Scotia declined in 2009, and the Gulf of St. Lawrence catch consisted of several smaller fish, an observation which has not been seen since 2000. After a steady decline in the late 1990s through 2005, condition (Fulton’s K) in the Gulf of St. Lawrence bluefin tuna increased in 2006 and has varied slightly though 2007, 2008 and 2009. RÉSUMÉ Une actualisation des indices d’abondance relative standardisés est présentée pour les pêcheries canadiennes de thon rouge opérant dans le Golfe du St Laurent (1981-2009) et au large du Sud-Ouest de la Nouvelle-Ecosse (1988.2009), sur la base des données recueillies dans les registres commerciaux. Les méthodes utilisées étaient les mêmes que celles de l’évaluation des stocks de thon rouge de 2008. Une régression pas à pas a été utilisée pour déterminer les spécifications de modèle delta lognormal-binomial les plus appropriées pour standardiser les deux séries de CPUE. Les CPUE dans le golfe du Saint-Laurent ont légèrement augmenté de 1997 à 2003, ont rapidement augmenté en 2004 et se sont ensuite maintenus à un niveau élevé. En 2009, les taux de capture étaient exceptionnellement élevés. La série du sud-ouest de la Nouvelle-Écosse présentait une tendance relativement stable du milieu à la fin des années 1990, et n'a cessé d'augmenter depuis 2004. La distribution spatiale des pêcheries canadiennes n’a pas considérablement changé, mais on a, une fois de plus, signalé de façon anecdotique la présence de thonidés dans des zones où ils n’avaient pas été observés depuis de nombreuses années (à titre d’exemple, la Baie des Chaleurs, à l’Ouest du Golfe du St Laurent). La médiane des poids de la capture au Sud du Golfe du St Laurent et au Sud-Ouest de la Nouvelle-Ecosse a chuté en 2009, et la prise du Golfe du St Laurent s'est composée de plusieurs poissons plus petits, observation qui n’a pas été relevée depuis 2000. Après une chute régulière à la fin des années 90 jusqu’en 2005 compris, la condition (K de Fulton) du thon rouge dans le Golfe du St Laurent a augmenté en 2006 et a légèrement varié jusqu’en 2007, 2008 et 2009 compris. RESUMEN Se presentan índices de abundancia relativa estandarizados y actualizados para las pesquerías canadienses de atún rojo en el Golfo de San Lorenzo (1981-2009) y en aguas del sudoeste de Nueva Escocia (1988-2009) basados en datos de los registros comerciales. Los métodos utilizados fueron los mismos que en la evaluación de stock de atún rojo de 2008. Se utilizó una 1 Fisheries and Oceans Canada, St. Andrews Biological Station, 531 Brandy Cove Road, St. Andrews, NB E5B 2L9 Canada; daEmail: [email protected]
Stacey D. Paul, Alex Hanke, Angelia S.M. Vanderlaan, Dheeraj Busawon and John D. Neilson1
SUMMARY
Updated standardized relative abundance indices are presented for Canadian bluefin tuna fisheries in the Gulf of St. Lawrence (1981-2009) and off southwest Nova Scotia (1988-2009) based on data from commercial log records. Methods used were as in the 2008 bluefin tuna stock assessment. A step-wise regression was used to determine the most appropriate delta lognormal-binomial model specifications for standardizing both CPUE series. CPUEs in the Gulf of St. Lawrence have increased slightly from 1997 to 2003, rapidly increased in 2004 and remained high. Catch rates in 2009 were exceptionally high. The southwest Nova Scotia series has had a fairly stable trend through the mid- to late 1990s, and have been increasing since 2004. The spatial distribution of the Canadian fisheries has not changed significantly, but there were once again anecdotal reports of tuna occurring in areas where they have not been observed in many years (for example, the Baie des Chaleurs in the western Gulf of St. Lawrence). The median weights of the catch in the southern Gulf of St. Lawrence and Southwest Nova Scotia declined in 2009, and the Gulf of St. Lawrence catch consisted of several smaller fish, an observation which has not been seen since 2000. After a steady decline in the late 1990s through 2005, condition (Fulton’s K) in the Gulf of St. Lawrence bluefin tuna increased in 2006 and has varied slightly though 2007, 2008 and 2009.
RÉSUMÉ
Une actualisation des indices d’abondance relative standardisés est présentée pour les pêcheries canadiennes de thon rouge opérant dans le Golfe du St Laurent (1981-2009) et au large du Sud-Ouest de la Nouvelle-Ecosse (1988.2009), sur la base des données recueillies dans les registres commerciaux. Les méthodes utilisées étaient les mêmes que celles de l’évaluation des stocks de thon rouge de 2008. Une régression pas à pas a été utilisée pour déterminer les spécifications de modèle delta lognormal-binomial les plus appropriées pour standardiser les deux séries de CPUE. Les CPUE dans le golfe du Saint-Laurent ont légèrement augmenté de 1997 à 2003, ont rapidement augmenté en 2004 et se sont ensuite maintenus à un niveau élevé. En 2009, les taux de capture étaient exceptionnellement élevés. La série du sud-ouest de la Nouvelle-Écosse présentait une tendance relativement stable du milieu à la fin des années 1990, et n'a cessé d'augmenter depuis 2004. La distribution spatiale des pêcheries canadiennes n’a pas considérablement changé, mais on a, une fois de plus, signalé de façon anecdotique la présence de thonidés dans des zones où ils n’avaient pas été observés depuis de nombreuses années (à titre d’exemple, la Baie des Chaleurs, à l’Ouest du Golfe du St Laurent). La médiane des poids de la capture au Sud du Golfe du St Laurent et au Sud-Ouest de la Nouvelle-Ecosse a chuté en 2009, et la prise du Golfe du St Laurent s'est composée de plusieurs poissons plus petits, observation qui n’a pas été relevée depuis 2000. Après une chute régulière à la fin des années 90 jusqu’en 2005 compris, la condition (K de Fulton) du thon rouge dans le Golfe du St Laurent a augmenté en 2006 et a légèrement varié jusqu’en 2007, 2008 et 2009 compris.
RESUMEN
Se presentan índices de abundancia relativa estandarizados y actualizados para las pesquerías canadienses de atún rojo en el Golfo de San Lorenzo (1981-2009) y en aguas del sudoeste de Nueva Escocia (1988-2009) basados en datos de los registros comerciales. Los métodos utilizados fueron los mismos que en la evaluación de stock de atún rojo de 2008. Se utilizó una
1 Fisheries and Oceans Canada, St. Andrews Biological Station, 531 Brandy Cove Road, St. Andrews, NB E5B 2L9 Canada; daEmail: [email protected]
1171
regresión paso a paso para determinar las especificaciones más adecuadas del modelo delta-lognormal binomial para estandarizar ambas series de CPUE. Las CPUE en el Golfo de San Lorenzo han aumentado ligeramente desde 1997 hasta 2003, aumentaron rápidamente en 2004 y permanecieron elevadas. Las tasas de captura en 2009 fueron excepcionalmente altas. La serie del sudoeste de Nueva Escocia presentaba una tendencia bastante estable hasta mediados-final de los 90 y desde 2004 ha ido aumentando. La distribución espacial de las pesquerías canadienses no ha cambiado de forma significativa, pero se han producido de vez en cuando informes anecdóticos de túnidos en aguas donde no se habían observado en muchos años (por ejemplo en la Baie des Chaleurs, en el Golfo de San Lorenzo occidental). La mediana de los pesos de la captura en el Golfo de San Lorenzo meridional y en el sudoeste de Nueva Escocia descendió en 2009 y la captura del Golfo de San Lorenzo incluía varios peces más pequeños, algo que no se había observado desde el año 2000. Tras un descenso constante desde finales de los 90 hasta 2005, la condición (K de Fulton) en el atún rojo del Golfo de San Lorenzo aumentó en 2006 y ha variado ligeramente en 2007, 2008 y 2009.
KEYWORDS
Tuna fisheries catch rates, size composition
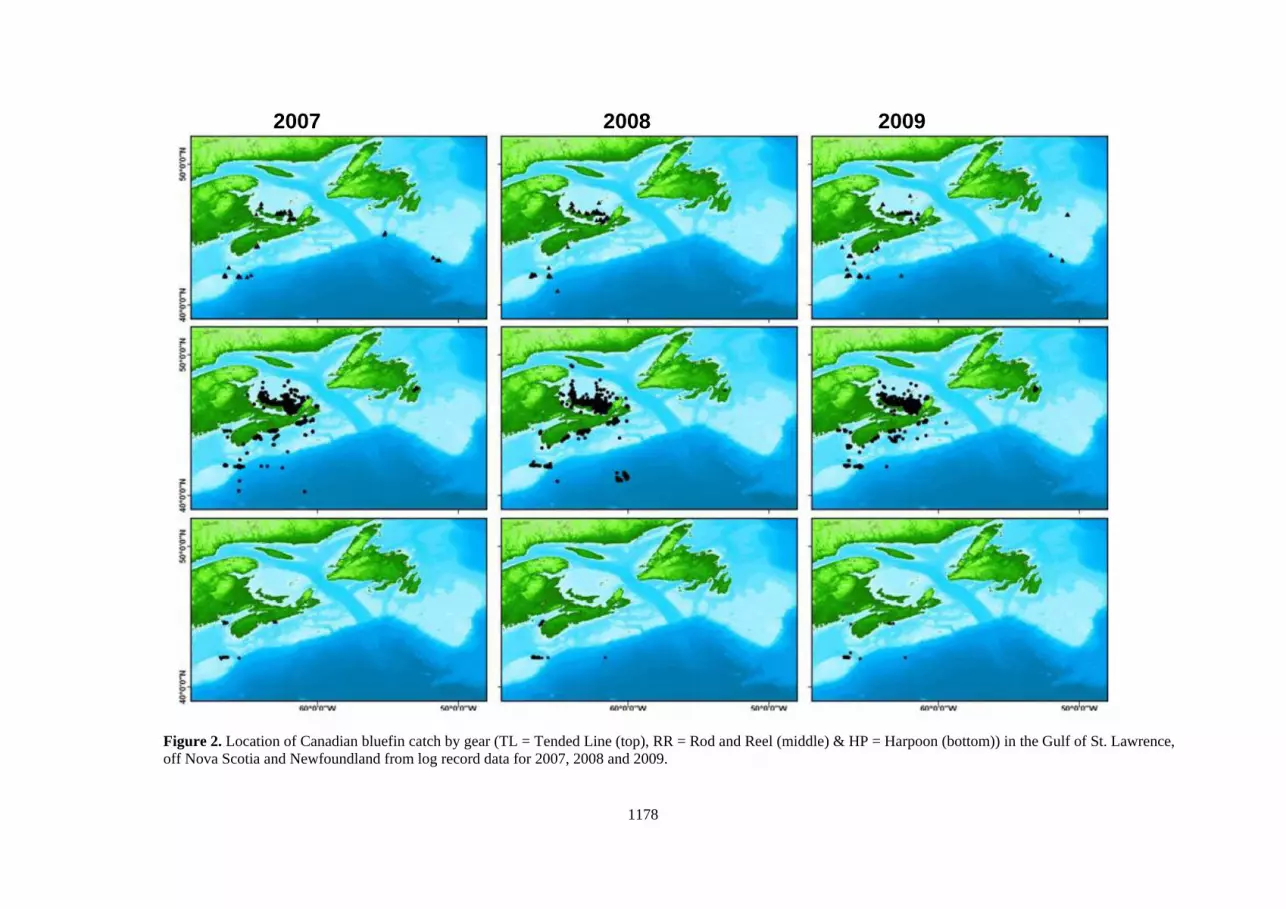
1. Introduction This paper presents a synopsis of recent developments, catch composition and catch rates in the bluefin tuna fishery conducted by Canada. The catch rate information updates standardized Canadian series for bluefin tuna fisheries in the Gulf of St. Lawrence (age 13+) and off Southwest Nova Scotia (ages 7-13) presented in Neilson et al. (2009). Those authors used a step-wise regression to determine the most appropriate delta lognormal-binomial catch rate model, and the series were used in the 2008 stock assessment (Anon 2009). In the current paper, a similar approach was employed to update the information as potential indices of abundance for the 2010 stock assessment. 2. Description of the fisheries and locations fished Canadian bluefin tuna fisheries operate in several geographic areas off the Atlantic coast mainly between July and November, when bluefin tuna have migrated into Canadian waters (Figure 1). The main commercial fisheries occur off the coast of Nova Scotia, in the southern Gulf of St. Lawrence and sporadically in Newfoundland (Figure 1A). In recent years (2007-2009) the spatial distribution of the main commercial fisheries showed general consistency in areas fished using tended line, rod and reel and electric harpoon (Figures 1 and 2). In the Gulf of St. Lawrence, bluefin tuna were caught in waters north of Prince Edward Island and west of Cape Breton Island. Anecdotal reports from bait fishermen indicate that large numbers of bluefin tuna have been observed in the western Gulf of St. Lawrence in the Baie des Chaleurs, an area that once supported an important bluefin tuna fishery. Catches in the fishing areas off the coast of Nova Scotia were localized off the northern edge of Georges Bank, in the Hell Hole, at the mouth of the Bay of Fundy, in St Margaret’s Bay, Canso and off Halifax. Catches in the Newfoundland fishery sporadically occur on the western and eastern edges of the Grand Banks (Figure 2). As in previous years, rod and reel was the predominant gear type, with smaller catches by tended line, electric harpoon and trap (St. Margarets Bay). The Gulf of St. Lawrence fishery exhibited varying temporal trends in 2007-2009, notably in start and peak time, due to changes in fleet management. As noted in Neilson et al. (2009), exceptional catch rates were once again experienced in the Gulf of St. Lawrence in 2008 and 2009. Since 2007 the fishery has taken place in two parts; an early season (the beginning of August), followed by a closure and a re-opening in September or October. The fleet sectors adopted a one fish per day rule to allow a longer and more lucrative fishery, given the low quota and high number of licensed fishing vessels. Despite this, the fleet quotas were caught very quickly, exceptionally so in 2009. The Prince Edward Island sector caught their entire quota in just 14 days, while the Gulf Nova Scotia fleet took 19 days, in contrast to 2008 when fishing occurred for 43 and 33 days, respectively. The number of
1172
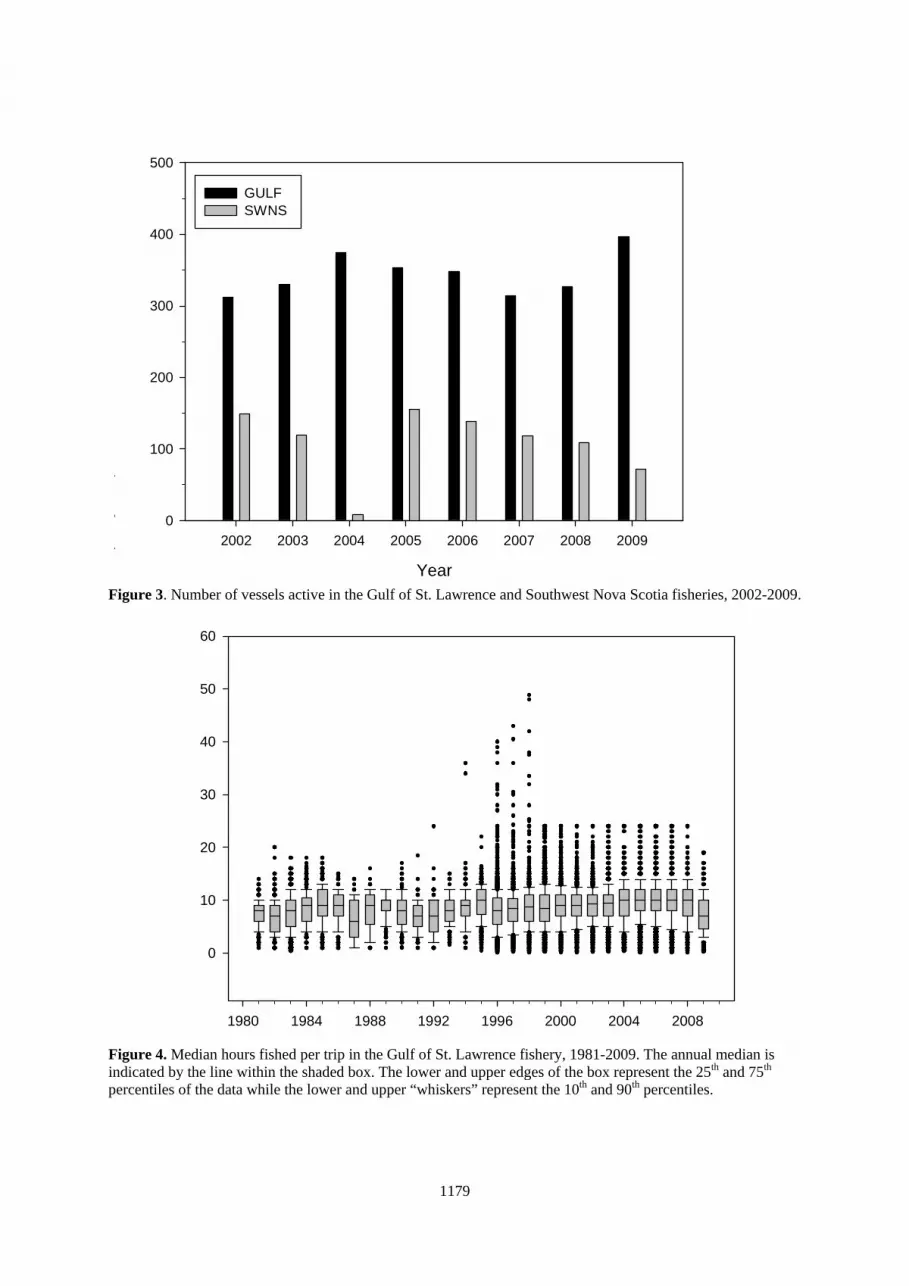
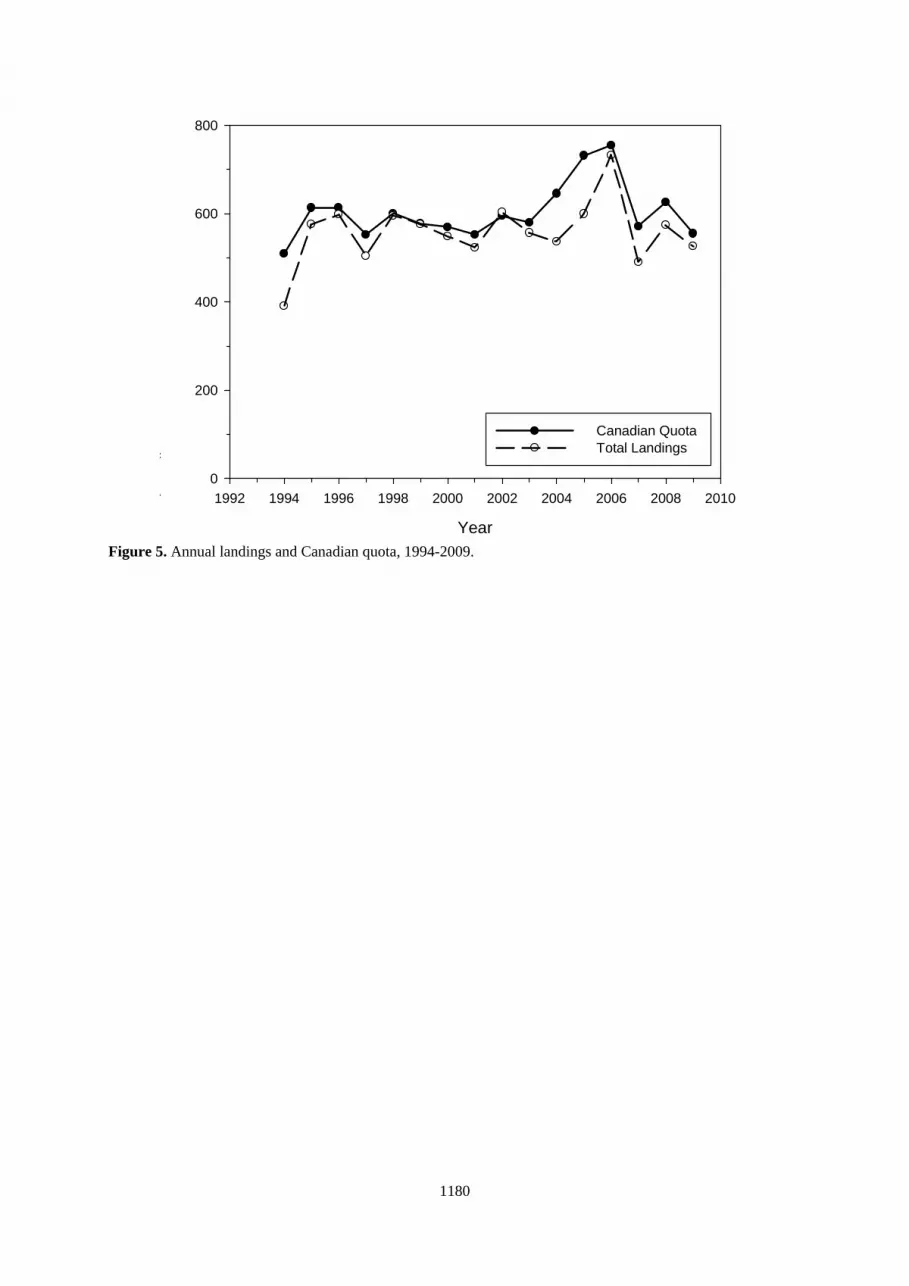
trips to catch 50% of the fish decreased from 1,935 in 2008 to 964 in 2009, while the percentage of 0-catches for the fleets decreased from 80% in 2008 to 65% in 2009. The number of active fishing vessels has increased in the southern Gulf of St. Lawrence fishery since 2007, with the highest in recent years occurring in 2009 (Figure 3). The median hours fished per trip (for vessels with ten or more trips each year) was somewhat variable from 1981 until 1996, at which time it leveled off until a slight increase in 2004. From 2005 to 2008 the median hours fished per trip remained constant until a sharp decline occurred in 2009 (Figure 4). The fishery off the coast of Nova Scotia showed similar temporal trends in 2007-2009, starting in July off the northern edge of Georges Banks and in the Hell Hole. Fishing effort gradually progressed to the mouth of the Bay of Fundy in August and St Margaret’s Bay, Canso and Halifax in September and October during which time it peaked. The number of vessels in this fishery has declined steadily since 2005 (Figure 3), primarily due to changes in management and increased opportunities to transfer their quota. Annual landings and Canadian quotas are shown in Figure 5. The annual quota, and consequently landings, have declined since 2006 to a level similar to the period from 1994-2003. A new management approach was implemented for the 2004 fishing season, which resulted in individual fleet sectors being assigned a specific share of the Canadian quota based on catch history. Fleets operate independently of each other, adopting their own strategies to address when and how to harvest the resource (Calcutt et al. 2006). The fishery has generally caught close to the available quota each year, particularly during the competitive fishery period. Fleet quotas are managed in real-time and the fishery is closed if it appears that the daily catch could potentially exceed the remaining level. As a result, there often remains some annual quota uncaught. 3. Data collection systems In Canada, submission of log records for the bluefin tuna fishery was initially done on a voluntary basis, although since 1994 it has been mandatory. While log record coverage has varied over the years, it has been assumed that what is available is representative of the fishery. The Canadian Atlantic statistical systems provide real time monitoring of catch and effort for all fishing trips. Since 1996, this system has applied to all fleets and included monitoring of all trips even when no fish were caught. At the completion of each fishing trip, independent and certified Dockside Monitors must be present for off-loading, and log record data must be submitted by each fisherman to the Monitoring Company that inputs the data into a central computer system. The computerized log records provide detailed information on catch (number and weight of tuna), size (individual weight and length), effort (hours fished), date, gear characteristics, home port (fleet) and catch location (latitude and longitude). Ideally, this ensures 100% coverage of properly completed log records and individual fish sizes. 4. Size composition and condition of catch 4.1 Trends in size composition
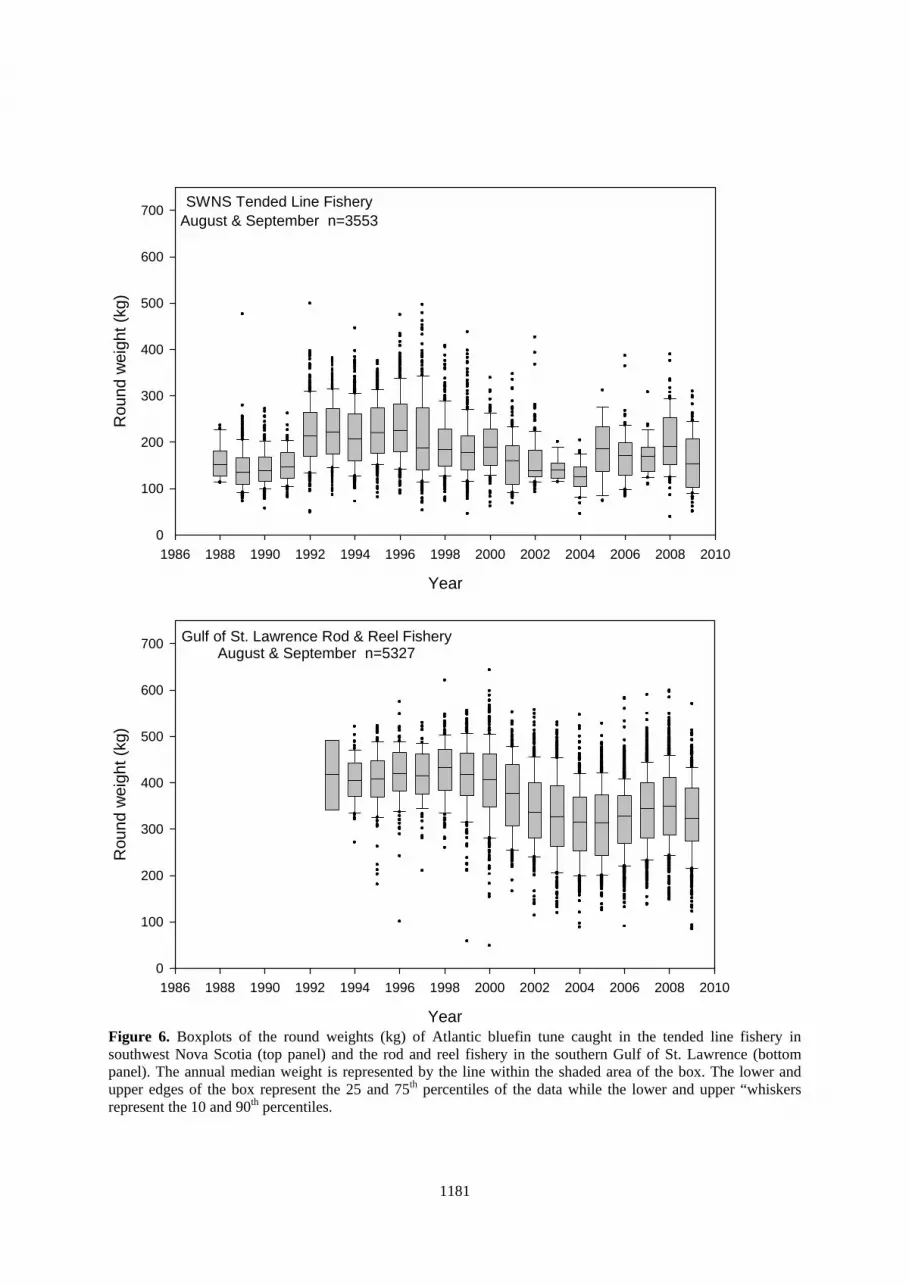
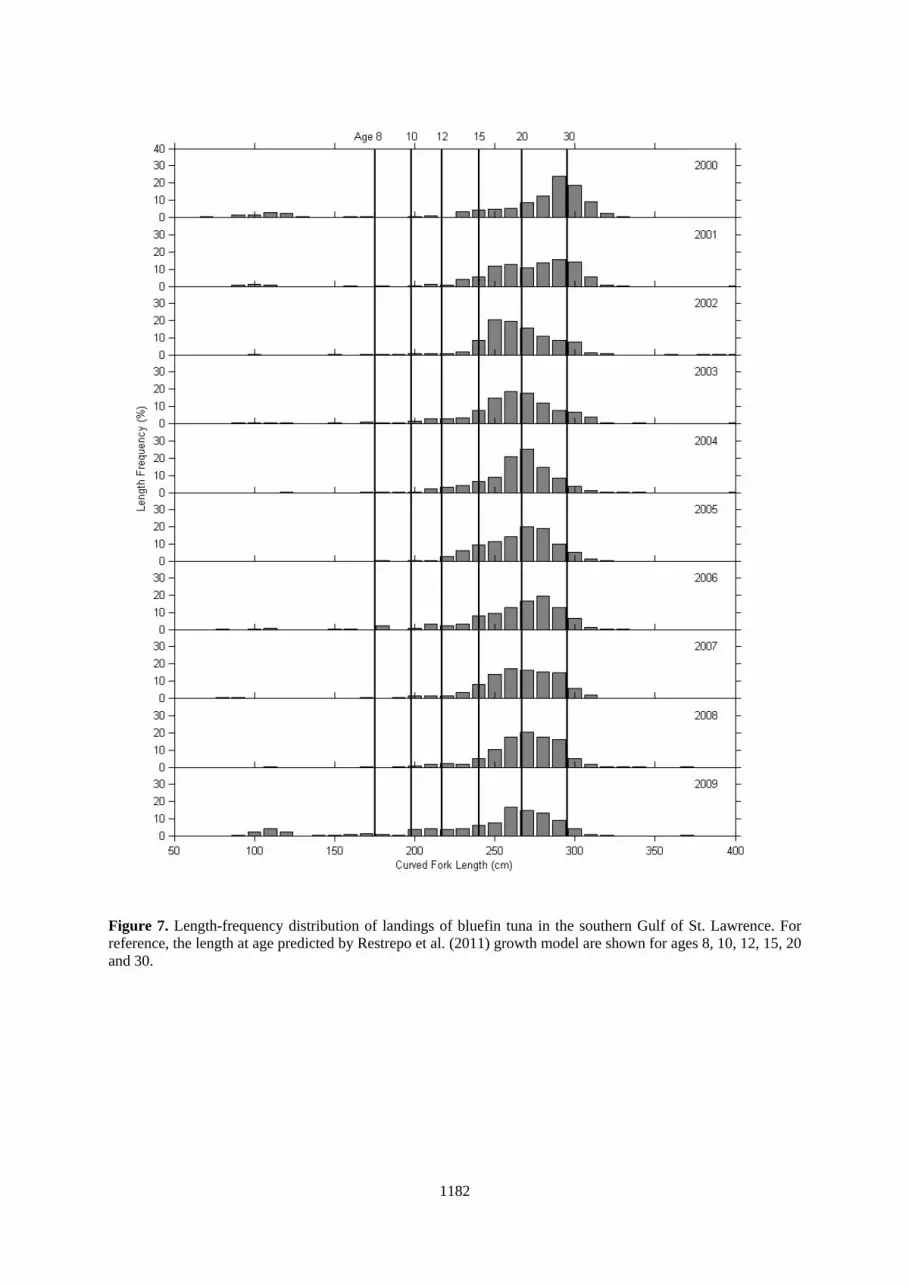
In the Southwest Nova Scotia Tended Line fishery the median round weight decreased in 2009 compared to the 4 previous years, similar to the trend observed in the southern Gulf of St. Lawrence (see below). Although the 2009 tended line fishery in Southwest Nova Scotia did not have the largest range in round weights, the second highest coefficient of variation for the series was observed in 2009. The decrease in the median round weight observed in 2009 was also the largest decrease observed between adjacent years although not the smallest median round weight observed in the series (smallest occurred in 2004). The decreasing trend in the median weight of the bluefin tuna caught in the southern Gulf of St. Lawrence observed since 2000 has reversed temporarily with the median weights increasing in 2006, 2007, and 2008. The median weight for the fish caught in 2009 decreased from 2008, although is not as low as the median round weight observed in 2005. This decrease in median weight corresponds to an increase in the number of smaller fish (< 200 cm) landed in 2009; an observation not seen since 2000 in the southern Gulf of St. Lawrence fishery (Figure 6). The range of round weights for the fish caught in 2009 is the second largest in the series (2006 had the largest range). Length-frequency information for the Gulf of St. Lawrence rod and reel fishery is shown in Figure 7. In 2000 and 2001 there was a greater portion of 300+ cm length classes. The ages, calculated from primary observer growth model presented in Neilson and Campana (2008), generally represent fish from ages 15 to 30 years.
1173
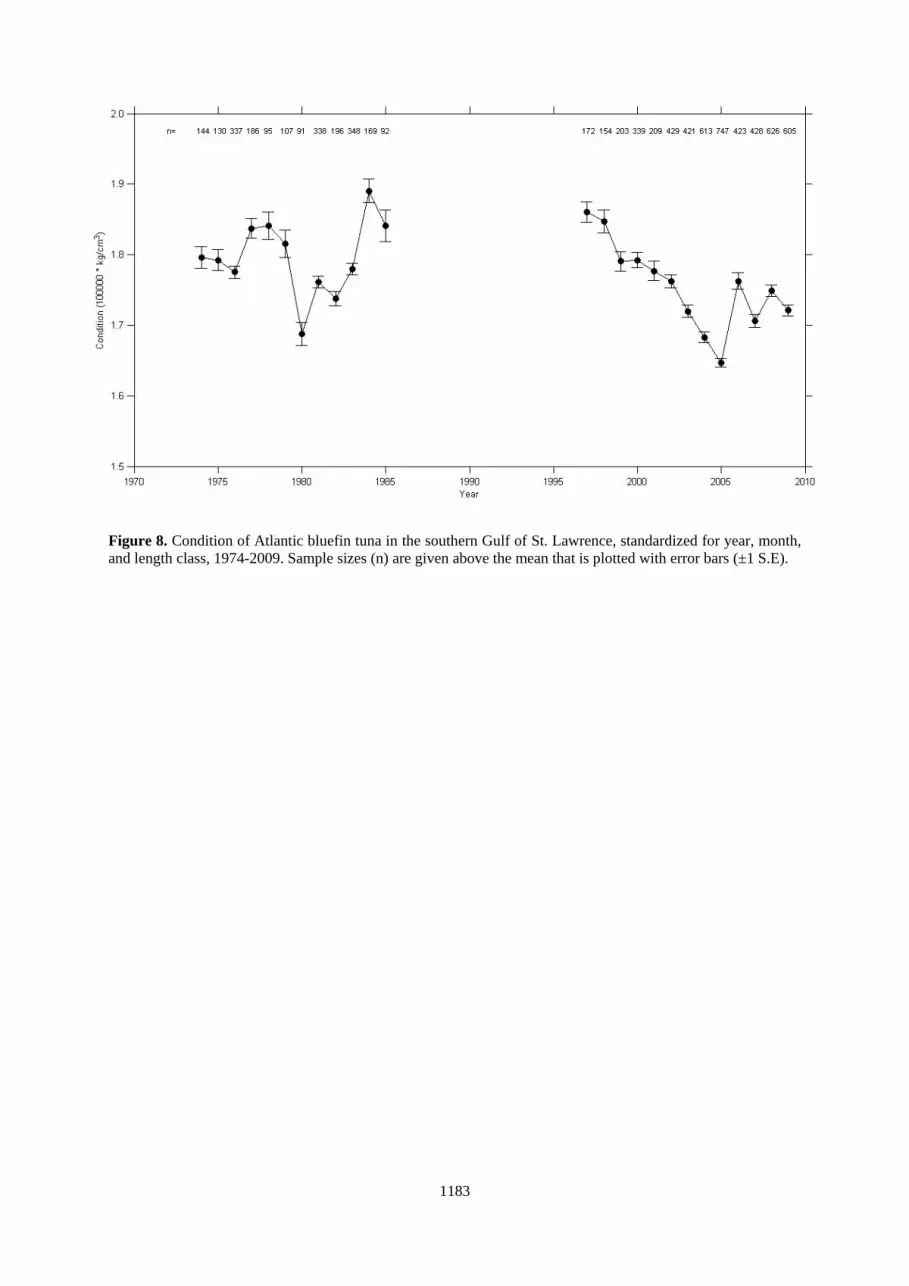
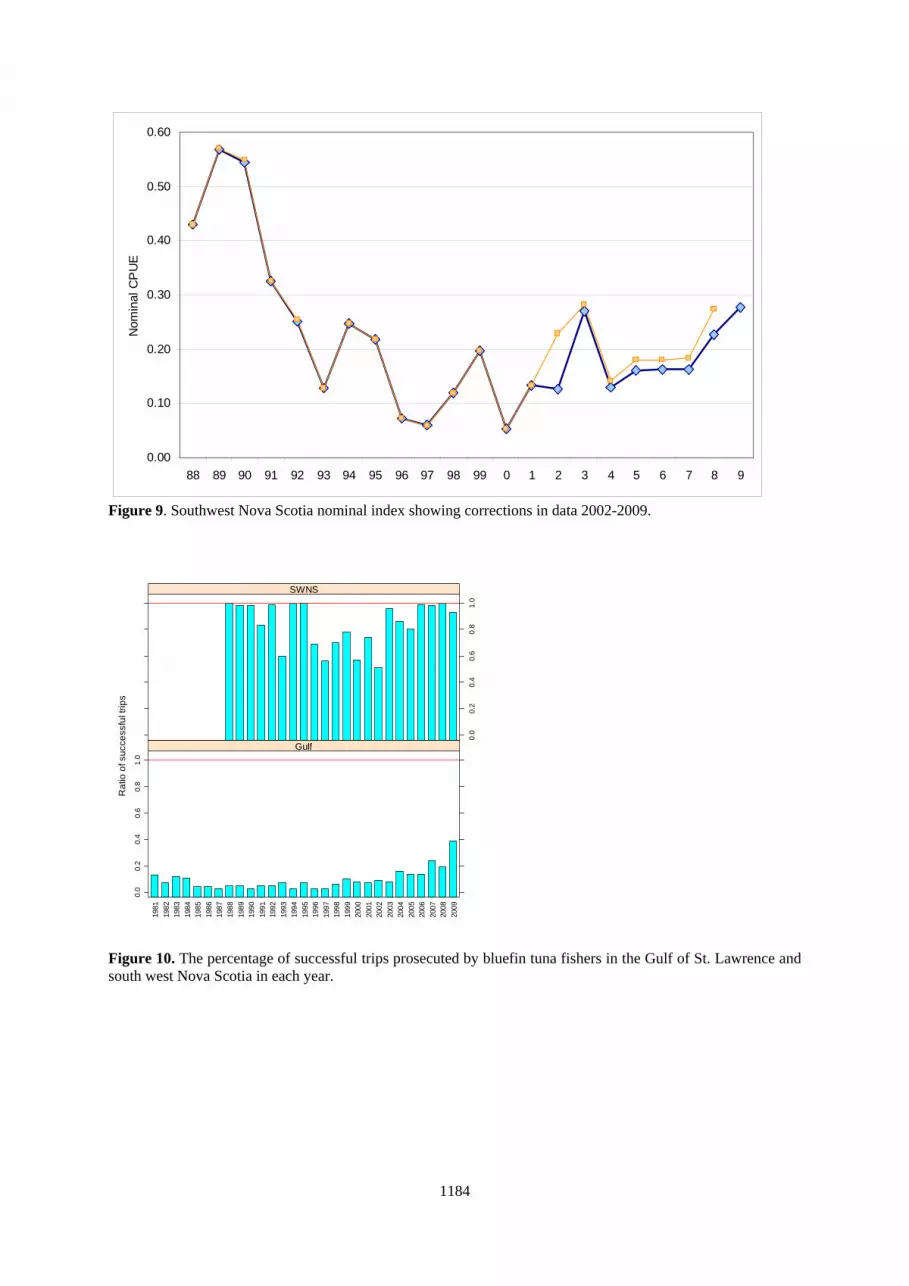
Several smaller fish (90 to 120 cm length class) were also caught in 2009, which has not been observed in the fishery since 2000. 4.2 Condition of the catch We calculated the annual average condition (Fulton’s K, W/L3 *100000), after standardizing for length class (20-cm length classes), month, and year (Figure 8). Data from 1986 through 1994 were excluded from the analyses due to low sampling effort (fewer than 90 annual observations). After a steady decline in the late 1990s through 2005, condition in the Gulf bluefin tuna increased in 2006 and has varied slightly though 2007, 2008 and 2009. The discrepancies between condition reported here for 2006 and 2007 and those of Neilson et al. (2009) that were the lowest condition factors reported for the series are due to only a small sample size being available at the time of Neilson et al. (2009) analyses. 5. Catch rate series As completed by Neilson et al. 2009, two separate standardized indices were developed based on (1) the spatial distribution of catches, (2) differences in the size of fish captured, and (3) patterns of nominal CPUE: Gulf of St. Lawrence tended line/rod and reel (1981-2009), and Southwest Nova Scotia tended line/harpoon/rod and reel (=Hell Hole plus Bay of Fundy, 1988-2009). Based on the von Bertalanffy growth parameters calculated by Turner and Restrepo (1994), the Southwest Nova Scotia fisheries capture bluefin tuna aged 7-13 and the Gulf of St. Lawrence fishery captures bluefin tuna aged 13+. These two series encompass the overall size/age range of tuna captured in the Canadian fishery and typically represent about 80% of the Canadian landings. 5.1 Catch and effort data Logbook data were edited and condensed to the trip level to provide total number of fish and total number of hours fished per trip by area, fleet, month and gear type. Catch per hour was the unit measure of effort selected for all fisheries used in the series. CPUE was calculated as the number of tuna captured per trip divided by total hours fished per trip. 5.1.1 Gulf of St. Lawrence The Gulf of St. Lawrence index was based on catch and effort data for vessels with 10+ trips per year and included observations for 28 years (1981-2009), three months (August, September, October), two fleets (Prince Edward Island and Gulf Nova Scotia) and two gear types (tended line, rod and reel) (n=79,509 trips). The 10+ trip threshold restricts the analysis to full time, experienced fishermen that fish the main months of the fishery (August-October). Trips with CPUE=0 were included in the series and typically represented over 90% of the observations; however, this has been declining in recent years. 5.1.2 Southwest Nova Scotia Catch and effort data aggregated by trip from the Hell Hole (1988-2009) and Bay of Fundy (1992-2009) areas were combined and used in the development of a standardized CPUE series for Southwest Nova Scotia (see Stone et al. 2001). The data set used for CPUE standardization included observations for 22 years (1988-2009), two areas (Hell Hole, Bay of Fundy), five fleet sectors (Nova Scotia, Prince Edward Island, Quebec, Gulf Nova Scotia, Gulf New Brunswick), three gear types (rod and reel, tended line, harpoon), and three months (August, September, October) (n=5,553 trips). The current analysis reflects a change in the number of trips and the resulting CPUE since 2002. A programming bug was fixed which corrected repeating records in the data. Although the point estimates for nominal CPUE has changed, the trend is consistent (Figure 9). 5.2 Models and specifications Models were based on formulations used in the last formal Bluefin tuna stock assessment for the South West Nova Scotia and Gulf of St. Lawrence fisheries (Neilson et al., 2009).
Relative indices for the delta model formulation were calculated as the product of the year effect least square means (LSMeans) from the binomial and the lognormal model components. LSMeans of lognormal positive trips
1174
were bias corrected using Lo et al. (1992) algorithms. Analyses were done using the GLM and LME procedures from the R statistical computer software (R Development Core Team, 2010).
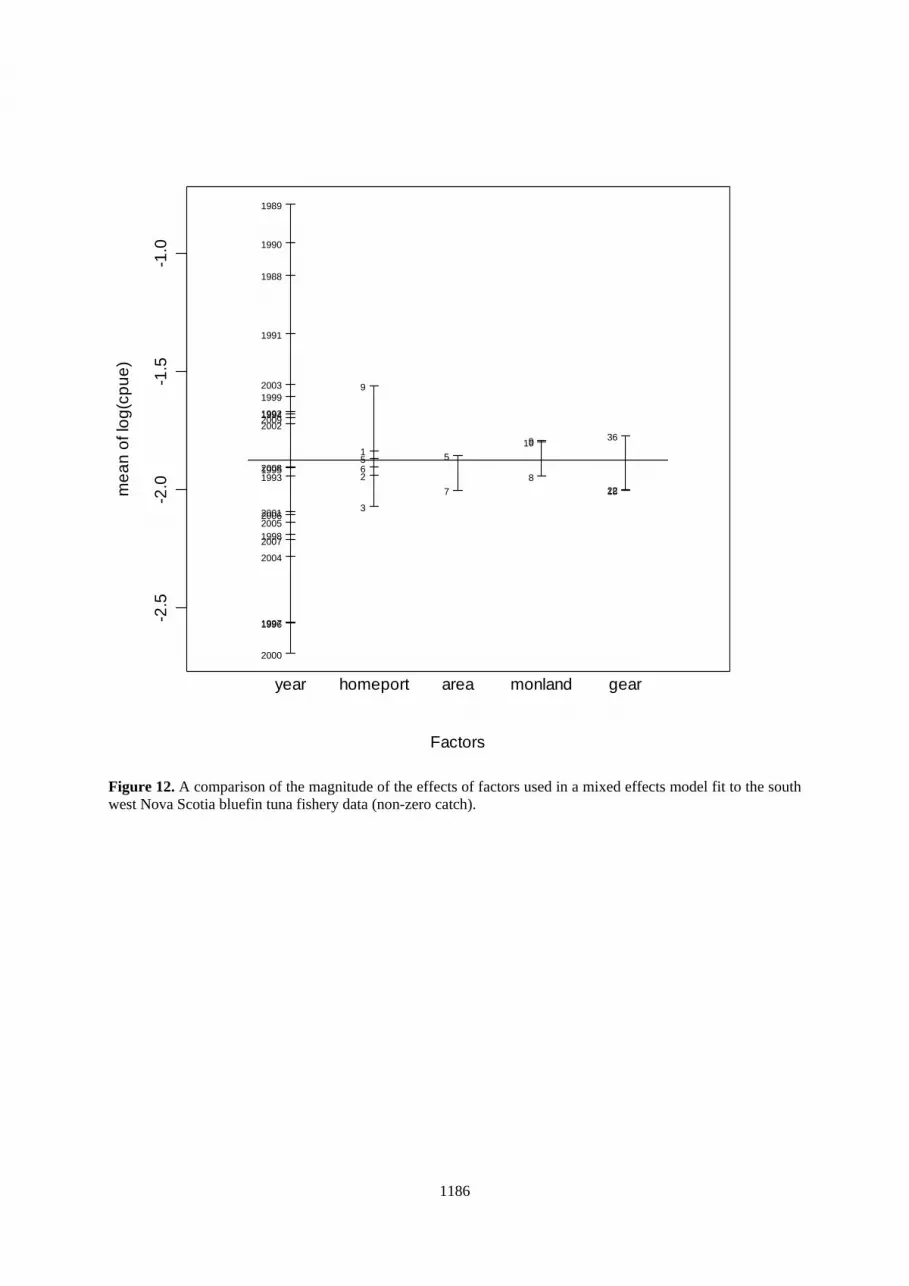
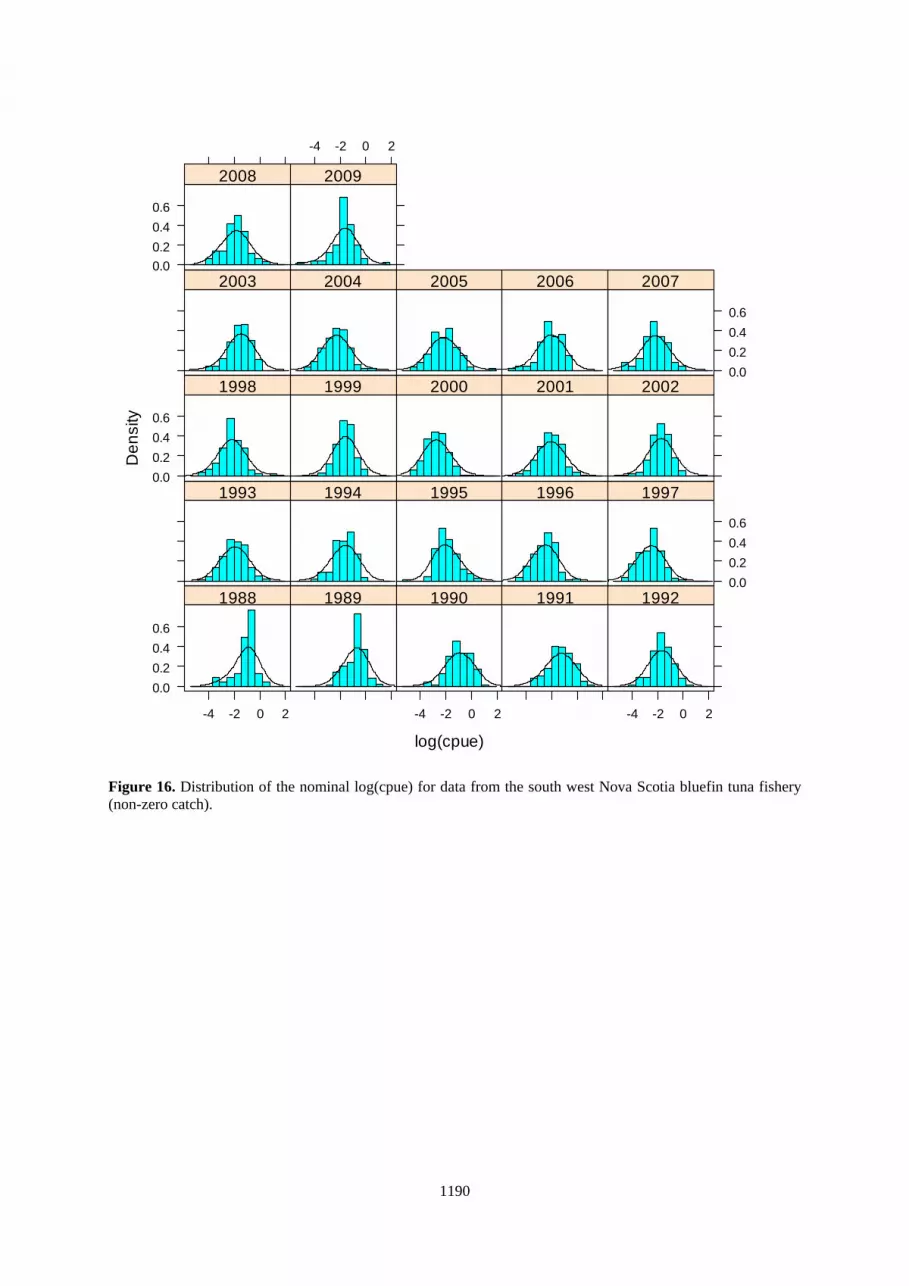
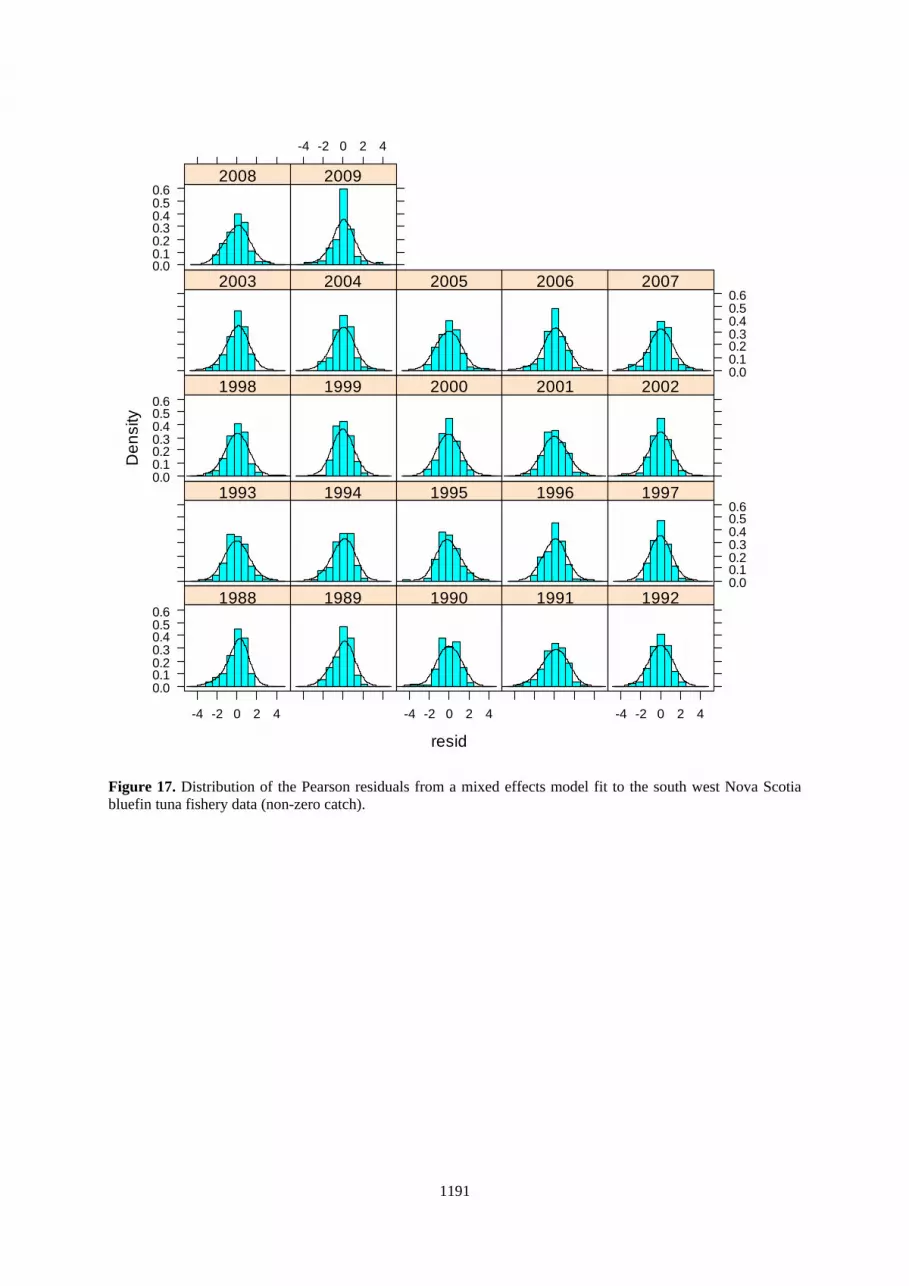
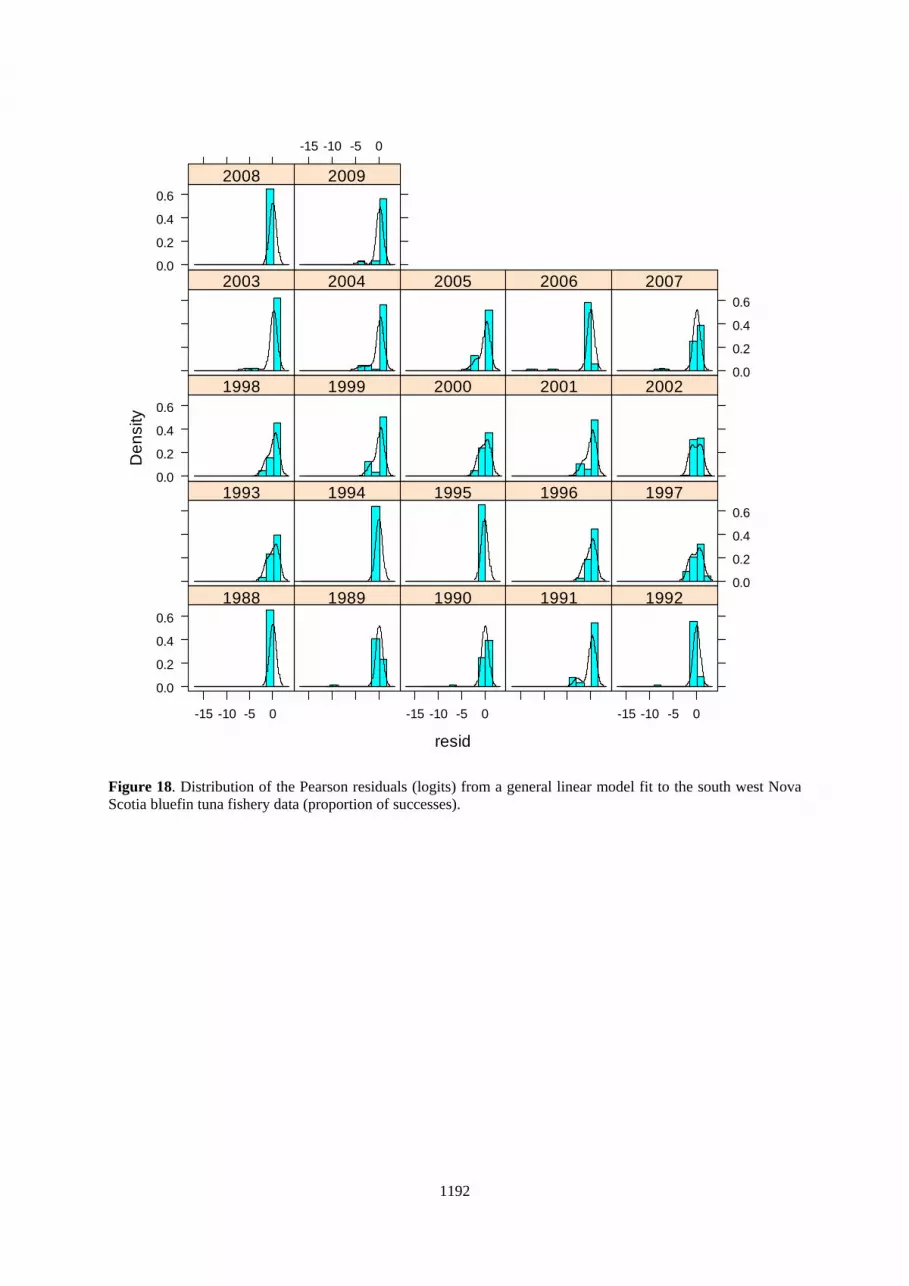
For the Southwest Nova Scotia standardized series, the final models that were combined using the delta-binomial method with random effects to produce a single index included the following variables (see Figures 10 to 20 for diagnostic plots):
Proportion positive: Fixed effects: year + gear + area + month
Positive catch rates:
Fixed effects: year + homeport + area Random effects: ~1|year/homeport, ~1|gear, ~1|month
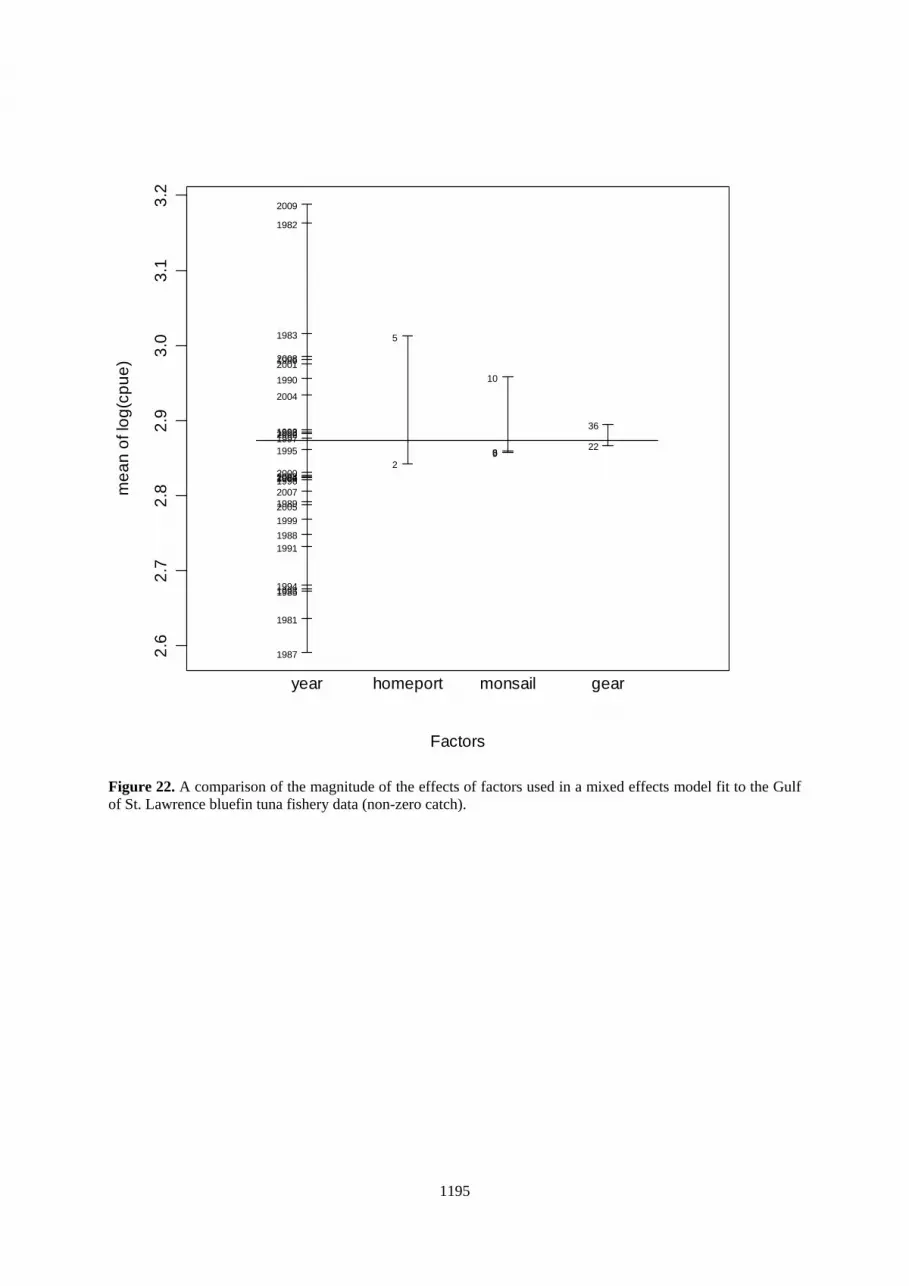
For the Gulf of St. Lawrence standardized series, the final models that were combined using the delta-binomial method with random effects to produce a single index that included the following variables (see Figures 22 to 30 for diagnostic plots):
Fixed effects: year + month + gear + homeport Random effects: ~1|year/homeport, ~1|gear, ~1|month
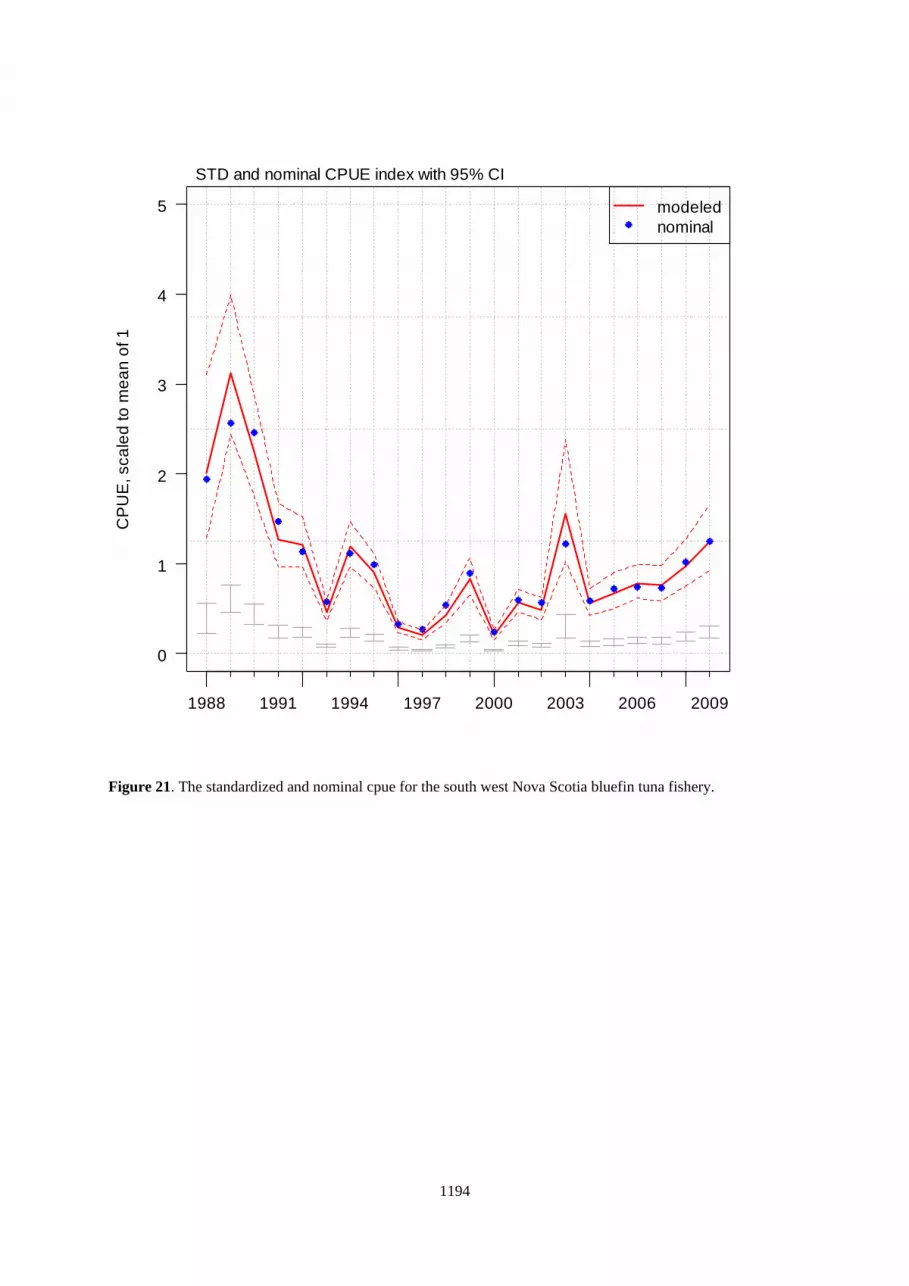
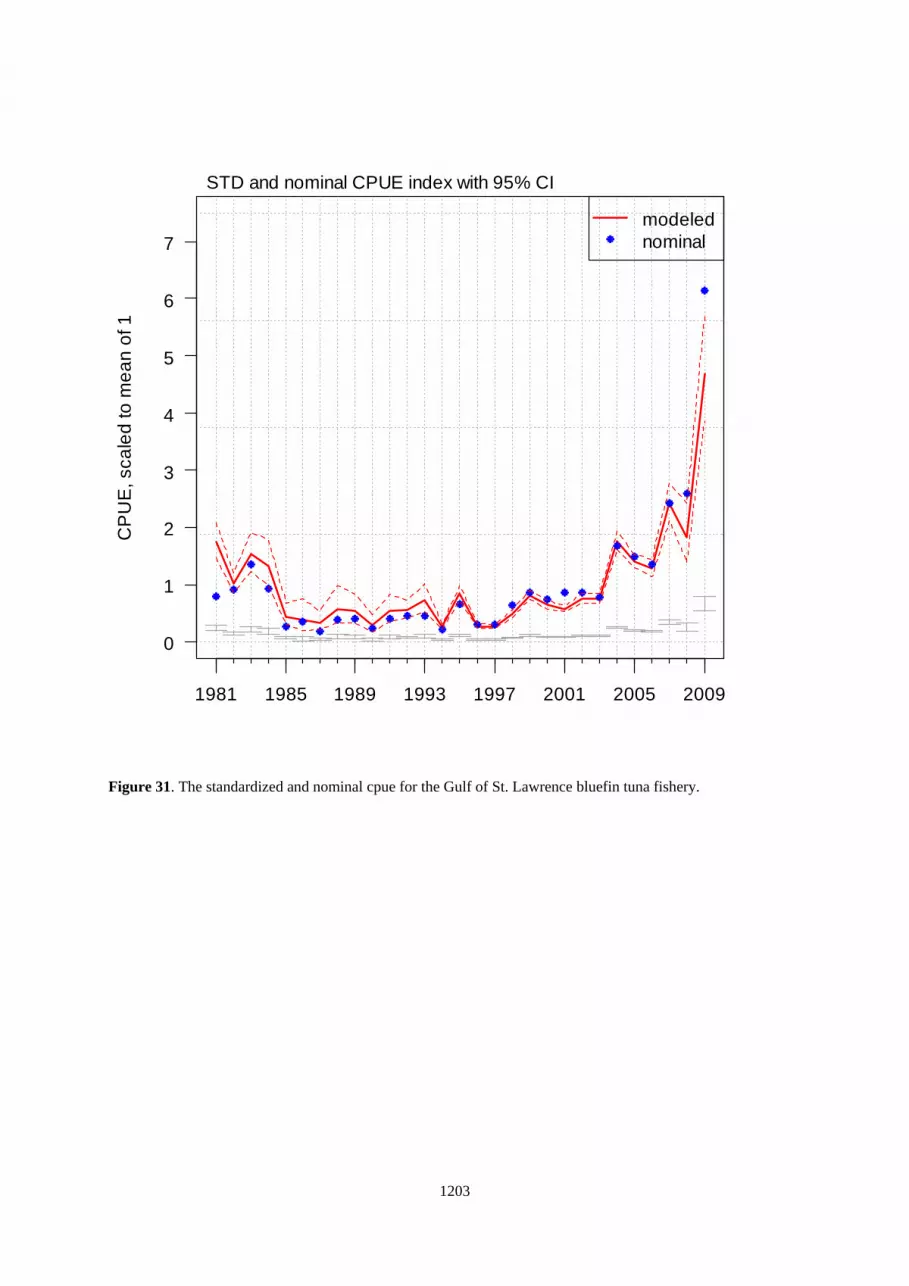
5.3 CPUE standardization Catch rates in the southern Gulf of St. Lawrence increased slightly from 1997 to 2003, rapidly increased in 2004 and have remained high. Catch rates have been increasing steadily since 2006, with an exceptionally high value in 2009 (Table 1, Figure 31). In 2009, the number of trips used in the calculation of CPUE was reduced dramatically due to the ‘10+ trips’ rule. Anecdotal reports indicate that the quota was caught so quickly in 2009 that many fishers were unable to accrue more than 10 trips in the season. The Southwest Nova Scotia CPUE series has had a fairly stable trend through the mid- to late 1990’s (Table 2, Figure 21). Catch rates remained relatively constant from 2005-2007 and have increased in 2008 and 2009. The standardized series developed for both the Gulf and SWNS fisheries continue to follow the nominal series fairly closely (Figure 21 and Figure 31). The catch rates since 2004 for the Gulf series continues to increase faster than those in SWNS. 6. Conclusions and recommendations The two abundance indices for the Canadian fisheries presented here are following increasing trends, most notably for the southern Gulf of St. Lawrence. The CPUE series presented here as indices of abundance have some caveats, as do all such series. While fishermen generally agree that the abundance of fish has increased in the past four years, it is recognized that there are factors affecting the operation of the fishery that are not currently considered in this analyses (ie. changes in gear, changes in management approach, and a recent cooling trend in the southern Gulf). The impacts of such factors on the catch rate series remain sources of uncertainty in the current analysis, and could be profitable areas for further research. It will be important to return to the original data and examine the effect that the “10 trip rule” has on our interpretation of the recent trend in the Gulf of St. Lawrence catch rate time series. The need for this type of action is supported by indications of how quickly the fish were caught relative to previous years , the decreasing percentage of 0-catch trips, and the lower median hours fished by the fleets. Also, the rule may now no longer
1175
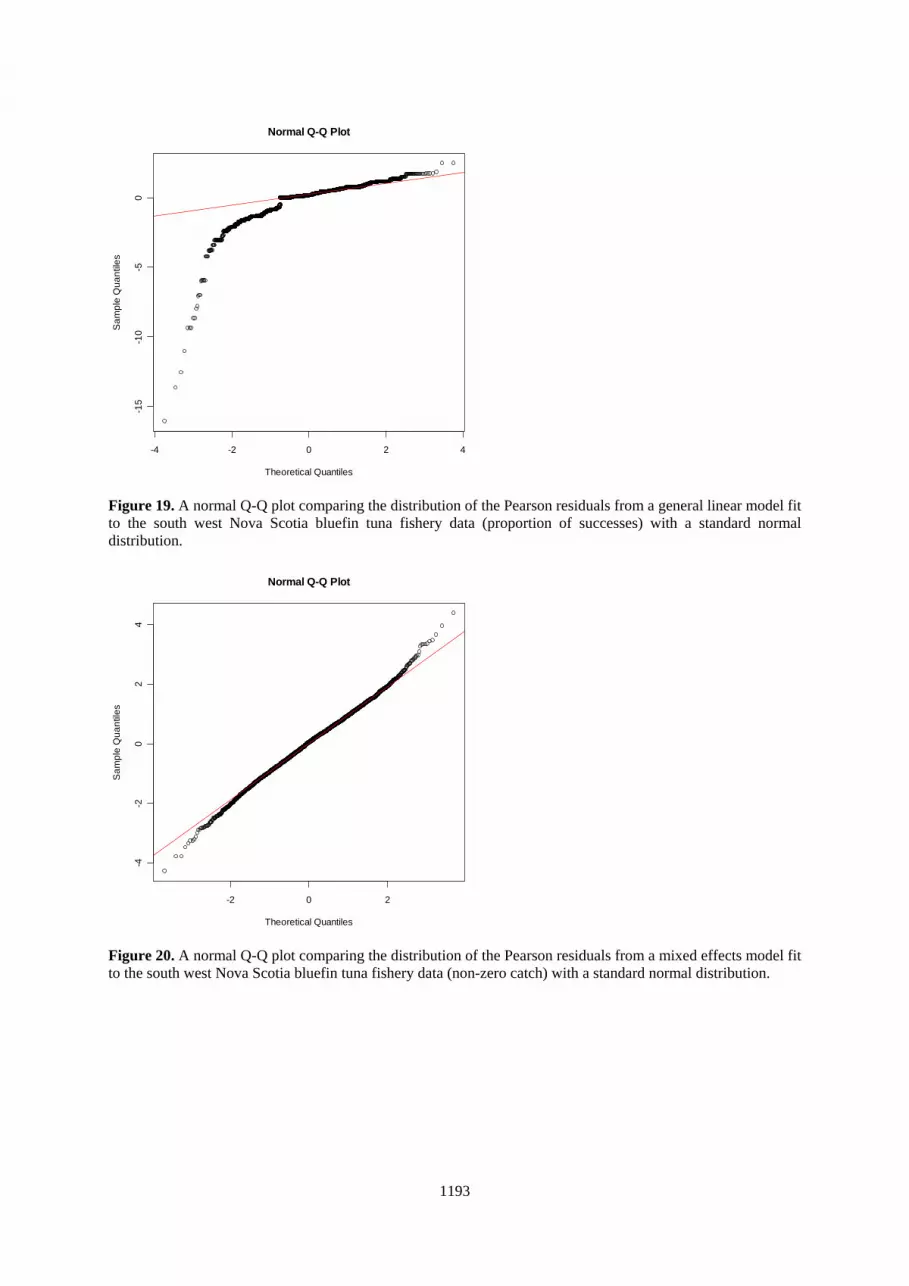
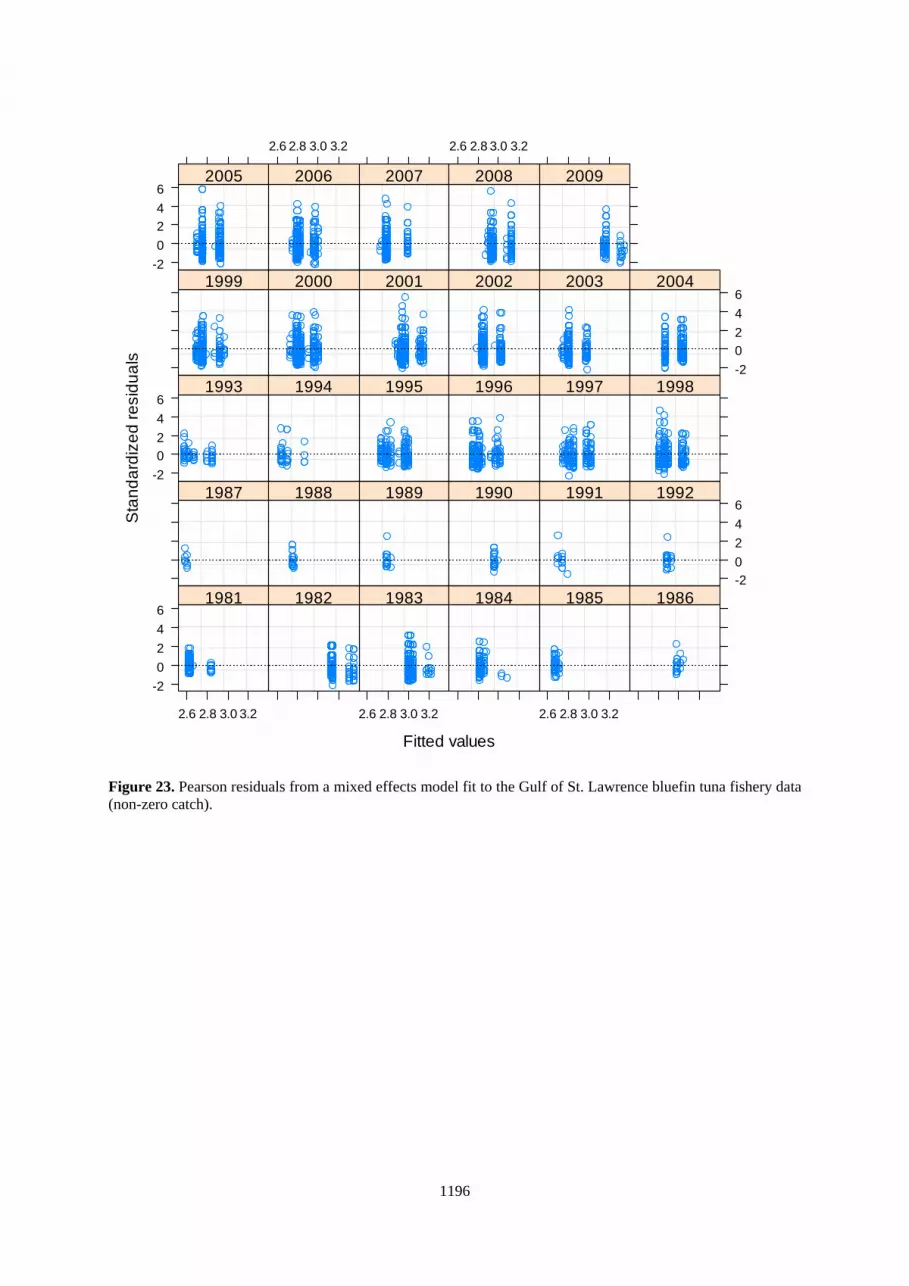
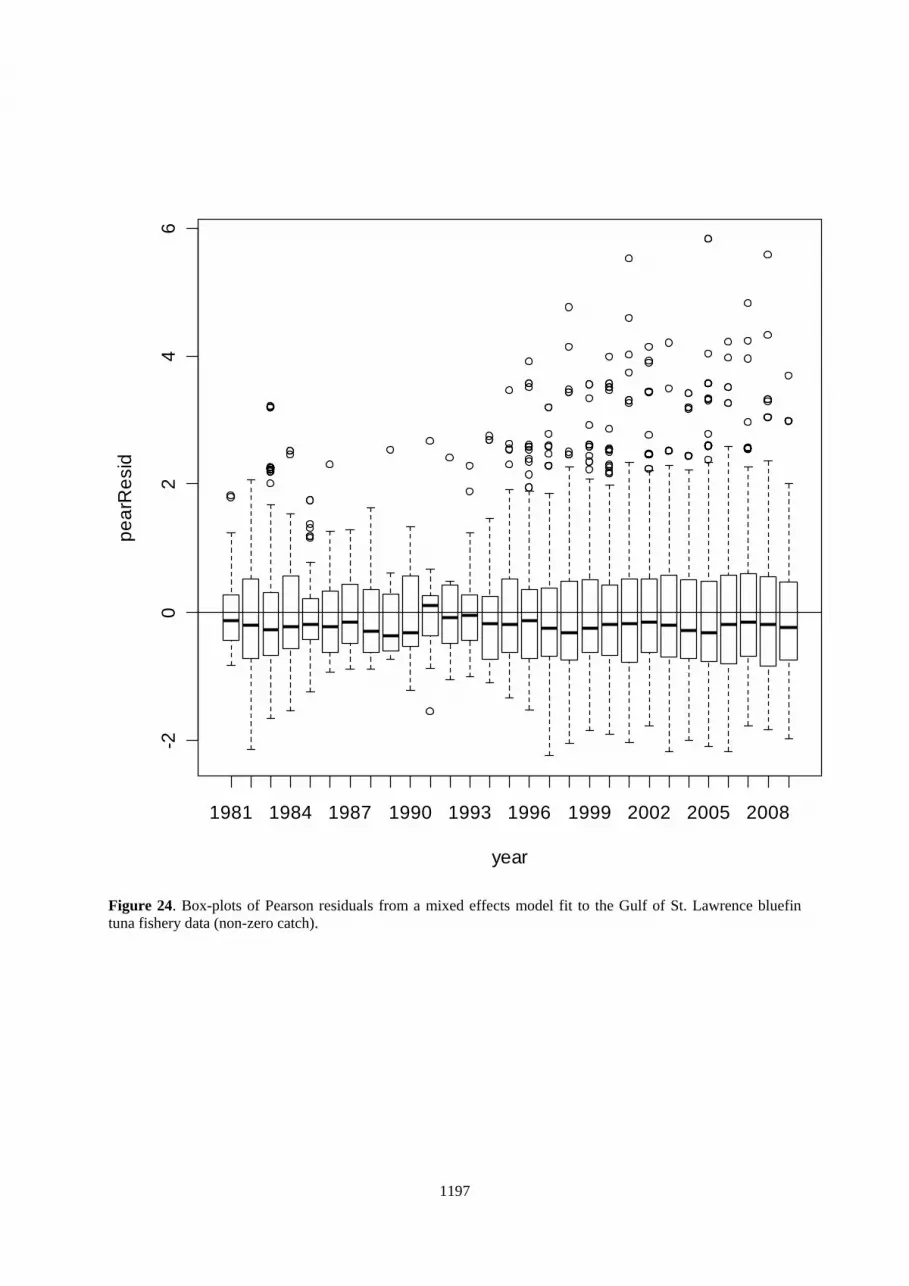
have the intended effect of removing the less experienced fishers. It could be selecting against the more experienced fishers. Finally, discussion with the fishers is necessary to determine further perspective. Examination of the model diagnostics and the patterns in the raw data suggests that it will be important to investigate other distributions when modelling the proportions positive and positive catch data of both the Gulf of St. Lawrence and Southwest Nova Scotia catch rate series. For example, the positive catch data from the Gulf may be better represented by a Poisson distribution with an offset for the hours fished. There is evidence that the variance varies across levels of the factors in the different models. Therefore, it may be necessary to test heteroscedastic models. 7. Literature cited Anon. 2009, Report of the 2008 ICCAT SCRS Bluefin Tuna Stock Assessment Session. Collect. Vol. Sci. Pap.
ICCAT, 64(1): 1-352. Calcutt, M., Paul, S., Neilson, J.D., and McMaster A. 2005. National Report of Canada, 2004. In Report for
Biennial Period, 2004-05, Part I (2004) – Vol. 3 – Annual Reports. Neilson, J.D., Smith, S., Ortiz, M. and Lester, B. 2009, Indices of stock status obtained from the Canadian
bluefin tuna fishery. Collect. Vol. Sci. Pap. ICCAT, 64(2): 380-404. Neilson, J.D. and Campana, S.E. 2008, A validated description of age and growth of western Atlantic bluefin
tuna (Thunnus thynnus L.). Can. J. Fish. Aquat. Sci. 65; 1523-1527. Turner, S.C. and Restrepo, V.R. 1994, A review of the growth rate of West Atlantic bluefin tuna, Thunnus
thynnus, estimated from marked and recaptured fish. Collect. Vol. Sci. Pap. ICCAT, 42(1): 170-172. Restrepo, V.R., Diaz, G.A., Walter, J.F., Neilson, J., Campana, S.E., Secor, D. and Wingate, R.L. 2011, Updated
estimate of the growth curve of western Atlantic bluefin tuna. Aquat. Living Resour., 23: 335-342. R Development Core Team. 2010, R: A language and environment for statistical computing. R Foundation for Statistical Computing, Vienna, Austria. ISBN 3-900051-07-0, URL http://www.R-project.org.
1176
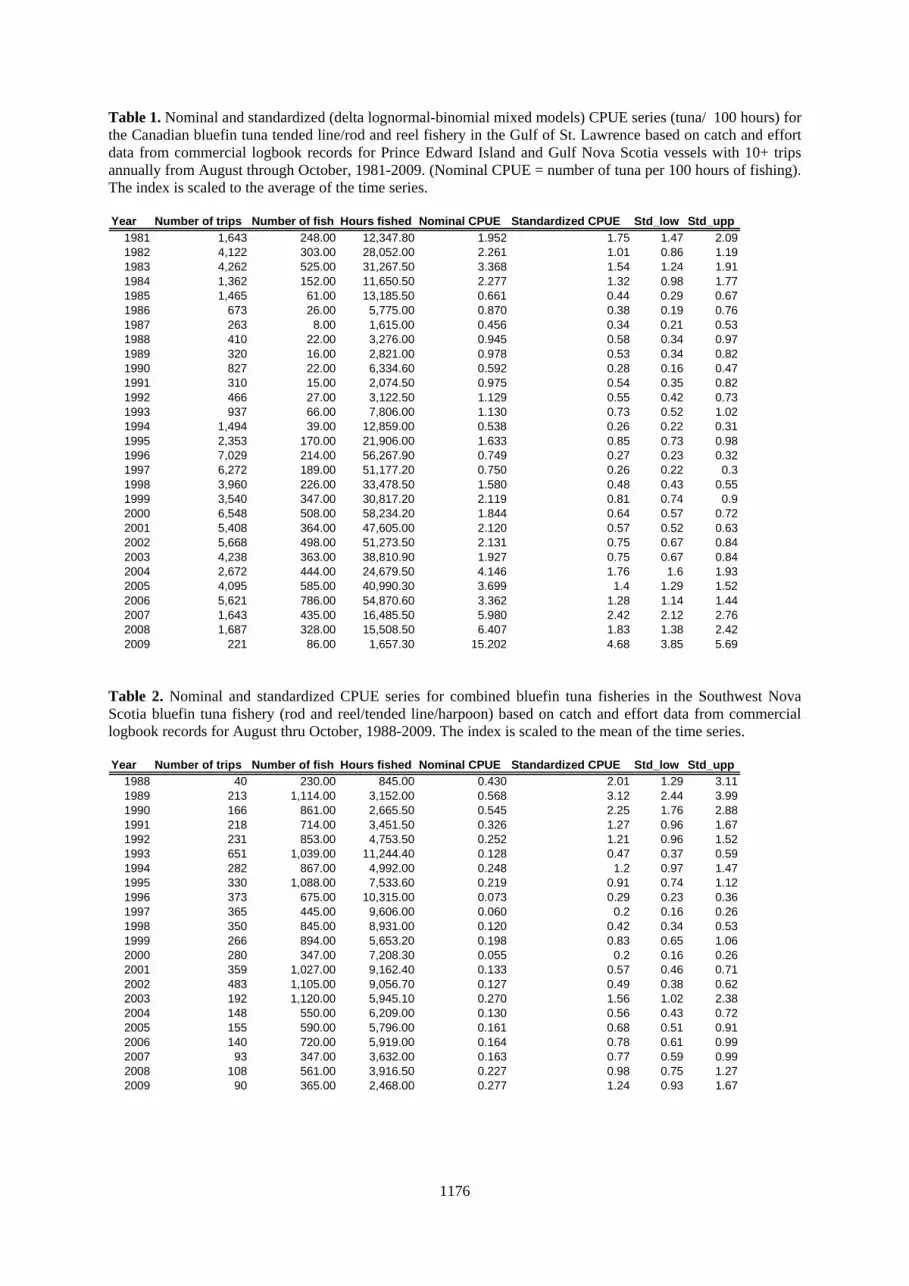
Table 1. Nominal and standardized (delta lognormal-binomial mixed models) CPUE series (tuna/ 100 hours) for the Canadian bluefin tuna tended line/rod and reel fishery in the Gulf of St. Lawrence based on catch and effort data from commercial logbook records for Prince Edward Island and Gulf Nova Scotia vessels with 10+ trips annually from August through October, 1981-2009. (Nominal CPUE = number of tuna per 100 hours of fishing). The index is scaled to the average of the time series. Year Number of trips Number of fish Hours fished Nominal CPUE Standardized CPUE Std_low Std_upp
Table 2. Nominal and standardized CPUE series for combined bluefin tuna fisheries in the Southwest Nova Scotia bluefin tuna fishery (rod and reel/tended line/harpoon) based on catch and effort data from commercial logbook records for August thru October, 1988-2009. The index is scaled to the mean of the time series. Year Number of trips Number of fish Hours fished Nominal CPUE Standardized CPUE Std_low Std_upp
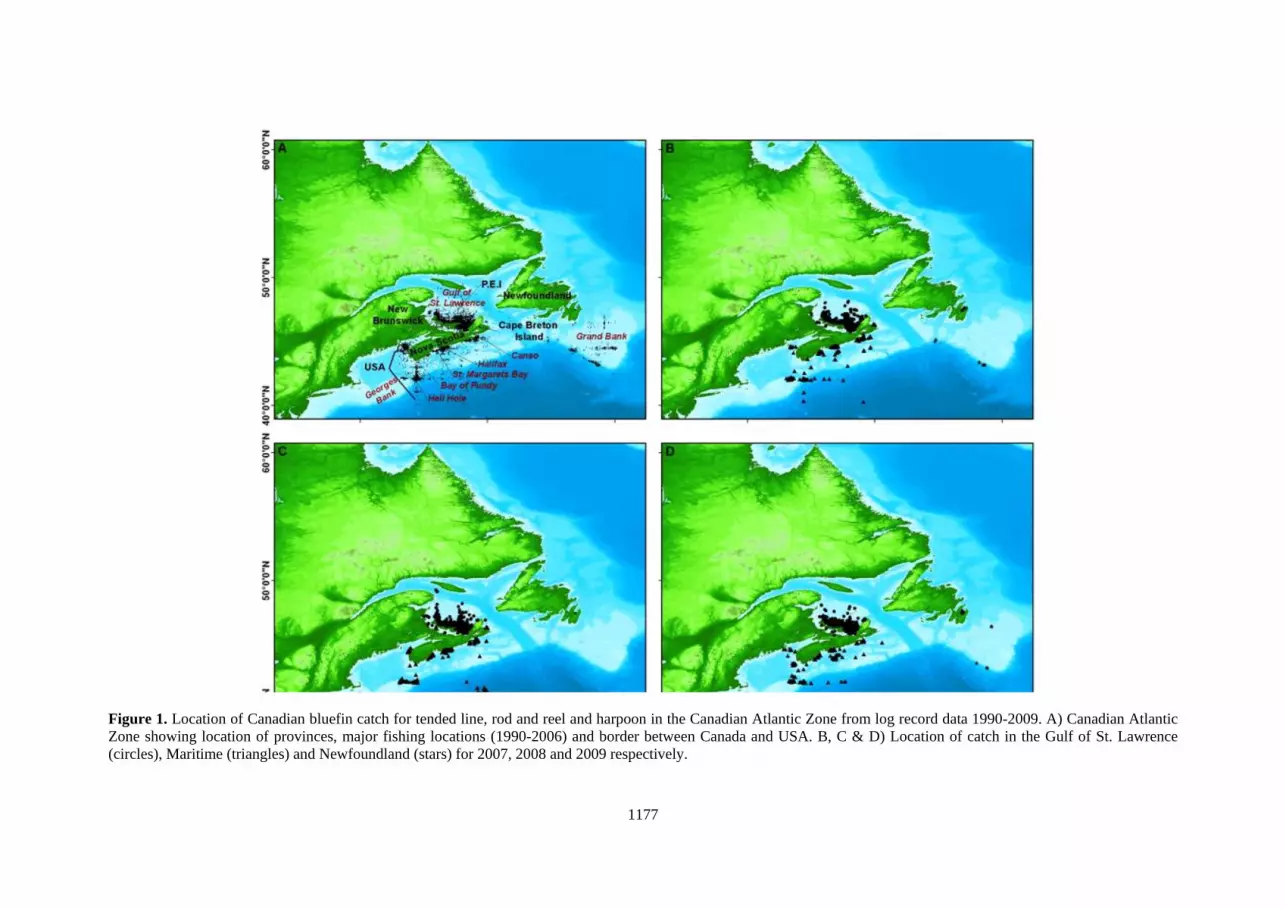
Figure 1. Location of Canadian bluefin catch for tended line, rod and reel and harpoon in the Canadian Atlantic Zone from log record data 1990-2009. A) Canadian Atlantic Zone showing location of provinces, major fishing locations (1990-2006) and border between Canada and USA. B, C & D) Location of catch in the Gulf of St. Lawrence (circles), Maritime (triangles) and Newfoundland (stars) for 2007, 2008 and 2009 respectively.
1178
2007 2008 2009
Figure 2. Location of Canadian bluefin catch by gear (TL = Tended Line (top), RR = Rod and Reel (middle) & HP = Harpoon (bottom)) in the Gulf of St. Lawrence, off Nova Scotia and Newfoundland from log record data for 2007, 2008 and 2009.
1179
Year
2002 2003 2004 2005 2006 2007 2008 2009
Nb
fA
tiV
0
100
200
300
400
500
GULF SWNS
Figure 3. Number of vessels active in the Gulf of St. Lawrence and Southwest Nova Scotia fisheries, 2002-2009.
1980 1984 1988 1992 1996 2000 2004 2008
0
10
20
30
40
50
60
Figure 4. Median hours fished per trip in the Gulf of St. Lawrence fishery, 1981-2009. The annual median is indicated by the line within the shaded box. The lower and upper edges of the box represent the 25th and 75th percentiles of the data while the lower and upper “whiskers” represent the 10th and 90th percentiles.
1180
Year
1992 1994 1996 1998 2000 2002 2004 2006 2008 2010
Ld
i(t
0
200
400
600
800
Canadian Quota Total Landings
Figure 5. Annual landings and Canadian quota, 1994-2009.
Figure 6. Boxplots of the round weights (kg) of Atlantic bluefin tune caught in the tended line fishery in southwest Nova Scotia (top panel) and the rod and reel fishery in the southern Gulf of St. Lawrence (bottom panel). The annual median weight is represented by the line within the shaded area of the box. The lower and upper edges of the box represent the 25 and 75th percentiles of the data while the lower and upper “whiskers represent the 10 and 90th percentiles.
1182
Figure 7. Length-frequency distribution of landings of bluefin tuna in the southern Gulf of St. Lawrence. For reference, the length at age predicted by Restrepo et al. (2011) growth model are shown for ages 8, 10, 12, 15, 20 and 30.
1183
Figure 8. Condition of Atlantic bluefin tuna in the southern Gulf of St. Lawrence, standardized for year, month, and length class, 1974-2009. Sample sizes (n) are given above the mean that is plotted with error bars (±1 S.E).
Figure 9. Southwest Nova Scotia nominal index showing corrections in data 2002-2009.
Ra
tio o
f su
cce
ssfu
l trip
s
0.0
0.2
0.4
0.6
0.8
1.0
1981
1982
1983
1984
1985
1986
1987
1988
1989
1990
1991
1992
1993
1994
1995
1996
1997
1998
1999
2000
2001
2002
2003
2004
2005
2006
2007
2008
2009
Gulf
0.0
0.2
0.4
0.6
0.8
1.0
SWNS
Figure 10. The percentage of successful trips prosecuted by bluefin tuna fishers in the Gulf of St. Lawrence and south west Nova Scotia in each year.
1185
Ratio of successful trips
Pe
rce
nt o
f To
tal
0
20
40
60
80
0.0 0.2 0.4 0.6 0.8 1.0
Gulf
0.0 0.2 0.4 0.6 0.8 1.0
SWNS
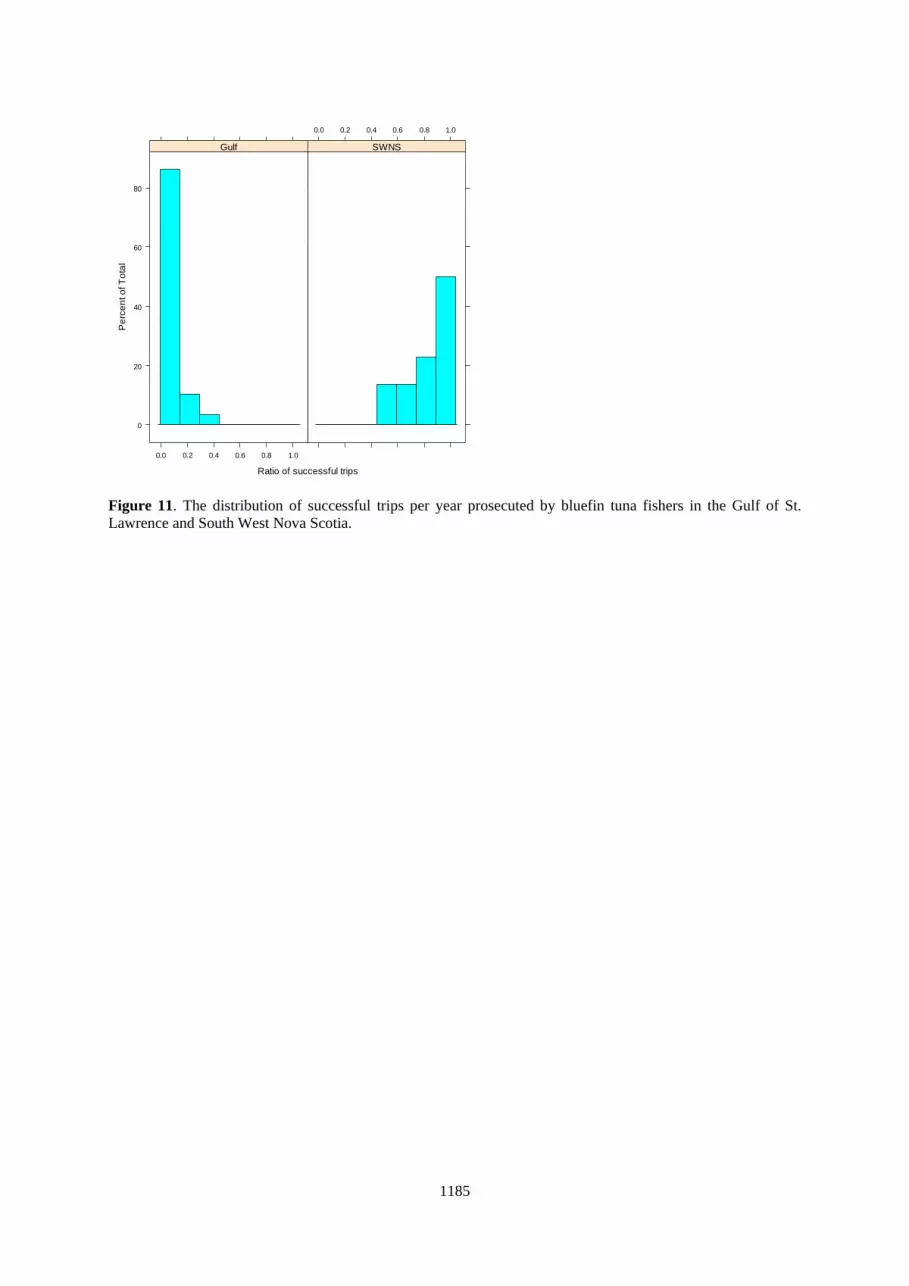
Figure 11. The distribution of successful trips per year prosecuted by bluefin tuna fishers in the Gulf of St. Lawrence and South West Nova Scotia.
1186
-2.5
-2.0
-1.5
-1.0
Factors
me
an
of l
og
(cp
ue
)
1988
1989
1990
1991
1992
1993
1994
1995
19961997
1998
1999
2000
2001
2002
2003
2004
20052006
2007
2008
2009
1
2
3
56
9
5
7
8
910
1822
36
year homeport area monland gear
Figure 12. A comparison of the magnitude of the effects of factors used in a mixed effects model fit to the south west Nova Scotia bluefin tuna fishery data (non-zero catch).
1187
Fitted values
Sta
nd
ard
ize
d r
esi
du
als
-4-20
24
-3.0 -2.0 -1.0
1988 1989
-3.0 -2.0 -1.0
1990 1991
-3.0 -2.0 -1.0
1992
1993 1994 1995 1996
-4-20
24
1997-4-2
024
1998 1999 2000 2001 2002
2003 2004 2005 2006
-4-2024
2007-4
-2024
2008
-3.0 -2.0 -1.0
2009
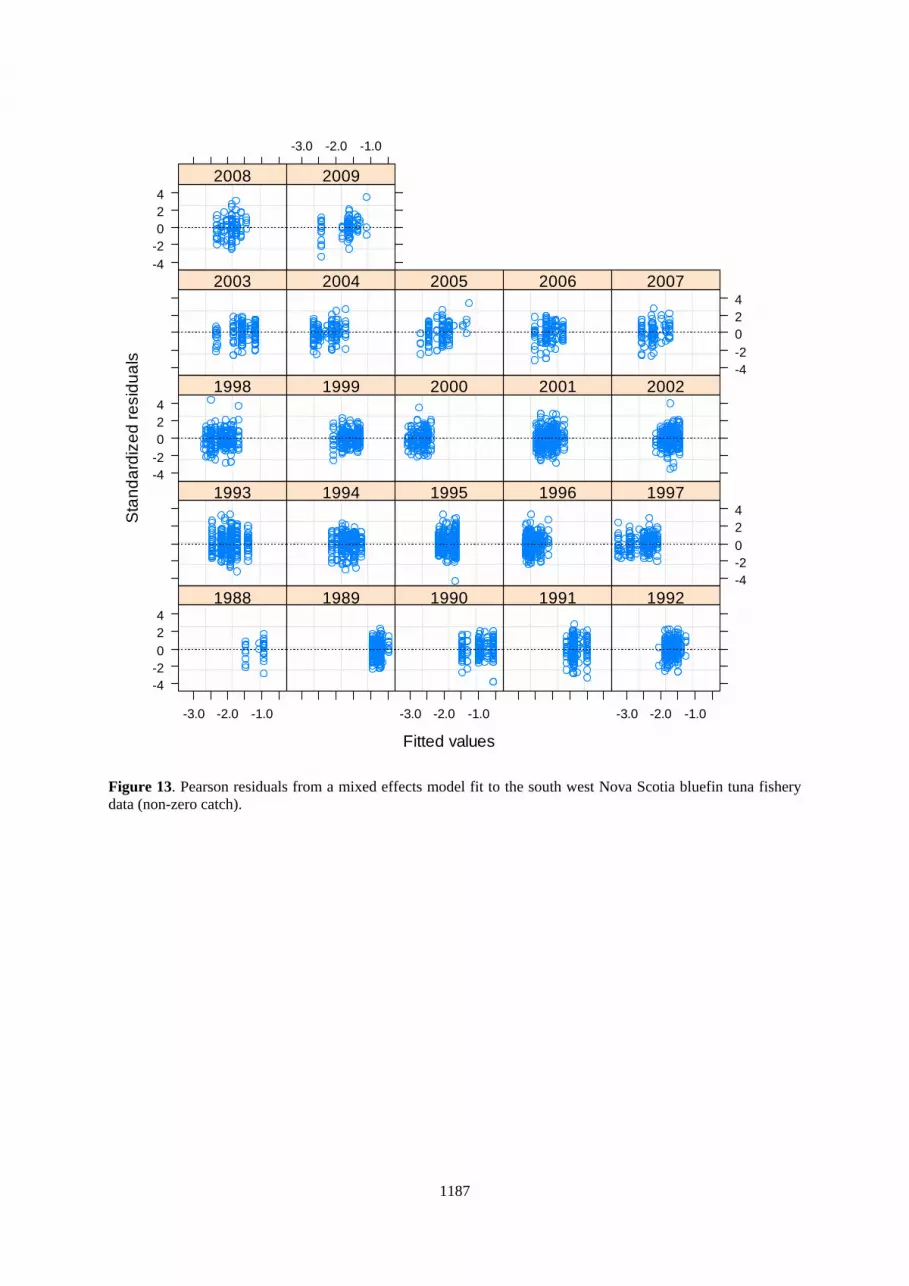
Figure 13. Pearson residuals from a mixed effects model fit to the south west Nova Scotia bluefin tuna fishery data (non-zero catch).
1188
1988 1991 1994 1997 2000 2003 2006 2009
-4-2
02
4
year
pe
arR
esi
d
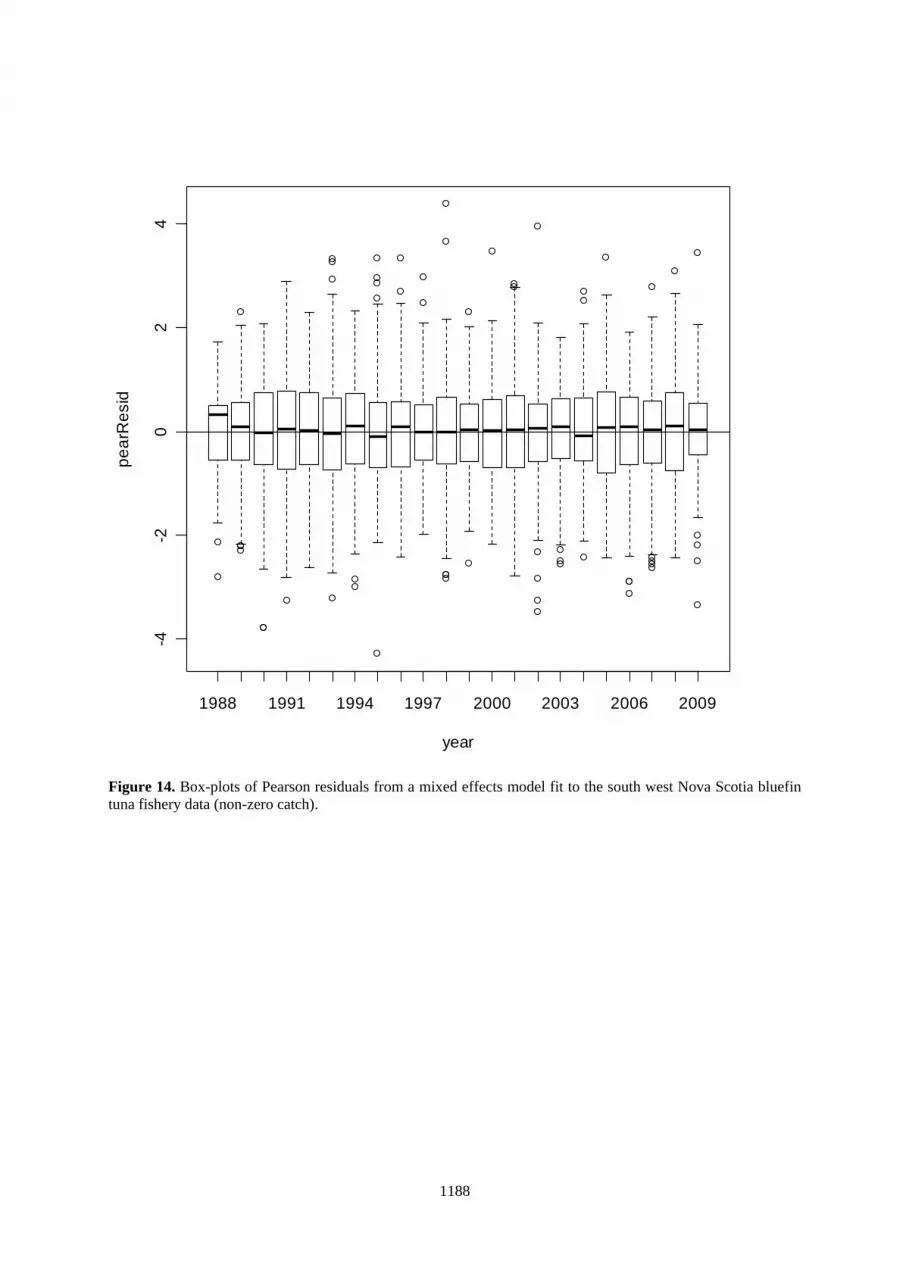
Figure 14. Box-plots of Pearson residuals from a mixed effects model fit to the south west Nova Scotia bluefin tuna fishery data (non-zero catch).
1189
observed logcpue
fit
-3.0-2.5-2.0-1.5-1.0-0.5
-4 -2 0
1988 1989
-4 -2 0
1990 1991
-4 -2 0
1992
1993 1994 1995 1996
-3.0-2.5-2.0-1.5-1.0-0.5
1997
-3.0-2.5-2.0-1.5-1.0-0.5
1998 1999 2000 2001 2002
2003 2004 2005 2006
-3.0-2.5-2.0-1.5-1.0-0.5
2007-3.0-2.5-2.0-1.5-1.0-0.5
2008
-4 -2 0
2009
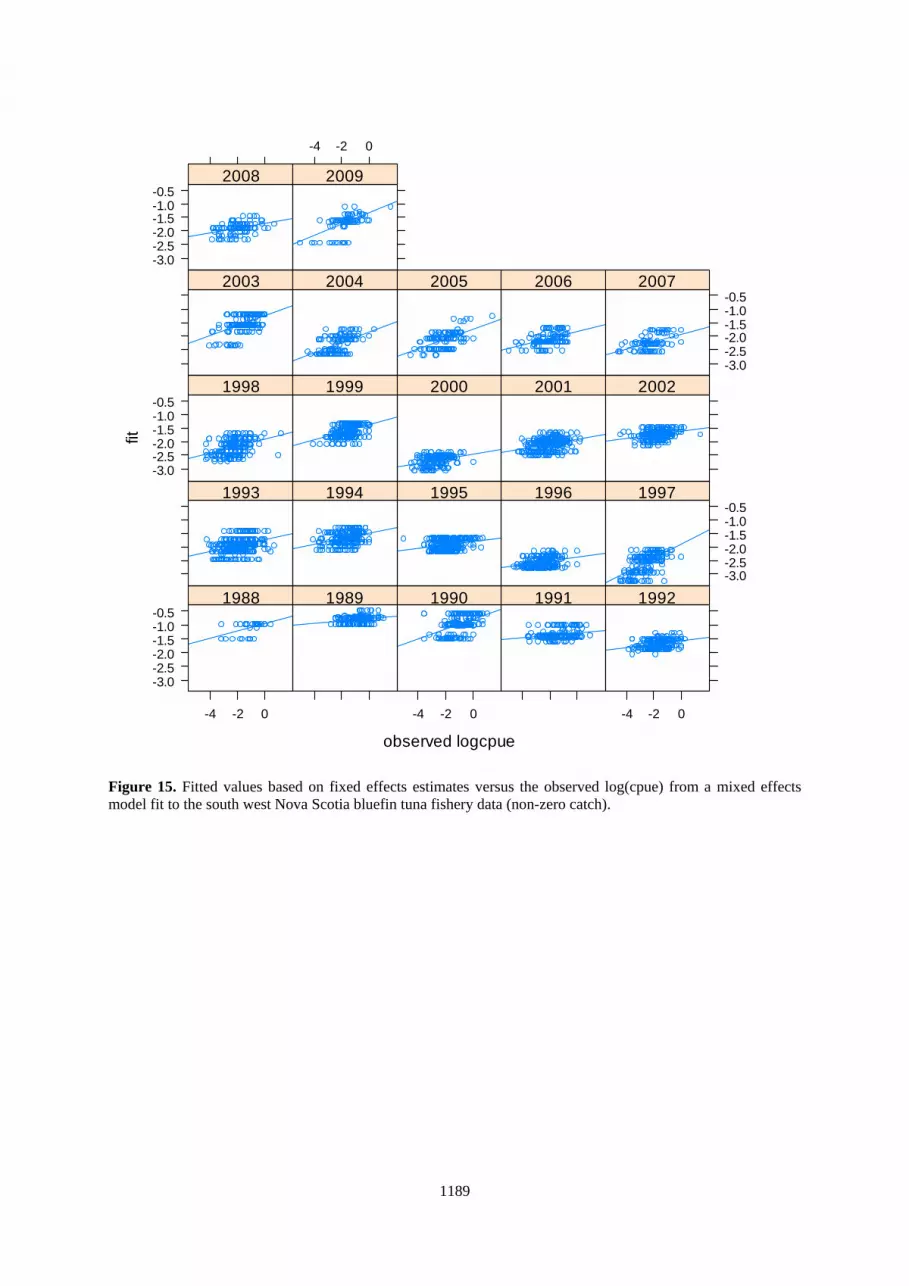
Figure 15. Fitted values based on fixed effects estimates versus the observed log(cpue) from a mixed effects model fit to the south west Nova Scotia bluefin tuna fishery data (non-zero catch).
1190
log(cpue)
De
nsi
ty
0.0
0.2
0.4
0.6
-4 -2 0 2
1988 1989
-4 -2 0 2
1990 1991
-4 -2 0 2
1992
1993 1994 1995 1996
0.0
0.2
0.4
0.6
19970.0
0.2
0.4
0.6
1998 1999 2000 2001 2002
2003 2004 2005 2006
0.0
0.2
0.4
0.6
20070.0
0.2
0.4
0.6
2008
-4 -2 0 2
2009
Figure 16. Distribution of the nominal log(cpue) for data from the south west Nova Scotia bluefin tuna fishery (non-zero catch).
1191
resid
De
nsi
ty
0.00.10.20.30.40.50.6
-4 -2 0 2 4
1988 1989
-4 -2 0 2 4
1990 1991
-4 -2 0 2 4
1992
1993 1994 1995 1996
0.00.10.20.30.40.50.6
19970.00.10.20.30.40.50.6
1998 1999 2000 2001 2002
2003 2004 2005 2006
0.00.10.20.30.40.50.6
20070.00.10.20.30.40.50.6
2008
-4 -2 0 2 4
2009
Figure 17. Distribution of the Pearson residuals from a mixed effects model fit to the south west Nova Scotia bluefin tuna fishery data (non-zero catch).
1192
resid
De
nsi
ty
0.0
0.2
0.4
0.6
-15 -10 -5 0
1988 1989
-15 -10 -5 0
1990 1991
-15 -10 -5 0
1992
1993 1994 1995 1996
0.0
0.2
0.4
0.6
19970.0
0.2
0.4
0.6
1998 1999 2000 2001 2002
2003 2004 2005 2006
0.0
0.2
0.4
0.6
20070.0
0.2
0.4
0.6
2008
-15 -10 -5 0
2009
Figure 18. Distribution of the Pearson residuals (logits) from a general linear model fit to the south west Nova Scotia bluefin tuna fishery data (proportion of successes).
1193
-4 -2 0 2 4
-15
-10
-50
Normal Q-Q Plot
Theoretical Quantiles
Sa
mp
le Q
ua
ntil
es
Figure 19. A normal Q-Q plot comparing the distribution of the Pearson residuals from a general linear model fit to the south west Nova Scotia bluefin tuna fishery data (proportion of successes) with a standard normal distribution.
-2 0 2
-4-2
02
4
Normal Q-Q Plot
Theoretical Quantiles
Sa
mp
le Q
ua
ntil
es
Figure 20. A normal Q-Q plot comparing the distribution of the Pearson residuals from a mixed effects model fit to the south west Nova Scotia bluefin tuna fishery data (non-zero catch) with a standard normal distribution.
1194
CP
UE
, sca
led
to m
ea
n o
f 1
1988 1991 1994 1997 2000 2003 2006 2009
0
1
2
3
4
5 modelednominal
STD and nominal CPUE index with 95% CI
Figure 21. The standardized and nominal cpue for the south west Nova Scotia bluefin tuna fishery.
1195
2.6
2.7
2.8
2.9
3.0
3.1
3.2
Factors
me
an
of l
og
(cp
ue
)
1981
1982
1983
1984
1985
1986
1987
1988
1989
1990
1991
1992
19931994
1995
1996
19971998
1999
2000
2001
2002
2003
2004
2005
2006
2007
2008
2009
2
5
89
10
22
36
year homeport monsail gear
Figure 22. A comparison of the magnitude of the effects of factors used in a mixed effects model fit to the Gulf of St. Lawrence bluefin tuna fishery data (non-zero catch).
1196
Fitted values
Sta
nd
ard
ize
d r
esi
du
als
-2
0
2
4
6
2.6 2.8 3.0 3.2
1981 1982
2.6 2.8 3.0 3.2
1983 1984
2.6 2.8 3.0 3.2
1985 1986
1987 1988 1989 1990 1991
-2
0
2
4
61992
-2
0
2
4
61993 1994 1995 1996 1997 1998
1999 2000 2001 2002 2003
-2
0
2
4
62004
-2
0
2
4
62005
2.6 2.8 3.0 3.2
2006 2007
2.6 2.8 3.0 3.2
2008 2009
Figure 23. Pearson residuals from a mixed effects model fit to the Gulf of St. Lawrence bluefin tuna fishery data (non-zero catch).
1197
1981 1984 1987 1990 1993 1996 1999 2002 2005 2008
-20
24
6
year
pe
arR
esi
d
Figure 24. Box-plots of Pearson residuals from a mixed effects model fit to the Gulf of St. Lawrence bluefin tuna fishery data (non-zero catch).
1198
observed logcpue
fit
2.6
2.8
3.0
3.2
1 2 3 4 5 6 7
1981 1982
1 2 3 4 5 6 7
1983 1984
1 2 3 4 5 6 7
1985 1986
1987 1988 1989 1990 1991
2.6
2.8
3.0
3.2
19922.6
2.8
3.0
3.2
1993 1994 1995 1996 1997 1998
1999 2000 2001 2002 2003
2.6
2.8
3.0
3.2
20042.6
2.8
3.0
3.2
2005
1 2 3 4 5 6 7
2006 2007
1 2 3 4 5 6 7
2008 2009
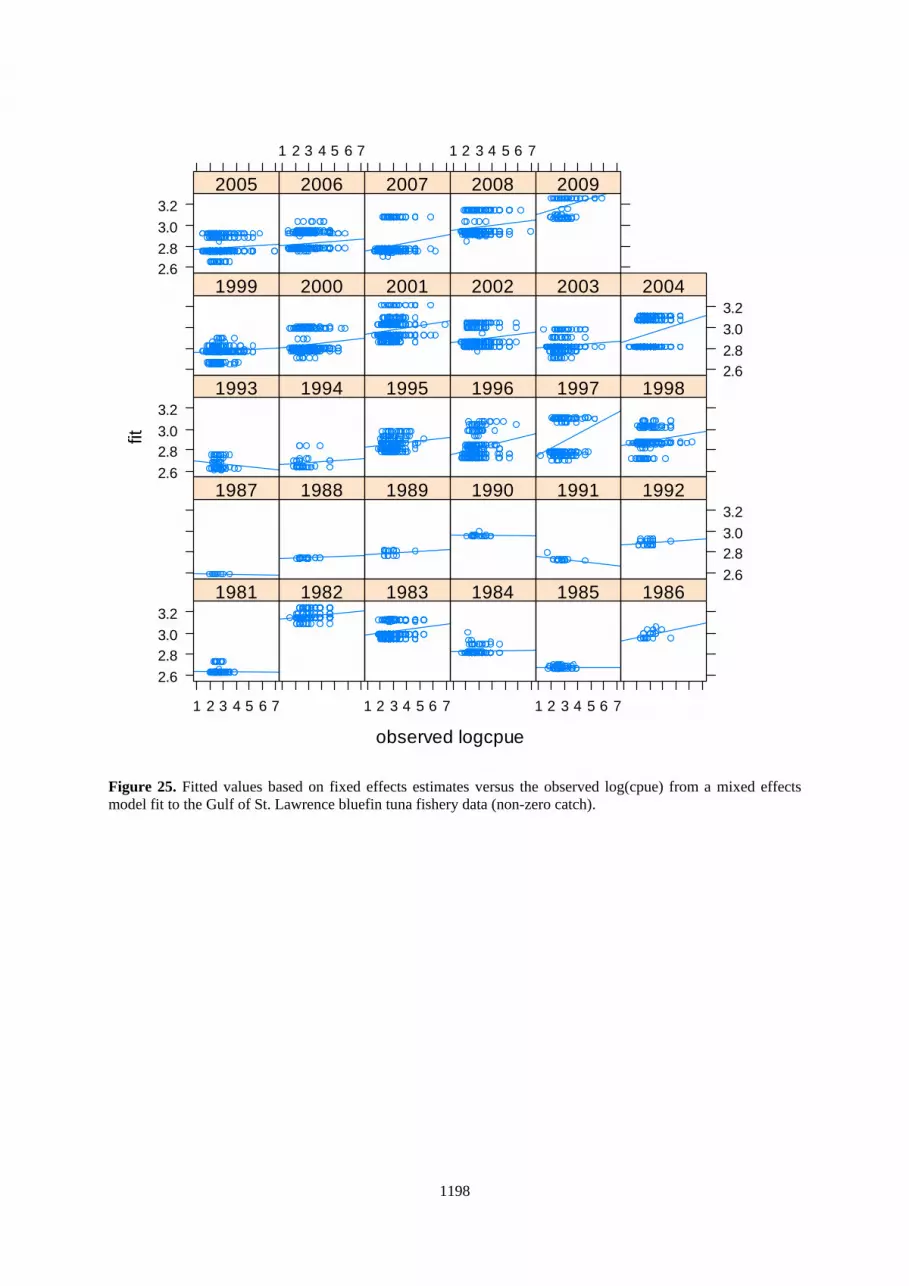
Figure 25. Fitted values based on fixed effects estimates versus the observed log(cpue) from a mixed effects model fit to the Gulf of St. Lawrence bluefin tuna fishery data (non-zero catch).
1199
log(cpue)
De
nsi
ty
0.0
0.5
1.0
2 4 6
1981 1982
2 4 6
1983 1984
2 4 6
1985 1986
1987 1988 1989 1990 1991
0.0
0.5
1.0
19920.0
0.5
1.0
1993 1994 1995 1996 1997 1998
1999 2000 2001 2002 2003
0.0
0.5
1.0
20040.0
0.5
1.0
2005
2 4 6
2006 2007
2 4 6
2008 2009
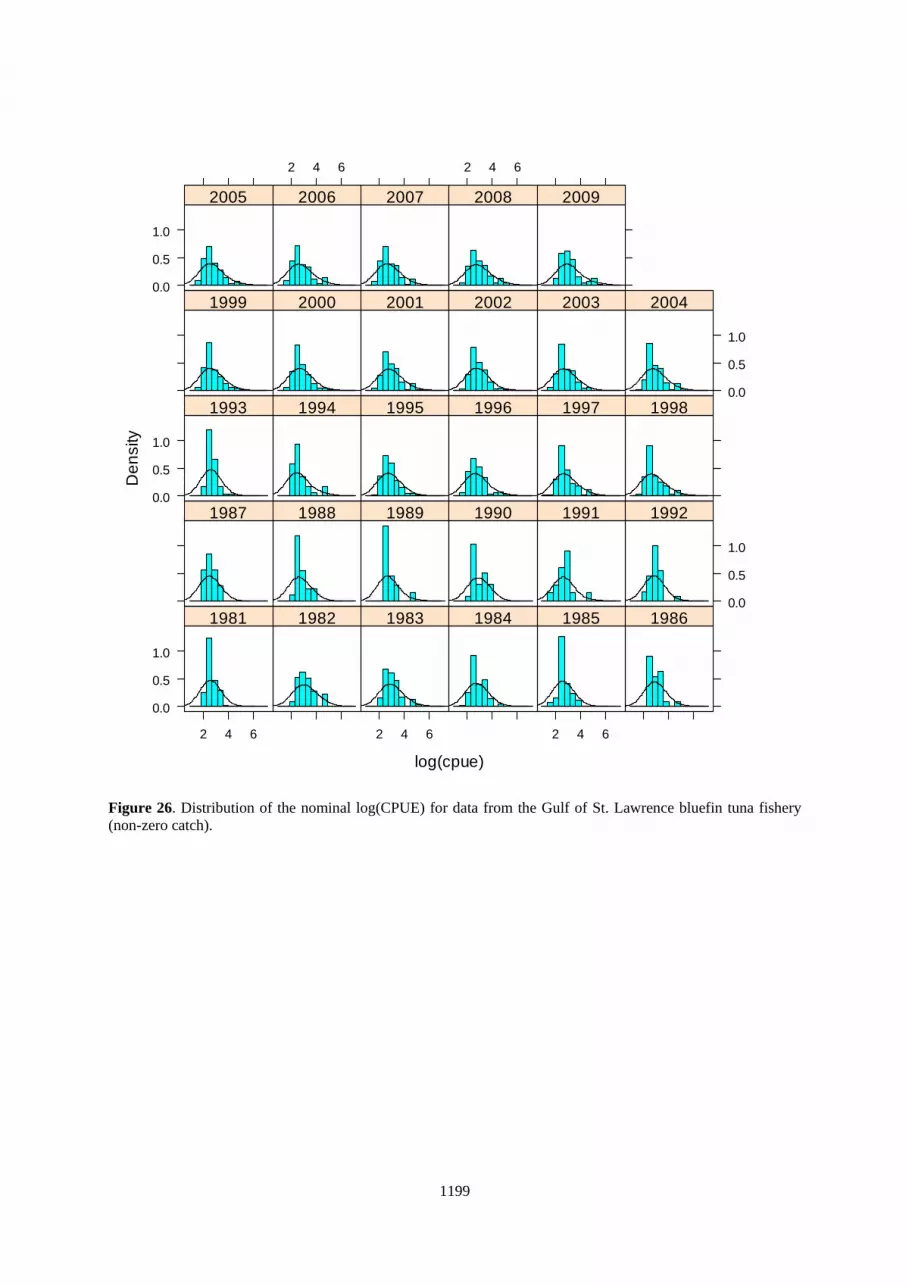
Figure 26. Distribution of the nominal log(CPUE) for data from the Gulf of St. Lawrence bluefin tuna fishery (non-zero catch).
1200
resid
De
nsi
ty
0.00.20.40.60.8
-2 0 2 4 6
1981 1982
-2 0 2 4 6
1983 1984
-2 0 2 4 6
1985 1986
1987 1988 1989 1990 1991
0.00.20.40.60.8
19920.00.20.40.60.8
1993 1994 1995 1996 1997 1998
1999 2000 2001 2002 2003
0.00.20.40.60.8
20040.00.20.40.60.8
2005
-2 0 2 4 6
2006 2007
-2 0 2 4 6
2008 2009
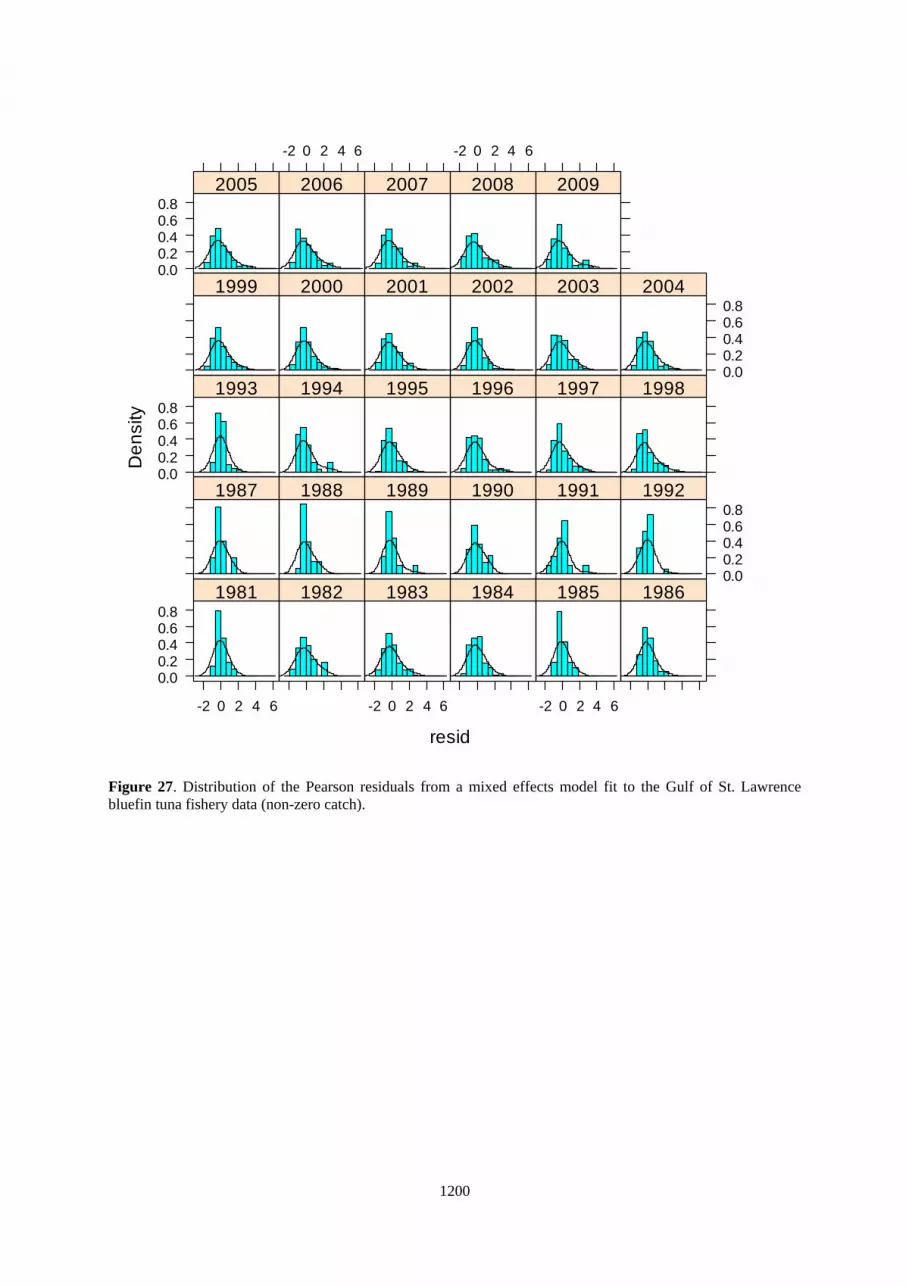
Figure 27. Distribution of the Pearson residuals from a mixed effects model fit to the Gulf of St. Lawrence bluefin tuna fishery data (non-zero catch).
1201
resid
De
nsi
ty
0.0
0.5
1.0
1.5
0 2 4 6 8
1981 1982
0 2 4 6 8
1983 1984
0 2 4 6 8
1985 1986
1987 1988 1989 1990 1991
0.0
0.5
1.0
1.5
19920.0
0.5
1.0
1.5
1993 1994 1995 1996 1997 1998
1999 2000 2001 2002 2003
0.0
0.5
1.0
1.5
20040.0
0.5
1.0
1.5
2005
0 2 4 6 8
2006 2007
0 2 4 6 8
2008 2009
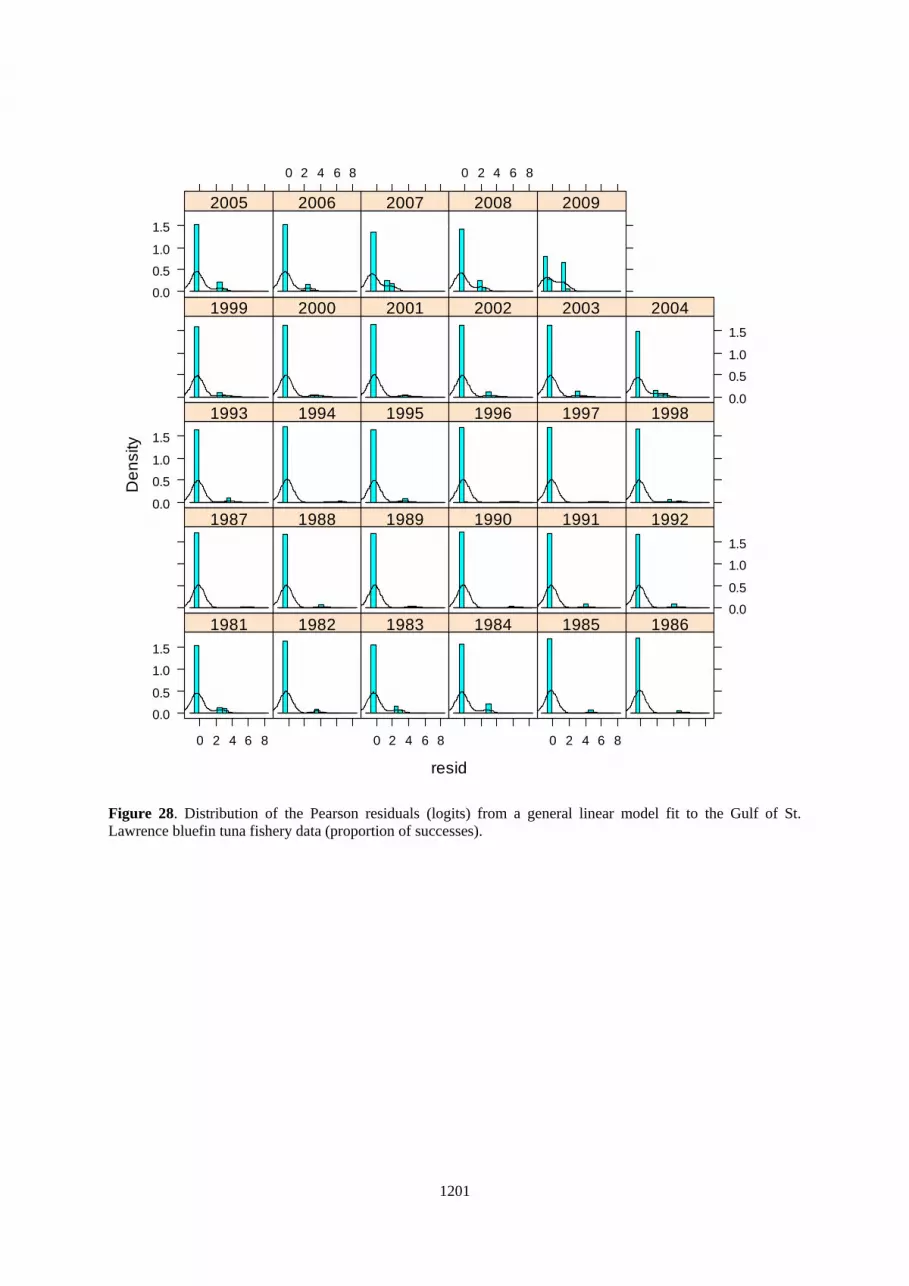
Figure 28. Distribution of the Pearson residuals (logits) from a general linear model fit to the Gulf of St. Lawrence bluefin tuna fishery data (proportion of successes).
1202
-4 -2 0 2 4
02
46
8Normal Q-Q Plot
Theoretical Quantiles
Sa
mp
le Q
ua
ntil
es
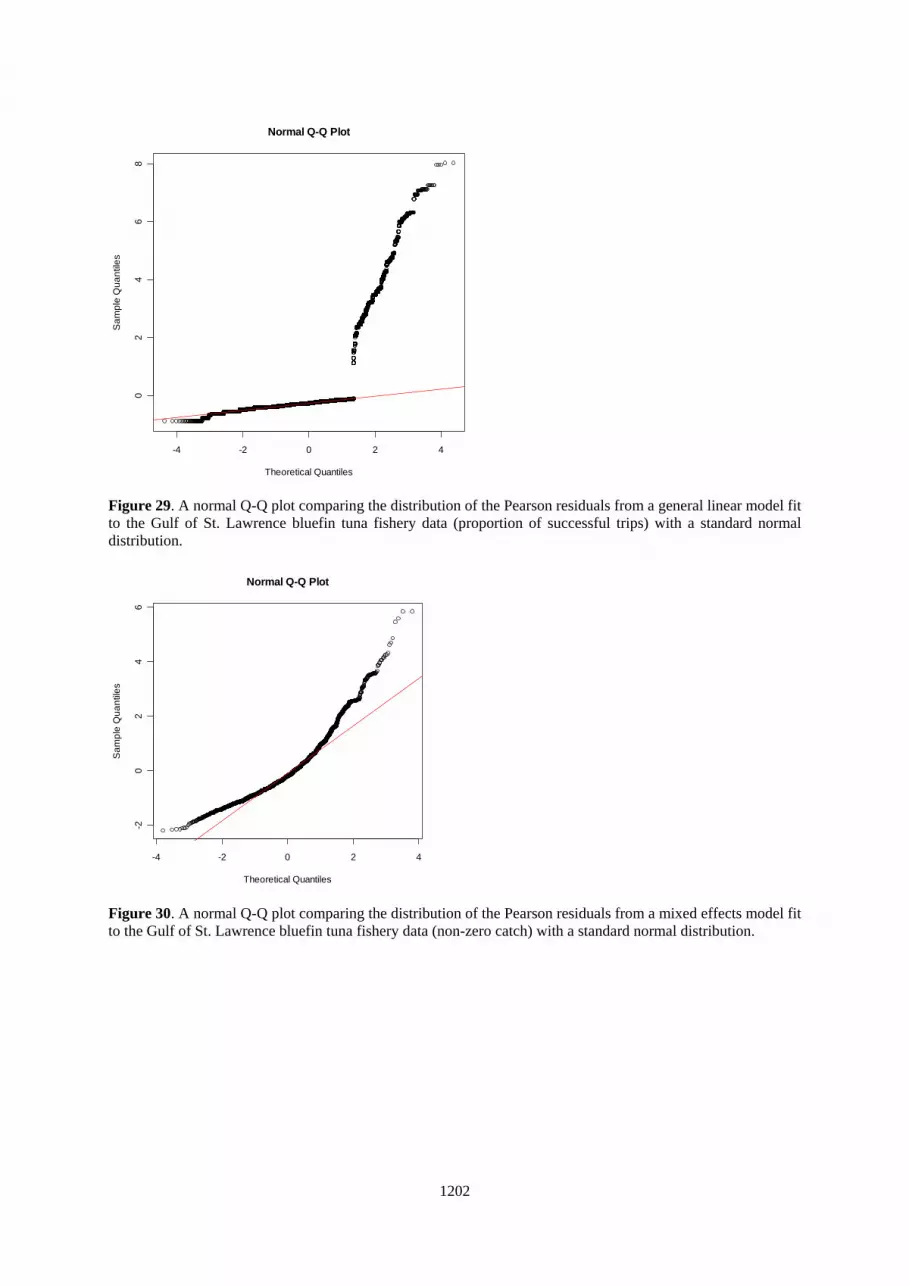
Figure 29. A normal Q-Q plot comparing the distribution of the Pearson residuals from a general linear model fit to the Gulf of St. Lawrence bluefin tuna fishery data (proportion of successful trips) with a standard normal distribution.
-4 -2 0 2 4
-20
24
6
Normal Q-Q Plot
Theoretical Quantiles
Sa
mp
le Q
ua
ntil
es
Figure 30. A normal Q-Q plot comparing the distribution of the Pearson residuals from a mixed effects model fit to the Gulf of St. Lawrence bluefin tuna fishery data (non-zero catch) with a standard normal distribution.
1203
CP
UE
, sca
led
to m
ea
n o
f 1
1981 1985 1989 1993 1997 2001 2005 2009
0
1
2
3
4
5
6
7modelednominal
STD and nominal CPUE index with 95% CI
Figure 31. The standardized and nominal cpue for the Gulf of St. Lawrence bluefin tuna fishery.