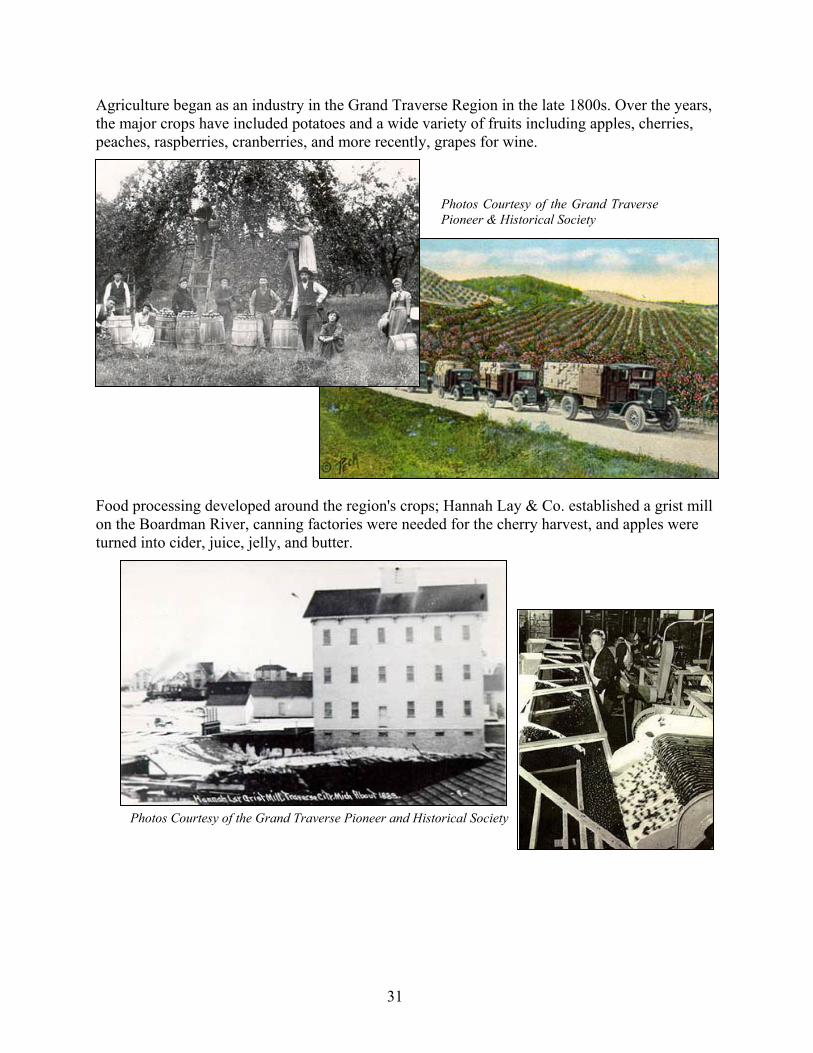
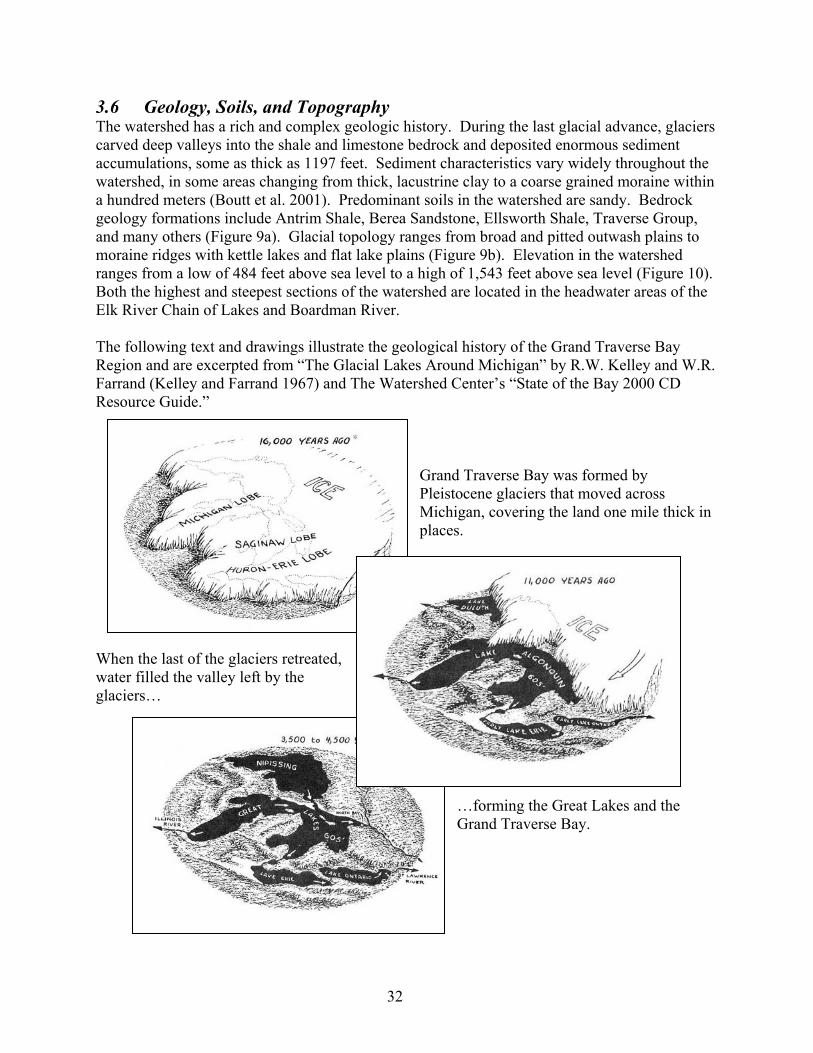
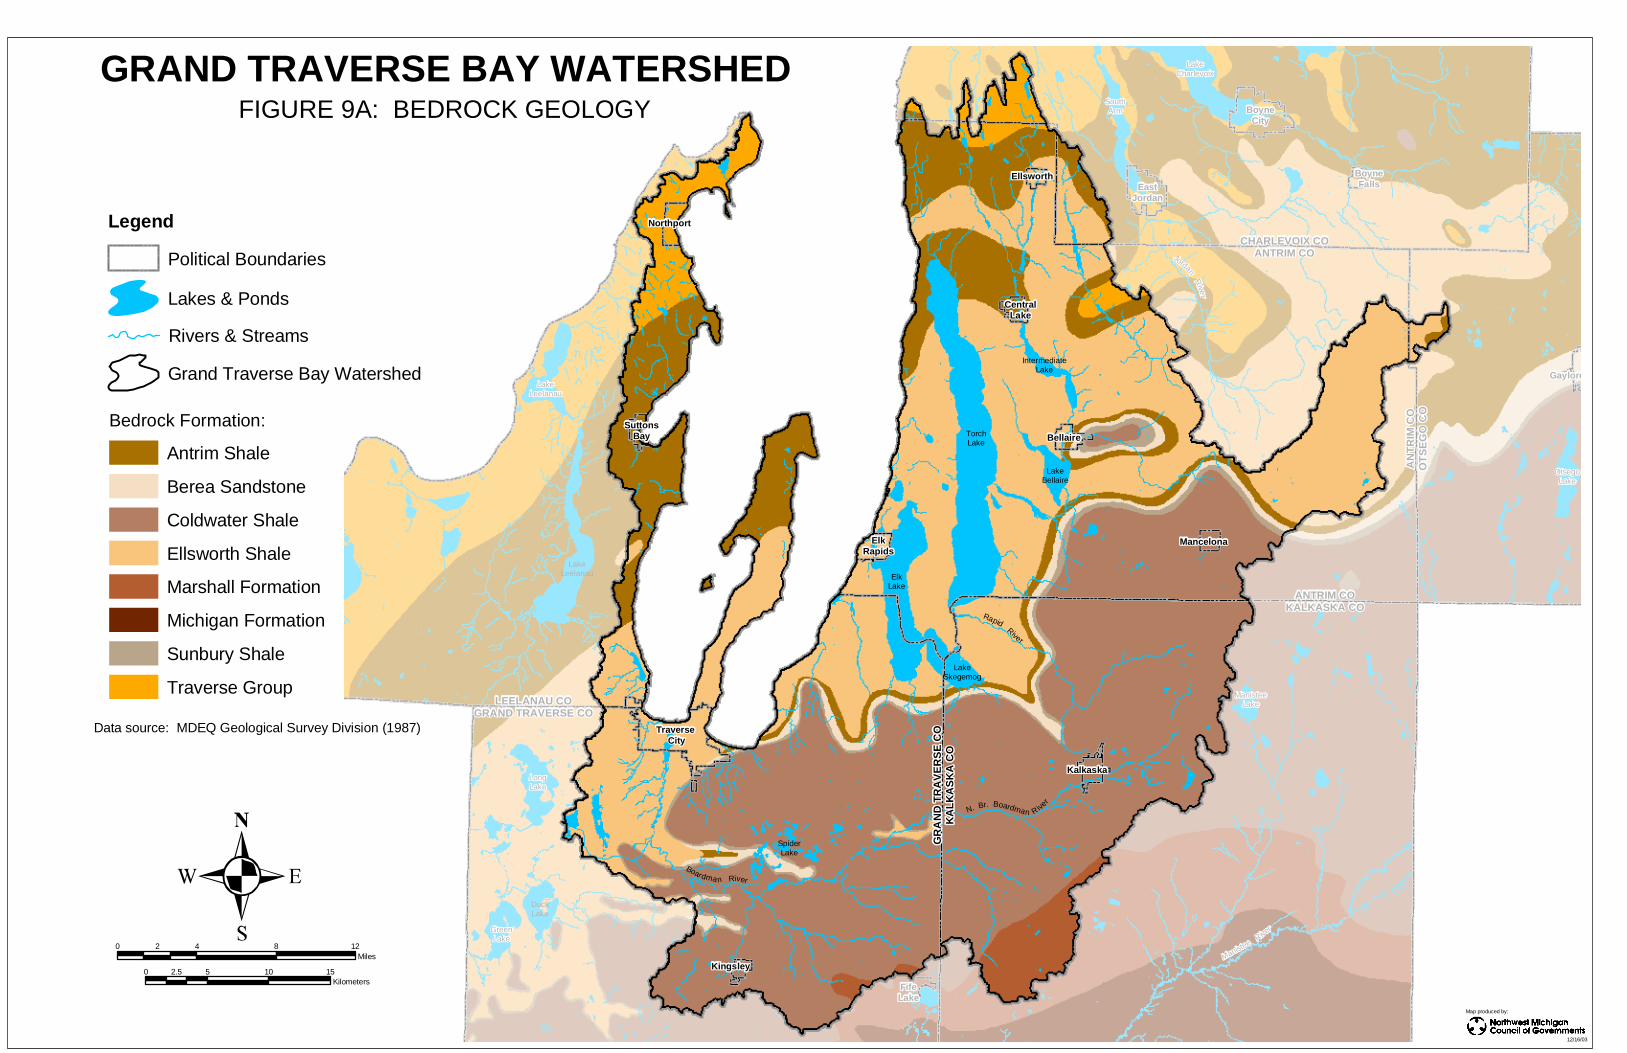
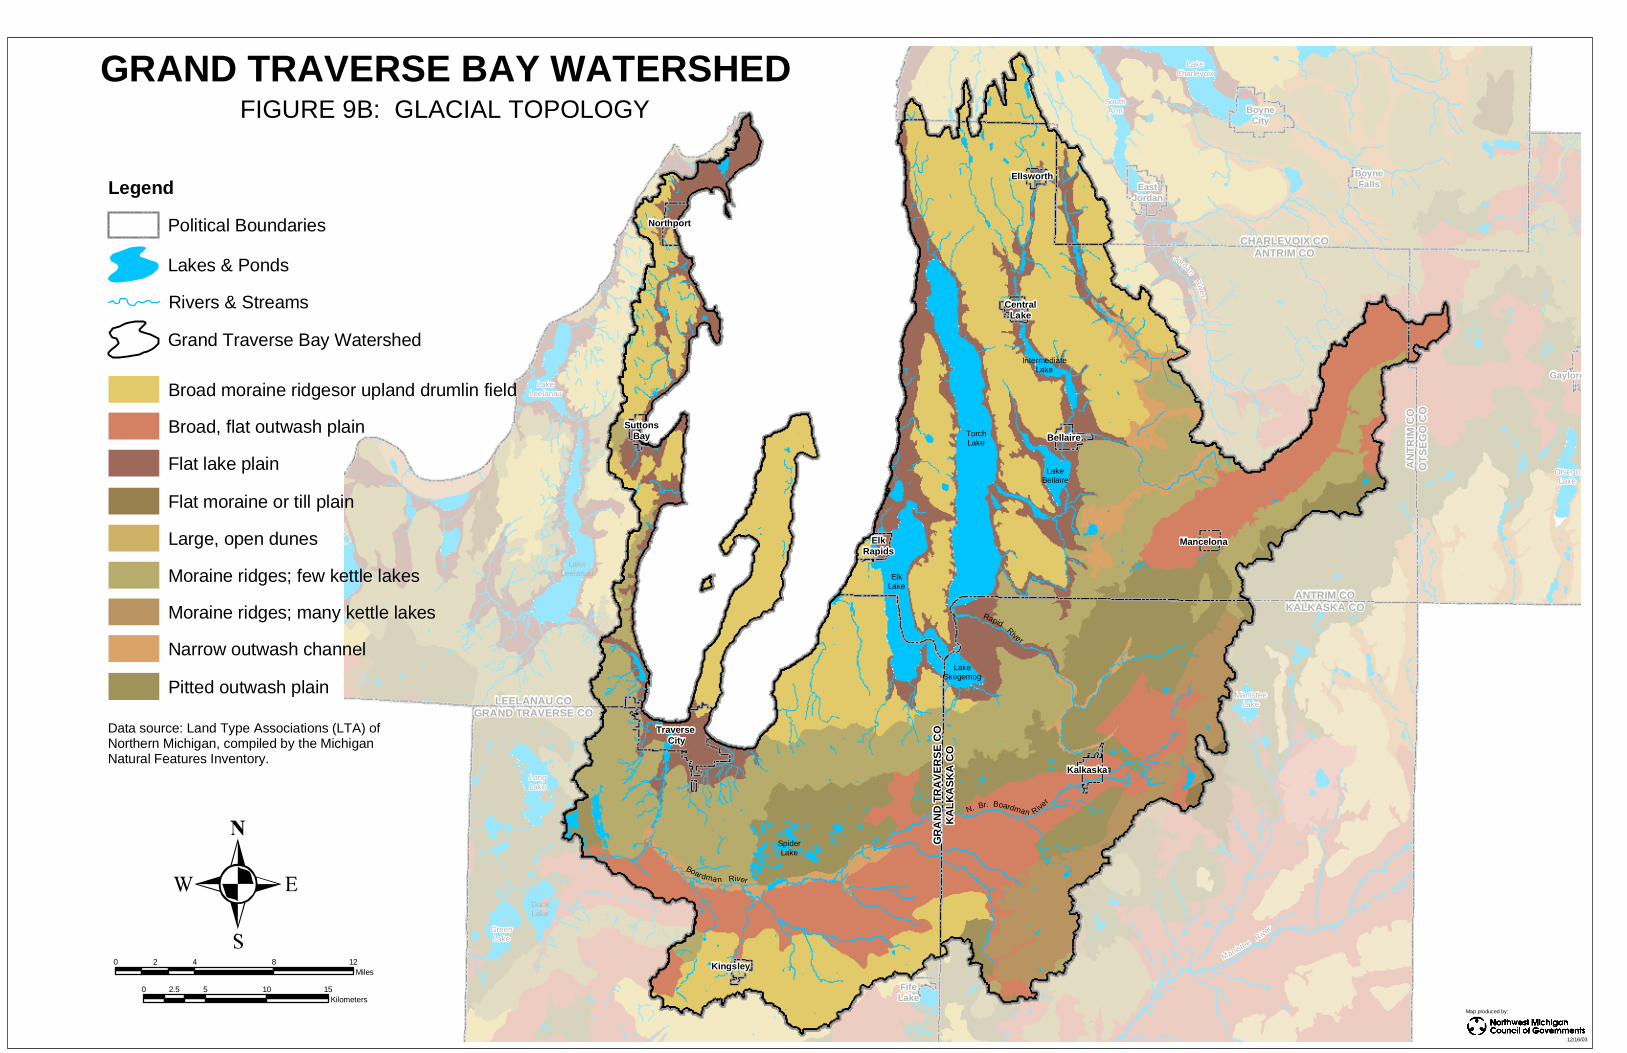
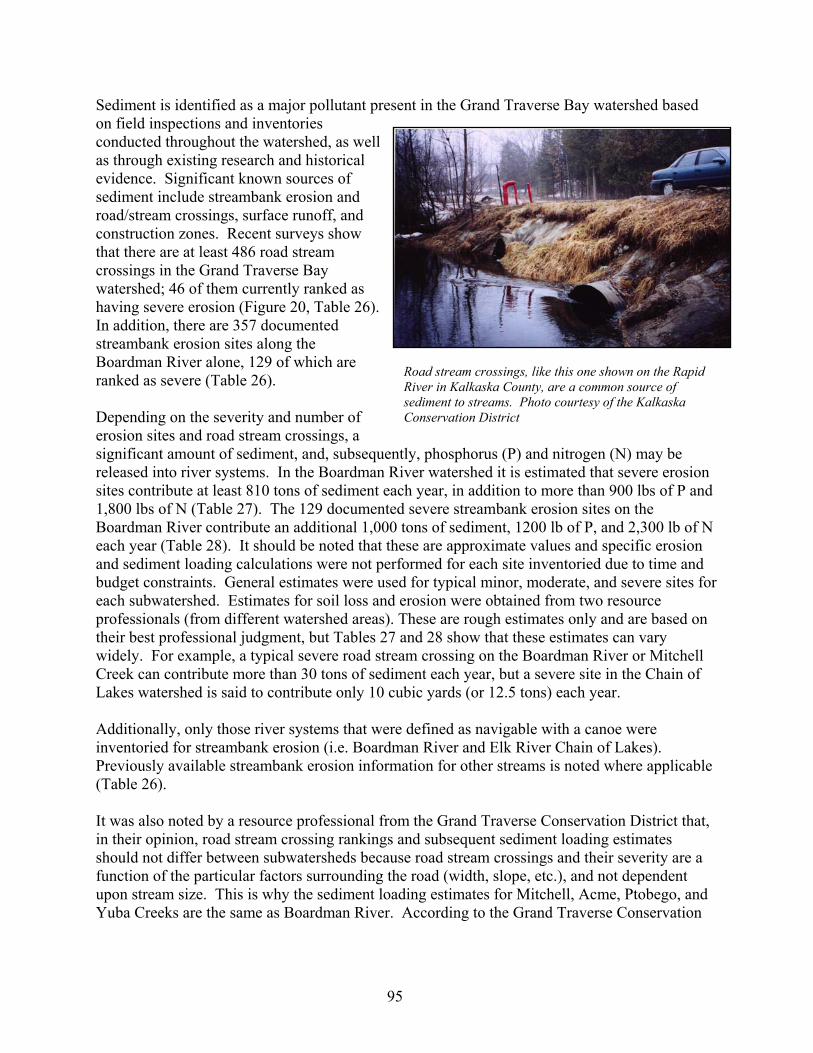
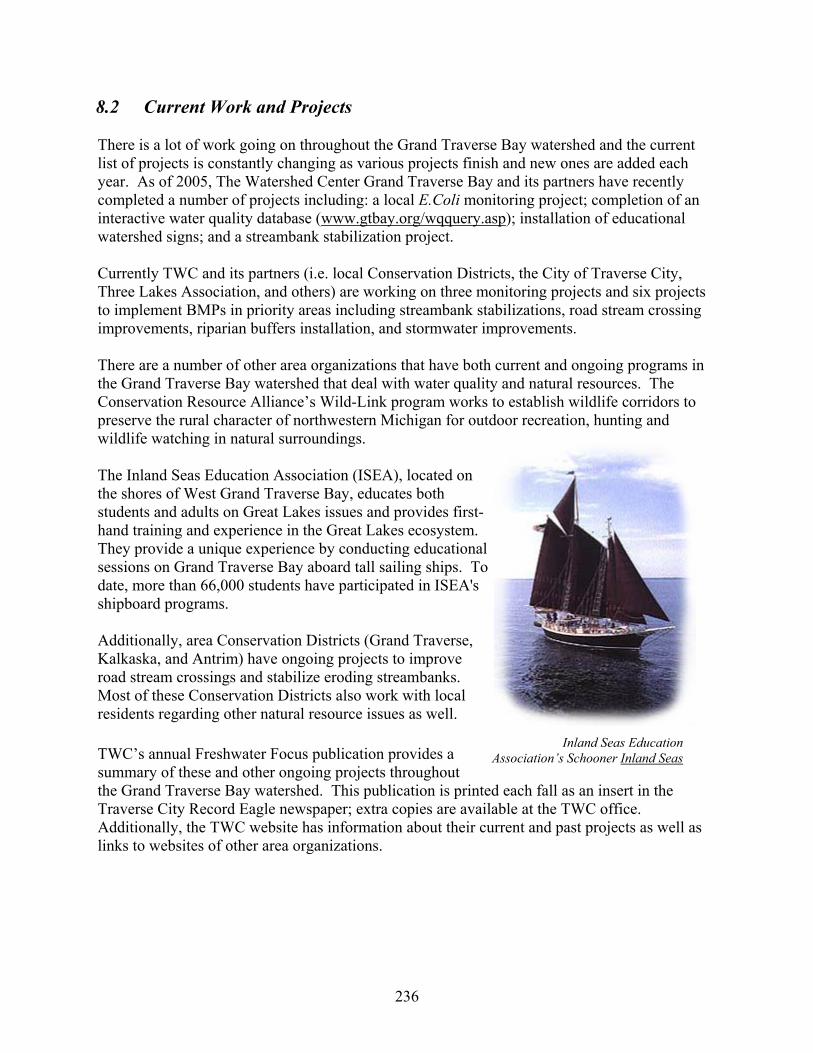
GRAND TRAVERSE BAY WATERSHED PROTECTION PLAN December 2003 REVISED DECEMBER 2005 Sarah U’Ren, Project Coordinator The Watershed Center Grand Traverse Bay 232 East Front Street Traverse City, MI, 49684
Transcript
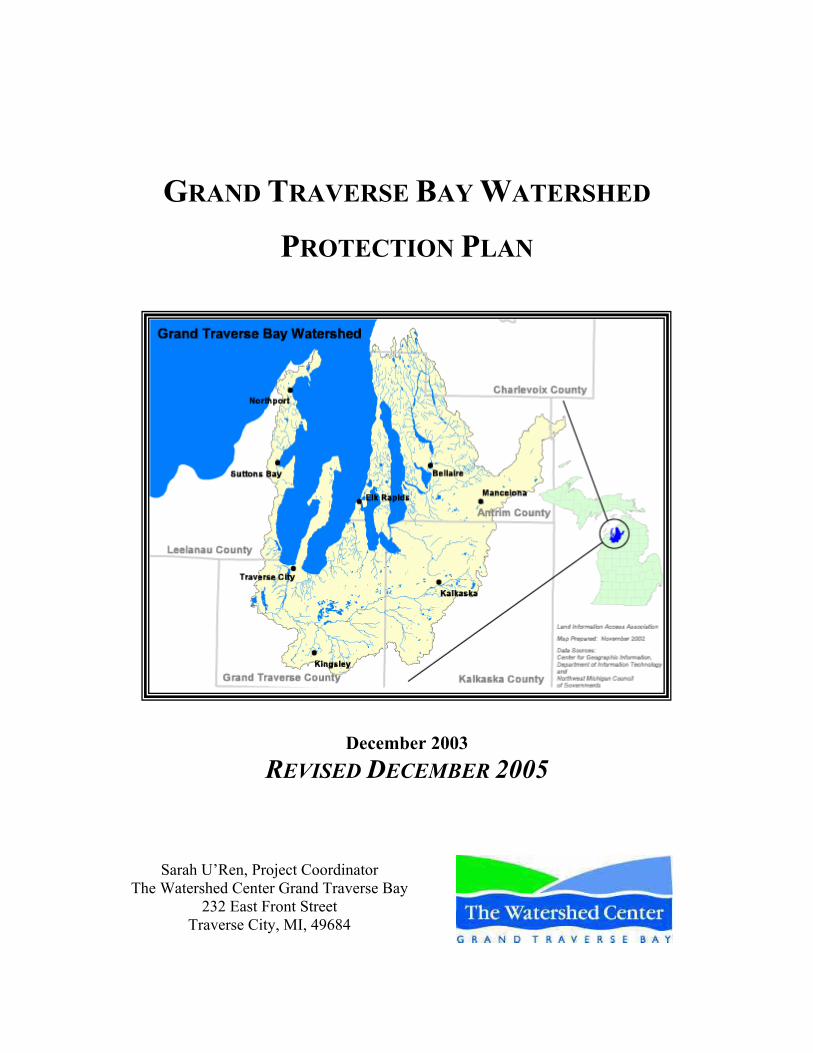
GRAND TRAVERSE BAY WATERSHED
PROTECTION PLAN
December 2003 REVISED DECEMBER 2005
Sarah U’Ren, Project Coordinator
The Watershed Center Grand Traverse Bay 232 East Front Street
Traverse City, MI, 49684
I
ACKNOWLEDGEMENTS Many organizations and agencies were committed to helping create the Grand Traverse Bay Watershed Protection Plan. We would like to thank participants for their involvement in making this project possible. The United States Environmental Protection Agency (U. S. EPA) provided support and funding through Section 319 of the Clean Water Act. The Michigan Department of Environmental Quality has overseen and administered this grant from the EPA. Specifically, Greg Goudy from the Cadillac District Office has offered invaluable guidance and support throughout the entire planning process. Additionally, members of the steering committee have played a crucial part in the Grand Traverse Bay Watershed Protection Plan by providing technical and informational assistance as well as offering guidance on project components. Steering committee members include: Sarah U’Ren, Anne Brasie, John Nelson, and Anne Hansen (The Watershed Center Grand Traverse Bay); Greg Goudy (Michigan Department of Environmental Quality); Jim Muratzki (Land Information Access Association); Matt Heiman (Leelanau Conservancy); Jim Haveman and Laura Keuhn (Conservation Resource Alliance); Megan Olds and Viet Doan (Northwest Michigan Council of Governments); Tom Wessels (Grand Traverse Regional Math, Science, and Technology Center); Matt McDonough (Grand Traverse Regional Land Conservancy); Peg Comfort (Elk River Chain of Lakes Steering Committee), Ray Ludwa (Torch Lake Protection Alliance), Gordon Hayward (Peninsula Twp. Planner); Russ Adams (Silver Lake Association); Mary Wilson and Patty O’Donnell (Grand Traverse Band of Ottawa and Chippewa Indians); Steve Largent and Lew Coulter (Grand Traverse Conservation District); Maureen Kennedy-Templeton (Grand Traverse County Drain Commissioner); Tom Buss (Grand Traverse County Health Department); Russ LaRowe (Kalkaska Conservation District); Natasha Lapinski and Chris Grobbel (Ball Environmental Associates); Tom Emling (MSU-North); Barbara Nelson-Jameson (National Park Service); Bob Cole and Tim Lodge (City of Traverse City); Tom Kelly (Inland Seas Education Association); Gerry Harsch (Garfield Township Planner); John McKinney and Mark Breederland (MSU Sea Grant); Bruce Knapp, Tom Adams, Buzz Long and Pepper Bromelmeier (Natural Resources Conservation Service); Bryan Pijanowski (Purdue University, formerly of MSU). Special thanks go to the following organizations for assisting in completing specific project tasks:
• The Conservation Resource Alliance has facilitated the steering committee meetings as well as conducted the project evaluation for the initial version of the plan (2003).
• The Land Information Access Association developed an interactive website to support the planning process (www.gtbay.org) (2003 and 2005).
• The Northwest Michigan Council of Governments (NWMCOG) entered and formatted the shoreline survey date into a GIS database and assisted in compiling data layers and
maps for the protection plan (2003). Additionally, the NWMCOG summarized master plans and zoning ordinances for all local governments in the watershed (2005).
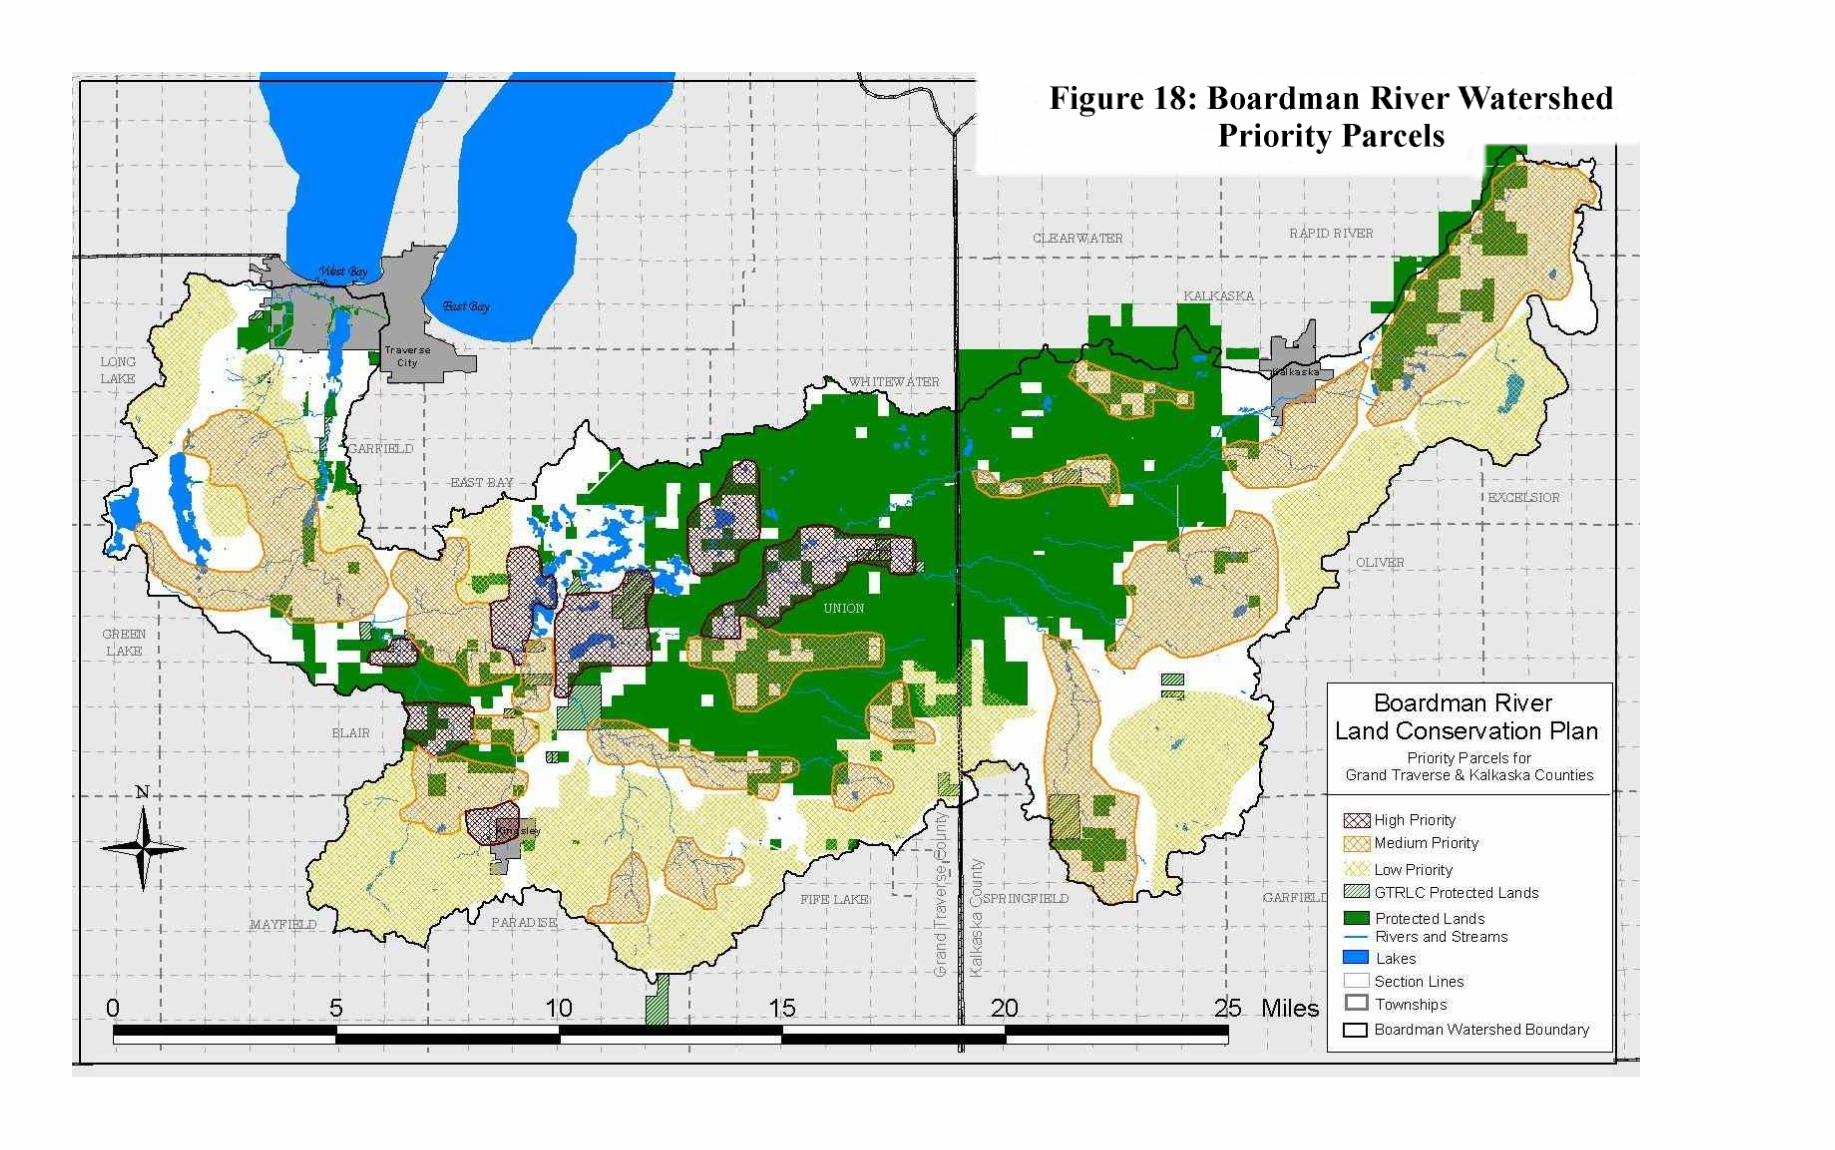
• Grand Traverse Regional Land Conservancy and the Leelanau Conservancy have identified ecologically significant parcels of land for water quality protection in the Boardman River watershed and Leelanau County (2003).
• Northwestern Michigan College (NMC) Business Research Services conducted the stakeholder attitudinal survey and business focus groups to assess awareness and attitudes regarding watershed issues (2003).
• Peninsula Township provided valuable assistance in the development of a Shoreline Owner’s Quick Reference Guide to provide its residents with information regarding best management practices to use on their Great Lakes shoreline property (2003).
• The Grand Traverse and Antrim Conservation Districts completed road stream crossing and streambank erosion surveys for subwatersheds in their service areas (2005).
In addition, the following individuals provided valuable feedback during the review process: Peg Comfort, Ray Ludwa, and employees of the City of Traverse City.
5.3 PRIORITY AREAS ....................................................................84
5.4 POLLUTANTS OF CONCERN .....................................................94
IV
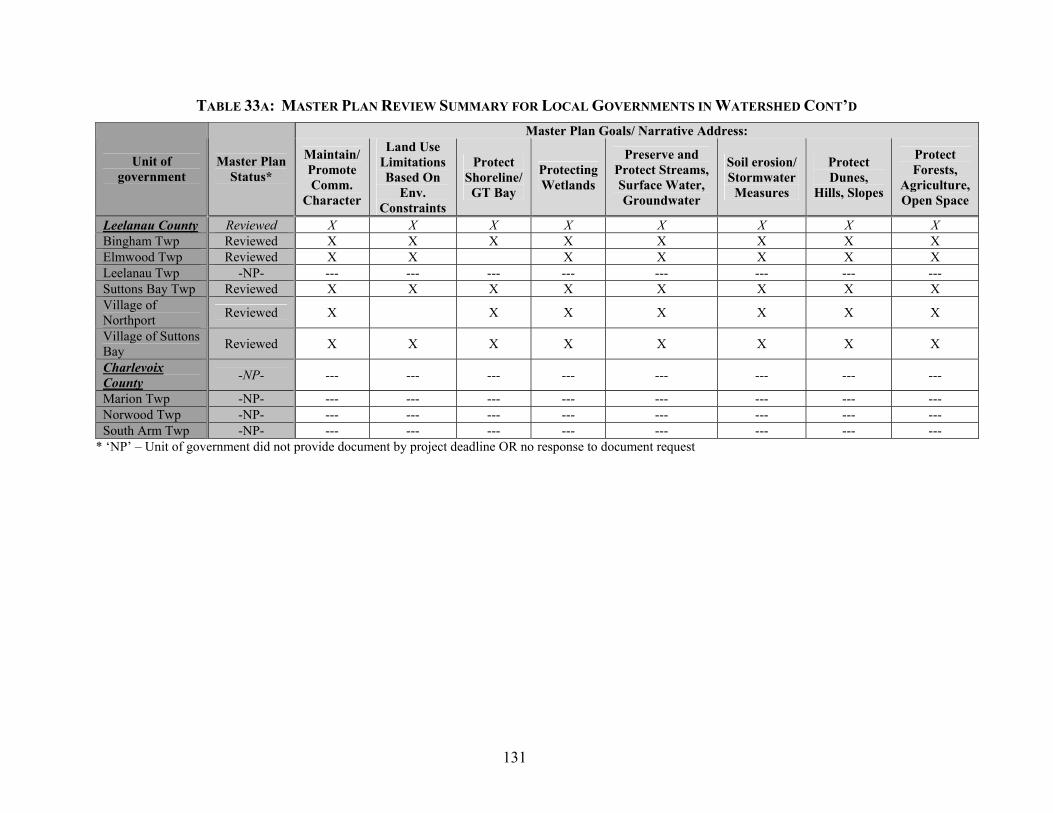
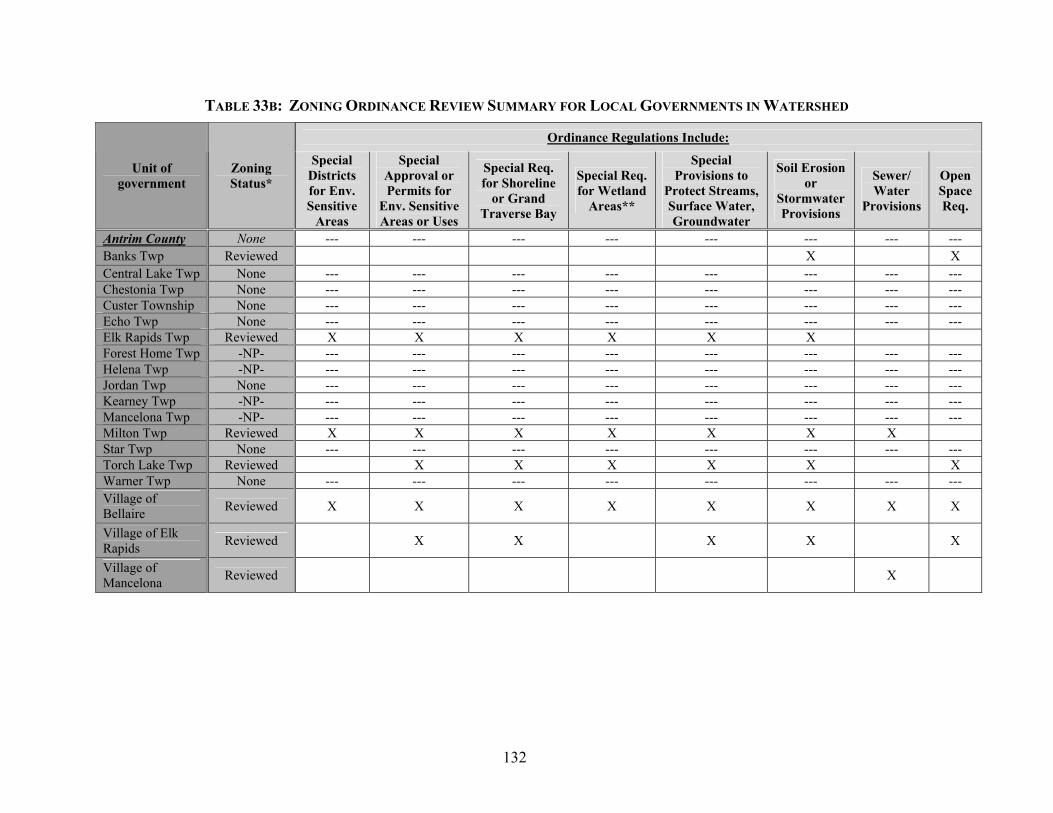
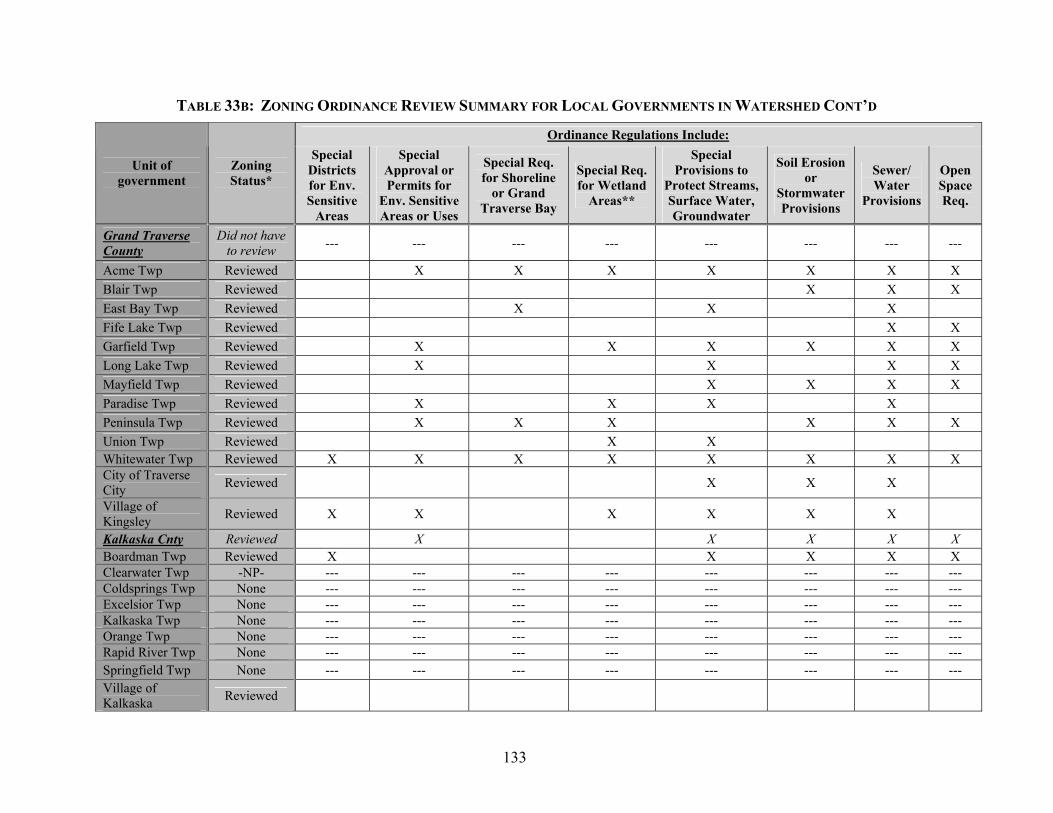
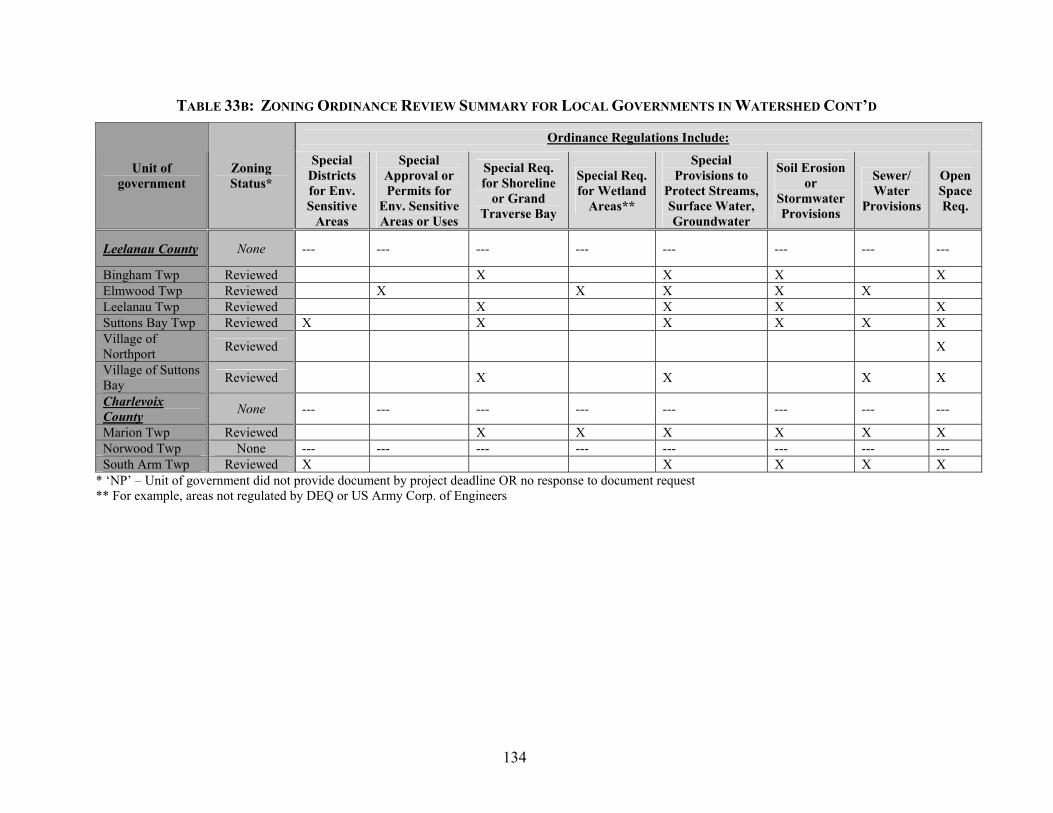
5.5 SPECIAL SOURCES OF CONCERN: STORMWATER, LACK OF ........ RIPARIAN BUFFER, AND MASTER PLANS AND ZONING ........... ORDINANCES.....................................................................118
CHAPTER 6 WATERSHED GOALS AND OBJECTIVES..........................................135
FIGURE 3 POPULATION DENSITY (CENSUS 2000) BY ......................................... MINOR CIVIL DIVISIONS .................................................................15
FIGURE 4 POPULATION CHANGE FROM 1990-2000 BY........................................ MINOR CIVIL DIVISIONS .................................................................16
FIGURE 5 TOWNSHIPS, CITIES, AND VILLAGES ...............................................23
FIGURE 6 LAND USE AND LAND COVER .........................................................27
FIGURE 7 AGRICULTURAL LAND USE.............................................................28
TABLE 2 SUBWATERSHEDS IN THE GRAND TRAVERSE BAY WATERSHED .....11
TABLE 3 PERCENT POPULATION CHANGE FOR SELECTED YEARS .................13
TABLE 4 CURRENT AND HISTORIC POPULATION BY COUNTY........................13
TABLE 5 TOWNSHIPS AND MUNICIPALITIES IN THE ........................................... GRAND TRAVERSE BAY WATERSHED.............................................17
TABLE 6 SUBWATERSHEDS AND AREAS OF TOWNSHIPS AND ........................... MUNICIPALITIES IN THE GRAND TRAVERSE BAY ............................... WATERSHED ............................................................................. 17-19
TABLE 7 LAND USE PLANNING TECHNIQUES ................................................21
TABLE 8 LAND USE/LAND COVER IN THE GRAND TRAVERSE BAY .................. WATERSHED ...................................................................................25
TABLE 9 AGRICULTURAL LAND USE IN THE GRAND TRAVERSE BAY .............. WATERSHED ...................................................................................25
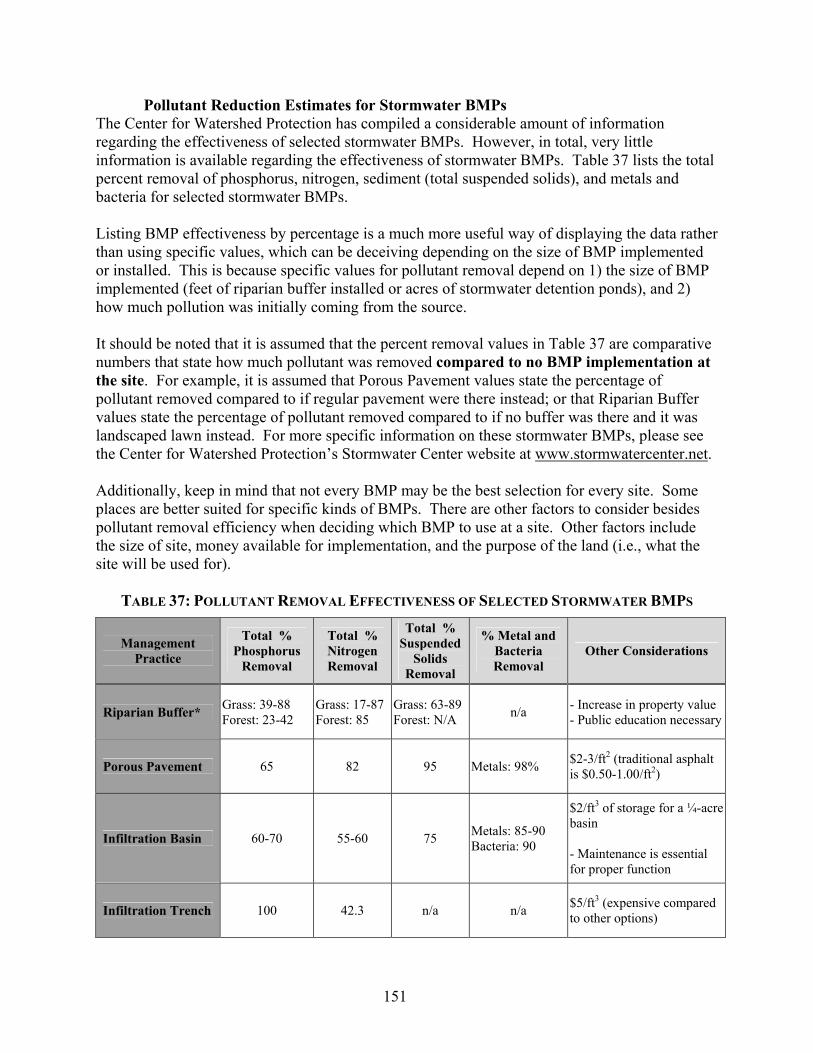
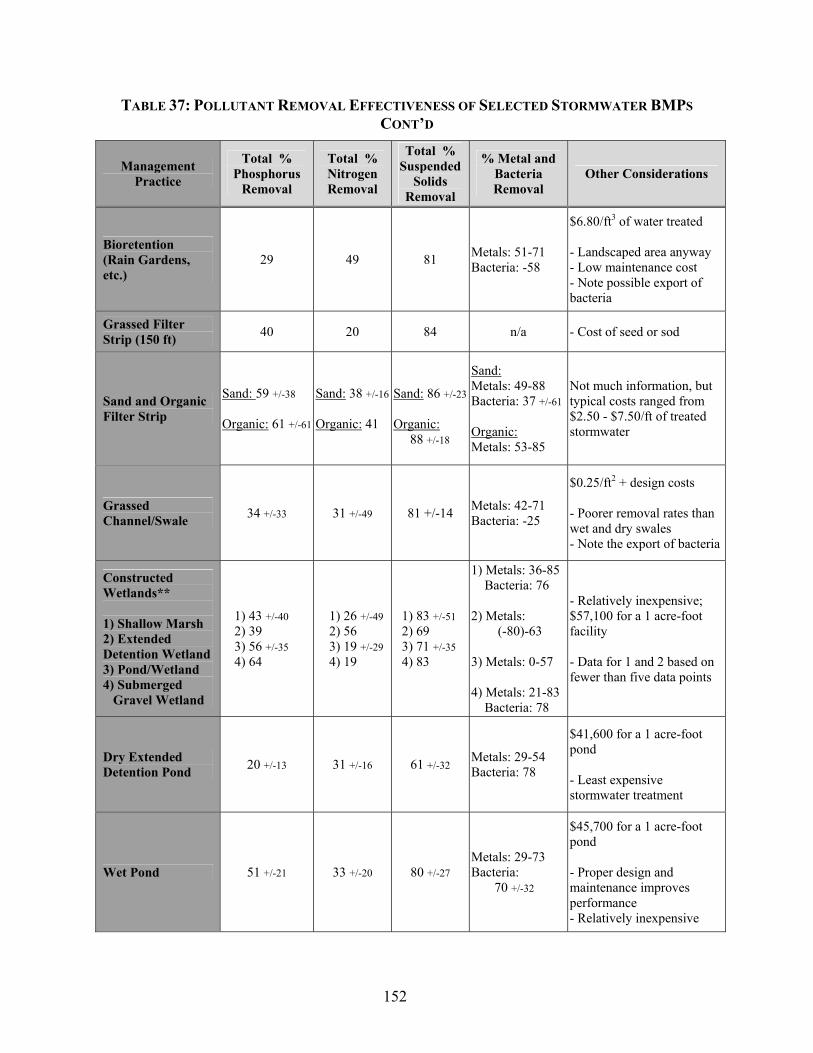
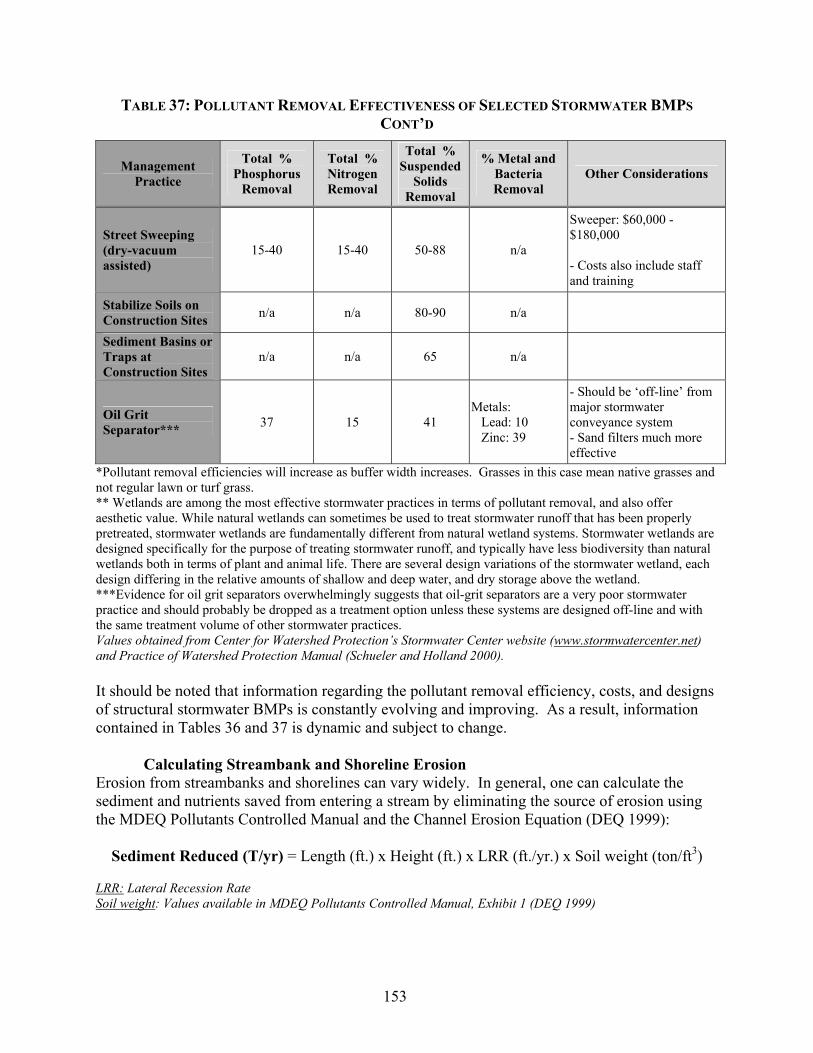
TABLE 10 PERCENT LAND USE/LAND COVER IN SUBWATERSHEDS ................25
TABLE 11 COMPOSITE WETLAND AREAS IN THE GRAND TRAVERSE BAY .......... WATERSHED ...................................................................................26
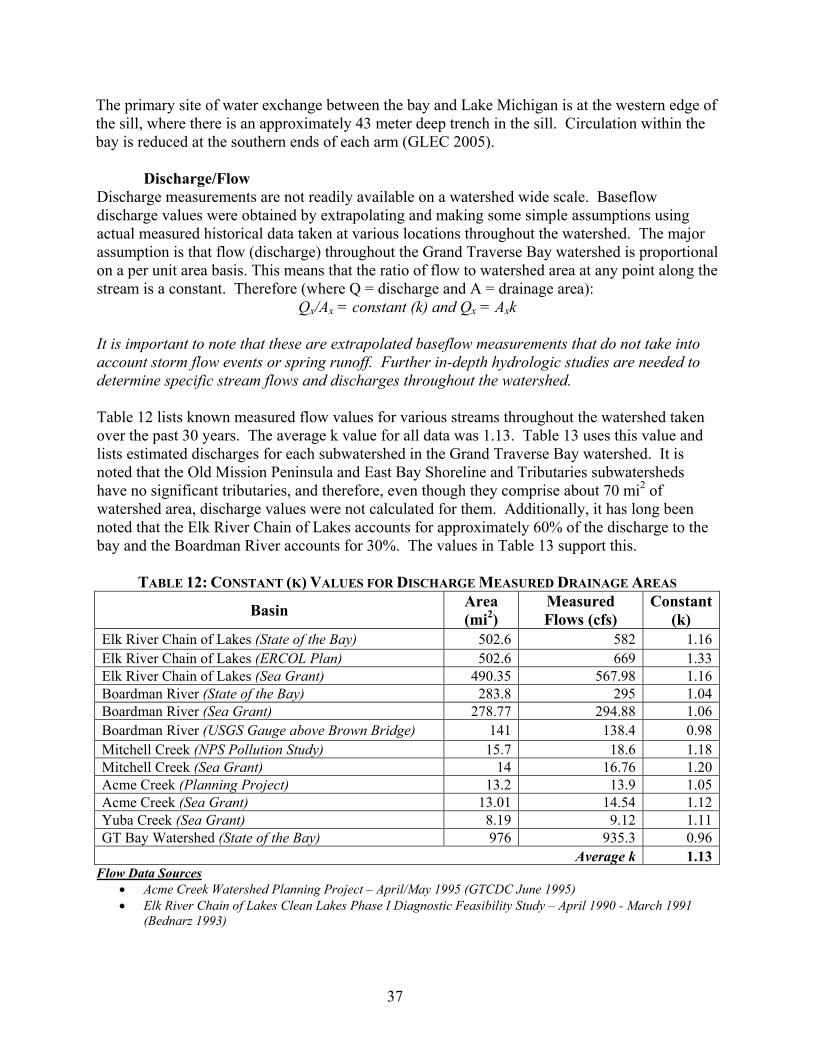
TABLE 12 CONSTANT (K) VALUES FOR DISCHARGE MEASURED IN .................... DRAINAGE AREAS...........................................................................37
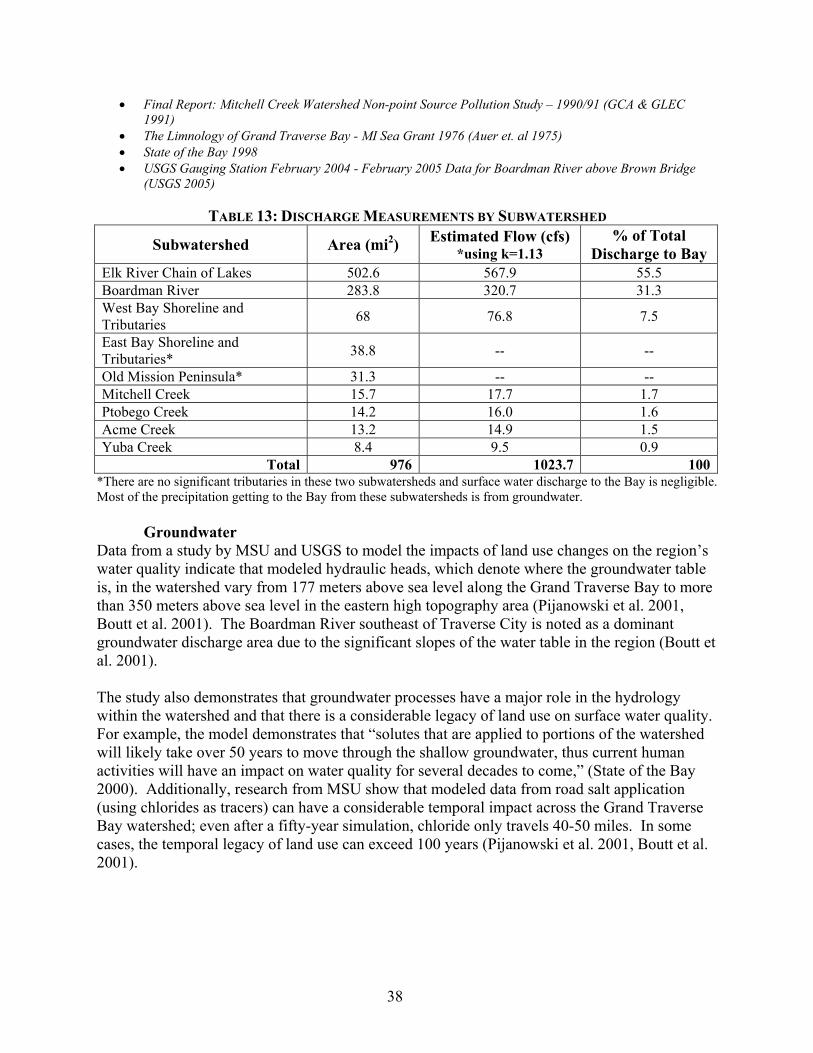
TABLE 13 DISCHARGE MEASUREMENTS BY SUBWATERSHED .........................38
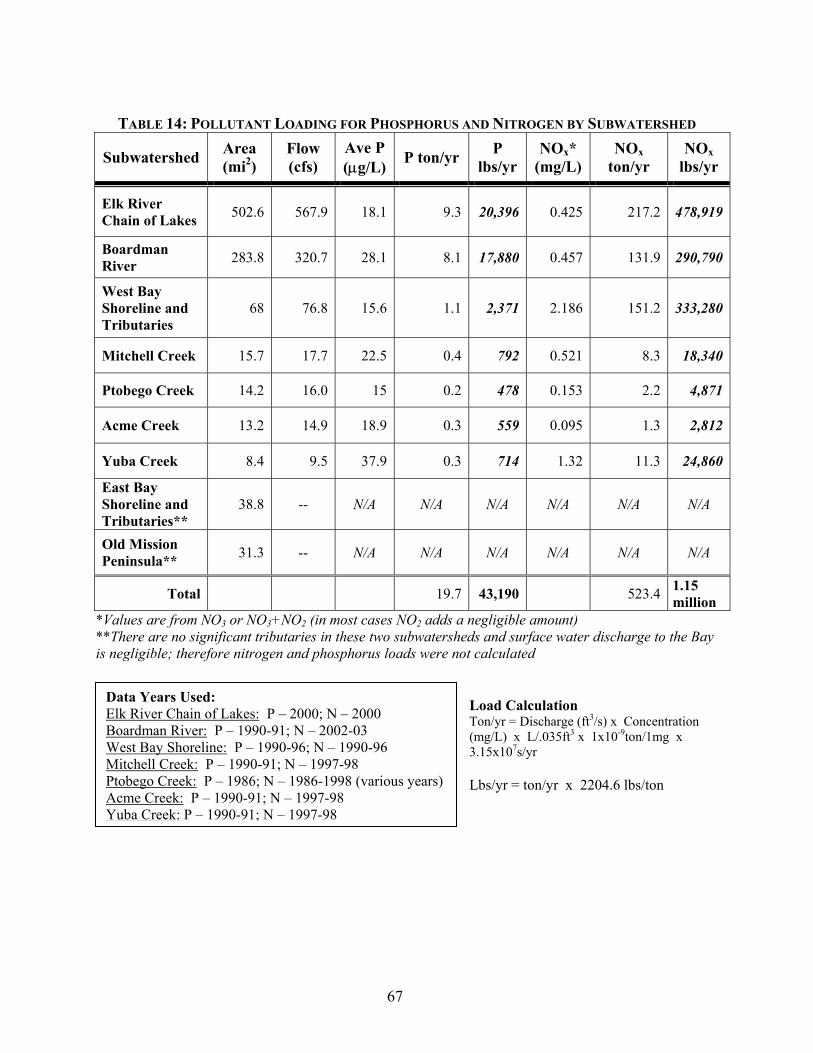
TABLE 14 POLLUTANT LOADING FOR PHOSPHORUS AND NITROGEN BY ……… SUBWATERSHED .............................................................................67
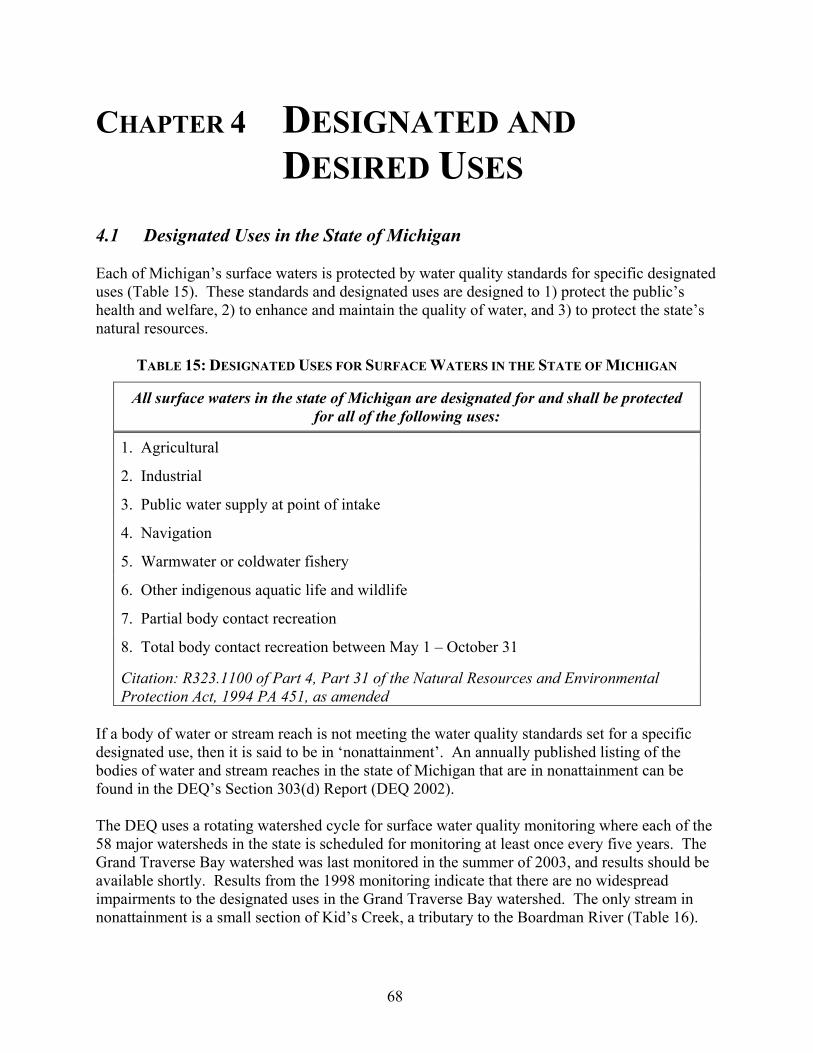
TABLE 15 DESIGNATED USES FOR SURFACE WATERS IN THE ............................. STATE OF MICHIGAN.......................................................................68
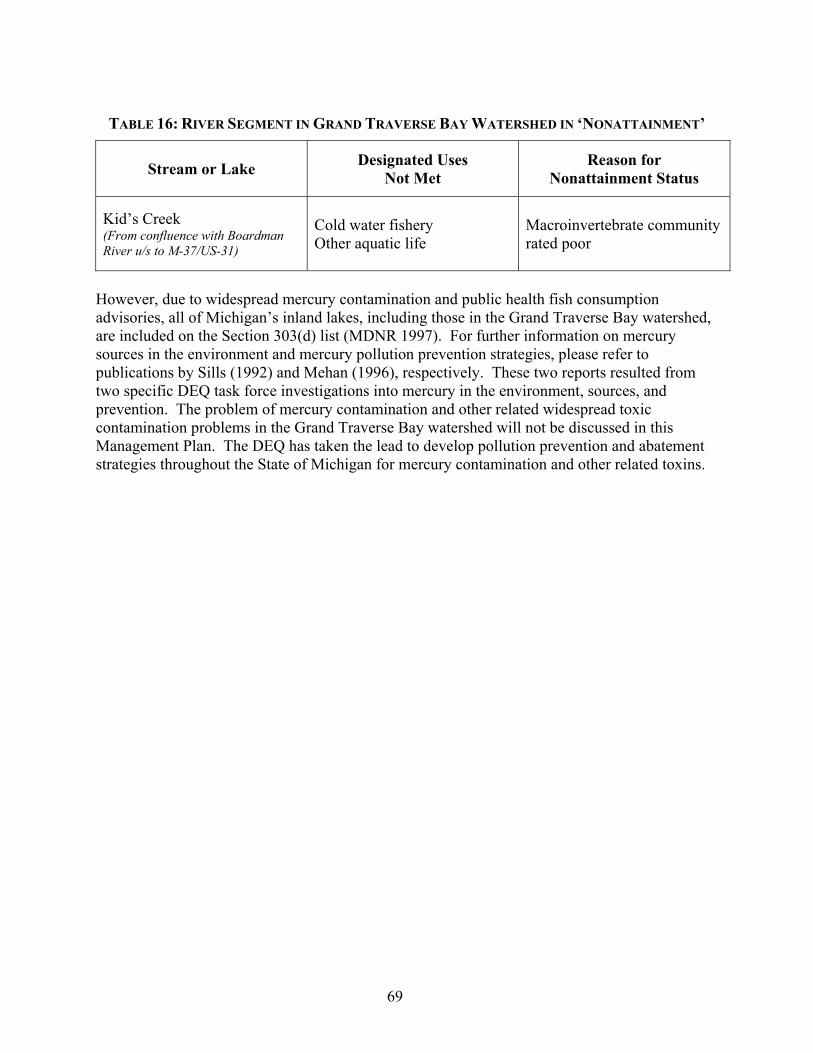
TABLE 16 RIVER SEGMENT IN GRAND TRAVERSE BAY WATERSHED IN ............. ‘NONATTAINMENT’.........................................................................69
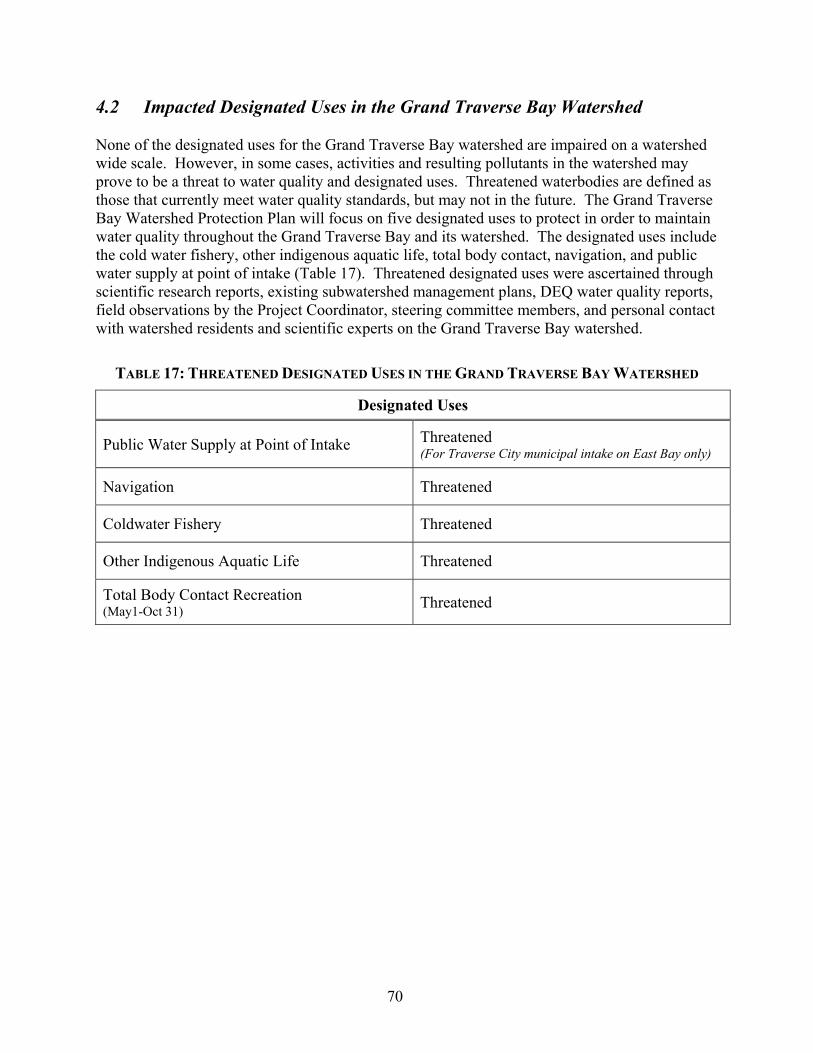
TABLE 17 THREATENED DESIGNATED USES IN THE GRAND TRAVERSE ............. BAY WATERSHED ...........................................................................70
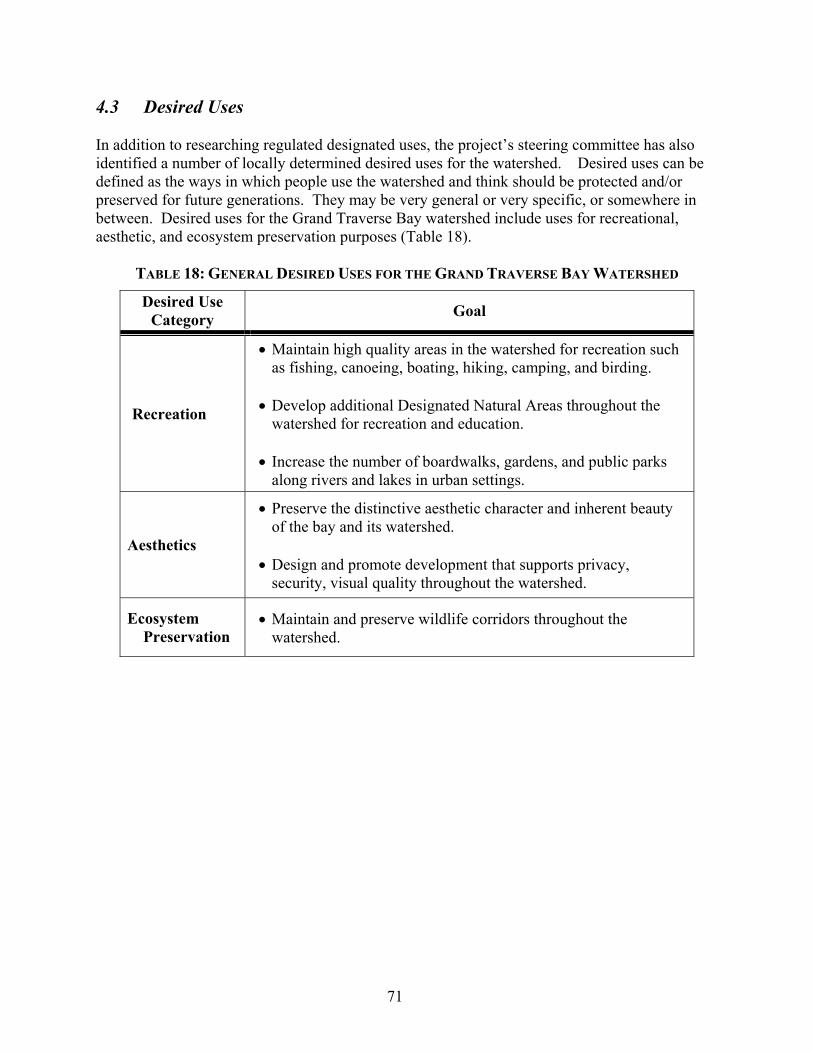
TABLE 18 GENERAL DESIRED USES FOR THE GRAND TRAVERSE ....................... BAY WATERSHED ...........................................................................71
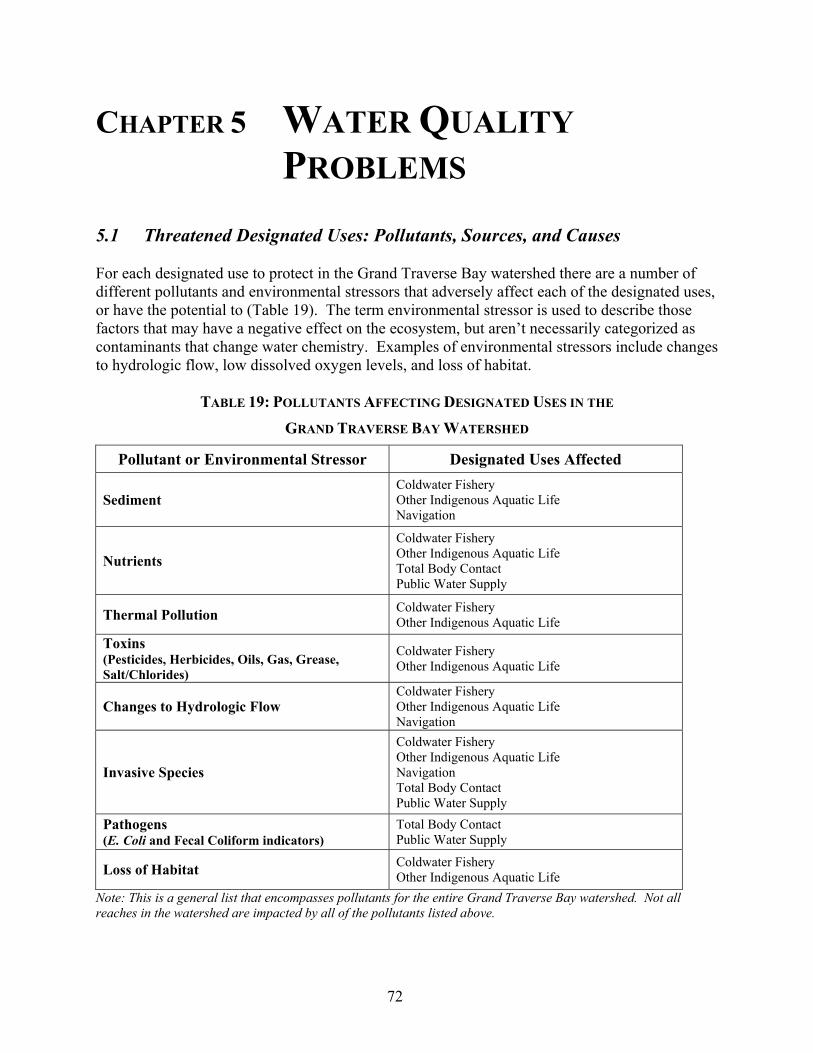
TABLE 19 POLLUTANTS AFFECTING DESIGNATED USES IN THE ......................... GRAND TRAVERSE BAY WATERSHED.............................................72
VII
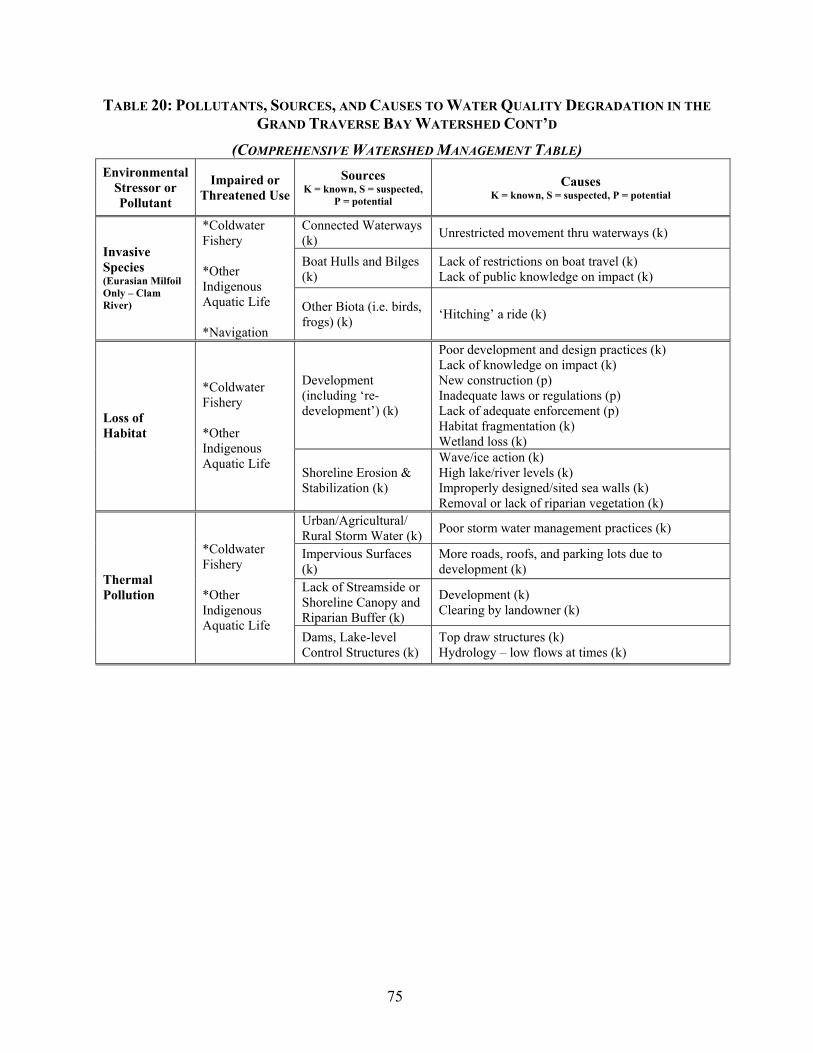
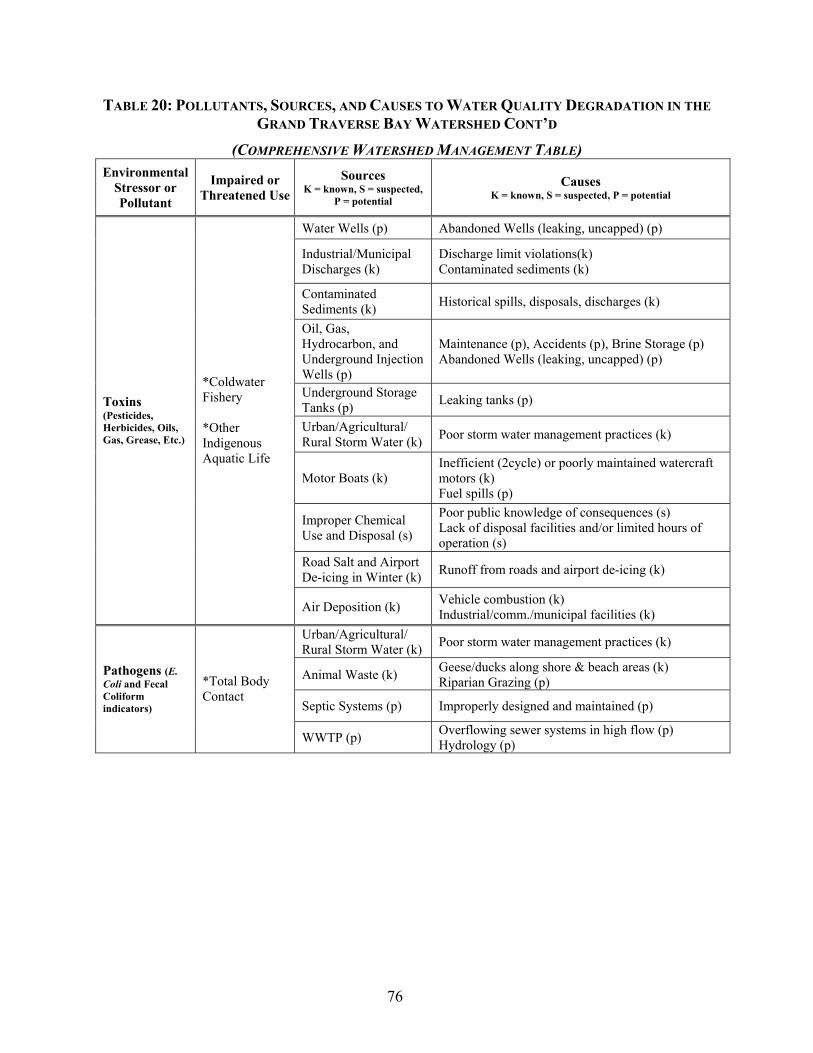
TABLE 20 POLLUTANTS, SOURCES, AND CAUSES TO WATER QUALITY .............. DEGRADATION IN THE GRAND TRAVERSE BAY WATERSHED ............. (COMPREHENSIVE WATERSHED MANAGEMENT TABLE) ............... 73-76
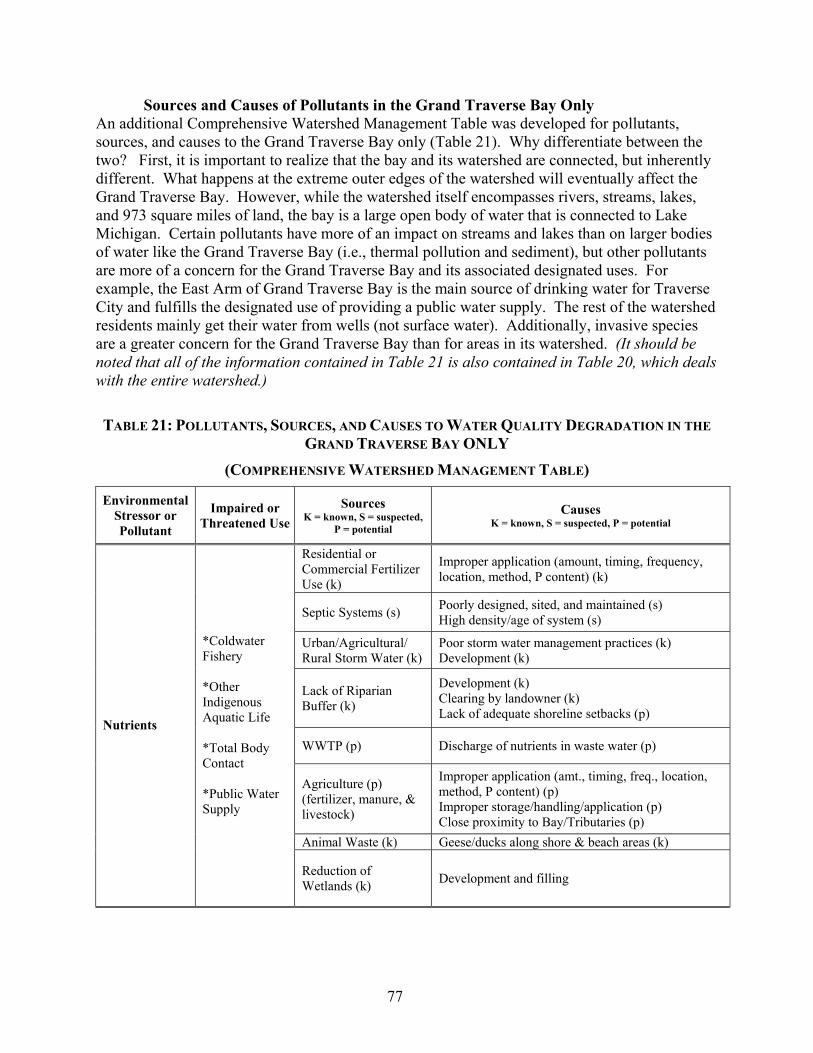
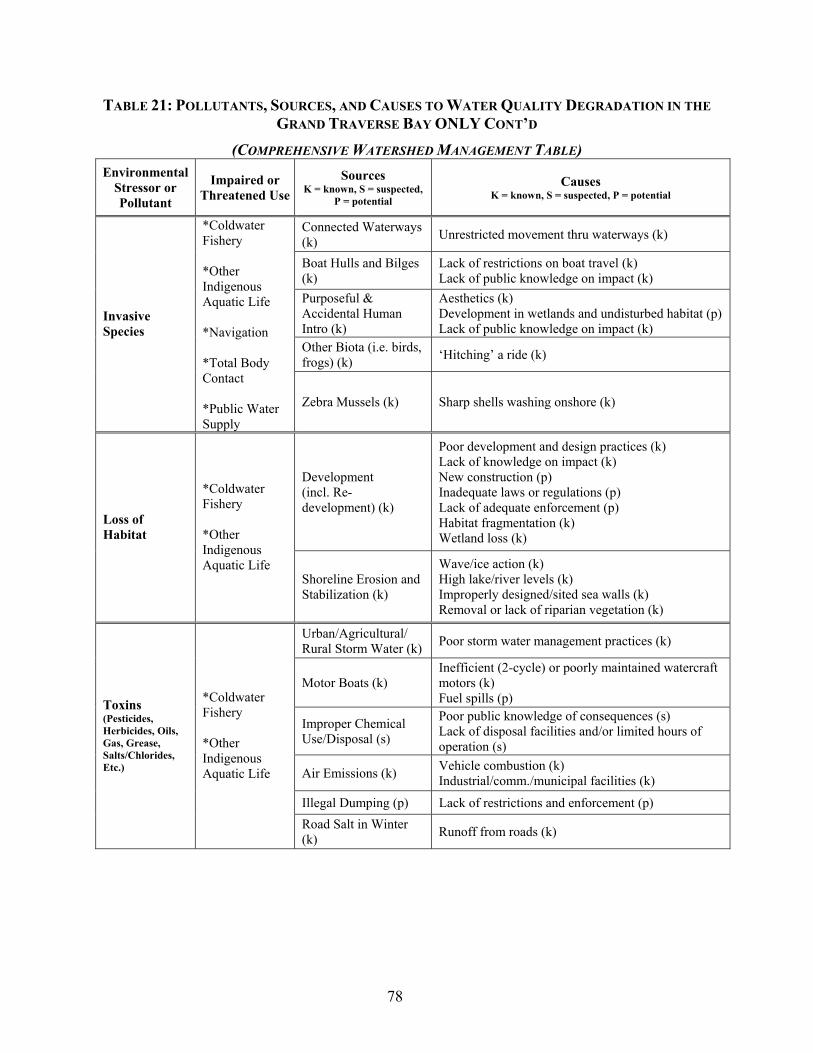
TABLE 21 POLLUTANTS, SOURCES, AND CAUSES TO WATER QUALITY .............. DEGRADATION IN THE GRAND TRAVERSE BAY ONLY ...................... (COMPREHENSIVE WATERSHED MANAGEMENT TABLE)........... 77-79
TABLE 22 POLLUTANT PRIORITIES FOR THE GRAND TRAVERSE ......................... BAY WATERSHED ...........................................................................80
TABLE 23 POLLUTANT PRIORITIES FOR THREATENED DESIGNATED USES ......81
TABLE 25 PRIORITY AREAS IN THE GRAND TRAVERSE BAY WATERSHED ......84
TABLE 26 ROAD STREAM CROSSING AND STREAMBANK EROSION ..................... INVENTORIES IN THE GRAND TRAVERSE BAY WATERSHED...... 96-98
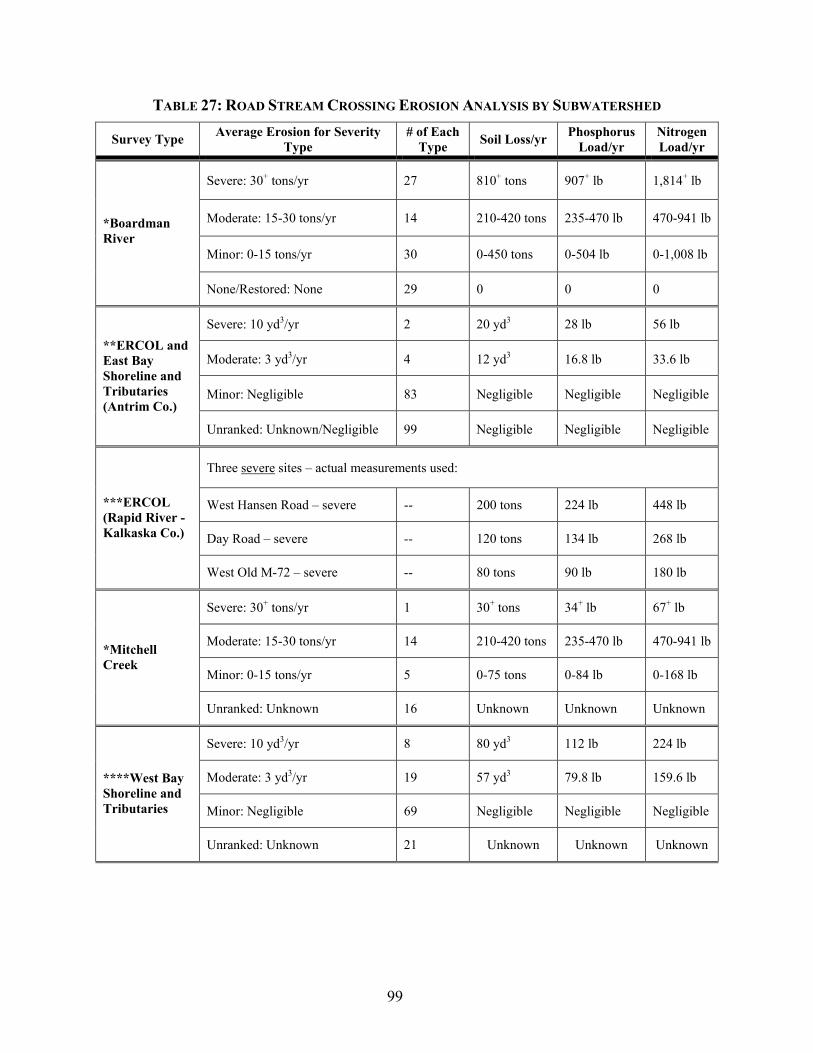
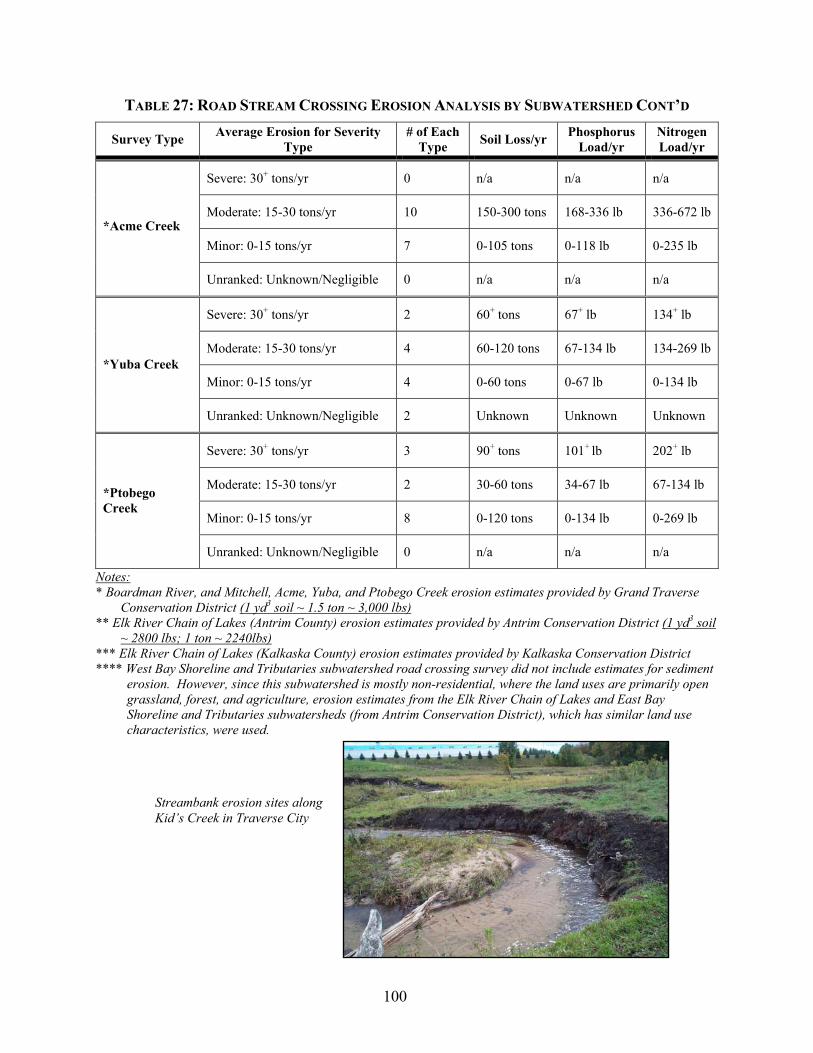
TABLE 27 ROAD STREAM CROSSING ANALYSIS BY SUBWATERSHED...... 99-100
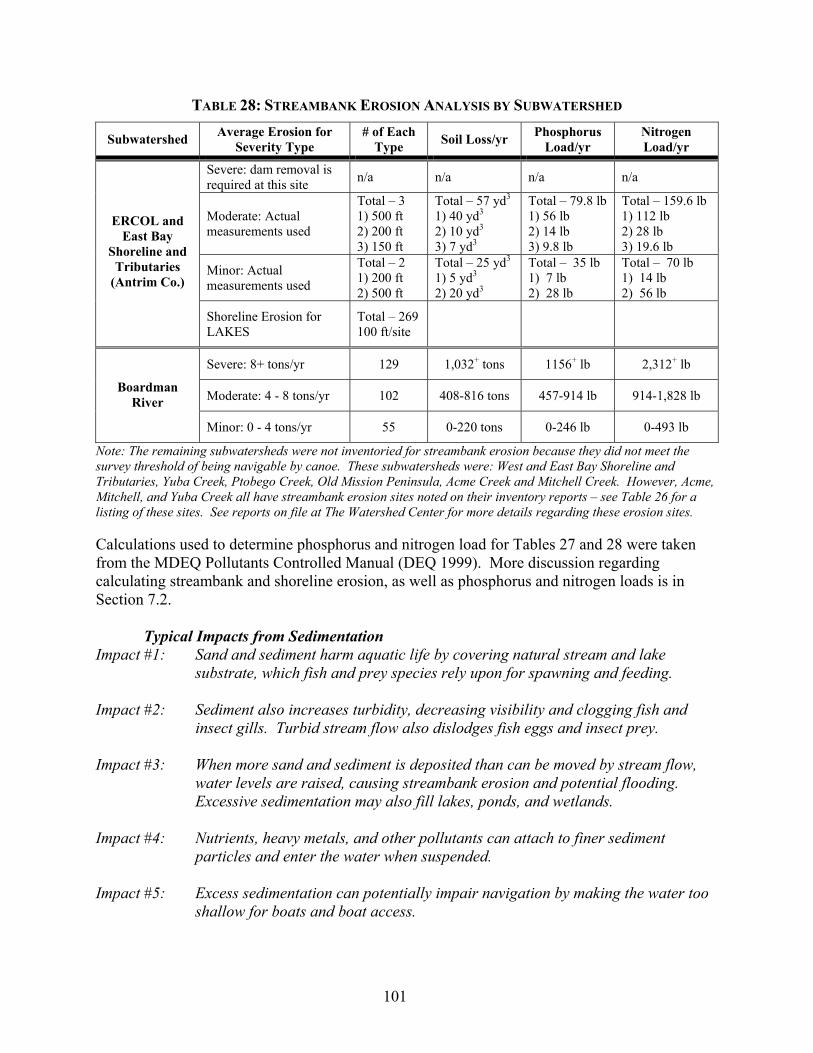
TABLE 28 STREAMBANK EROSION ANALYSIS BY SUBWATERSHED ...............101
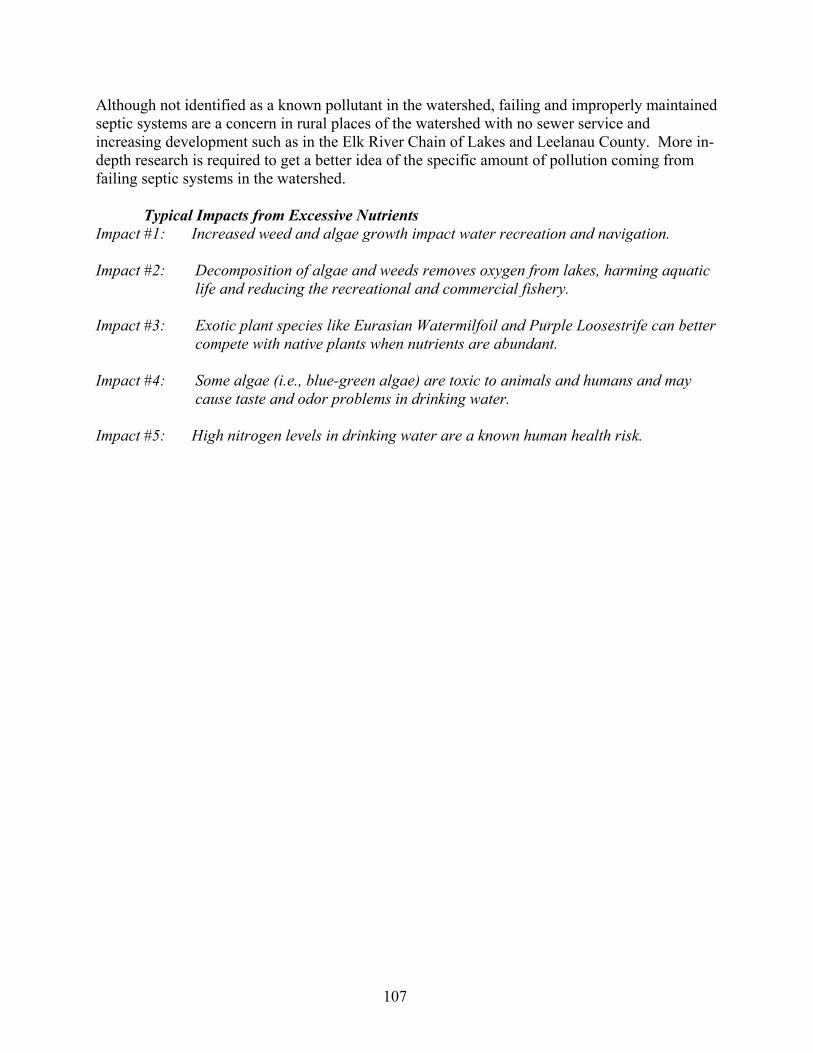
TABLE 29 AGRICULTURAL LAND USES IN GRAND TRAVERSE BAY WATERSHED PRIORITY AREAS......................................................105
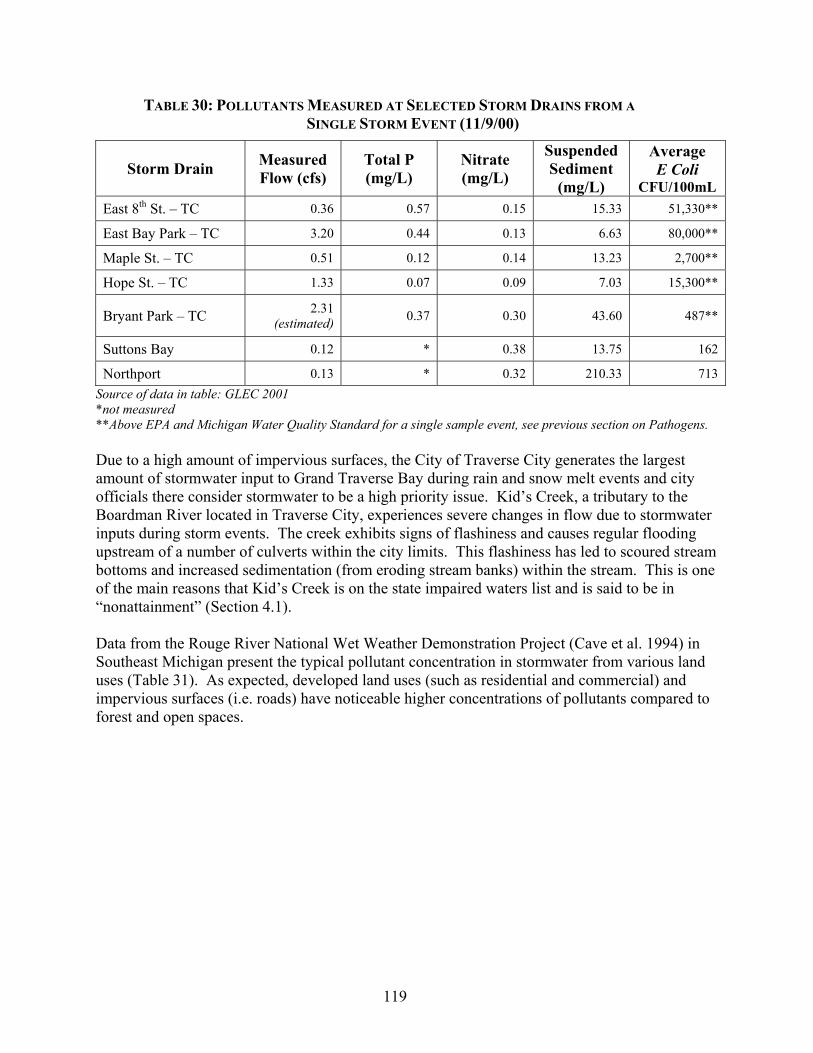
TABLE 30 POLLUTANTS MEASURED AT SELECTED STORM DRAINS FROM A SINGLE STORM EVENT...............................................................119
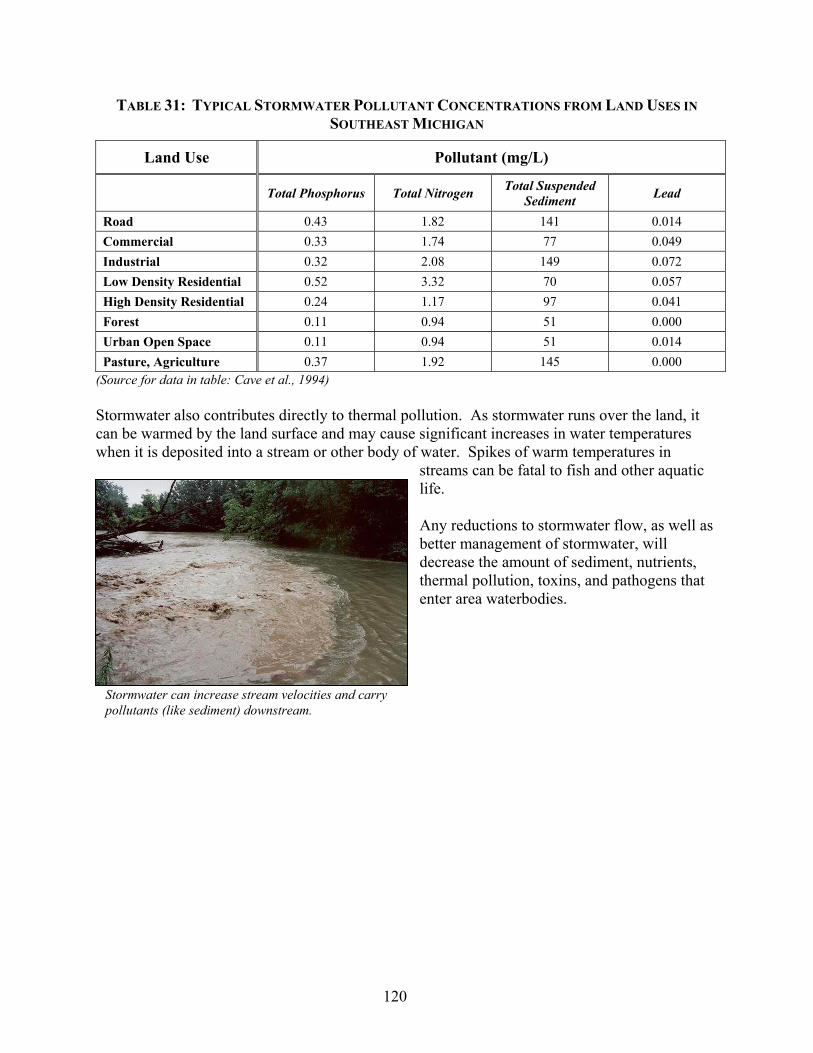
TABLE 31 TYPICAL STORMWATER POLLUTANT CONCENTRATIONS FROM LAND USES IN SOUTHEAST MICHIGAN .........................................120
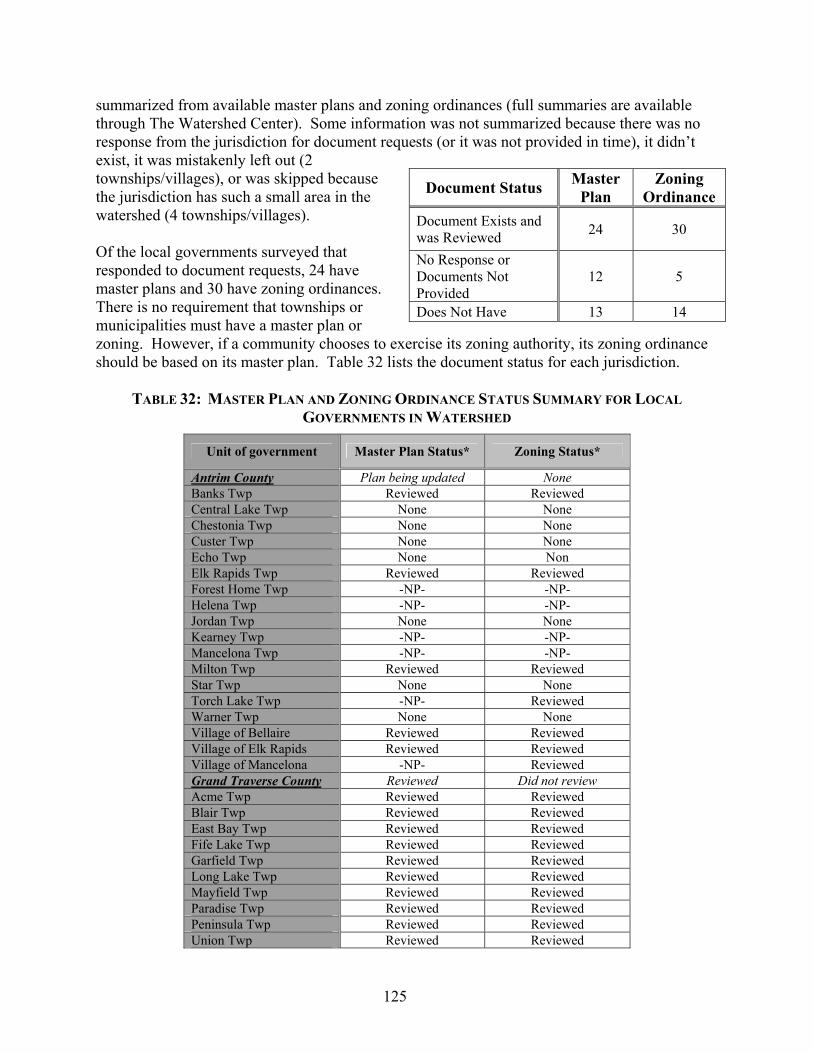
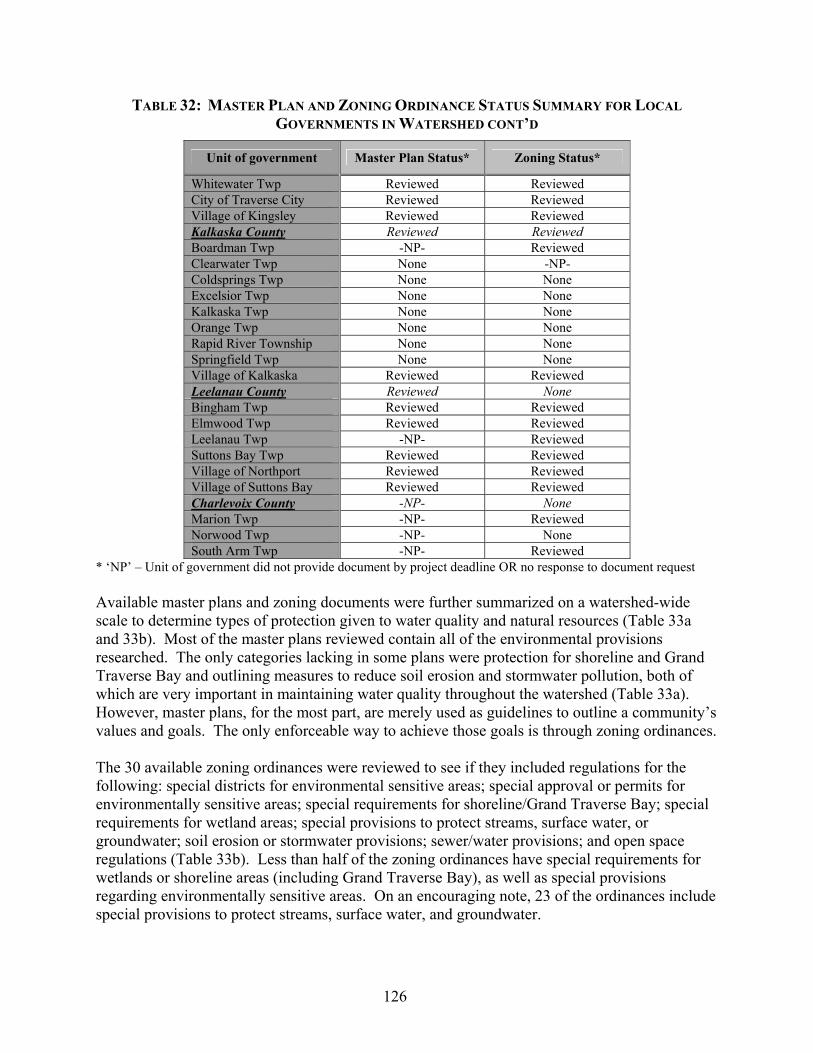
TABLE 32 MASTER PLAN AND ZONING ORDINANCE STATUS SUMMARY ............ FOR LOCAL GOVERNMENTS IN WATERSHED ......................... 125-126
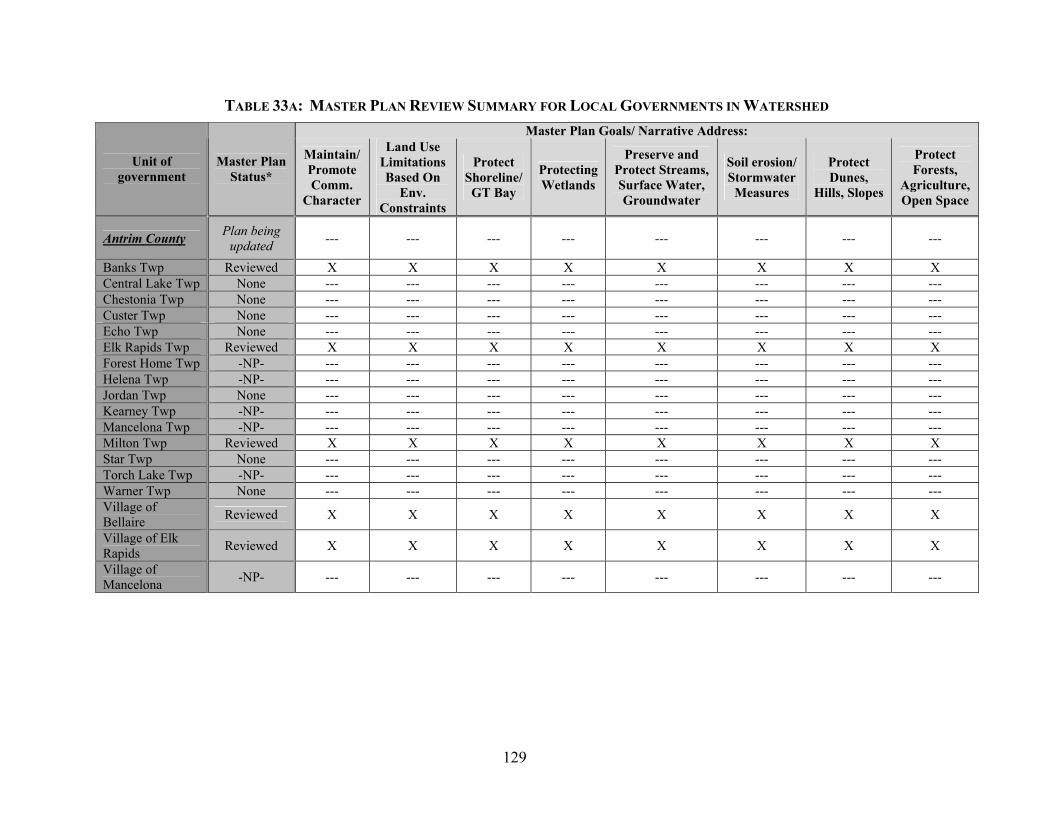
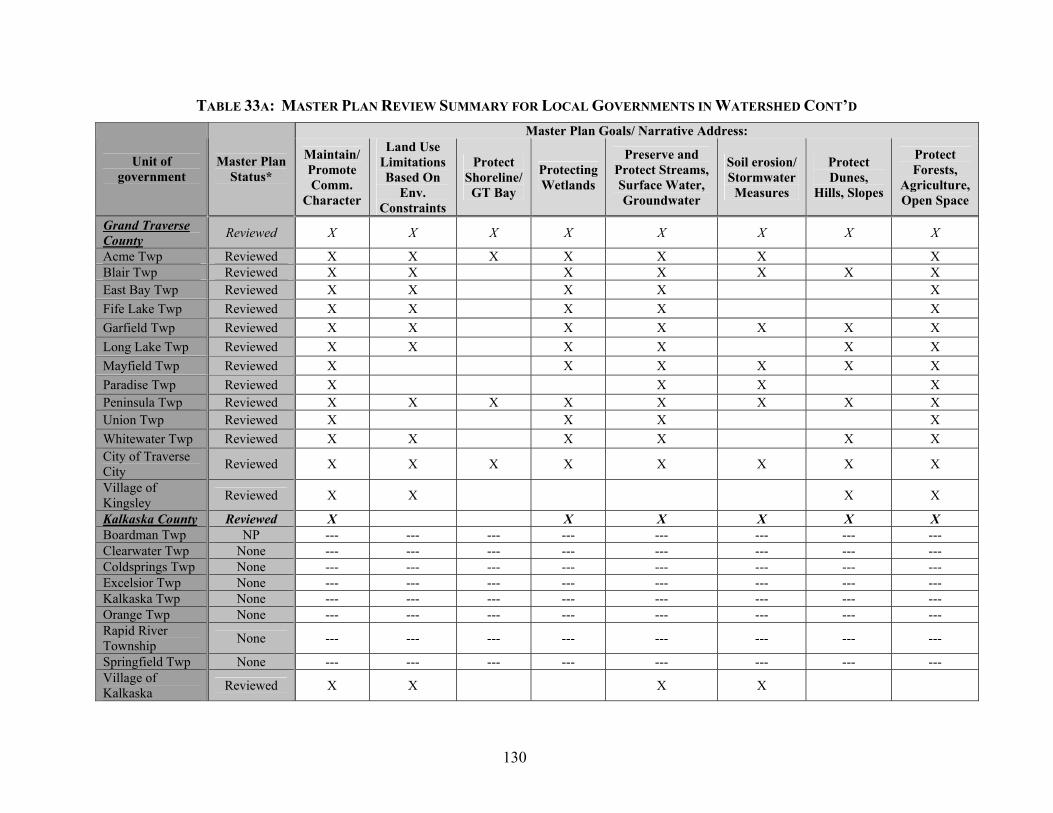
TABLE 33A MASTER PLAN REVIEW SUMMARY FOR LOCAL .................................. GOVERNMENTS ..................................................................... 129-131
TABLE 33B ZONING ORDINANCE REVIEW SUMMARY FOR LOCAL GOVERNMENTS ..................................................................... 132-134
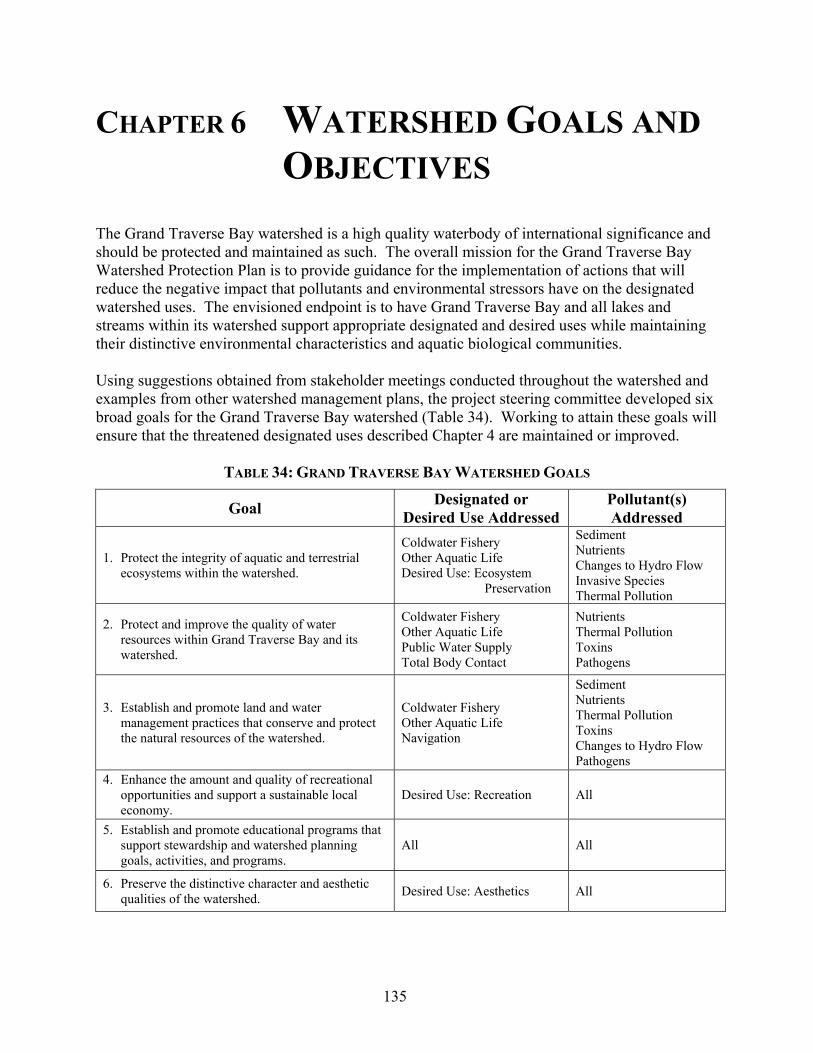
TABLE 34 GRAND TRAVERSE BAY WATERSHED GOALS...............................135
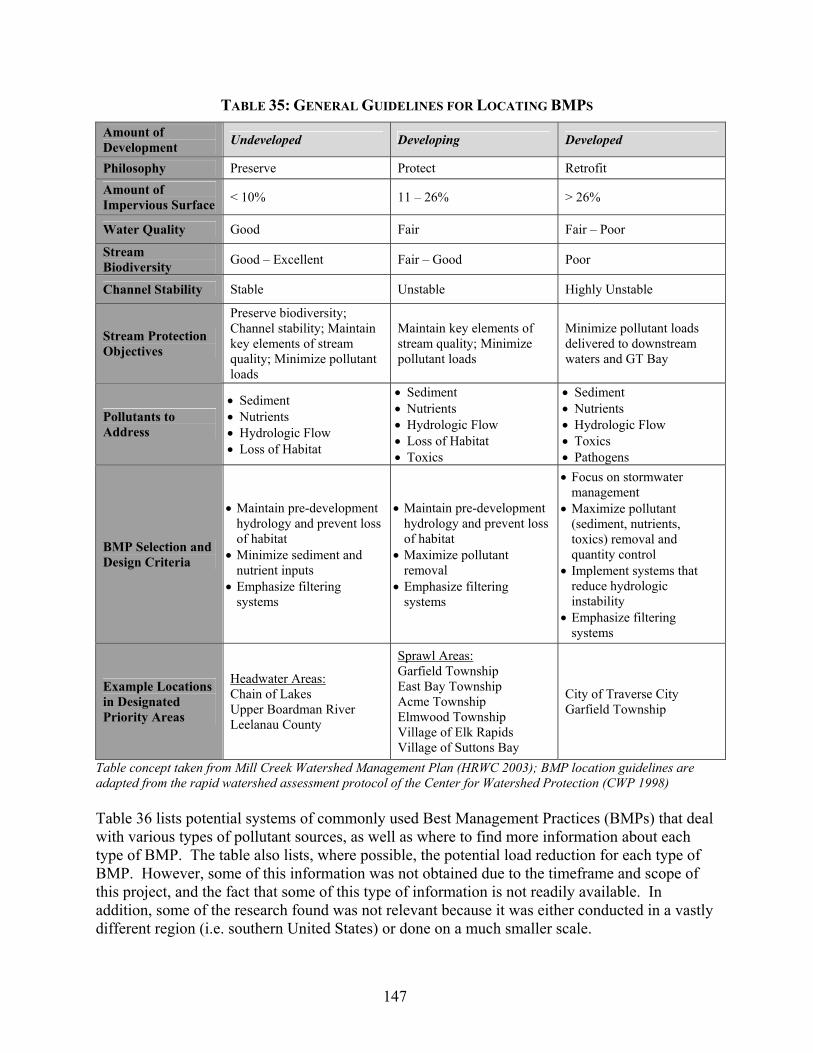
TABLE 35 GENERAL GUIDELINES FOR LOCATING BMPS ..............................147
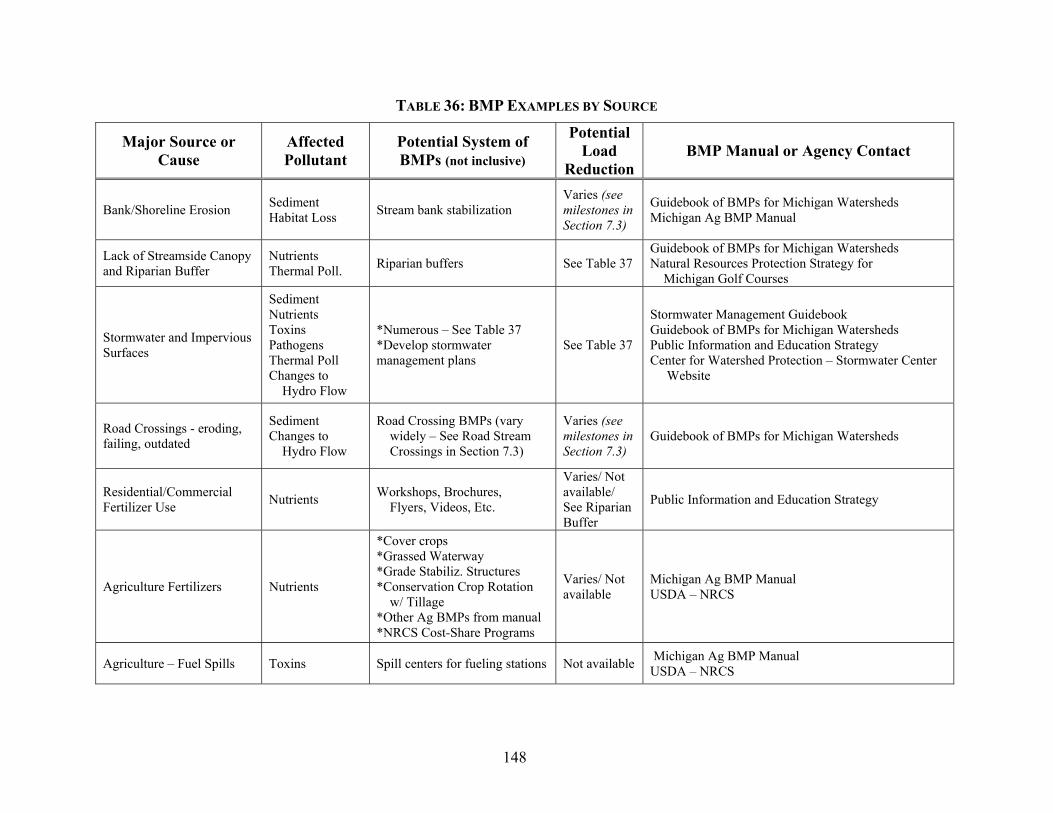
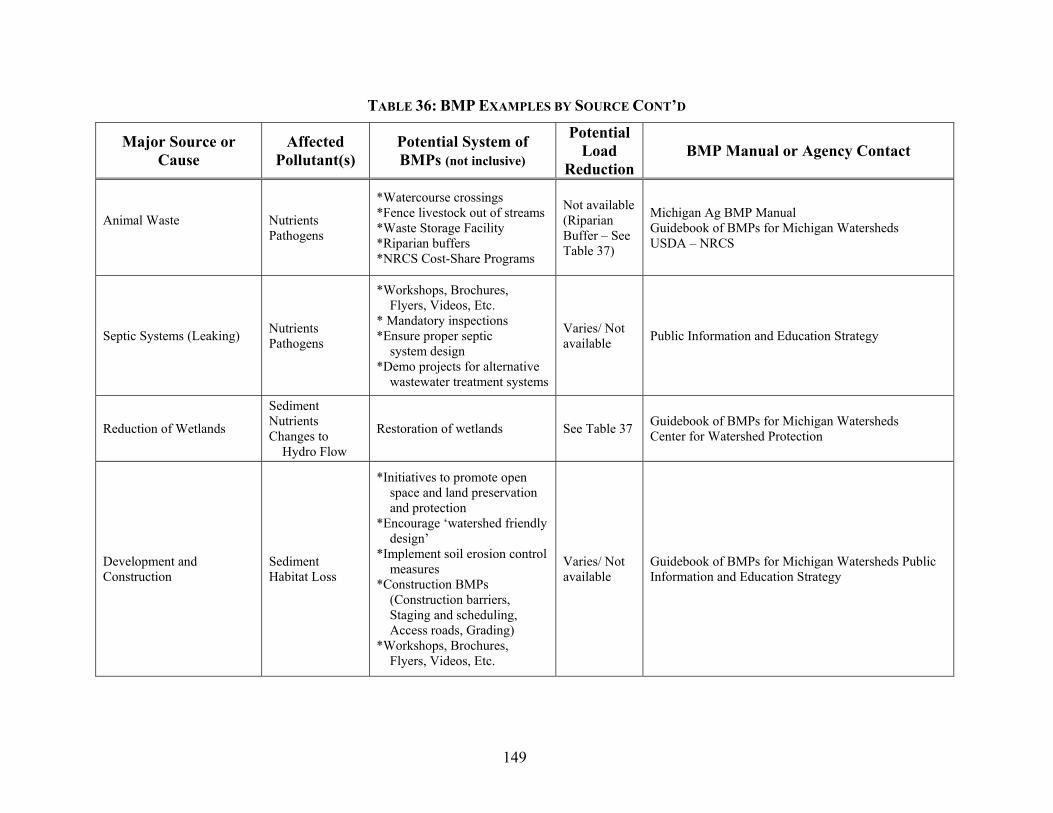
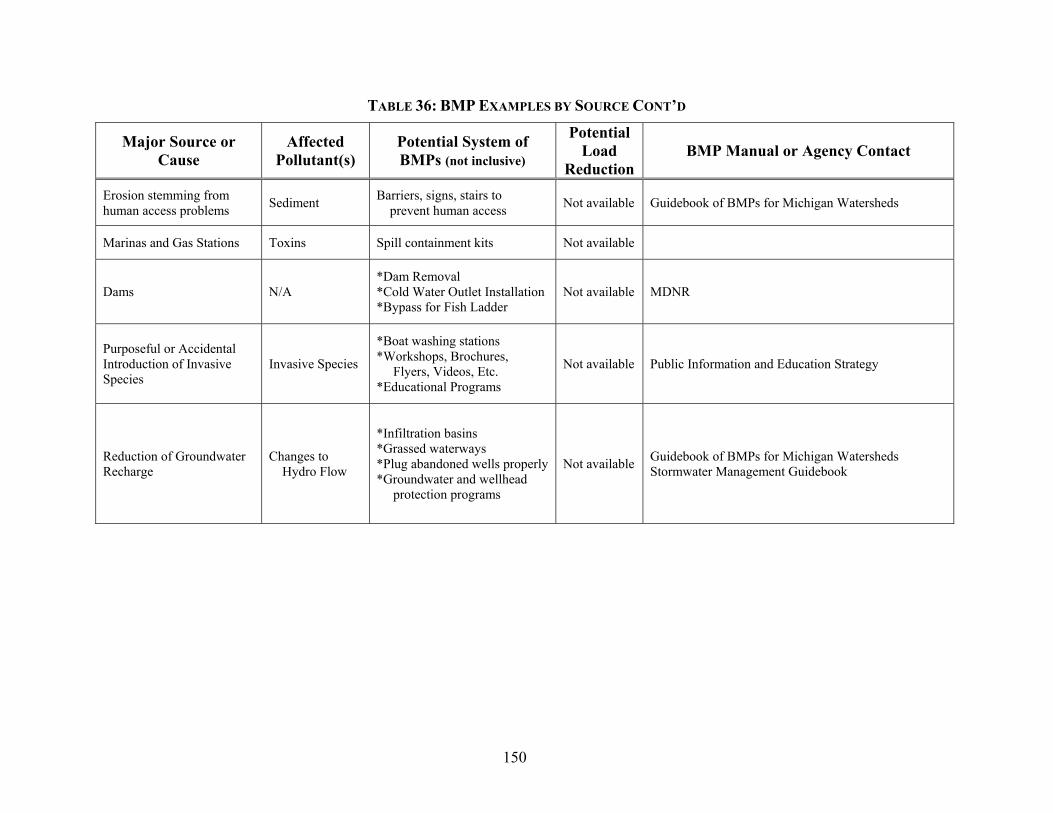
TABLE 36 BMP EXAMPLES BY SOURCE ................................................ 148-150
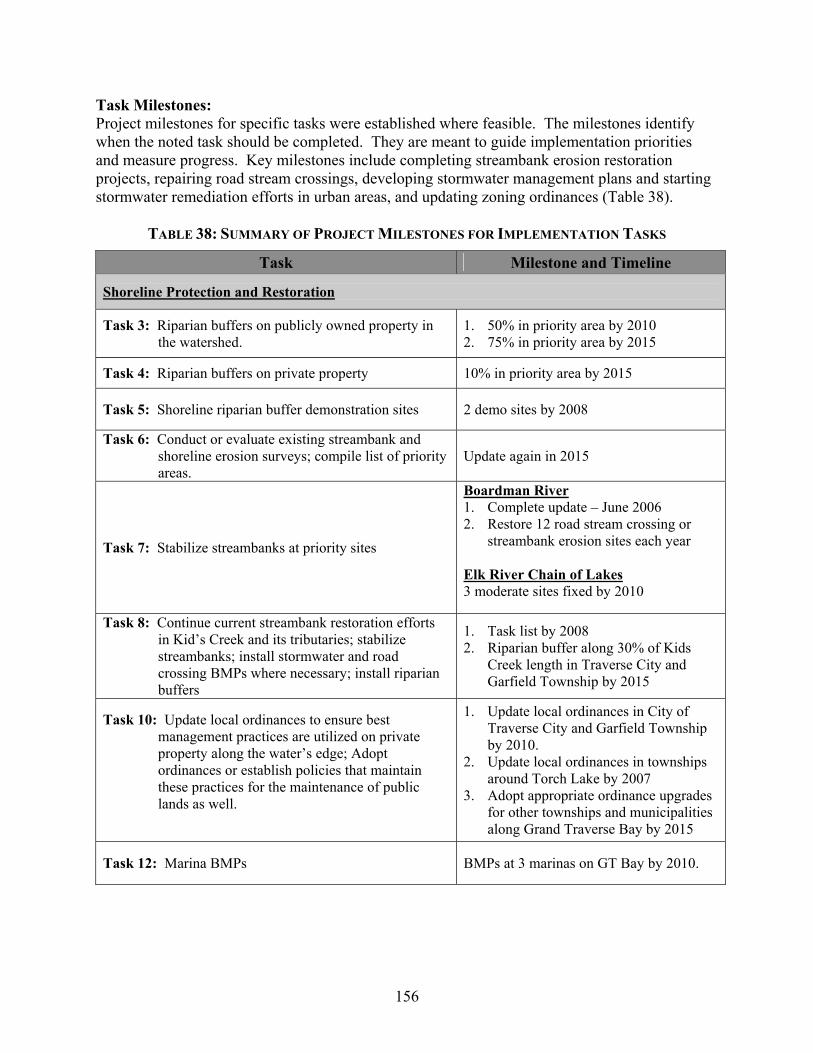
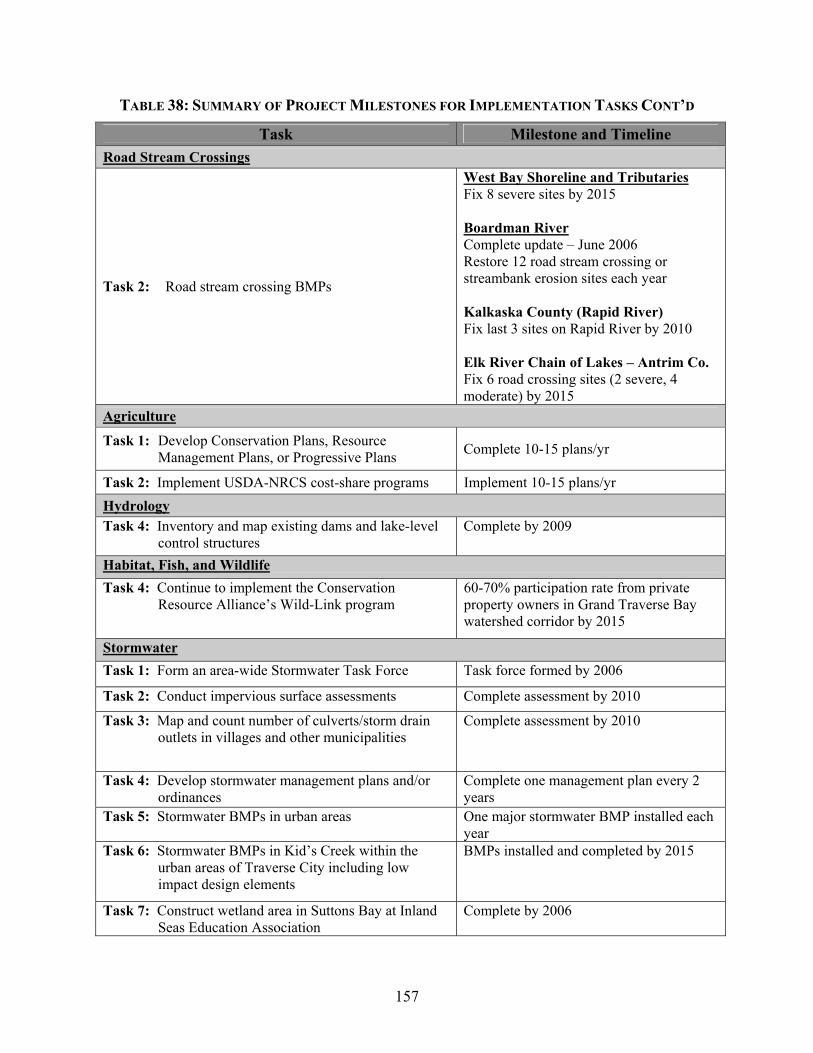
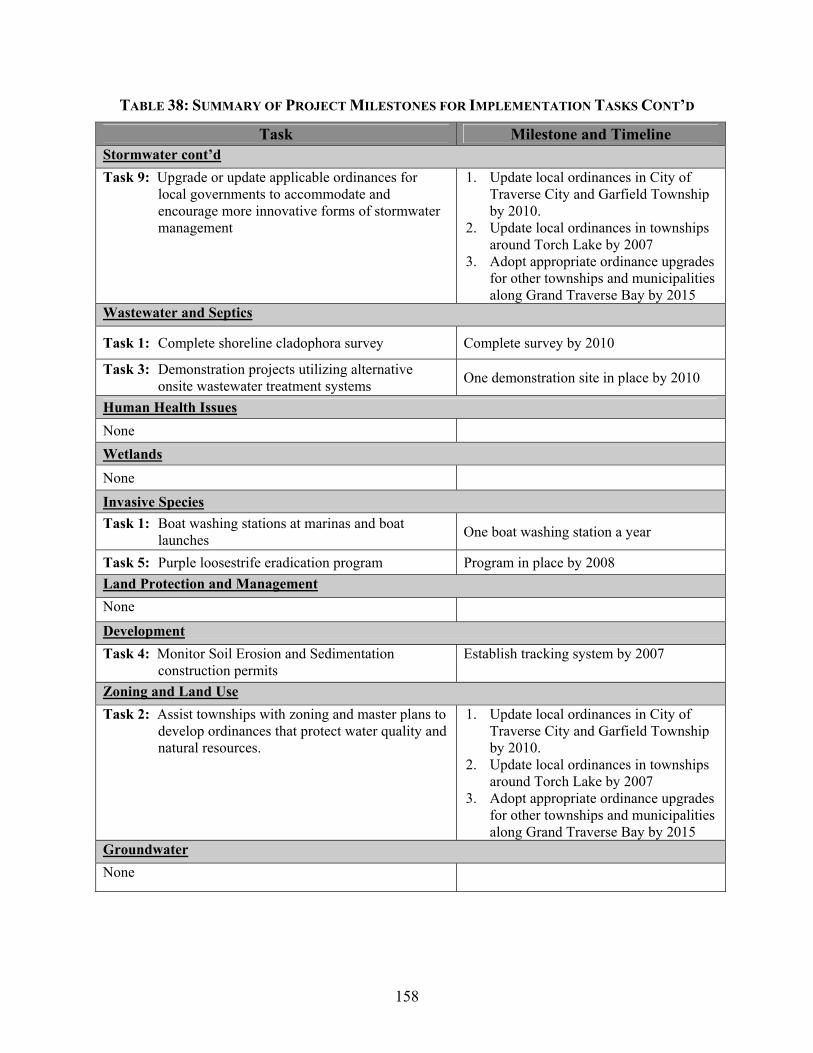
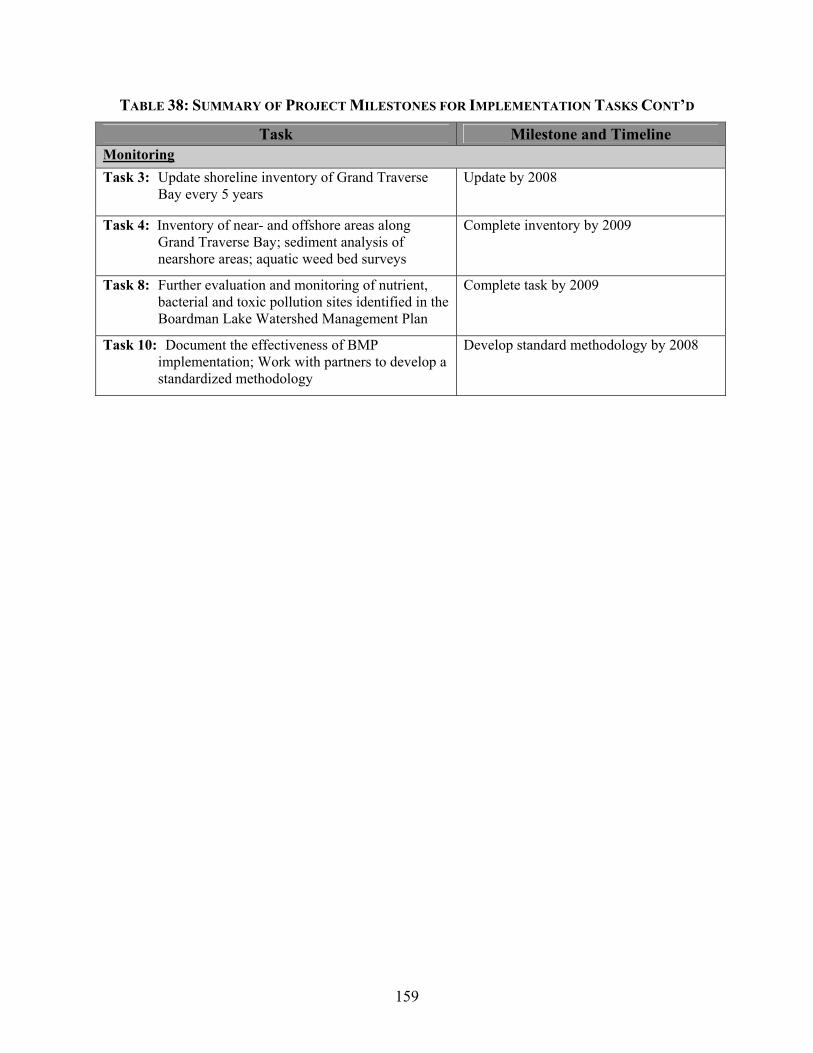
TABLE 38 SUMMARY OF PROJECT MILESTONES FOR IMPLEMENTATION ............. TASKS ................................................................................... 156-159
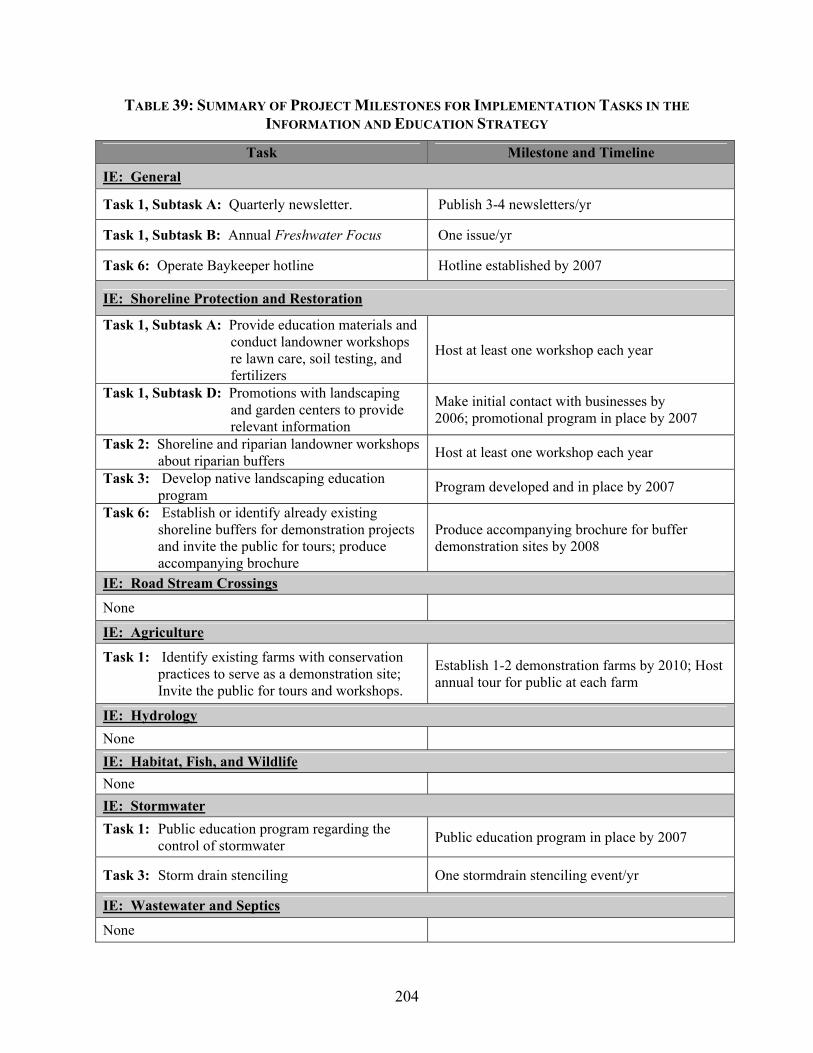
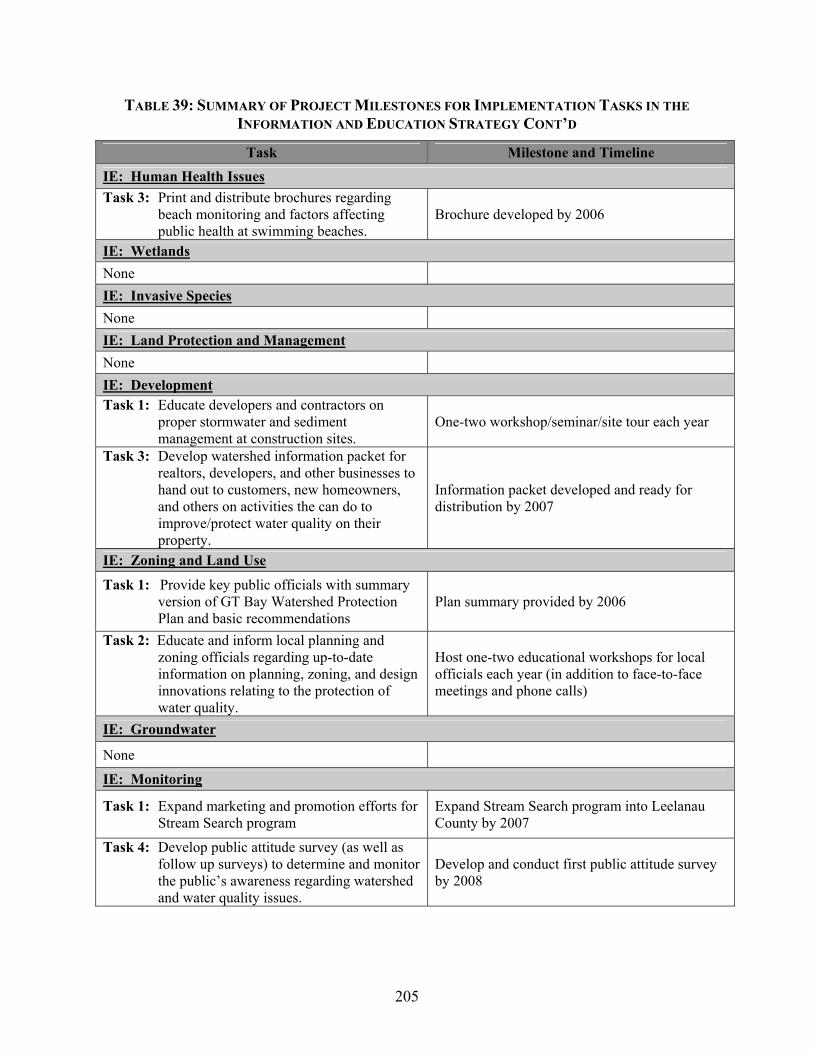
TABLE 39 SUMMARY OF PROJECT MILESTONES FOR IMPLEMENTATION ............. TASKS IN THE INFORMATION AN EDUCATION STRATEGY...... 204-205
VIII
APPENDICES APPENDIX A PLAN DEVELOPMENT PROCESS
APPENDIX B EVALUATION
APPENDIX C FIELD ASSESSMENT OF THE GRAND TRAVERSE BAY SHORELINE
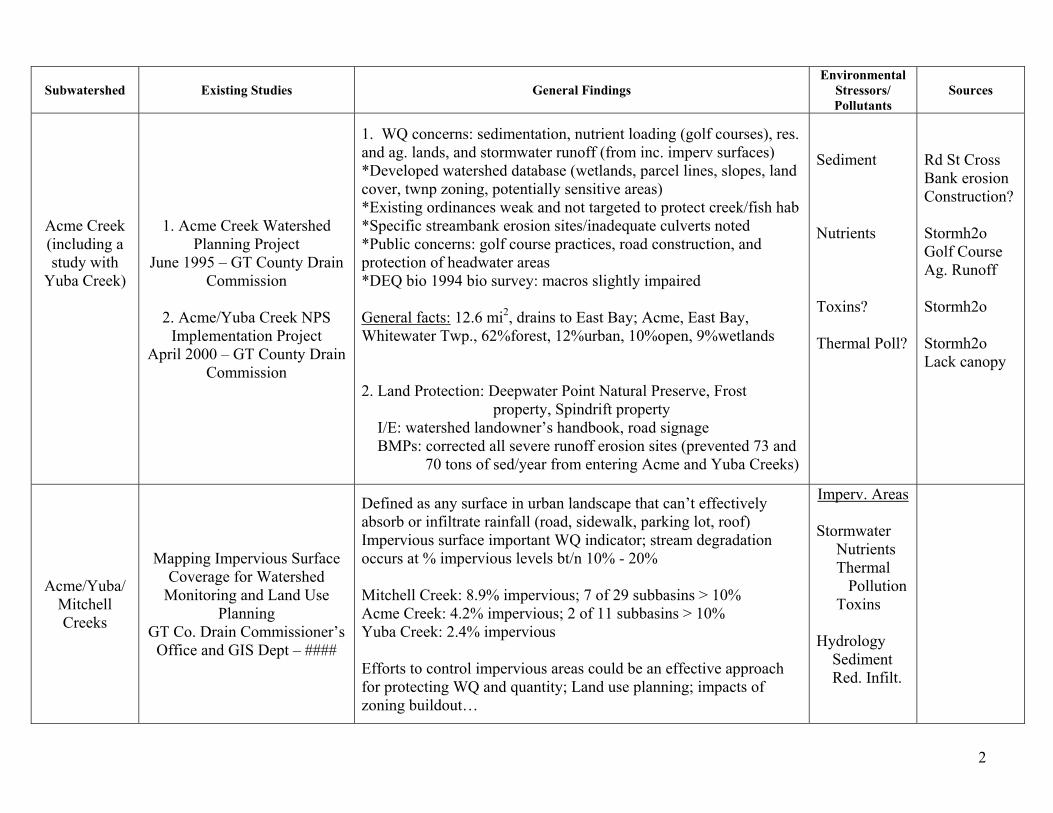
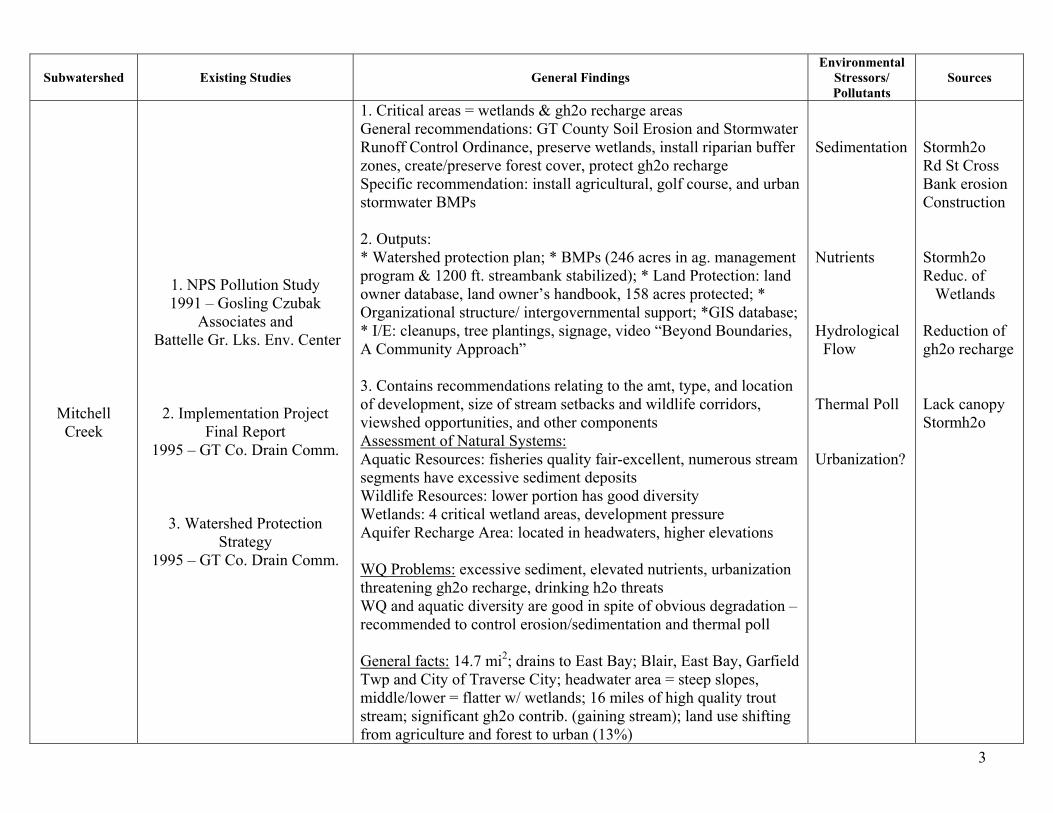
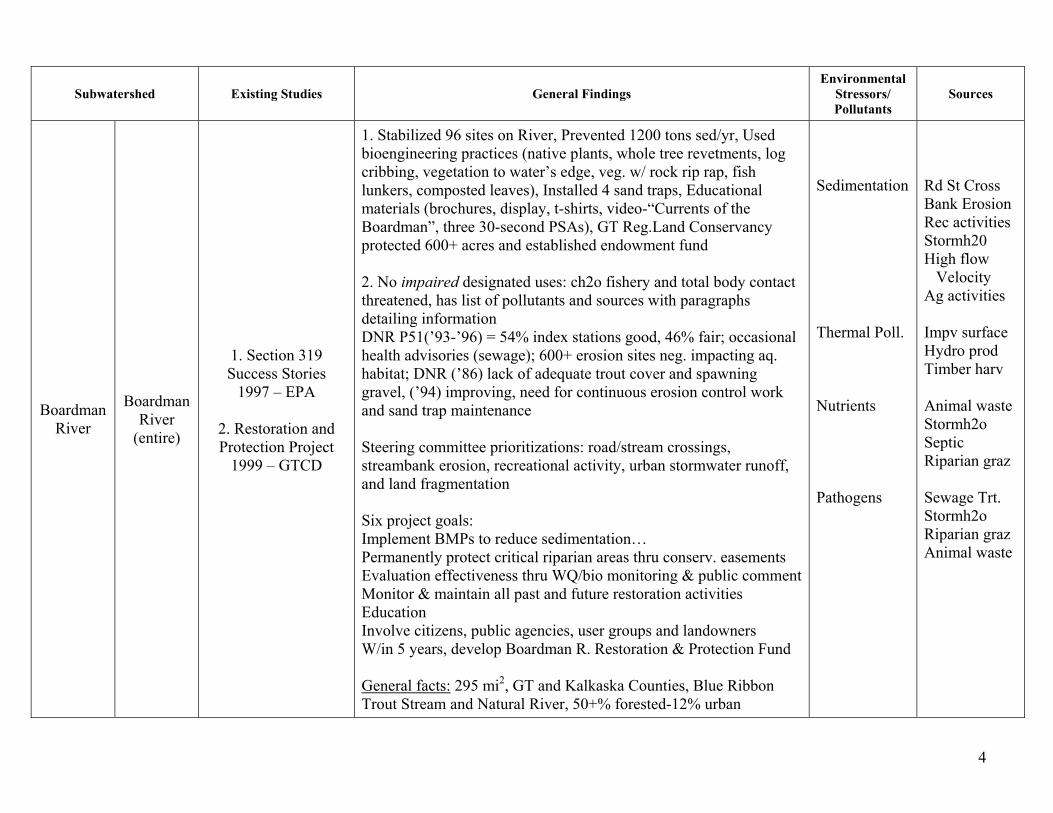
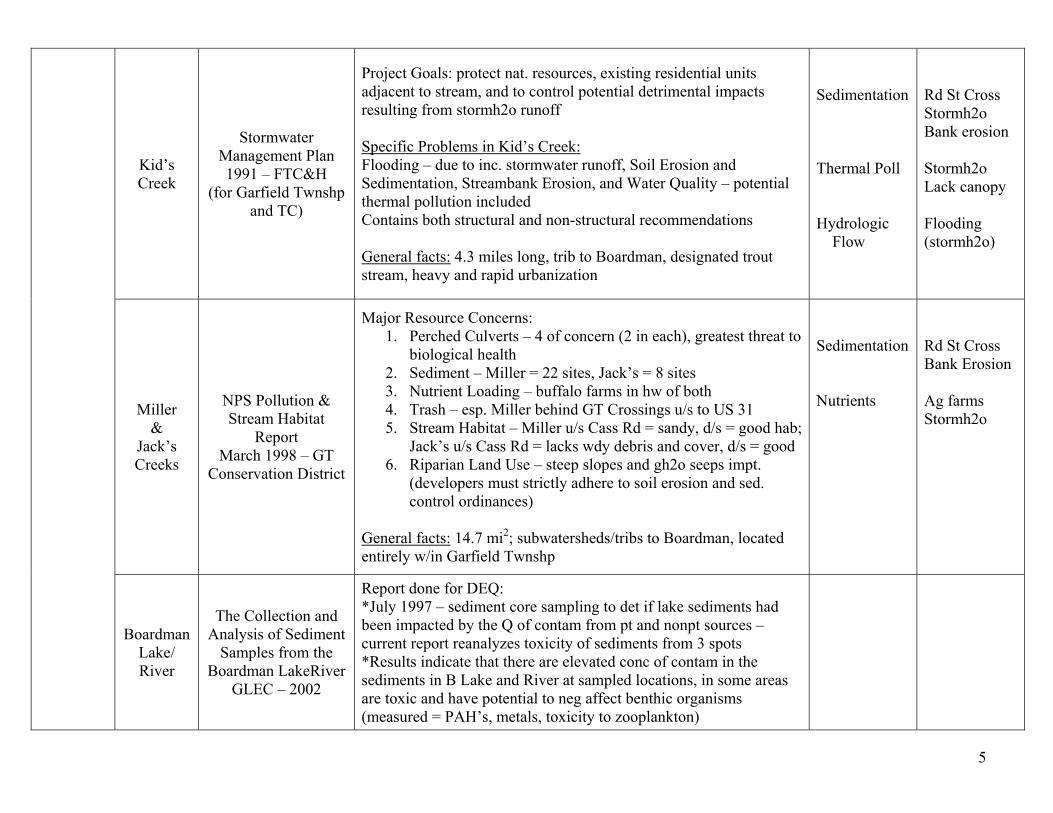
APPENDIX D SUMMARY OF EXISTING WATERSHED PLANS AND OTHER RESEARCH STUDIES
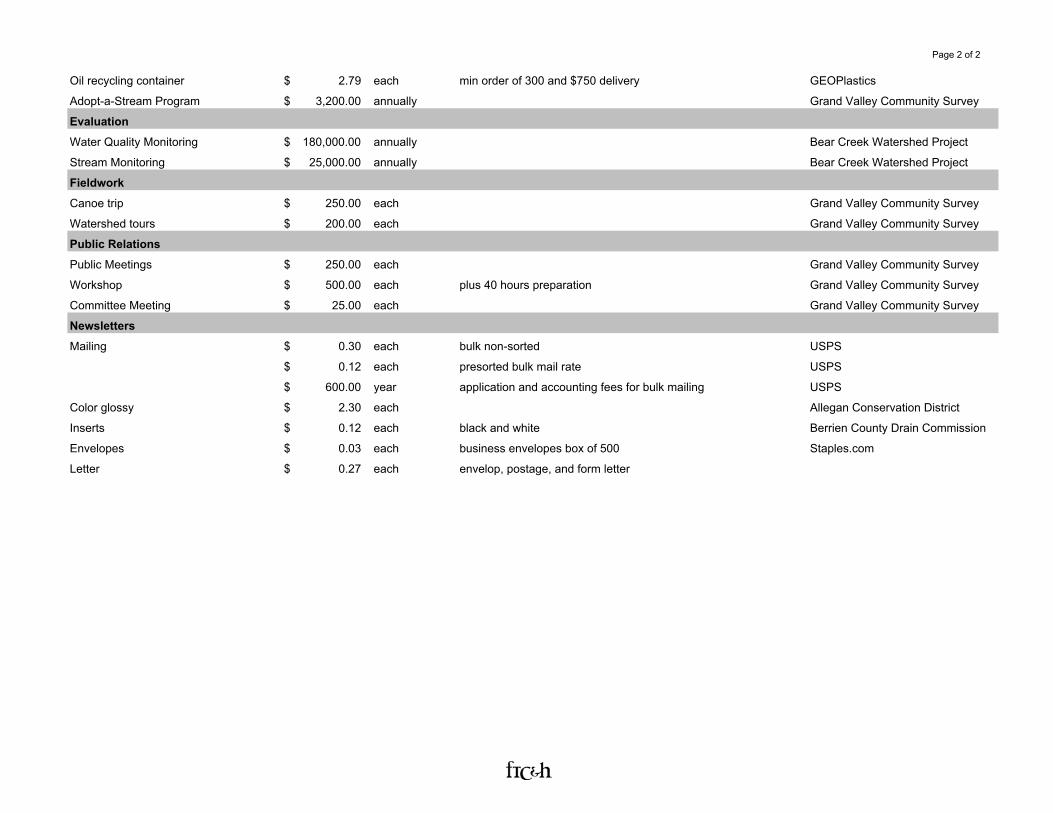
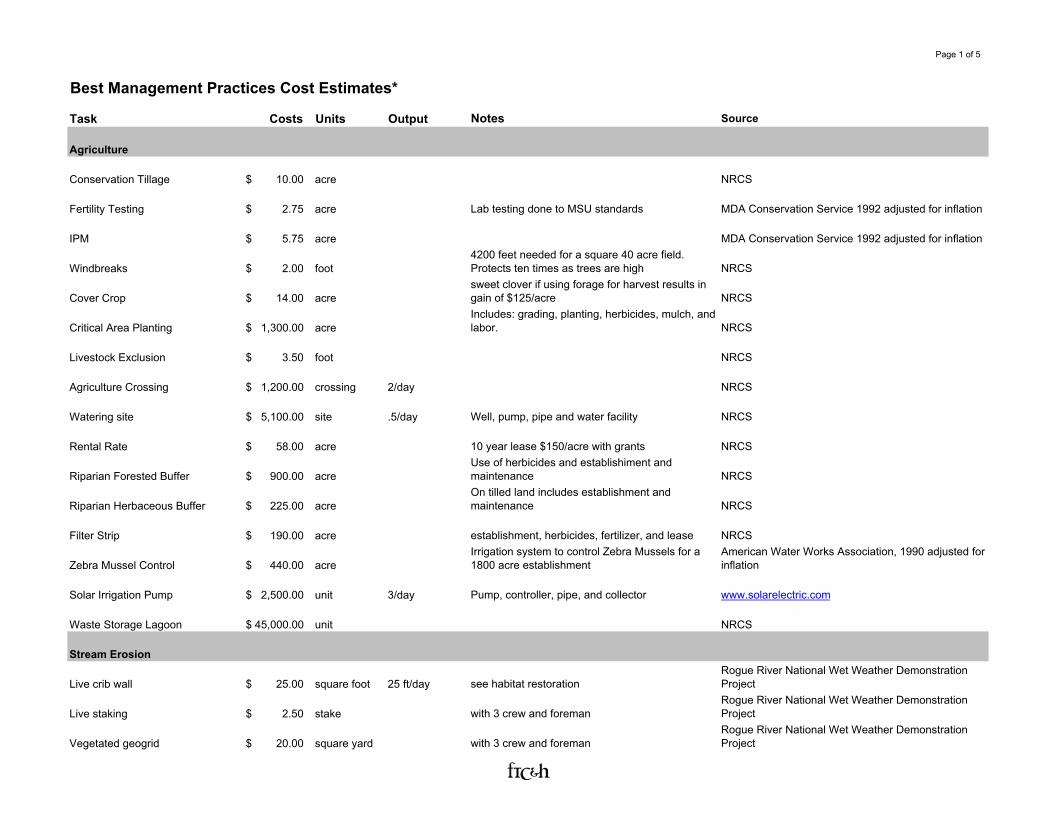
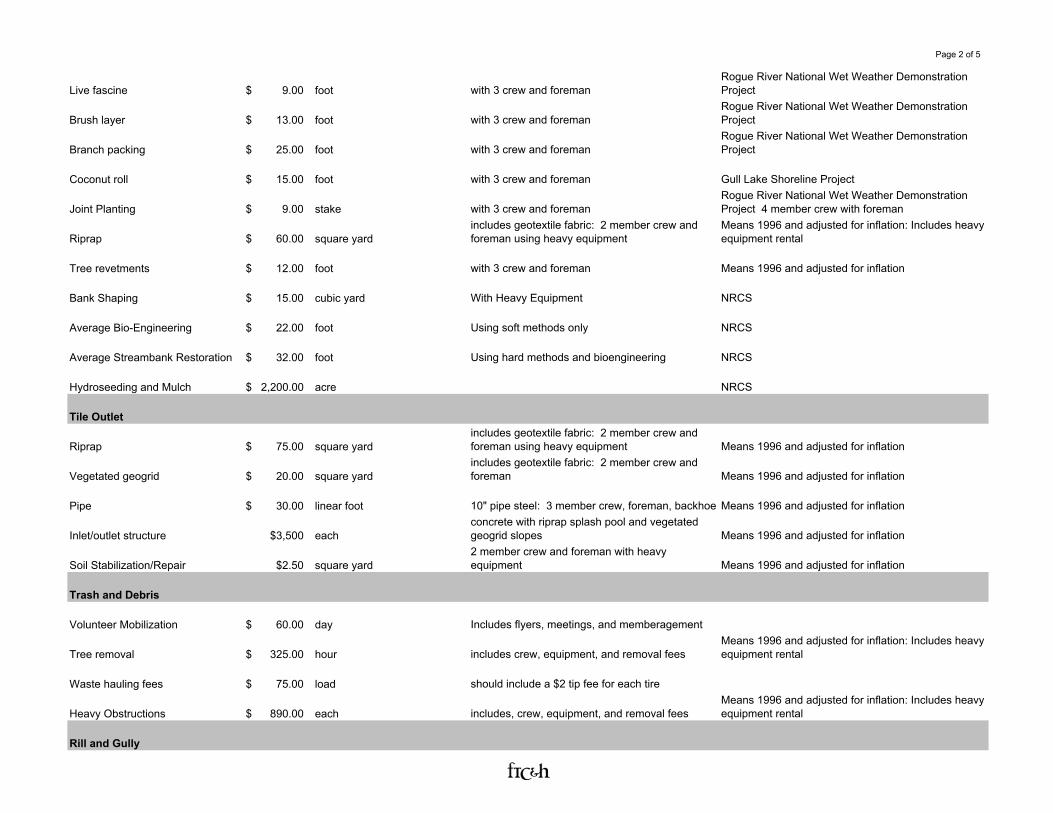
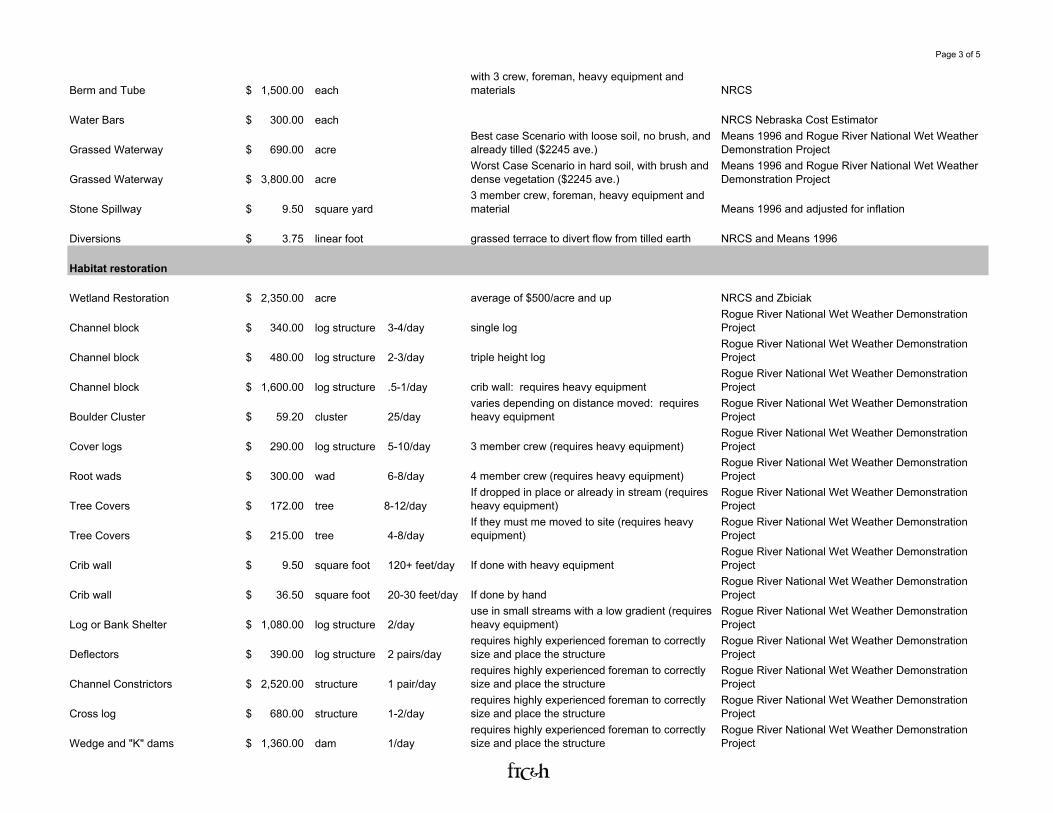
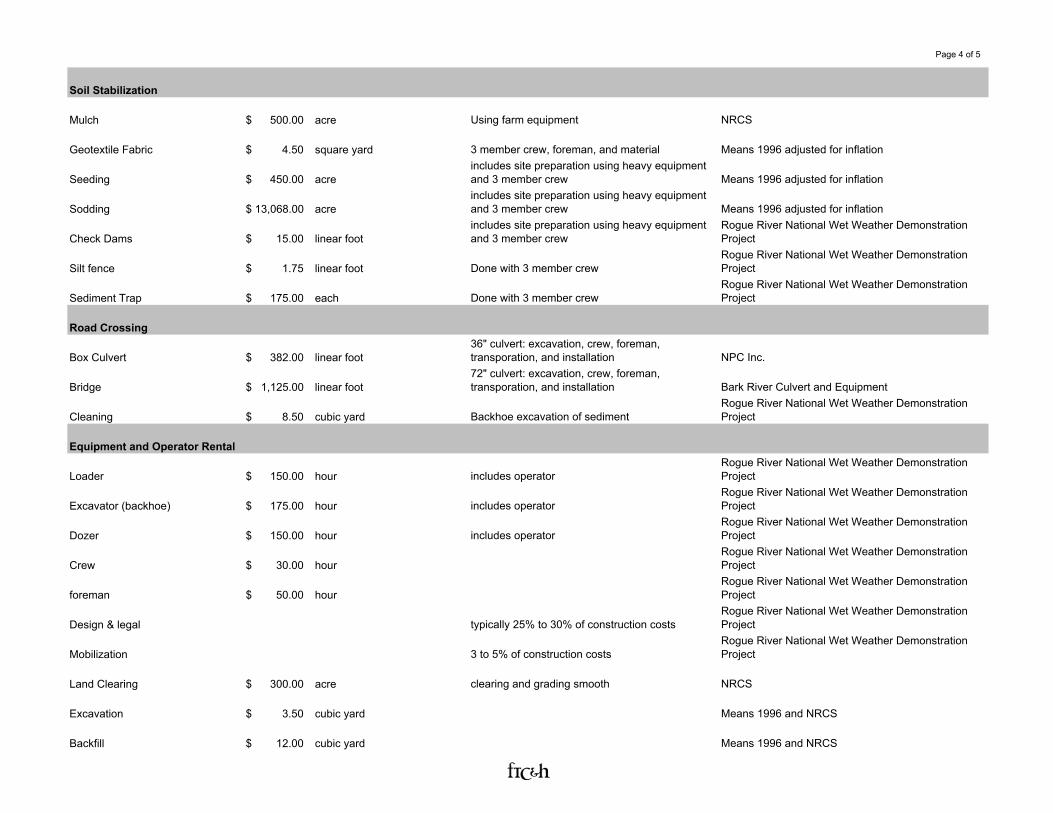
APPENDIX E AVERAGE RATES FOR COSTS OF INSTALLING STANDARD BMPS
IX
GRAND TRAVERSE BAY WATERSHED PROTECTION PROJECT PARTNERS The Watershed Center Grand Traverse Bay Michigan Department of Environmental Quality Conservation Resource Alliance Land Information Access Association Peninsula Township Northwest Michigan Council of Governments Northwestern Michigan College Business Research Services Grand Traverse Regional Land Conservancy Leelanau Conservancy Grand Traverse Regional Math, Science, and Technology Center Antrim Conservation District Grand Traverse Conservation District Kalkaska Conservation District Leelanau Conservation District Natural Resources Conservation Service Grand Traverse Band of Ottawa and Chippewa Indians Inland Seas Education Association Michigan State University Michigan State University – Michigan Sea Grant Program Michigan Groundwater Stewardship Association Antrim County Grand Traverse County Kalkaska County Leelanau County Garfield Township Acme Township City of Traverse City Silver Lake Association Elk River Chain of Lakes Steering Committee
1
CHAPTER 1 EXECUTIVE SUMMARY
Introduction The Grand Traverse Bay watershed is one of the premier tourist and outdoor recreation regions in the State of Michigan. Its natural resource base and beauty contributes significantly to the quality of life enjoyed by year round residents accounting for the area’s continued growth and prosperity. However, with the rewards of economic achievement come the telling signs of environmental degradation. The same resource base that contributed to this region’s desirability as a place to live and work is now under considerable pressure to support continued development.
Watershed Characteristics The Grand Traverse Bay watershed is located in beautiful northwest Michigan’s lower peninsula and drains approximately 976 square miles of land. The watershed covers major portions of four counties: Antrim, Grand Traverse, Kalkaska, and Leelanau. The largest municipality in the watershed is the City of Traverse City. Other towns and villages in the watershed include Northport, Suttons Bay, Kingsley, Acme, Kalkaska, Mancelona, Bellaire, and Elk Rapids. Grand Traverse Bay comprises 132 miles of Lake Michigan shoreline from its northwest tip at the Leelanau lighthouse to its northeast tip at Norwood. The bay spans 10 miles at its widest point, stretches a lengthy 32 miles to its base in Traverse City, and has its deepest point at 590 feet. The watershed may be broken up into nine distinctive major drainage basins: Elk River Chain of Lakes, Boardman River, Mitchell Creek, Acme Creek, Ptobego Creek, Yuba Creek, East Bay shoreline and tributaries, West Bay shoreline and tributaries, and the Old Mission Peninsula. Section 3.9 gives more detail on each of these subwatersheds. In addition to the six major rivers and creeks entering the bay (Elk, Boardman, Mitchell, Acme, Ptobego, and Yuba), it has been estimated that there are more than 100 additional small streams that enter the bay draining portions of the watershed. Rich in land and water resources, the Grand Traverse Bay watershed is home to more than 110,000 people sharing their living space with black bear, deer, great blue herons, lady slippers and trillium. Population densities in Grand Traverse Bay watershed are the greatest in the Traverse City region, along the Bay’s shoreline, and along the large lakes in the Elk River Chain of Lakes. By far, Traverse City and its surrounding townships are the most highly populated areas of the entire region, with population densities reaching up to 1,730 people per square mile. The Grand Traverse Bay region is currently experiencing tremendous population growth and development pressure, with a predicted 40% increase in population by 2020. Two of the three fastest growing counties in the state, Grand Traverse and Leelanau, are located within watershed boundaries. In addition, the area is one of the most popular tourist destinations in the Midwest, with growing numbers of visitors each year. Land use and land cover in the watershed is predominantly forest (50%) and agriculture (20%). Other land uses include: open shrub/grassland, water, wetlands, and urban. Patches of forests occur regularly throughout the watershed with the bulk occurring in the Pere Marquette State
2
Forest (found in the upper Boardman River watershed) and the headwater areas in the Elk River Chain of Lakes watershed. Agricultural lands in the watershed consist mostly of row crops and orchards and vineyards. Apple and cherry orchards and wine producing vineyards dominate agricultural land uses surrounding the bay while row crops (i.e., potatoes, hay, corn, small grains, etc.) are mainly found in outlying watershed areas of Antrim, Kalkaska, and Grand Traverse Counties.
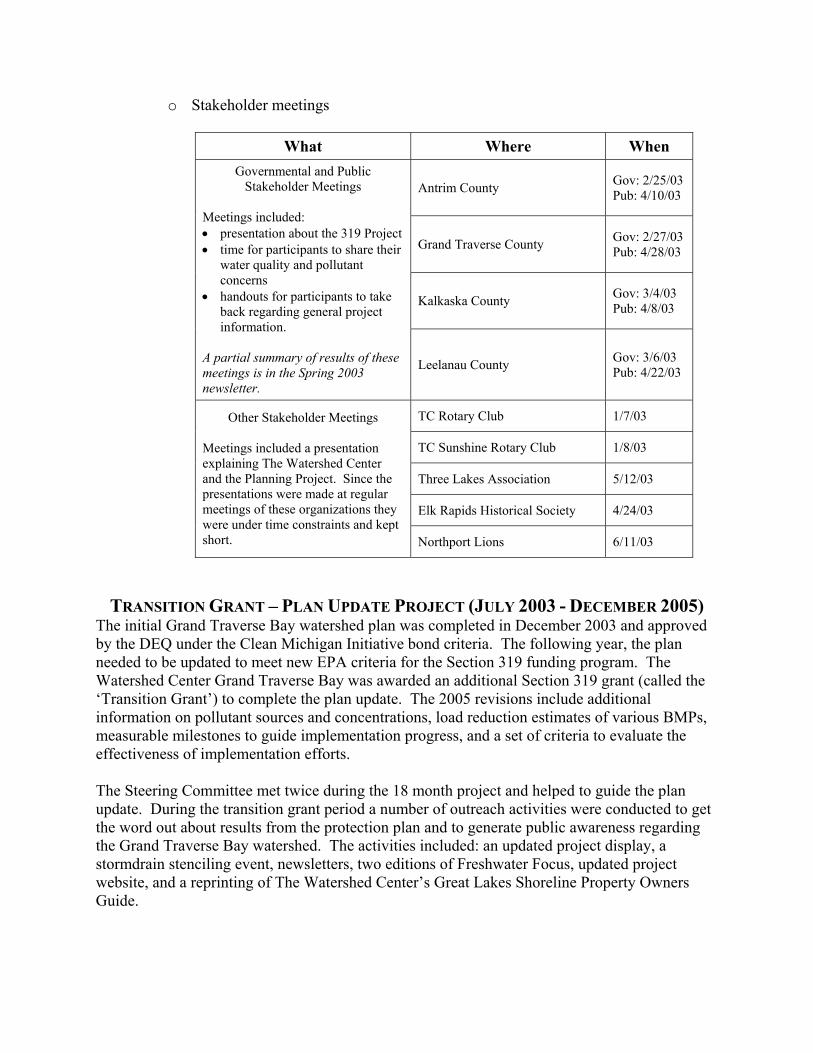
The Protection Planning Process In September 2001, The Watershed Center Grand Traverse Bay received a watershed management planning grant for the Grand Traverse Bay watershed from the U.S. Environmental Protection Agency and the Michigan Department of Environmental Quality. The grant and awarded funds were authorized by Section 319 of the federal Clean Water Act and were used to develop this protection plan for the Grand Traverse Bay watershed. The Grand Traverse Bay Watershed Protection Plan provides a description of the watershed (including such topics as bodies of water, population, land use, municipalities, and recreational activities), summarizes each of the nine subwatersheds to Grand Traverse Bay, and outlines current water quality conditions in the bay. Within the initial two-year development phase of the protection plan, water quality threats were identified and efforts to address these issues were researched, developed, and prioritized. The plan was completed in December 2003 and approved by the DEQ under the Clean Michigan Initiative bond criteria. The plan was then updated in 2005 to meet new EPA criteria for the Section 319 funding program. The 2005 revisions include additional information on pollutant sources and concentrations, load reduction estimates of various BMPs, measurable milestones to guide implementation progress, and a set of criteria to evaluate the effectiveness of implementation efforts.
Designated Uses and Their Pollutants, Sources, and Causes Michigan water quality standards and identified designated uses for Michigan surface waters were used to assess the condition of the watershed. Each of Michigan’s surface waters is protected by Water Quality Standards for specific designated uses (R323.1100 of Part 4, Part 31 of the Natural Resources and Environmental Protection Act, 1994 PA 451, as amended). These standards and designated uses are designed to 1) protect the public’s health and welfare, 2) to enhance and maintain the quality of water, and 3) to protect the state’s natural resources. Protected designated uses as defined by Michigan’s Department of Environmental Quality include: agricultural, industrial water supply, public water supply (at point of intake), navigation, warm water and/or cold water fishery, other indigenous aquatic life and wildlife support, and partial and total body contact recreation. None of the designated uses for the Grand Traverse Bay watershed are impaired on a watershed wide scale. However, in some cases, activities and resulting pollutants in the watershed may prove to be a threat to water quality and designated uses. Threatened waterbodies are defined as those that currently meet water quality standards, but may not in the future. The Grand Traverse Bay Watershed Protection Plan will focus on five designated uses to protect in order to maintain water quality throughout the Grand Traverse Bay and its watershed. The designated uses include
3
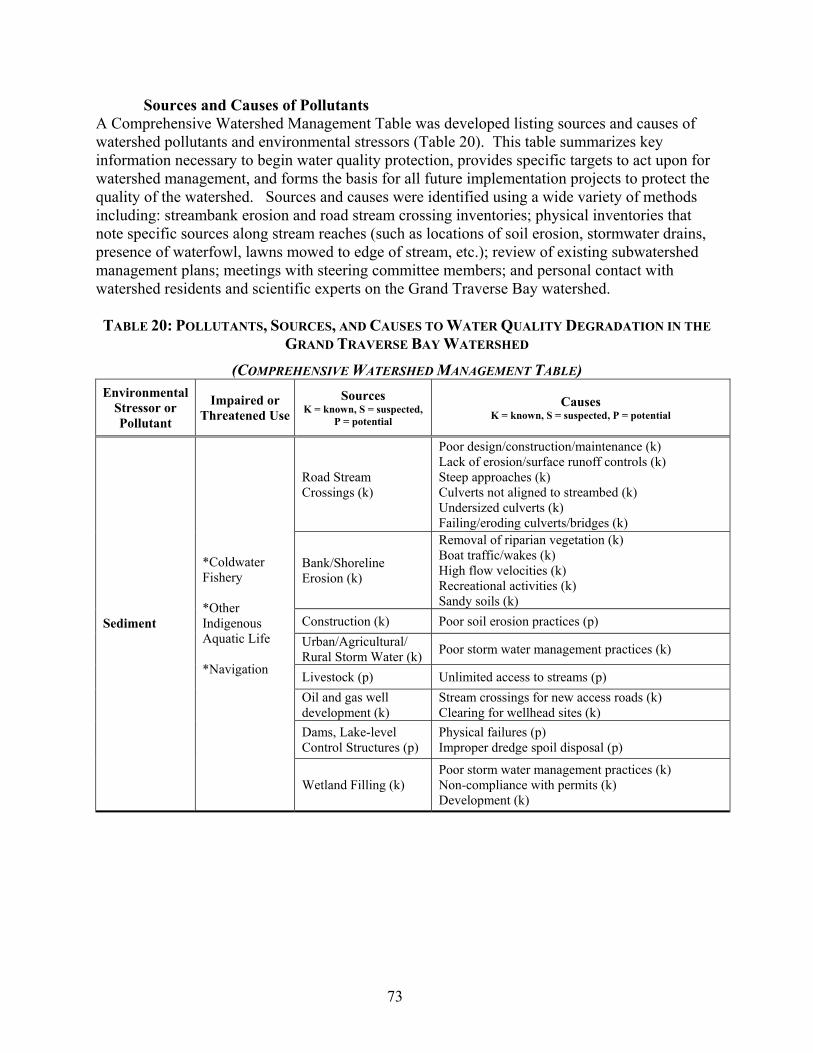
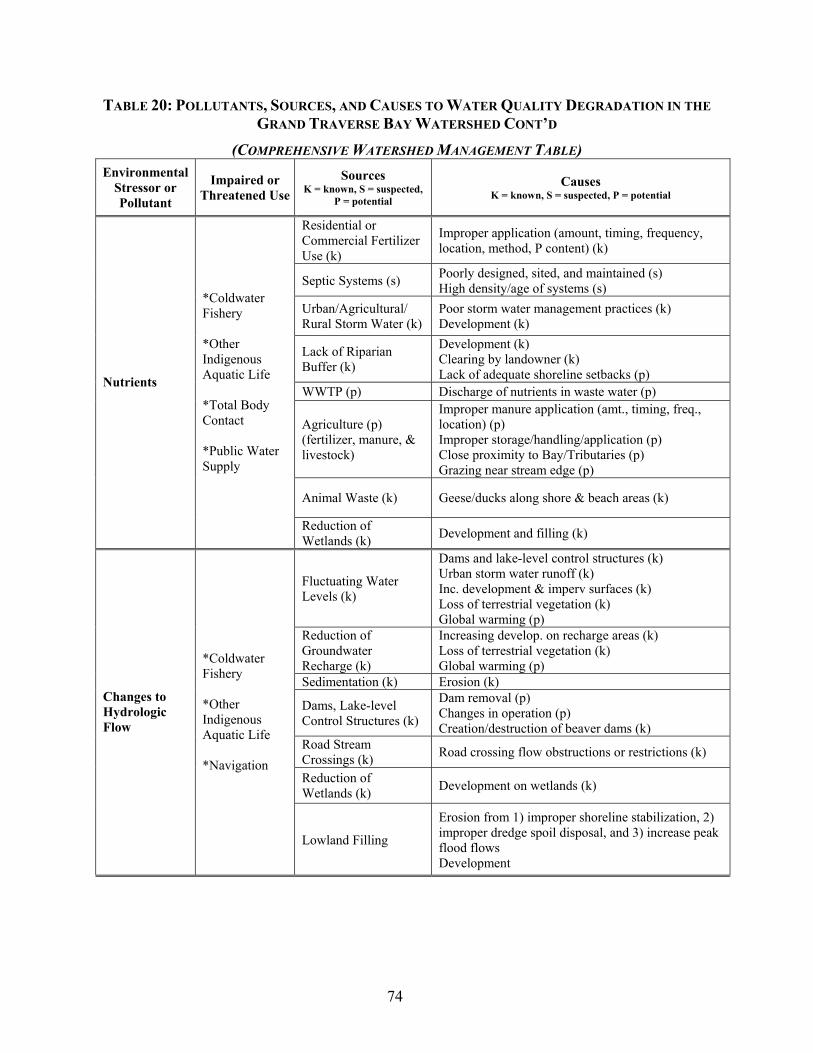
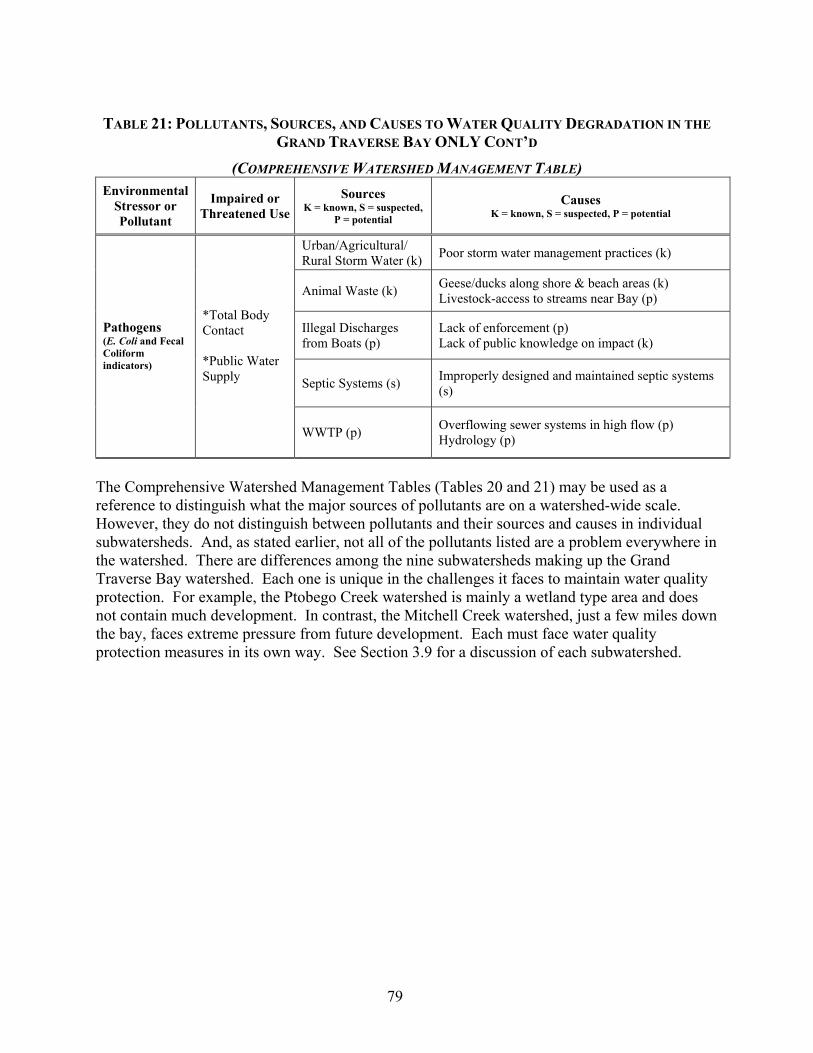
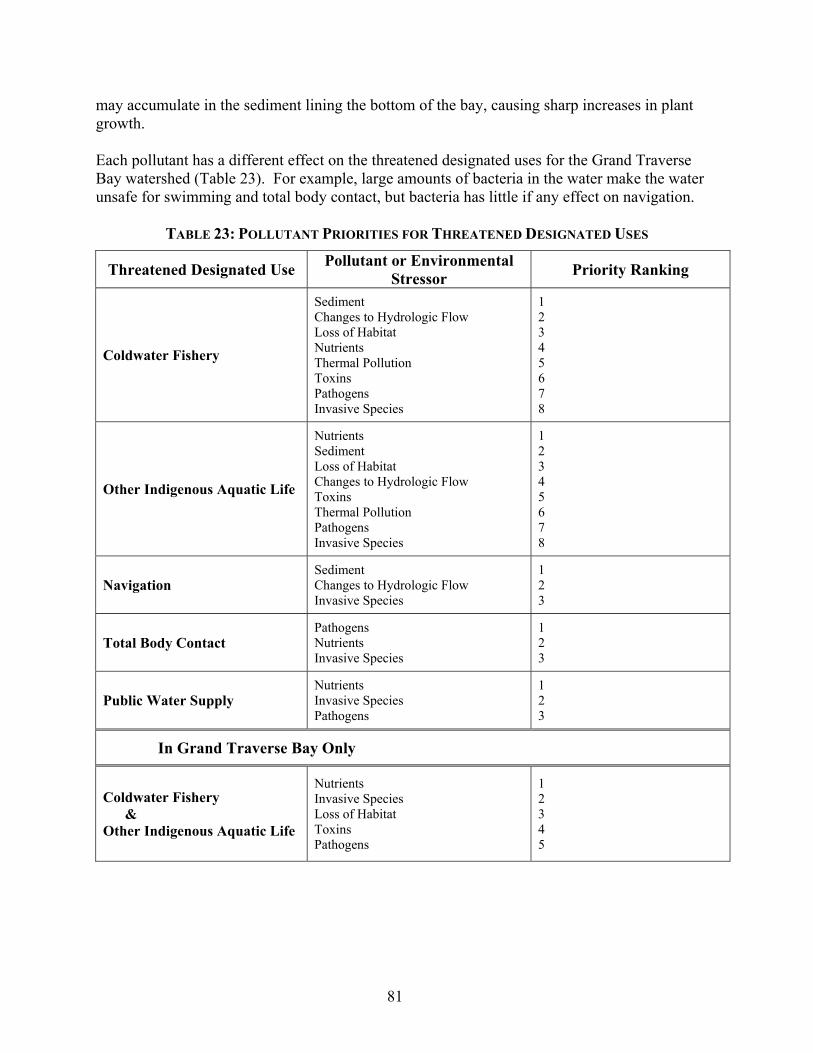
the cold water fishery, other indigenous aquatic life, total body contact, navigation, and public water supply at point of intake. Threatened designated uses were ascertained through scientific research reports, existing subwatershed management plans, DEQ water quality reports, field observations by the Project Coordinator, steering committee members, and personal contact with watershed residents and scientific experts on the Grand Traverse Bay watershed. For each designated use to protect in the Grand Traverse Bay watershed there are a number of different pollutants and environmental stressors that adversely affect each of the designated uses, or have the potential to. The term environmental stressor is used to describe those factors that may have a negative effect on the ecosystem, but aren’t necessarily categorized as contaminants that change water chemistry. Examples of environmental stressors include changes to hydrologic flow, low dissolved oxygen levels, and loss of habitat. Sediment and excessive nutrient loading are two of the known factors that are threatening the cold water fishery, aquatic life, and other designated uses in the Grand Traverse Bay watershed. Other pollutants that threaten the watershed’s designated uses include thermal pollution, toxins, hydrologic flow, invasive species, pathogens, and loss of habitat. All of these nonpoint source pollutants degrade water quality, destroy aquatic habitat, and reduce the number and diversity of aquatic organisms. A Comprehensive Watershed Management Table was developed listing sources and causes of watershed pollutants and environmental stressors. This table summarizes key information necessary to begin water quality protection, provides specific targets to act upon for watershed management, and forms the basis for all future implementation projects to protect the quality of the watershed. It may be used as a reference to distinguish what the major sources of pollutants are on a watershed-wide scale. However, it does not distinguish between pollutants and their sources and causes in individual subwatersheds. Not all of the pollutants listed in the table are a problem everywhere in the watershed. There are differences between the nine subwatersheds making up the Grand Traverse Bay watershed. Each one is unique in the challenges it faces to maintain water quality protection. An additional Comprehensive Watershed Management Table was developed specifically for the Grand Traverse Bay only. This is because the bay and its watershed are connected, but inherently different. What happens at the extreme outer edges of the watershed will eventually affect the Grand Traverse Bay. However, while the watershed itself encompasses rivers, streams, lakes, and 973 square miles of land, the bay is a large open body of water that is connected to Lake Michigan. Certain pollutants have more of an impact on streams and lakes than on larger bodies of water like the Grand Traverse Bay (i.e., thermal pollution and sediment), but other pollutants are more of a concern for the Grand Traverse Bay and its associated designated uses.
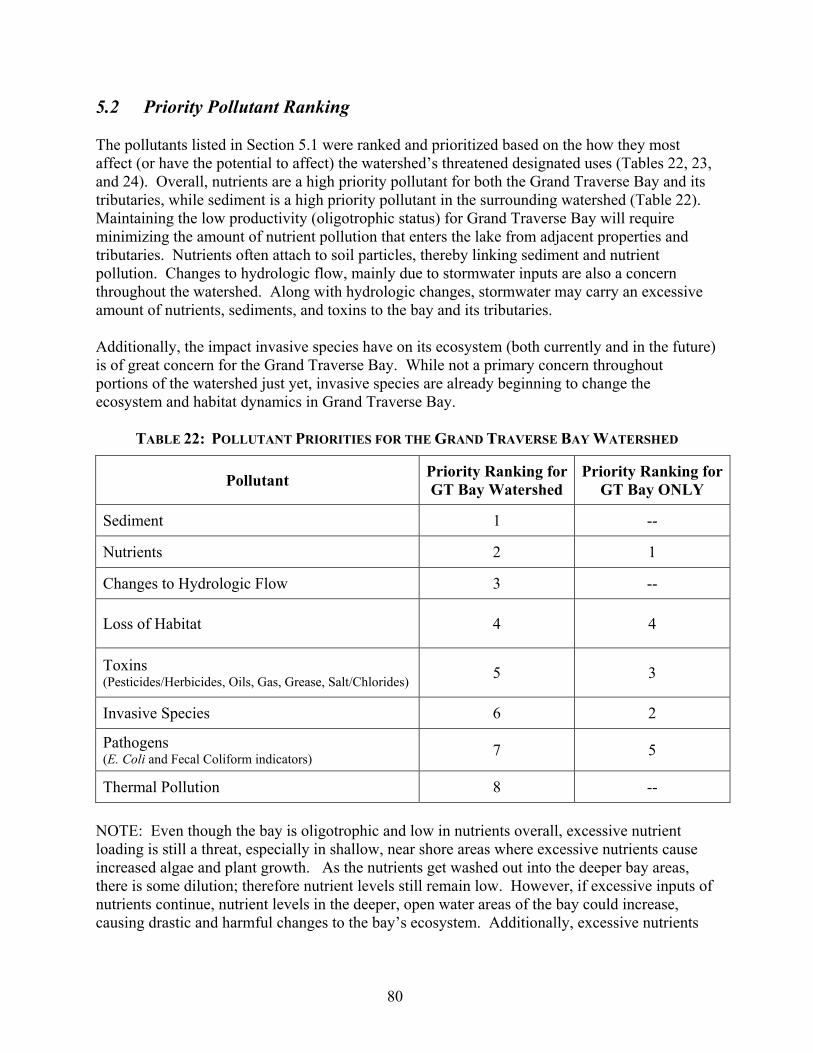
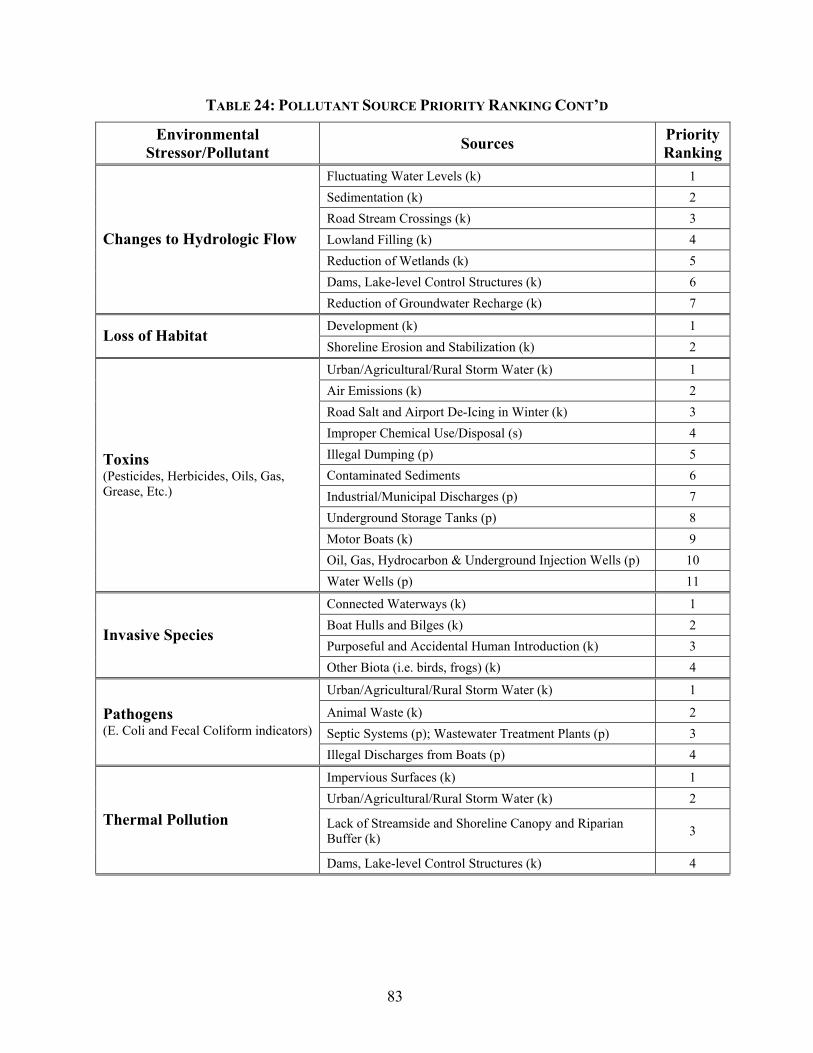
Prioritization of Pollutants Identified watershed pollutants and sources were ranked and prioritized based on the how they most affect (or have the potential to affect) the watershed’s threatened designated uses. Overall,
4
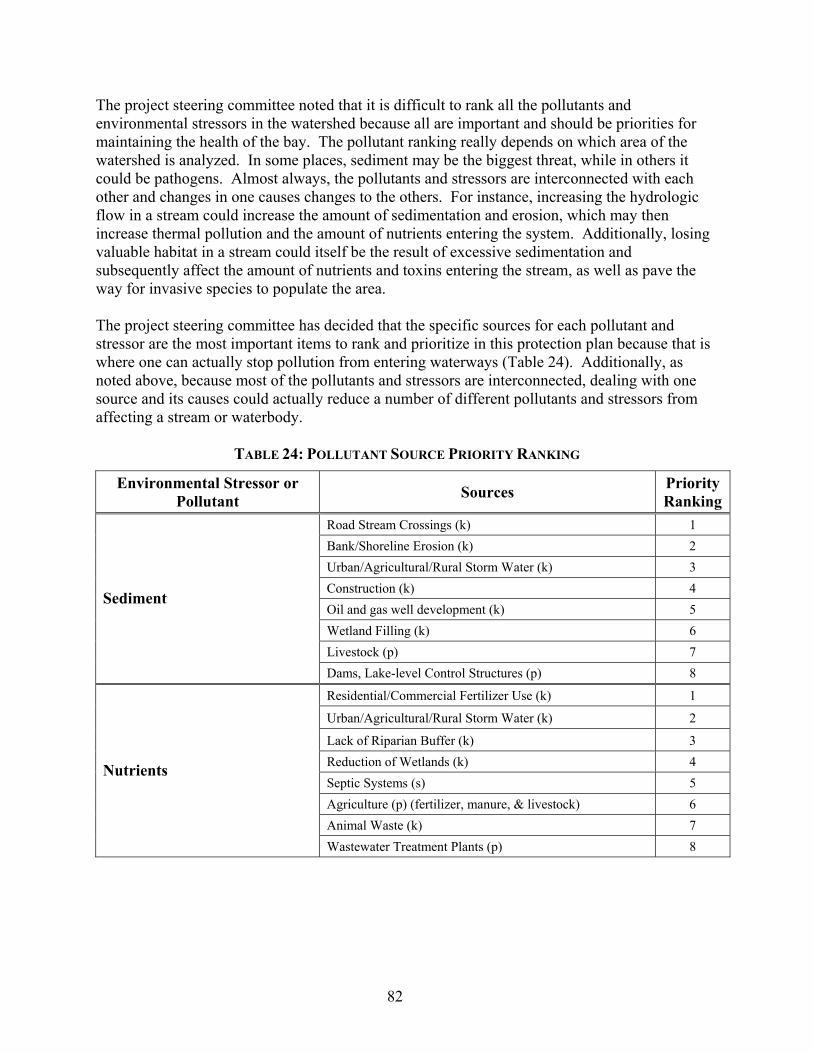
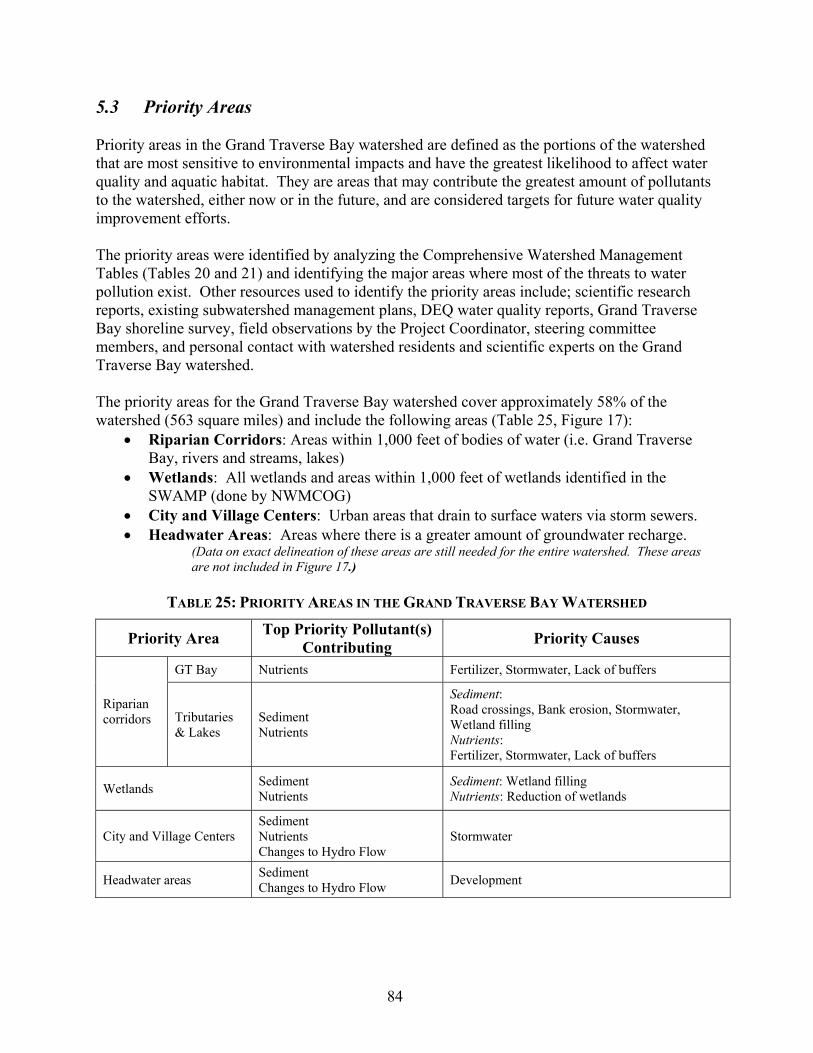
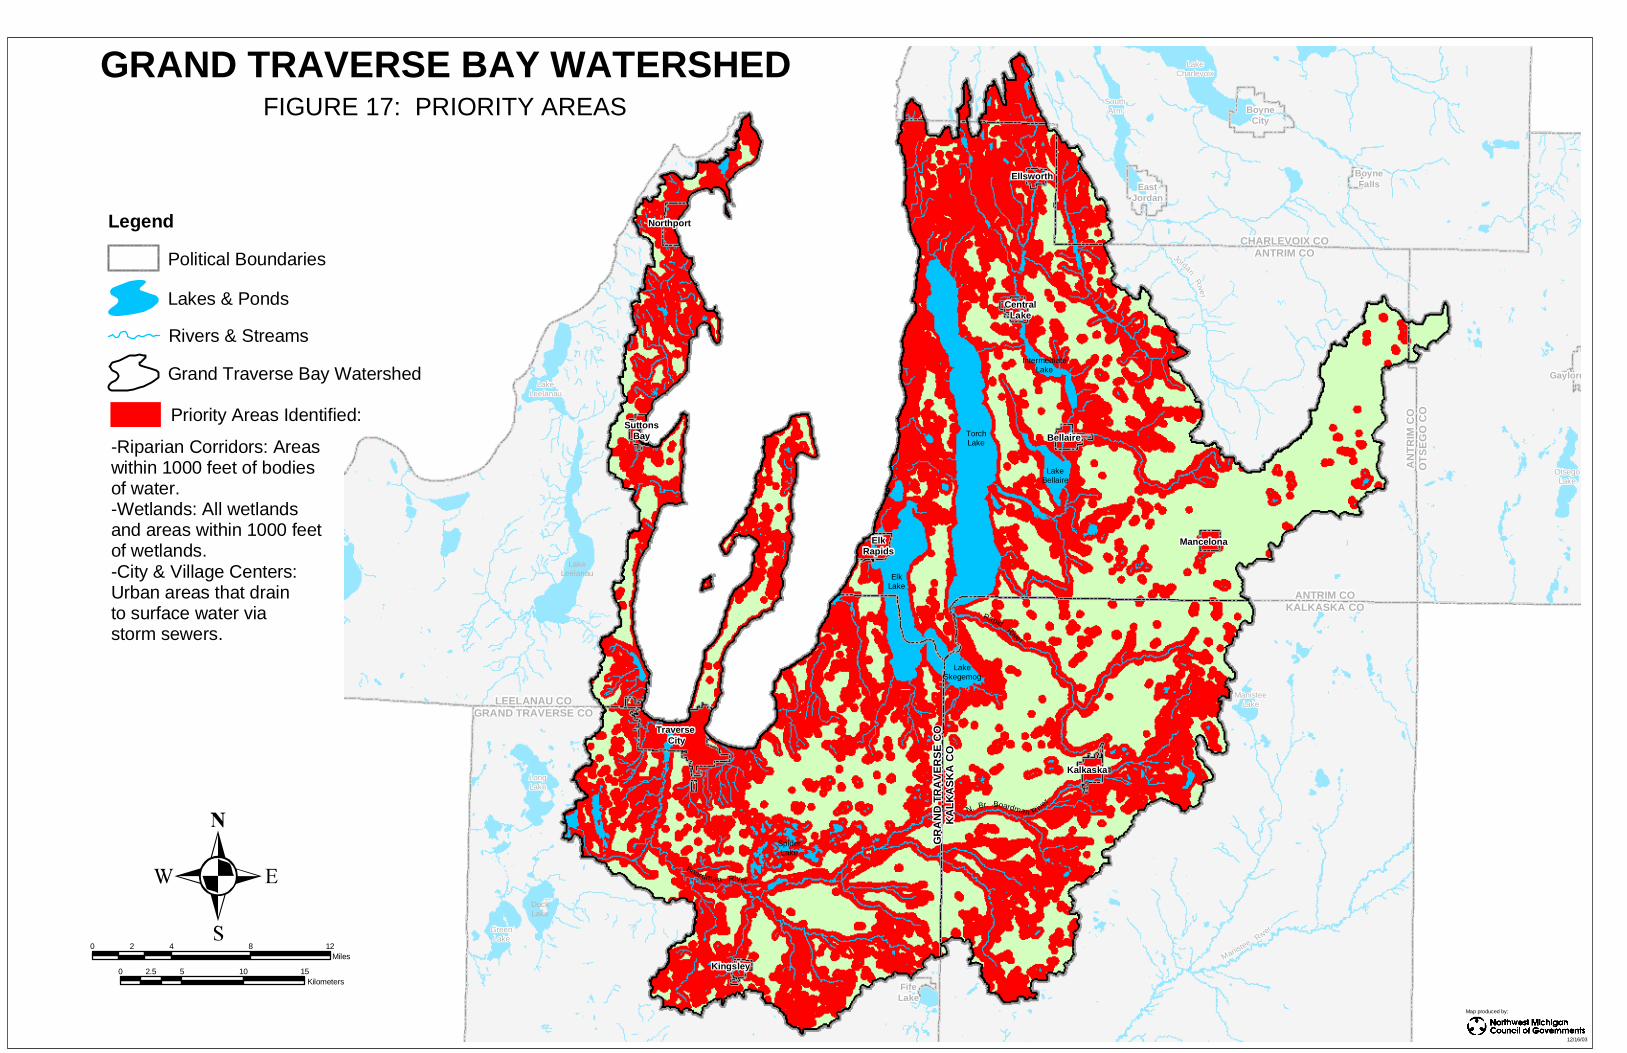
nutrients are a high priority pollutant for both the Grand Traverse Bay and its tributaries, while sediment is a high priority pollutant in the surrounding watershed. Maintaining the low productivity and oligotrophic status for Grand Traverse Bay will require minimizing the amount of nutrients that enter the lake from adjacent properties and tributaries. Nutrients often attach to soil particles, thereby linking sediment and nutrient pollution. Changes to hydrologic flow, mainly due to stormwater inputs are also a concern throughout the watershed. Along with hydrologic changes, stormwater may carry excessive amount of nutrients, sediments, and toxins to the bay and its tributaries. Additionally, the impact invasive species have on the ecosystem (both currently and in the future) is of great concern for the Grand Traverse Bay. While not a primary concern throughout portions of the watershed just yet, invasive species are already beginning to change the ecosystem and habitat dynamics in Grand Traverse Bay. The project steering committee noted that it is difficult to rank all the pollutants and their sources in the watershed because all are important and should be priorities for maintaining the health of the bay. The ranking really depends on which area of the watershed is analyzed. In some places, sediment may be the biggest threat, while in others it could be pathogens. Almost always, the pollutants and stressors are interconnected with each other and changes in one causes changes to the others. Additionally, because most of the pollutants and stressors are interconnected, dealing with one source and its causes could actually reduce a number of different pollutants and stressors from affecting a stream or waterbody. Priority Areas Priority areas in the Grand Traverse Bay watershed were identified by analyzing the Comprehensive Watershed Management Tables and identifying the major areas where most of the threats to water pollution exist. Priority areas are defined as the portions of the watershed that are most sensitive to environmental impacts and have the greatest likelihood to affect water quality and aquatic habitat. They are areas that may contribute the greatest amount of pollutants to the watershed, either now or in the future, and are considered targets for future water quality improvement efforts. Priority areas for the Grand Traverse Bay watershed include the following areas:
• Riparian Corridors: Areas within 1,000 feet of bodies of water. • Wetlands: All wetlands and areas within 1,000 feet of wetlands. • City and Village Centers: Urban areas that drain to surface waters via storm sewers. • Headwater Areas: Areas where there is a greater amount of groundwater recharge.
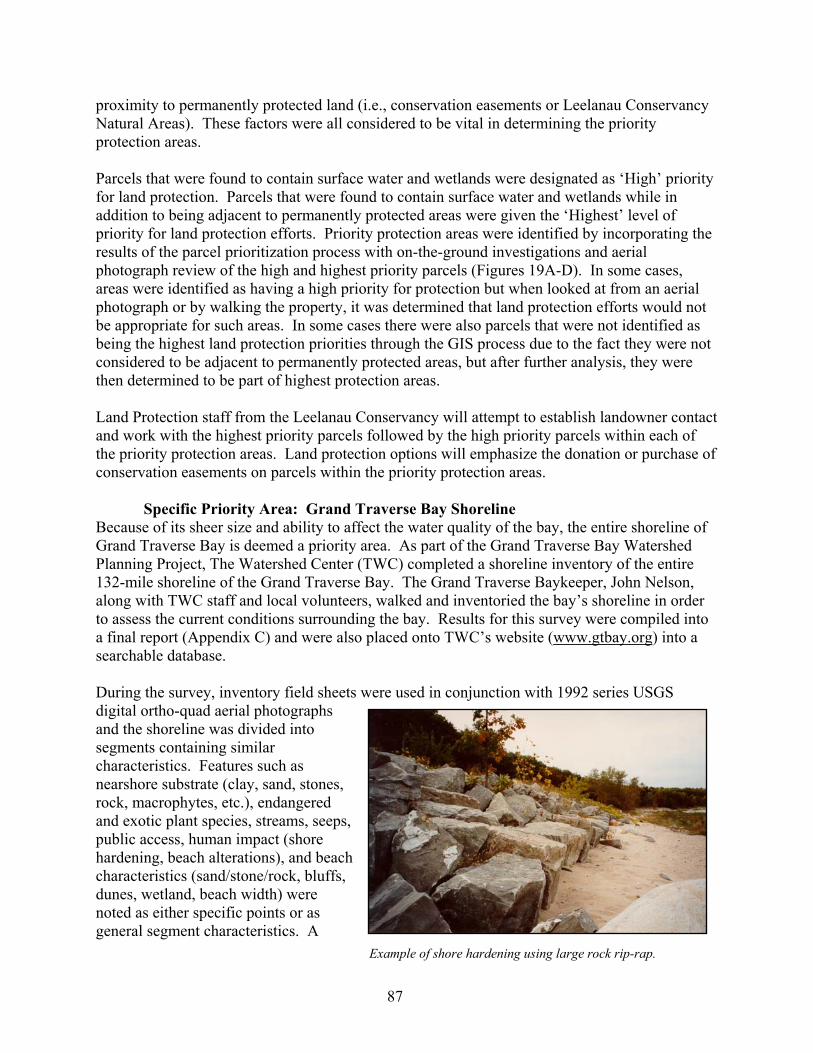
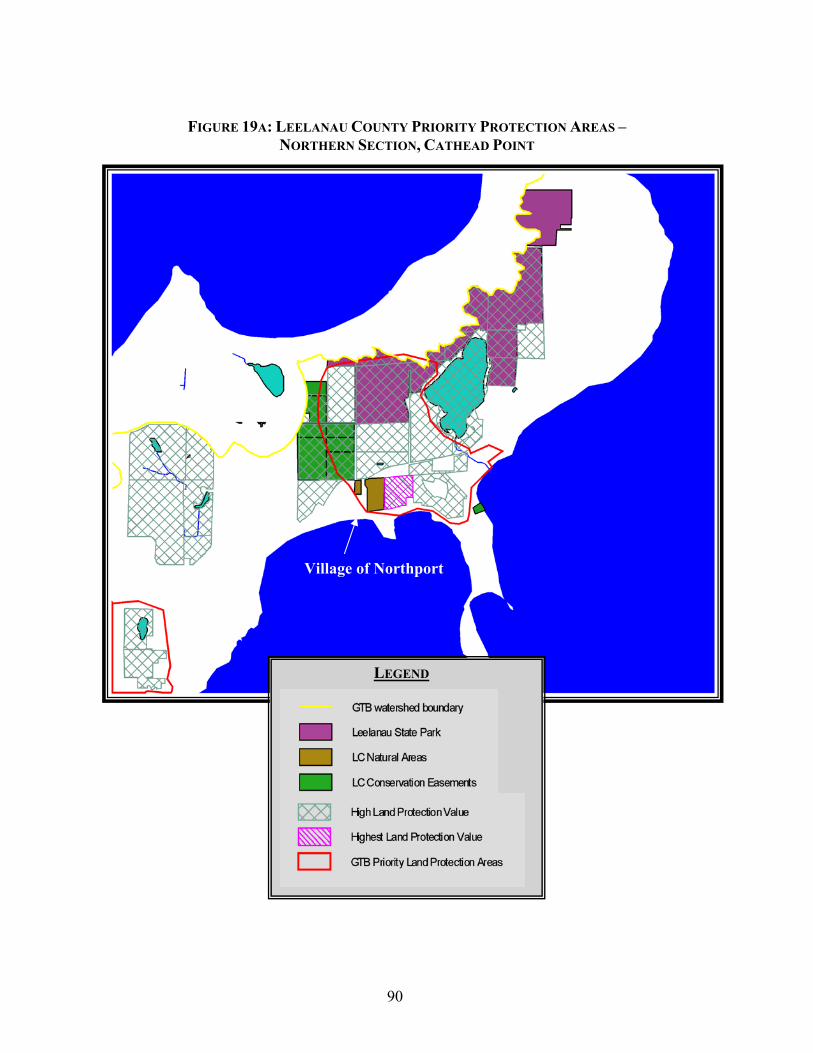
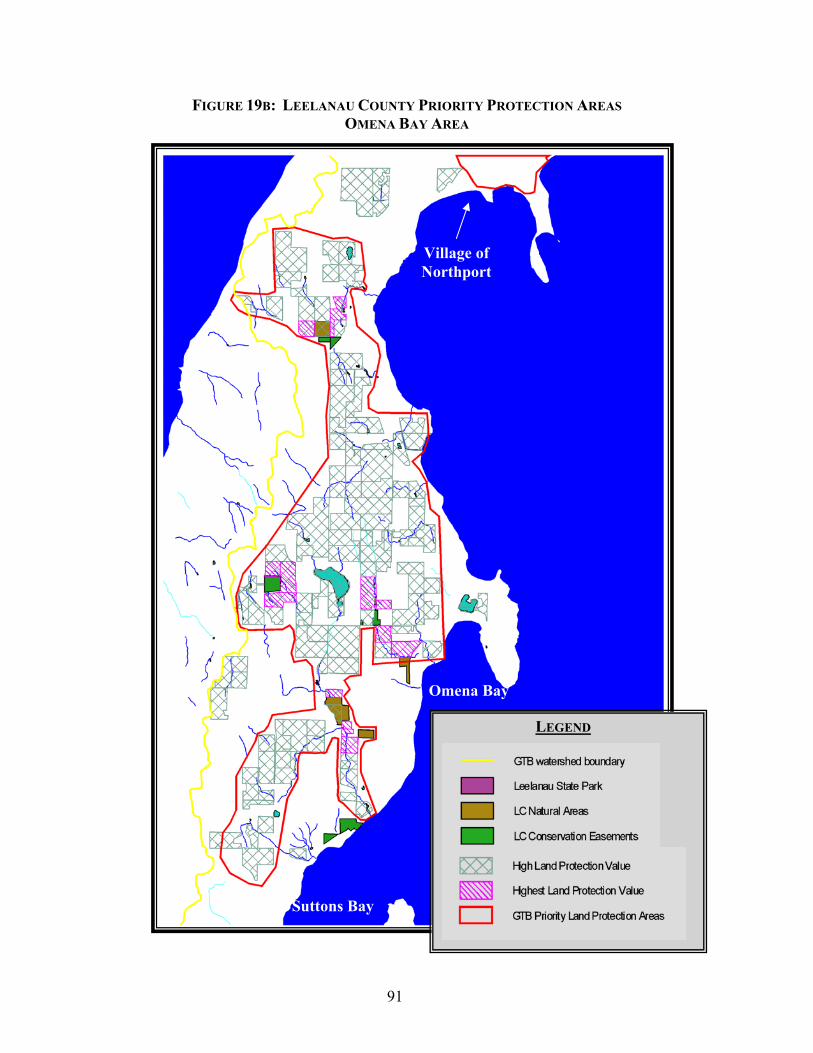
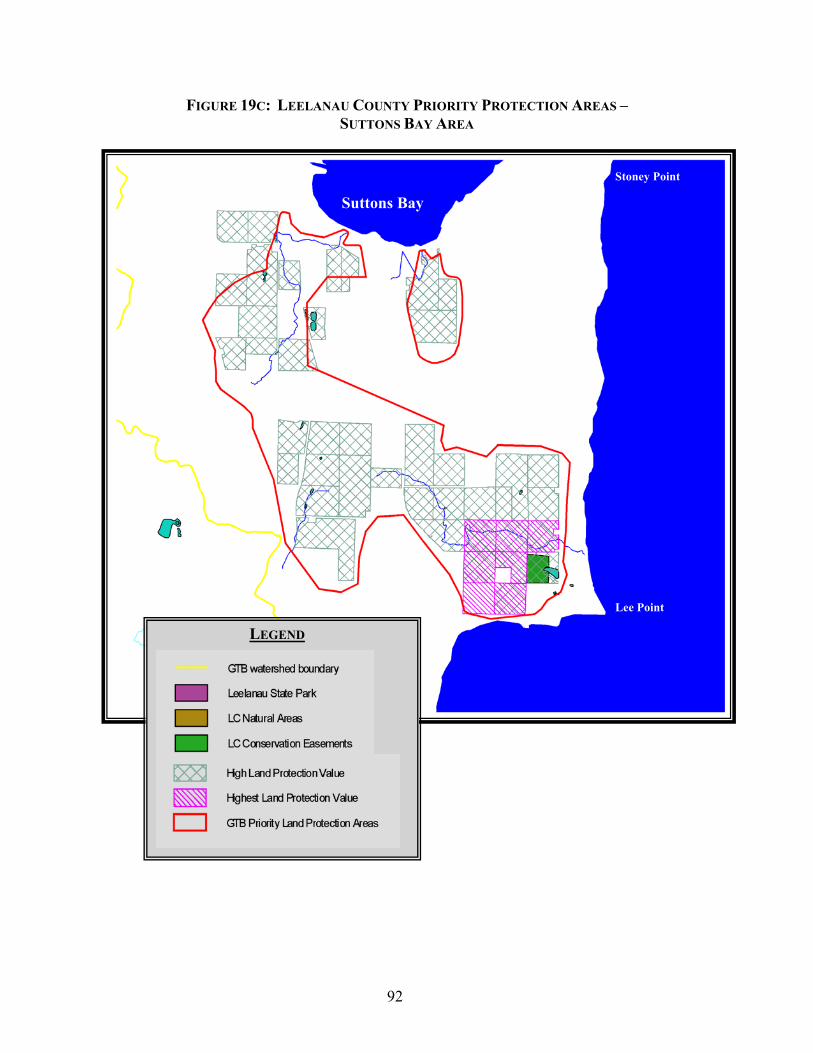
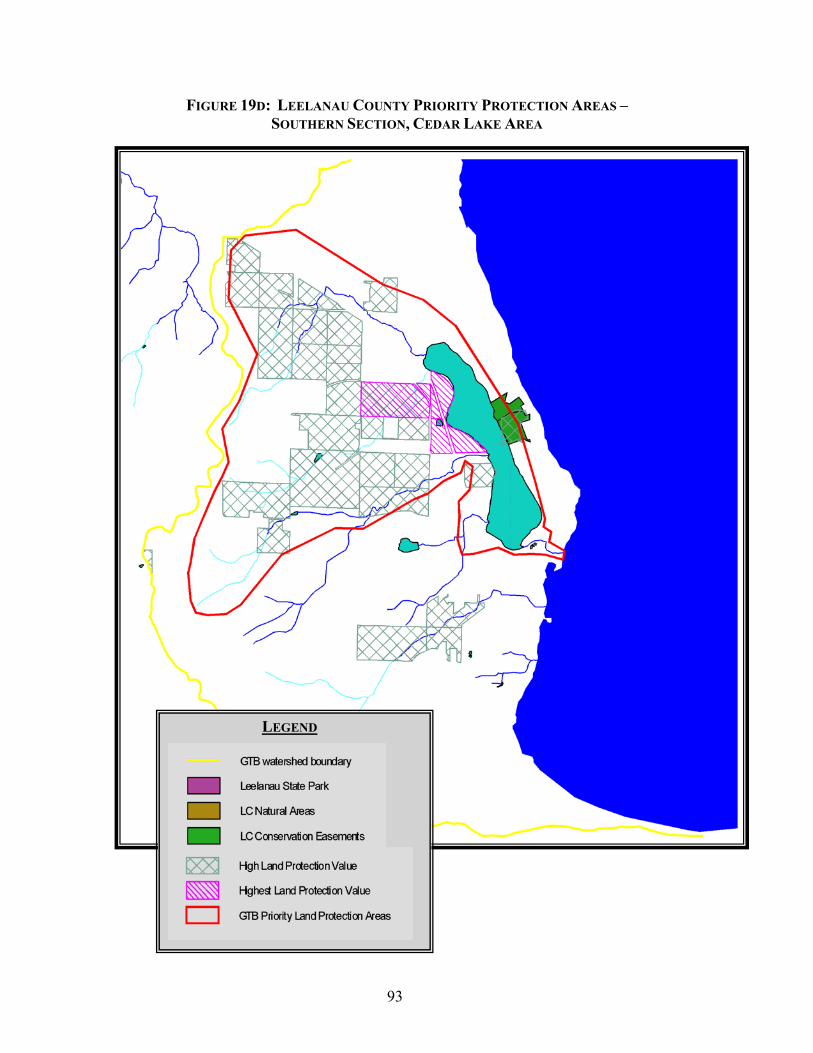
In addition to the above priority areas, specific priority areas were identified along the Grand Traverse Bay shoreline, throughout the Boardman River watershed, and in Leelanau County. Local land conservancies identified private parcels of land in the Boardman River watershed and Leelanau County for their potential contribution to improving the quality of Grand Traverse Bay and its watershed. Because of its sheer size and ability to affect the water quality of the bay, the entire shoreline of Grand Traverse Bay is deemed a priority area. As part of the Grand Traverse Bay watershed Planning Project, The Watershed Center (TWC) completed a shoreline inventory of the entire 132-mile shoreline of the Grand Traverse Bay. The Grand Traverse Baykeeper, John Nelson, along with TWC staff and local volunteers, walked and inventoried the bay’s shoreline in order
5
to assess the current conditions surrounding the bay. Results for this survey were compiled into a final report and were placed onto TWC’s website (www.gtbay.org) into a searchable database.
Watershed Goals, Objectives, and Recommendations
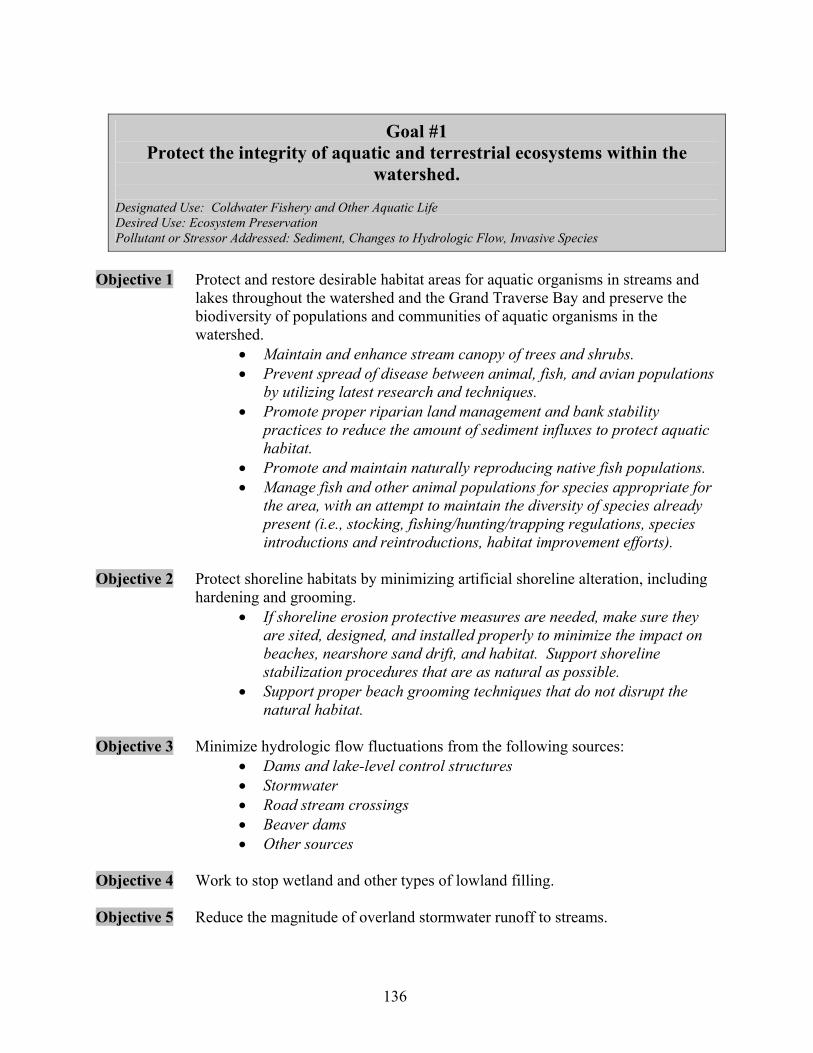
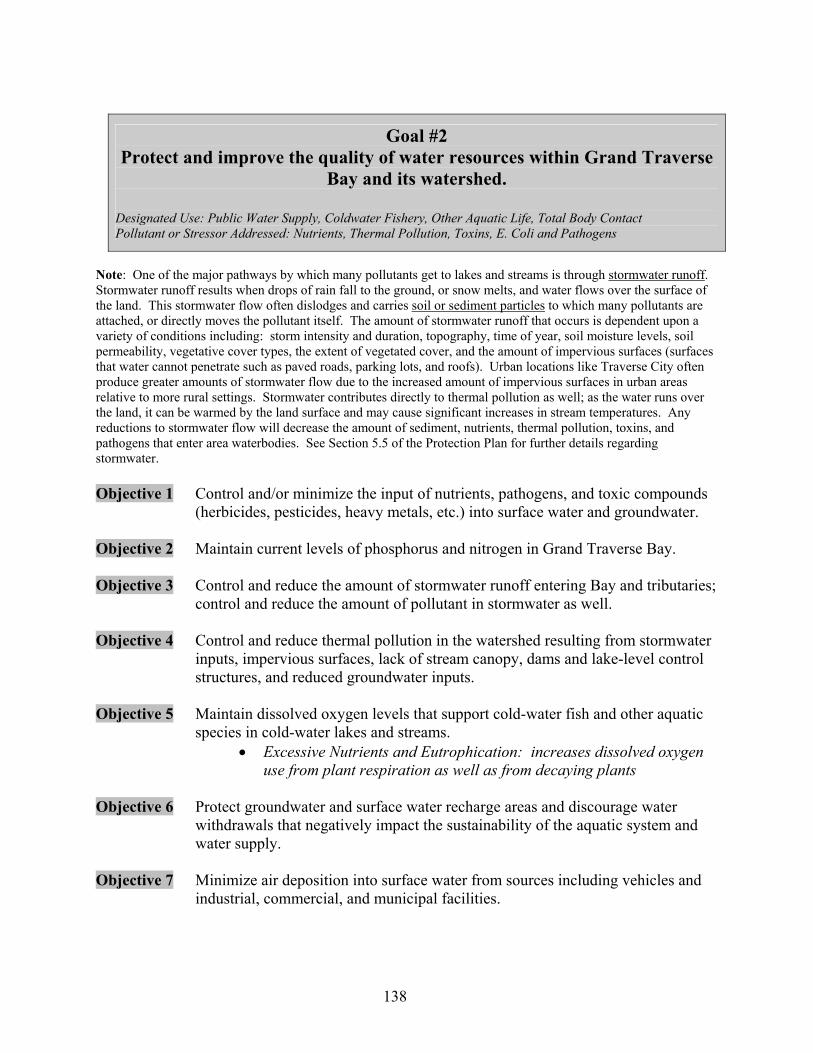
The overall mission for the Grand Traverse Bay Watershed Protection Plan is to provide guidance for the implementation of actions that will reduce the negative impact that pollutants and environmental stressors have on the designated watershed uses. The envisioned endpoint is to have Grand Traverse Bay and all lakes and streams within its watershed support appropriate designated and desired uses while maintaining their distinctive environmental characteristics and aquatic biological communities. Using suggestions obtained from stakeholder meetings conducted throughout the watershed and examples from other watershed management plans, the project steering committee developed six broad goals for the Grand Traverse Bay watershed. By working to attain these goals and their corresponding objectives, threatened watershed designated uses will be maintained or improved. The watershed goals are as follows:
• Protect the integrity of aquatic and terrestrial ecosystems within the watershed. • Protect and improve the quality of water resources within Grand Traverse Bay and its
watershed. • Establish and promote land and water management practices that conserve and protect the
natural resources of the watershed. • Enhance the amount and quality of recreational opportunities and support a sustainable
local economy. • Establish and promote educational programs that support stewardship and watershed
planning goals, activities, and programs. • Preserve the distinctive character and aesthetic qualities of the watershed.
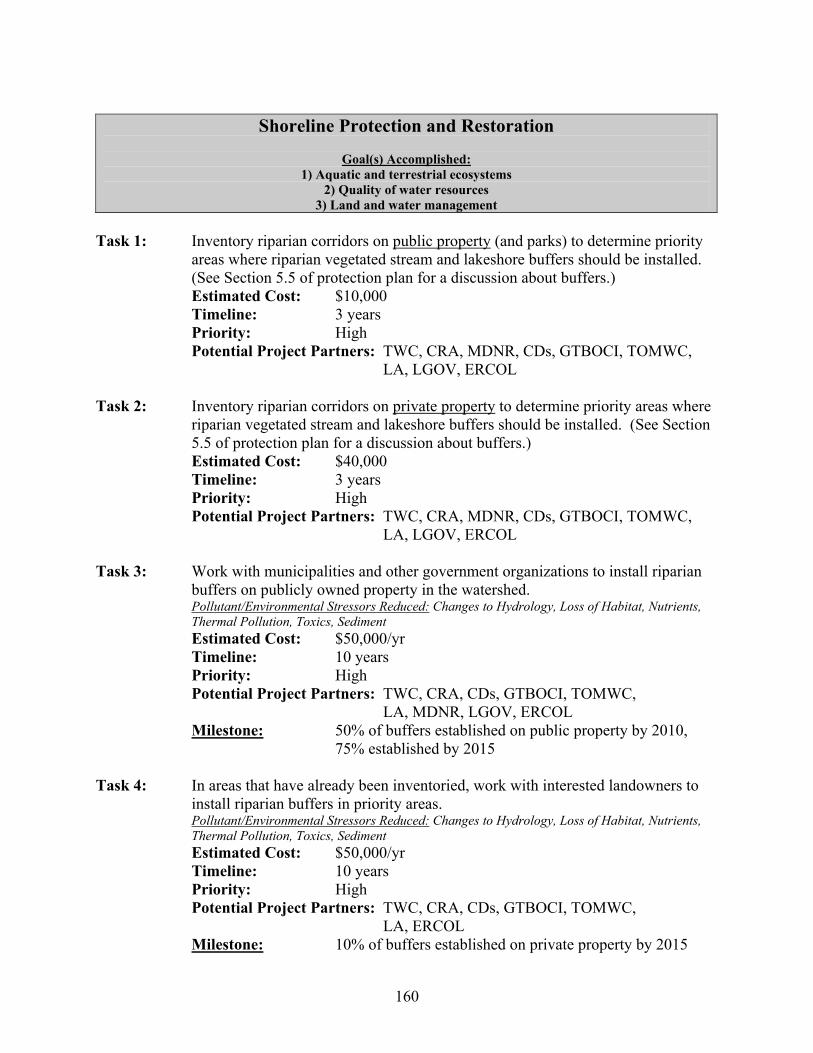
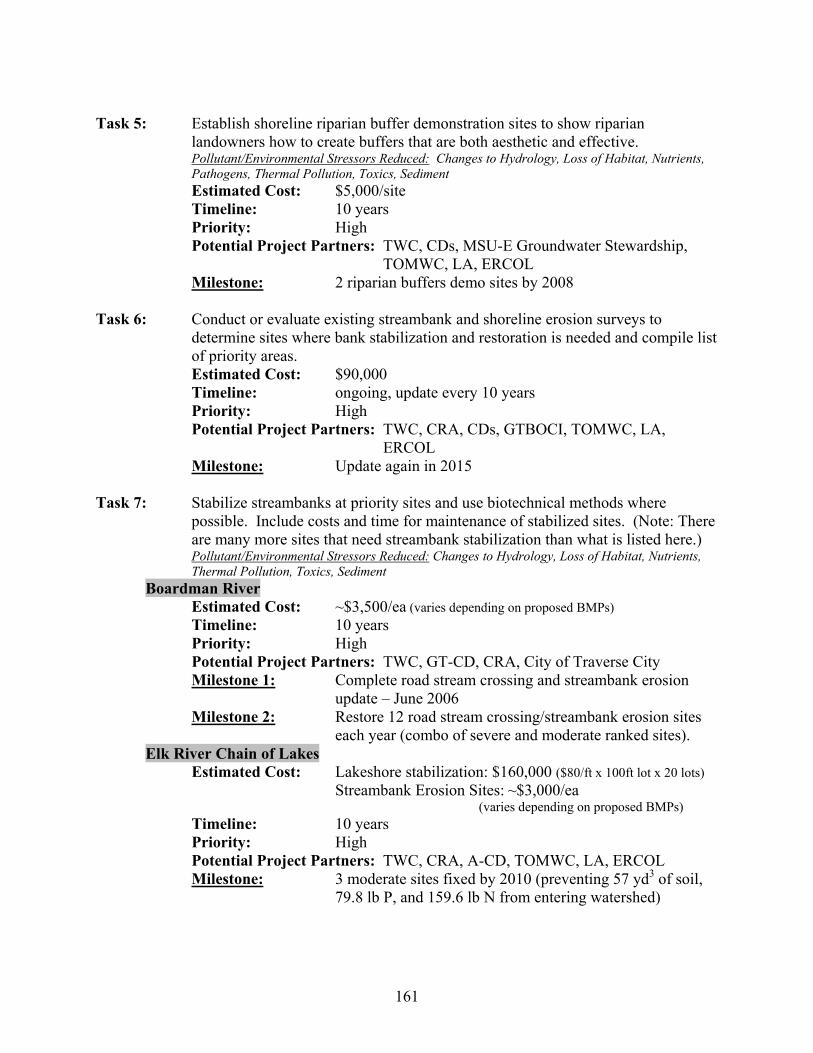
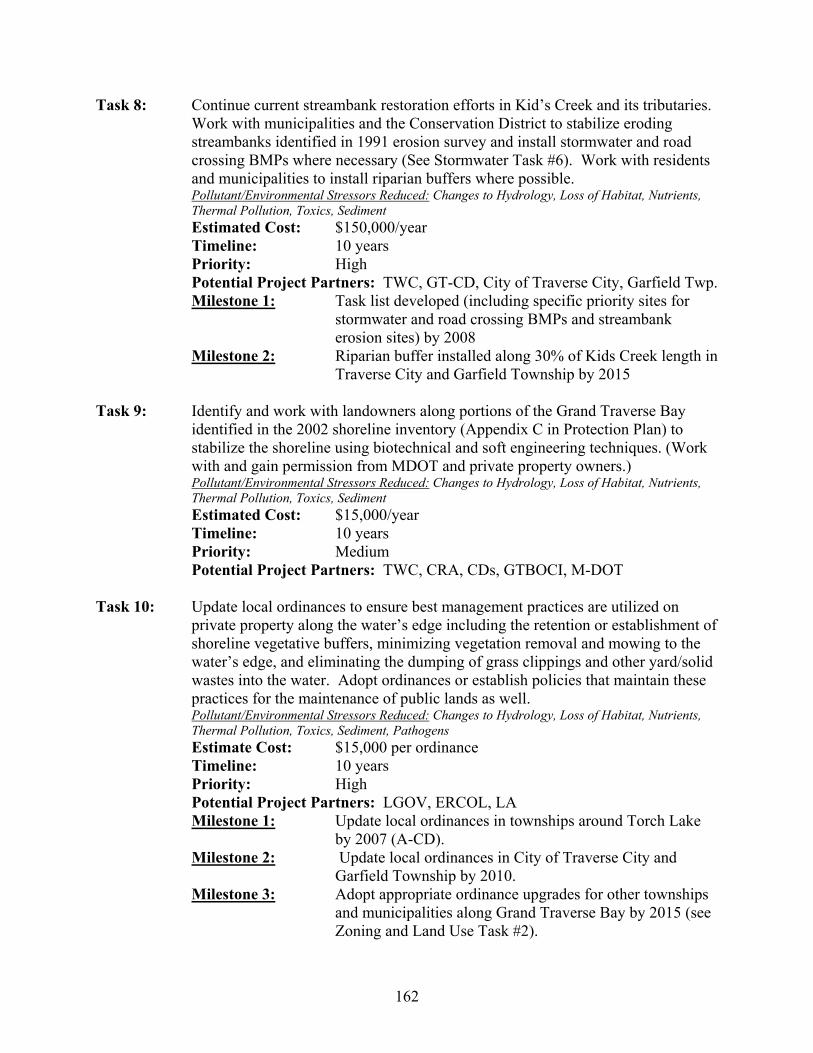
In an effort to successfully accomplish the goals and objectives, specific and tangible recommendations, called implementation tasks, were developed based on the prioritization of watershed pollutants, sources, and causes while also looking at the priority areas in the watershed. The implementation tasks represent an integrative approach, combining watershed goals and covering more than one pollutant at times, to reduce existing sources of priority pollutants and prevent future contributions. Implementation tasks were summarized by the pollutant and/or source it relates to. In this way, organizations may work on a specific issue (i.e., urban stormwater or shoreline restoration) that may contribute more than one type of watershed pollutant and meet more than one watershed goal. The categories are as follows: Shoreline Protection and Restoration; Road Stream Crossings; Agriculture; Hydrology; Habitat, Fish and Wildlife; Stormwater; Wastewater; Human Health; Wetlands; Invasive Species; Land Protection and Management; Development; Zoning and Land Use; Groundwater; Monitoring; and Desired Uses. Additionally an Information and Education Strategy was developed with specific recommendations which highlight the actions needed to successfully maintain and improve watershed education, awareness, and stewardship for the Grand Traverse Bay watershed. It lays
the foundation for the collaborative development of natural resource programs and educational activities for target audiences, community members, and residents. Besides focusing implementation efforts in priority areas, putting special emphasis on reducing and/or eliminating pollution stemming from stormwater runoff, streambank erosion, road stream crossings, fertilizer use, lack of riparian buffers, and the reduction of wetlands, will address the bulk of pollution entering the Grand Traverse Bay and its surrounding watershed. Priority should be given to implementation tasks (both BMPs and educational initiatives) that work to reduce the effects from these sources. Priority Tasks and Future Efforts for Implementation The Watershed Center and other project partners will continue to build partnerships with various groups throughout the watershed for future projects involving the implementation of recommendations made in the protection plan. It is expected that this implementation phase will last 10 years or more. Grant funds and other money sources will be used to 1) continue water quality assessment and monitoring, 2) complete initial implementation tasks and installation of Best Management Practices, and 3) complete initial tasks outlined in the Information and Education Strategy. Priority tasks that should be conducted over the next 1 – 3 years are as follows, with the most important tasks listed first:
• Establishing stormwater BMPs and ordinances • Streambank and shoreline erosion surveys and stabilization projects • Establishing riparian buffers • Complete road crossing inventories and begin improvements using BMPs • Inventory current master plans and zoning ordinances; assist townships with developing
ordinances that protect water quality and natural resources • Stormdrain mapping • Wetland assessment, restoration, and protection • Initiatives to preserve open space and wildlife corridors • Continuing monitoring programs • Developing Conservation Plans for farms
Future efforts for the Grand Traverse Bay Watershed Project include:
• Building partnerships and seeking funding for implementation activities. • Completing initial implementation tasks as well as installing BMPs at selected sites. • Ongoing monitoring to assess environmental conditions. • Implementing information and education initiatives. • Compiling results from ongoing research initiatives.
The plan is intended for use by area watershed groups, lake associations, local governments, volunteer groups, and many others and provides recommendations on how to reduce water quality degradation and protect water quality throughout the Grand Traverse Bay watershed.
7
CHAPTER 2 INTRODUCTION The Grand Traverse Bay area is one of the premier tourist and outdoor recreation regions in the State of Michigan. Its natural resource base and beauty contributes significantly to the quality of life enjoyed by year round residents, which accounts for the area’s continued growth and prosperity. However, with the rewards of economic achievement come the telling signs of environmental degradation. The same resource base that contributed to this region’s desirability as a place to live and work is now under considerable pressure from continued development. The watershed contains major parts of four counties and more than 50 municipalities and townships. In order to maintain the quality of the resource, local governments, concerned citizens, and numerous agencies all need to work together towards a common goal – protecting the Grand Traverse Bay and its watershed from further environmental degradation. How does the quality of water in this area affect us individually, and why should we care? These are questions that environmental agencies have been dealing with for years. How can we get people to care and learn about their water quality and consider how their individual actions may affect it? The answer is simple; our lives are tied to water by many different threads. The primary thread is that humans need clean, drinkable water to live. The drinking water that we rely upon may become contaminated by a number of chemicals and pollutants (like fertilizers, pesticides, and gasoline) that we and others use everyday and don’t think about. Additionally, new and emerging issues involving pharmaceuticals and other medical wastes in water supplies are just beginning to be researched. What about the water and watershed that we recreate in? Healthy ecosystems are why people love to live here. Many people live in the Grand Traverse Bay region because of the numerous forms of recreation it provides. But, if pollution is unchecked and degradation of this natural resources continues, many of the activities enjoyed by residents and visitors alike will be in jeopardy. Contamination of streams, lakes, and the bay from numerous sources may lead to unsafe swimming and blooms of aquatic plants, which are an annoyance to swimmers and boaters. Recreational fishing is also impacted by water pollution; many inland lakes already have fish consumption advisories due to heavy metal contamination. Other forms of recreation that many of us enjoy on a daily basis are at stake as well, including swimming, kayaking, canoeing, and even hiking. A public telephone survey conducted in Summer 2002 reveals that 60% of the people living in the Grand Traverse Bay region don’t know which watershed they live in. Many don’t even
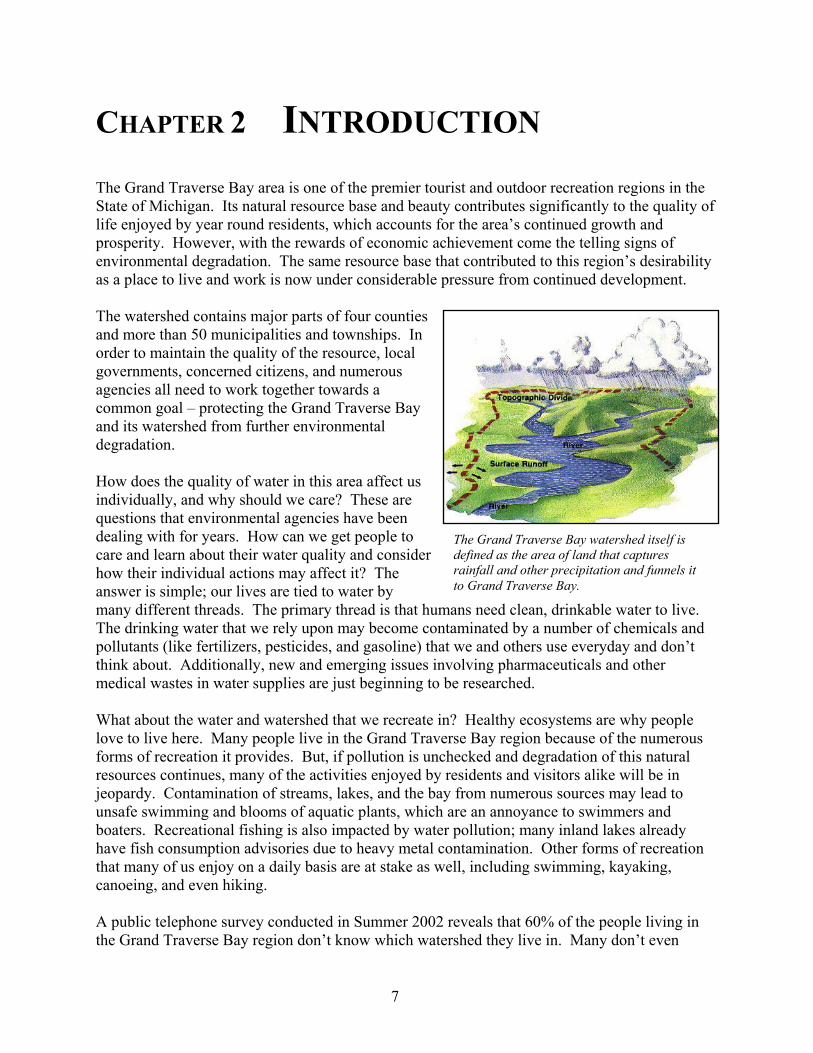
The Grand Traverse Bay watershed itself is defined as the area of land that captures rainfall and other precipitation and funnels it to Grand Traverse Bay.
8
know what a watershed is. However, most people in the area use water for recreation, inherently tying them to this precious resource. It is imperative that residents and visitors become educated about the watershed, know what is impacting the resource, and are educated on what can be done to help make the Grand Traverse Bay watershed a place where they want to live and come back to time and time again. In September 2001, The Watershed Center Grand Traverse Bay received a watershed management planning grant for the Grand Traverse Bay watershed from the U.S. Environmental Protection Agency (EPA) and the Michigan Department of Environmental Quality (MDEQ). The grant and awarded funds were authorized by Section 319 of the federal Clean Water Act and were used to develop this protection plan for the Grand Traverse Bay watershed. A subsequent Section 319 grant was awarded in 2004 to update the plan and include additional information according to newly implemented EPA requirements. The protection plan summarizes existing water quality conditions in and around the bay while also outlining the major watershed pollutants and recommendations on how to reduce the impact and amount of pollution entering the system. The plan provides a description of the watershed including such topics as bodies of water, population, land use, municipalities, and recreational activities; summarizes each of the nine subwatersheds to Grand Traverse Bay; and outlines current water quality conditions in the bay. Additionally, water quality threats were identified and prioritized and efforts to address these issues were researched, developed, and prioritized. This 2005 revised plan includes additional information on pollutant sources and concentrations, load reduction estimates of various BMPs, measurable milestones to guide implementation progress, and a set of criteria to evaluate the effectiveness of implementation efforts. More information on the development process and project evaluation from the initial project to develop the protection plan (December 2001-2003) is contained in Appendix A and B, respectively. The intent of the protection plan is to assist area watershed groups, lake associations, local governments, volunteer groups, and many others in making sound decisions to help improve and protect water quality in their area. It provides recommendations on how to reduce water quality degradation and protect our valuable resource, the Grand Traverse Bay watershed.
9
CHAPTER 3 DESCRIPTION OF THE GRAND TRAVERSE BAY
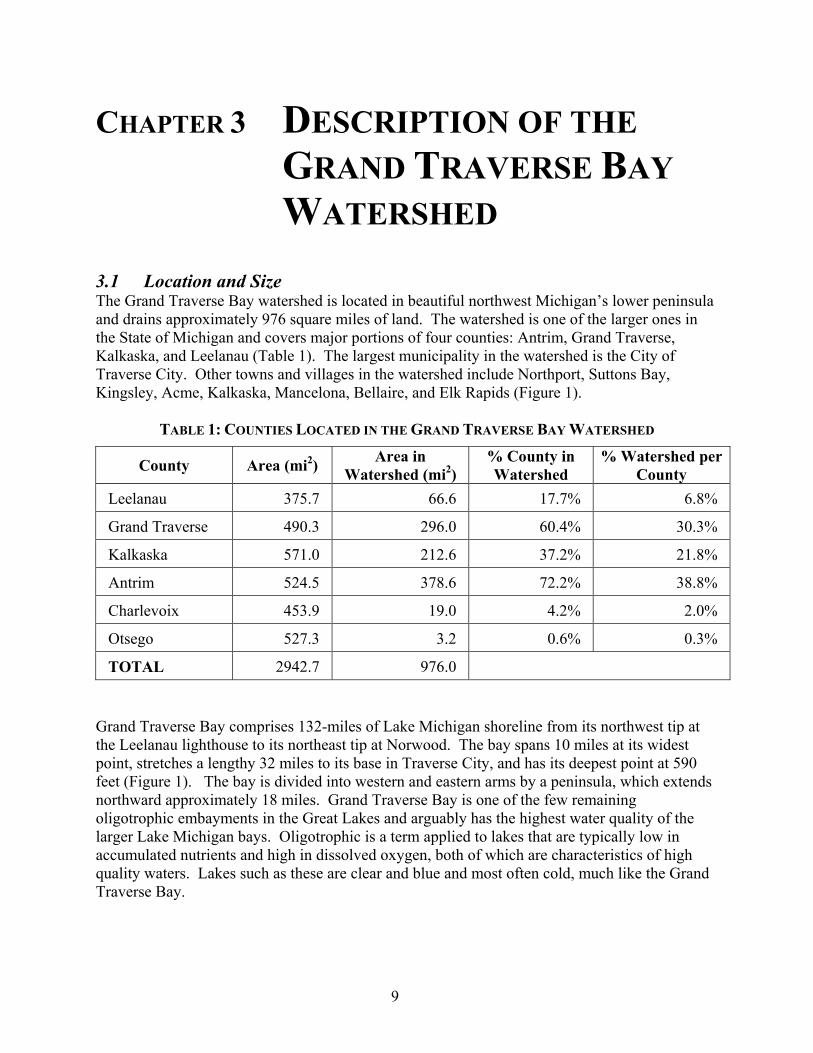
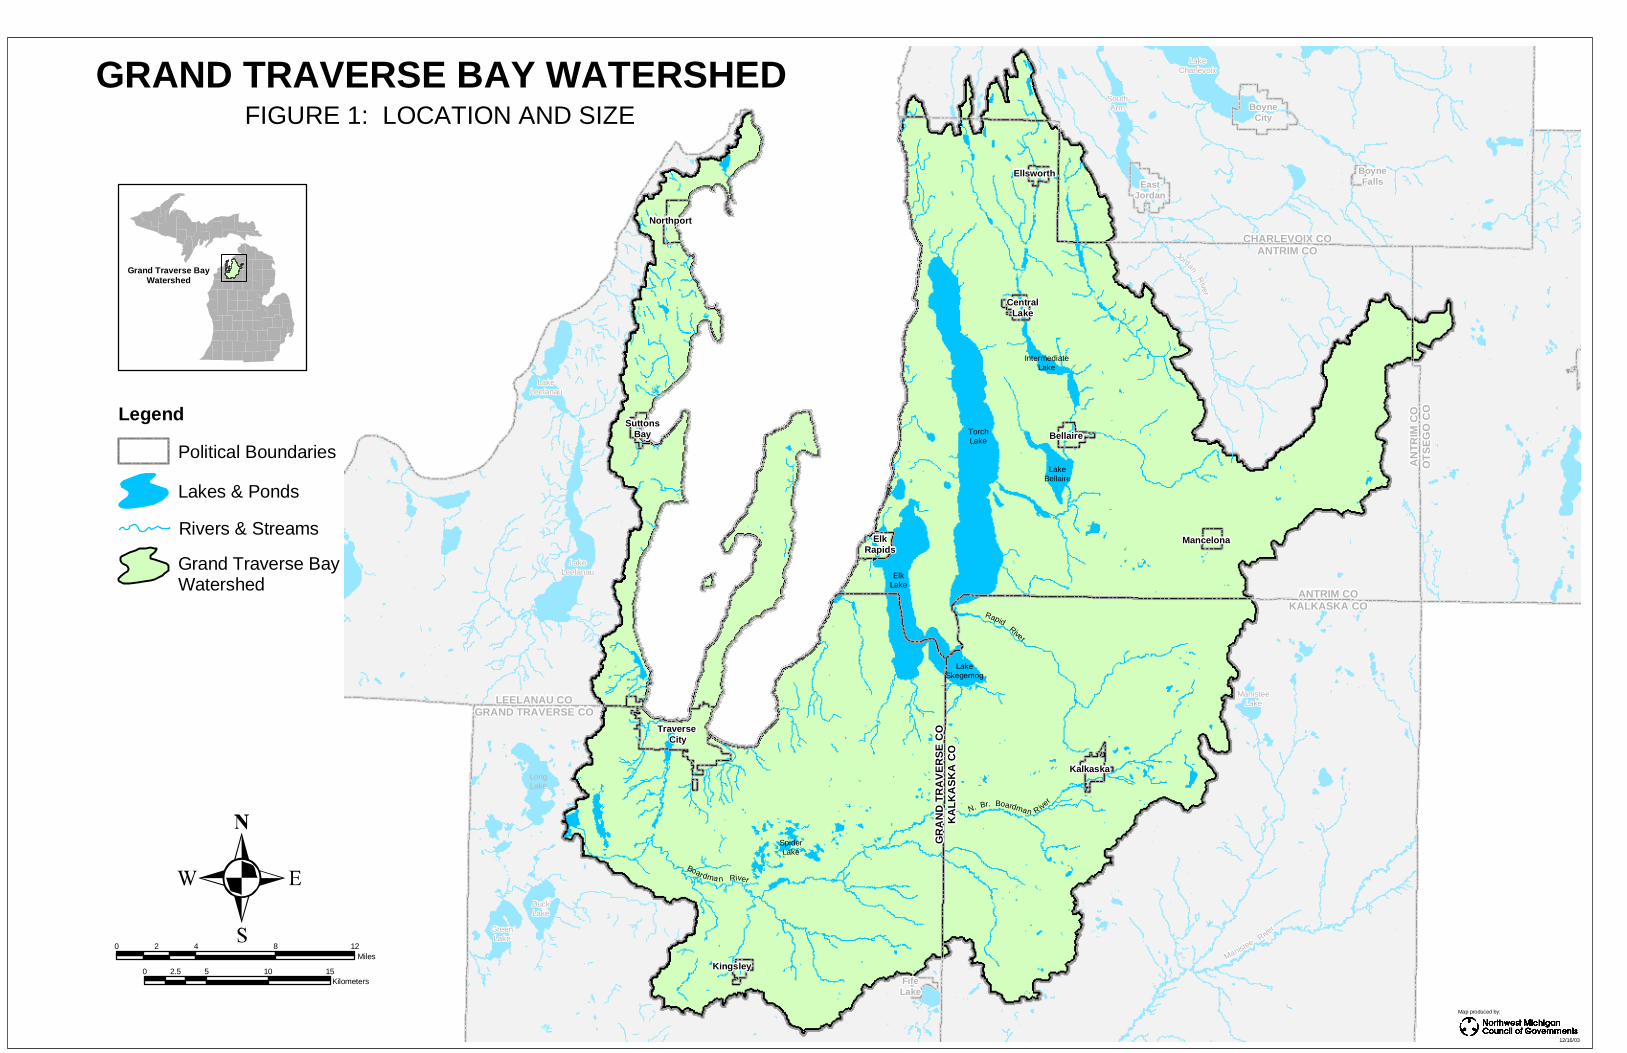
WATERSHED 3.1 Location and Size The Grand Traverse Bay watershed is located in beautiful northwest Michigan’s lower peninsula and drains approximately 976 square miles of land. The watershed is one of the larger ones in the State of Michigan and covers major portions of four counties: Antrim, Grand Traverse, Kalkaska, and Leelanau (Table 1). The largest municipality in the watershed is the City of Traverse City. Other towns and villages in the watershed include Northport, Suttons Bay, Kingsley, Acme, Kalkaska, Mancelona, Bellaire, and Elk Rapids (Figure 1).
TABLE 1: COUNTIES LOCATED IN THE GRAND TRAVERSE BAY WATERSHED
County Area (mi2) Area in Watershed (mi2)
% County in Watershed
% Watershed per County
Leelanau 375.7 66.6 17.7% 6.8%
Grand Traverse 490.3 296.0 60.4% 30.3%
Kalkaska 571.0 212.6 37.2% 21.8%
Antrim 524.5 378.6 72.2% 38.8%
Charlevoix 453.9 19.0 4.2% 2.0%
Otsego 527.3 3.2 0.6% 0.3%
TOTAL 2942.7 976.0 Grand Traverse Bay comprises 132-miles of Lake Michigan shoreline from its northwest tip at the Leelanau lighthouse to its northeast tip at Norwood. The bay spans 10 miles at its widest point, stretches a lengthy 32 miles to its base in Traverse City, and has its deepest point at 590 feet (Figure 1). The bay is divided into western and eastern arms by a peninsula, which extends northward approximately 18 miles. Grand Traverse Bay is one of the few remaining oligotrophic embayments in the Great Lakes and arguably has the highest water quality of the larger Lake Michigan bays. Oligotrophic is a term applied to lakes that are typically low in accumulated nutrients and high in dissolved oxygen, both of which are characteristics of high quality waters. Lakes such as these are clear and blue and most often cold, much like the Grand Traverse Bay.
CHARLEVOIX COANTRIM CO
CHARLEVOIX COANTRIM CO
ANTRIM COKALKASKA CO
ANTRIM COKALKASKA CO
AN
TR
IM C
OO
TS
EG
O C
OA
NT
RIM
CO
OT
SE
GO
CO
GR
AN
D T
RA
VE
RS
E C
OK
AL
KA
SK
A C
OG
RA
ND
TR
AV
ER
SE
CO
KA
LK
AS
KA
CO
LEELANAU COGRAND TRAVERSE CO
LEELANAU COGRAND TRAVERSE CO
NorthportNorthport
SuttonsBay
SuttonsBay
Traverse City
Traverse City
ElkRapids
ElkRapids
KingsleyKingsley
KalkaskaKalkaska
MancelonaMancelona
BellaireBellaire
CentralLake
CentralLake
EllsworthEllsworthEast
JordanEast
Jordan
BoyneCity
BoyneCity
FifeLakeFifeLake
BoyneFalls
BoyneFalls
ElkLake
TorchLake
LakeLeelanau
LakeLeelanau
LongLake
DuckLakeDuckLake
GreenLake
GreenLake
LakeLeelanau
LakeLeelanau
LakeCharlevoix
LakeCharlevoix
SouthArm
SouthArm
LakeBellaire
ManisteeLake
ManisteeLake
IntermediateLake
LakeSkegemog
Manistee Rive
r
Manistee Rive
r
Rapid River
Jordan Rive r
Jordan Rive r
N. Br. Boardman R iver
SpiderLake
Boardma n River
0 4 8 122Miles
0 5 10 152.5Kilometers
GRAND TRAVERSE BAY WATERSHEDFIGURE 1: LOCATION AND SIZE
Legend
Lakes & Ponds
Rivers & Streams
Political Boundaries
Grand Traverse BayWatershed
Grand Traverse BayWatershed
12/16/03
Map produced by:
11
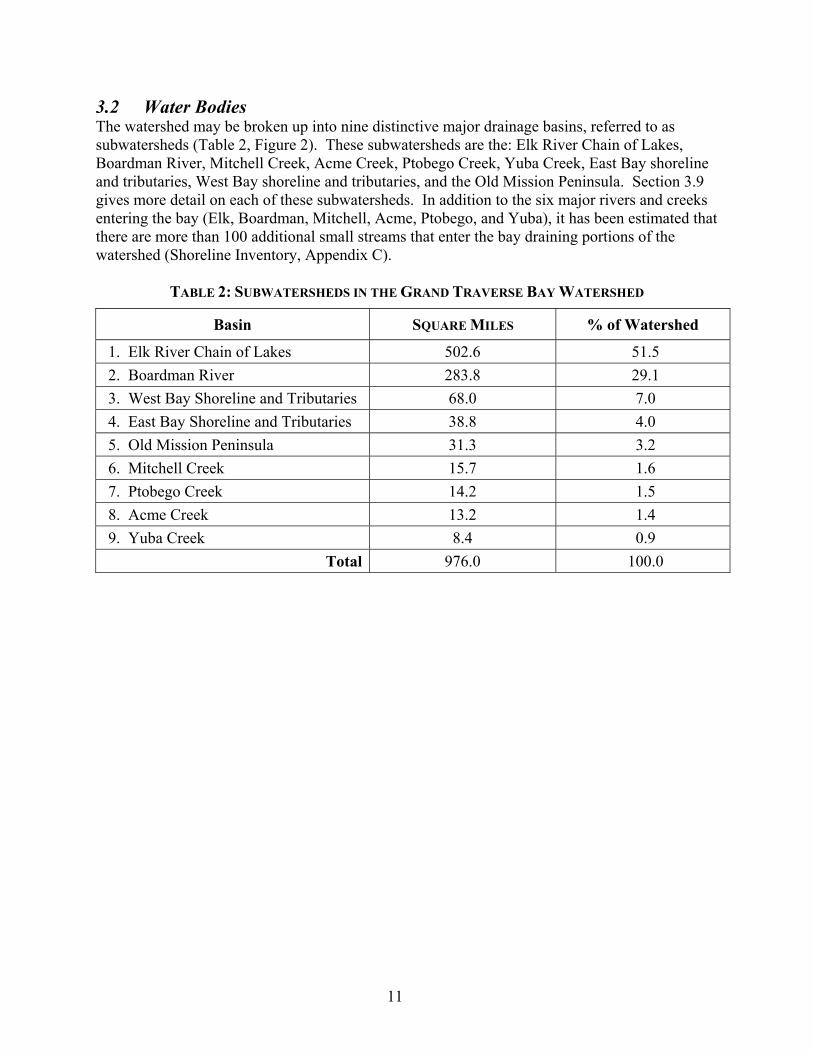
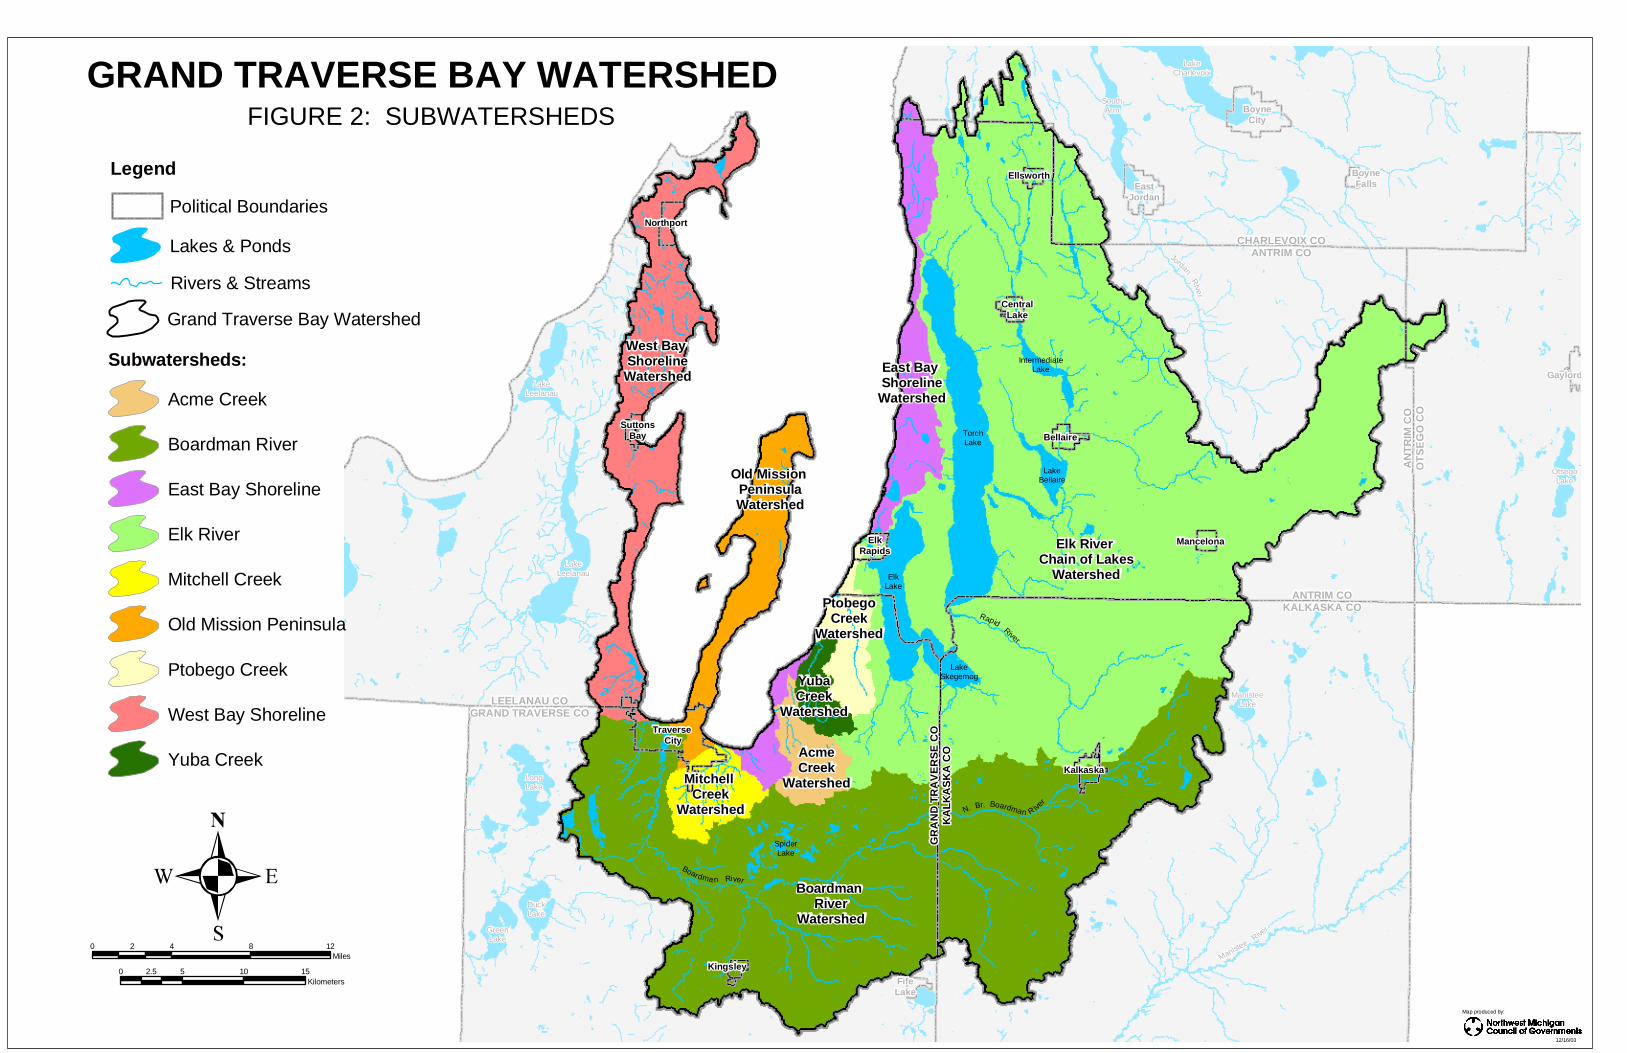
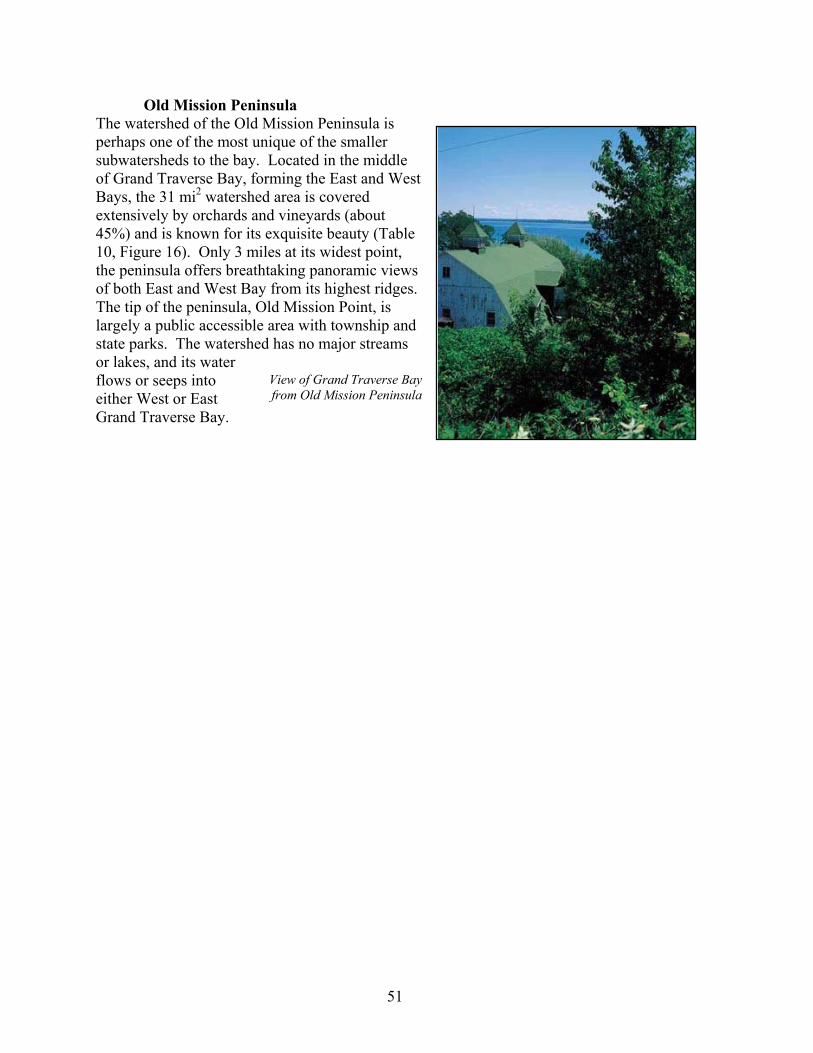
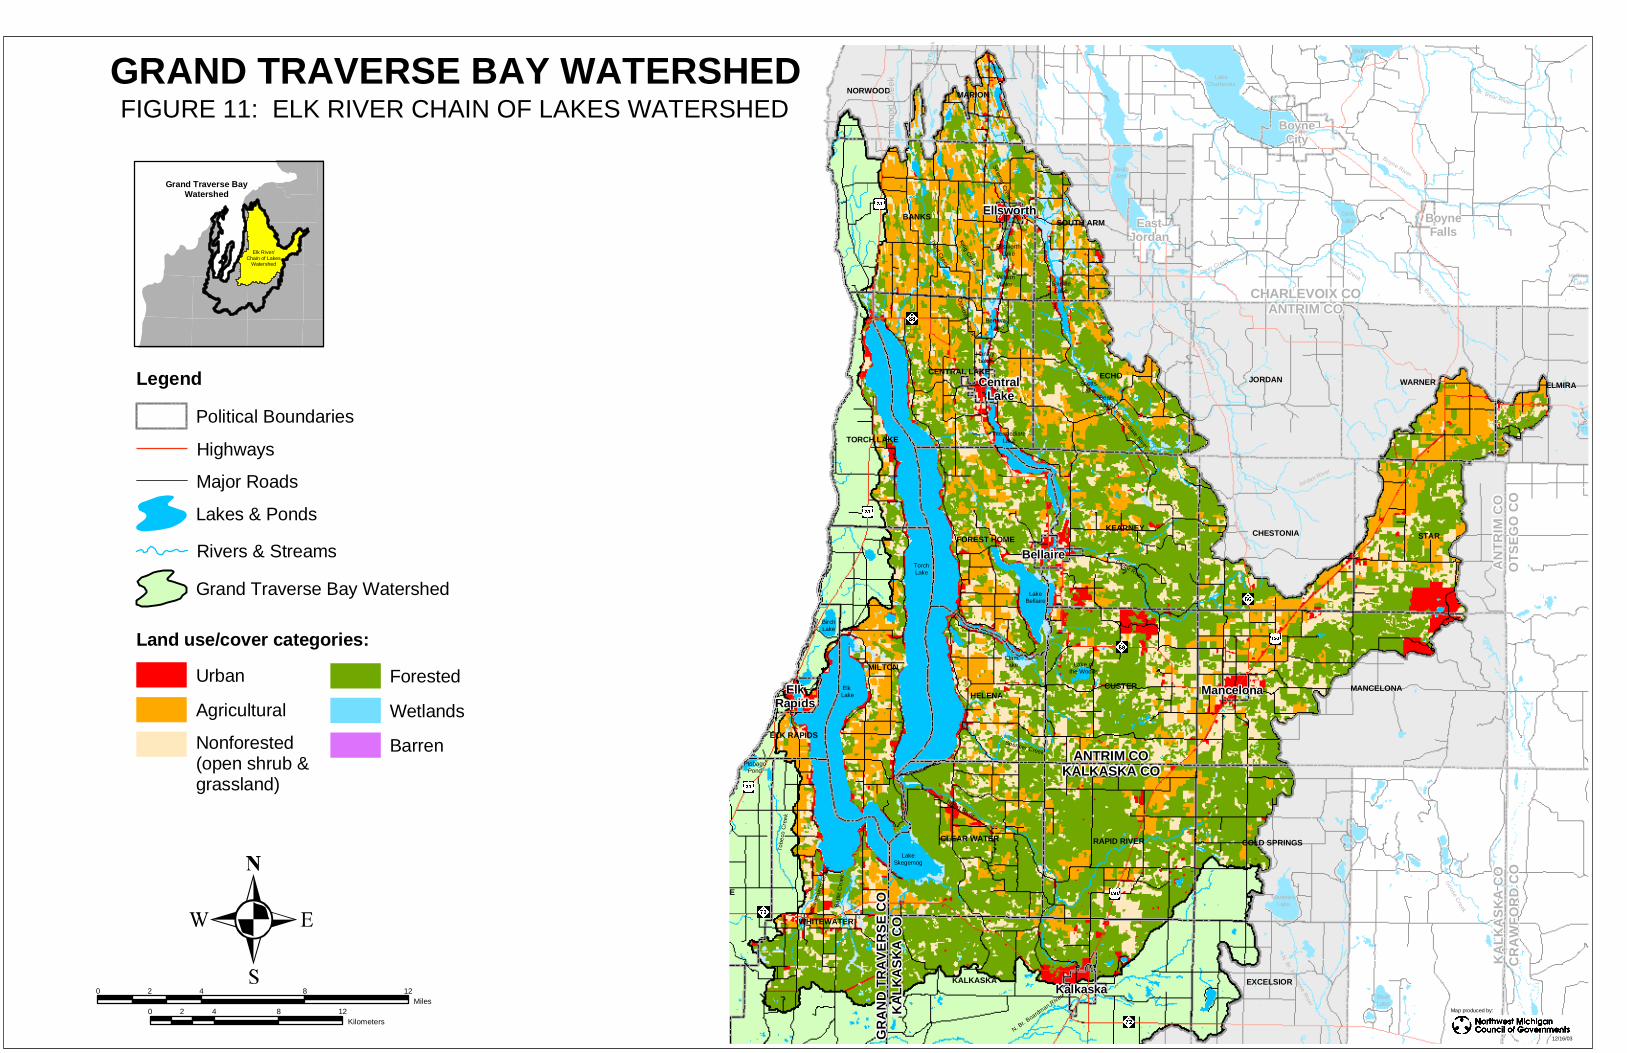
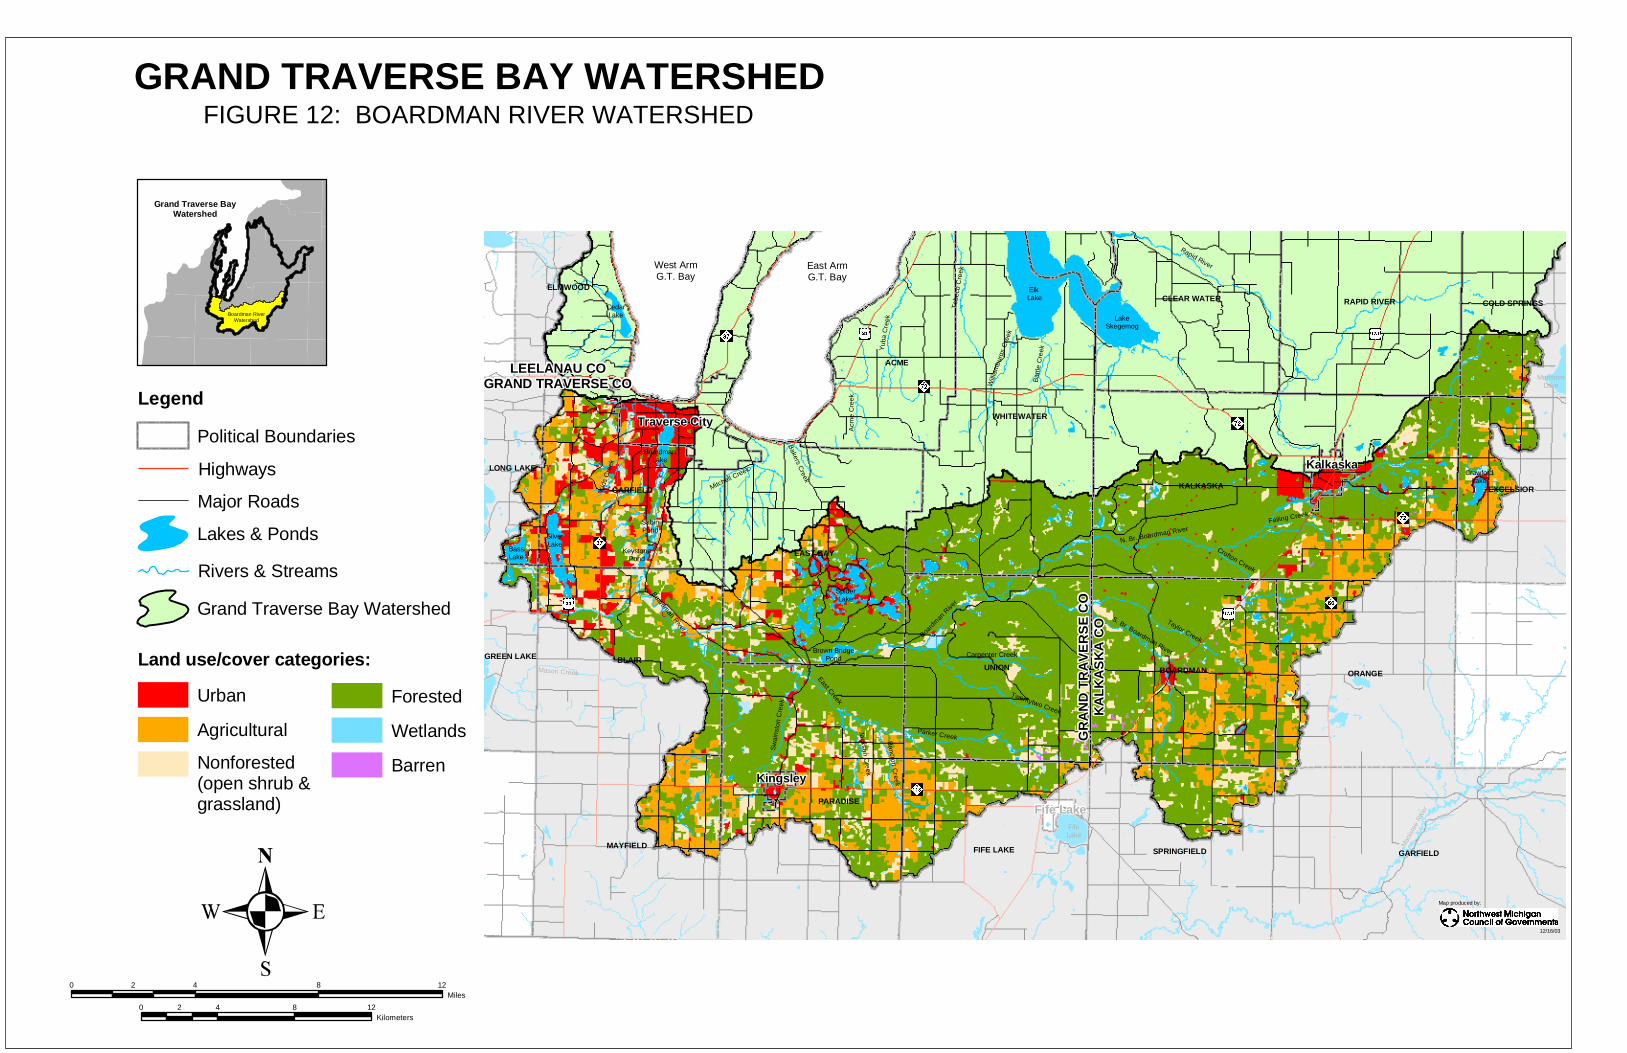
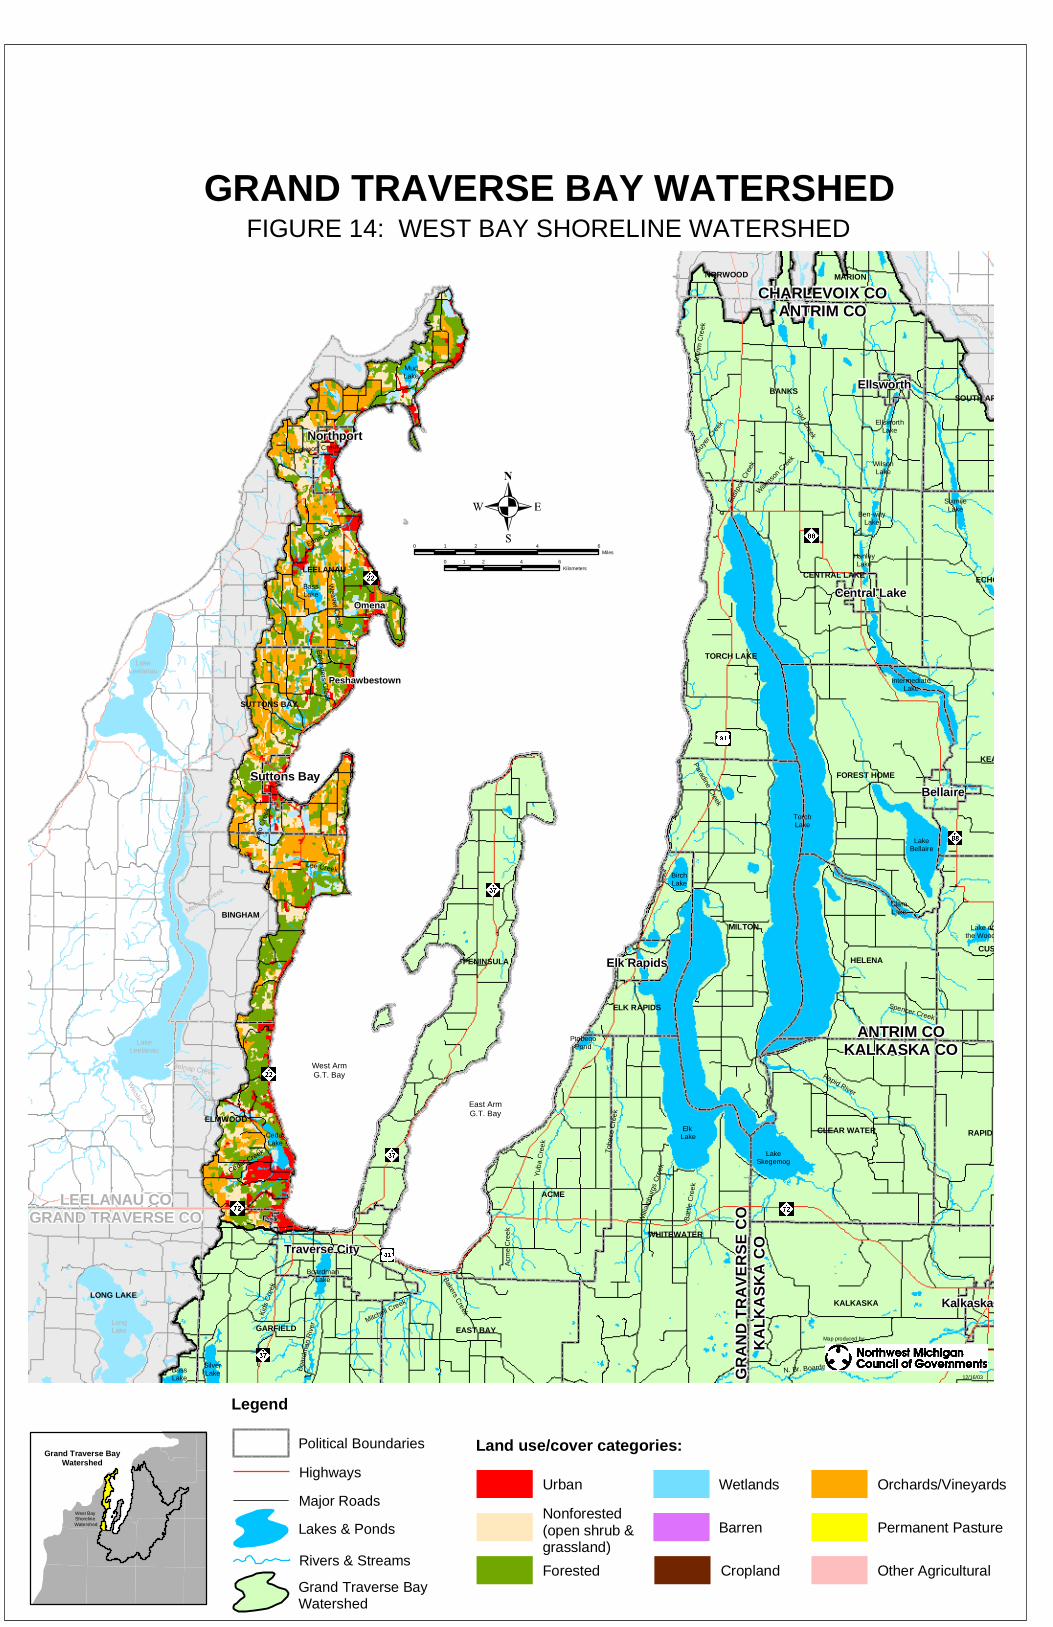
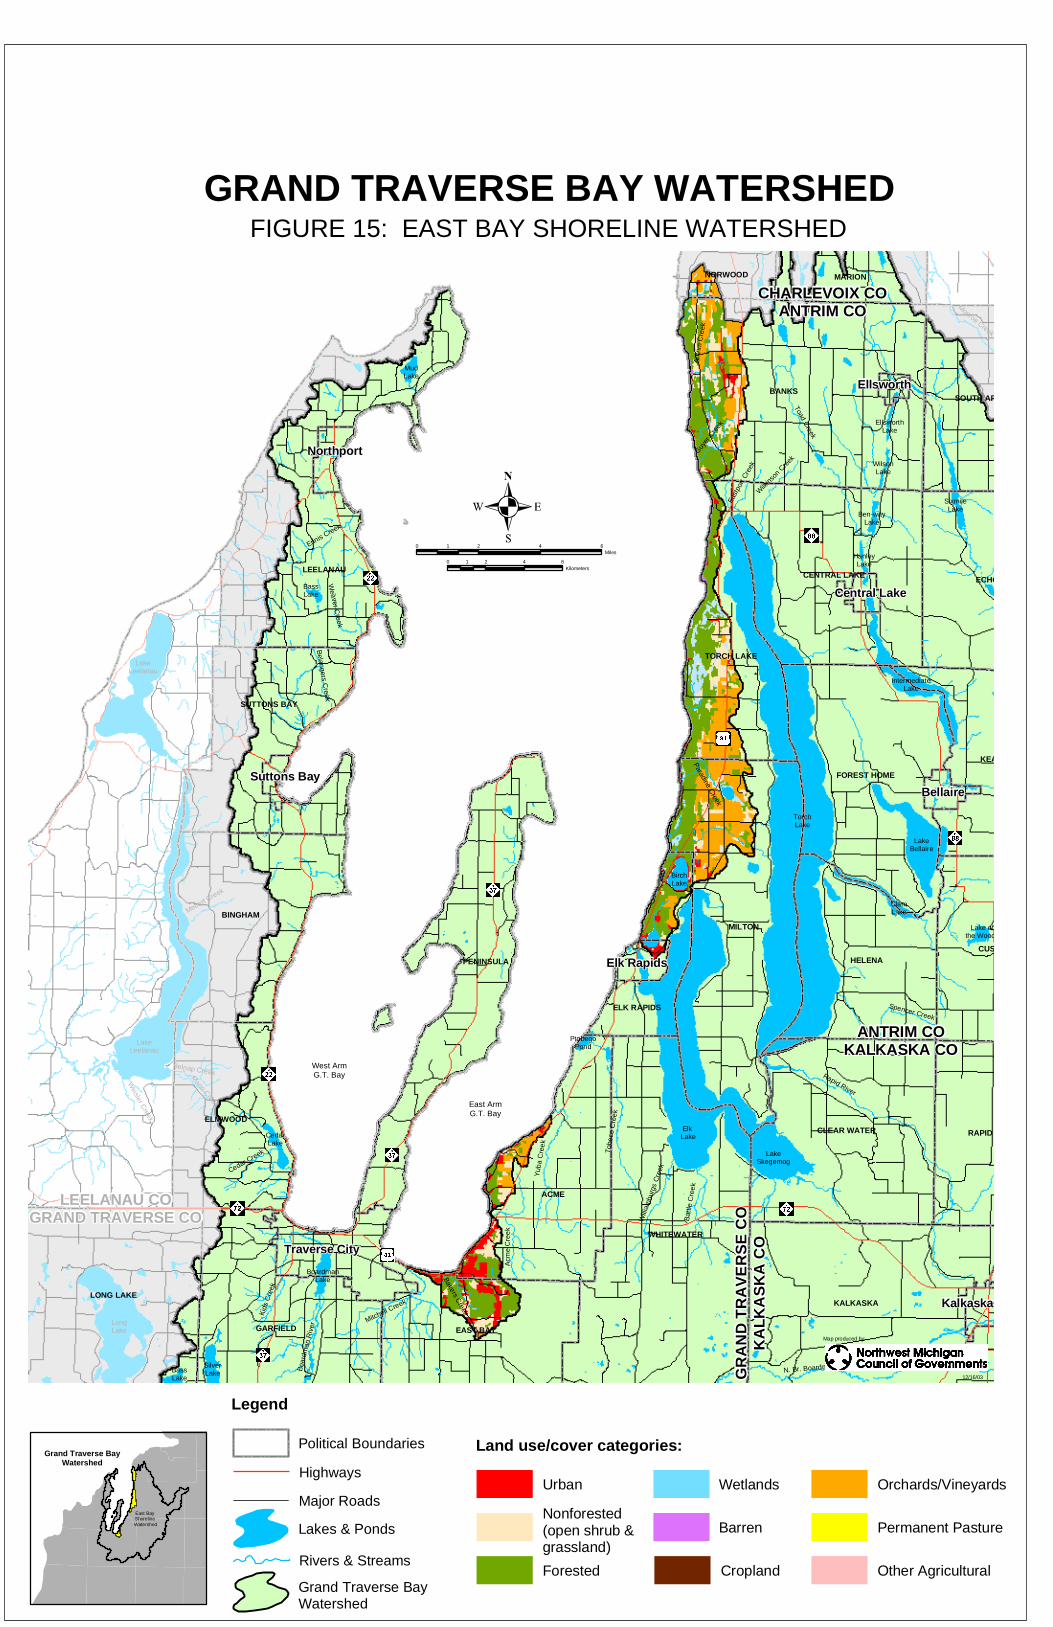
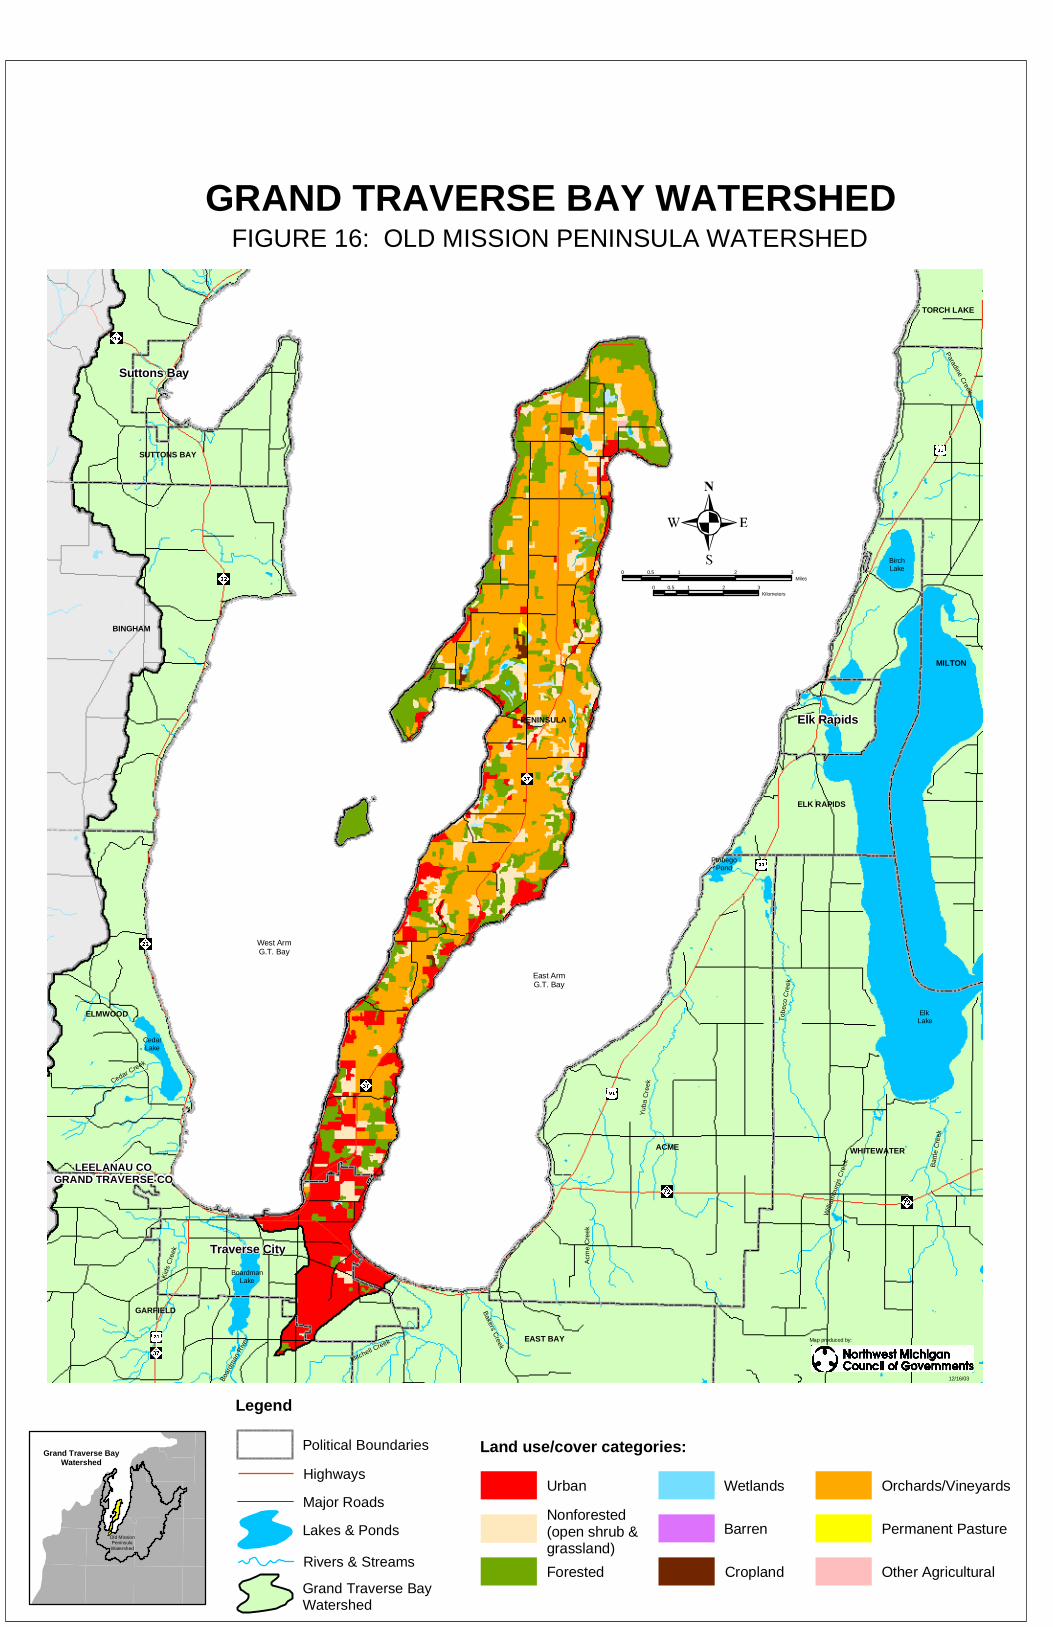
3.2 Water Bodies The watershed may be broken up into nine distinctive major drainage basins, referred to as subwatersheds (Table 2, Figure 2). These subwatersheds are the: Elk River Chain of Lakes, Boardman River, Mitchell Creek, Acme Creek, Ptobego Creek, Yuba Creek, East Bay shoreline and tributaries, West Bay shoreline and tributaries, and the Old Mission Peninsula. Section 3.9 gives more detail on each of these subwatersheds. In addition to the six major rivers and creeks entering the bay (Elk, Boardman, Mitchell, Acme, Ptobego, and Yuba), it has been estimated that there are more than 100 additional small streams that enter the bay draining portions of the watershed (Shoreline Inventory, Appendix C).
TABLE 2: SUBWATERSHEDS IN THE GRAND TRAVERSE BAY WATERSHED
Basin SQUARE MILES % of Watershed
1. Elk River Chain of Lakes 502.6 51.5 2. Boardman River 283.8 29.1 3. West Bay Shoreline and Tributaries 68.0 7.0 4. East Bay Shoreline and Tributaries 38.8 4.0 5. Old Mission Peninsula 31.3 3.2 6. Mitchell Creek 15.7 1.6 7. Ptobego Creek 14.2 1.5 8. Acme Creek 13.2 1.4 9. Yuba Creek 8.4 0.9
Total 976.0 100.0
CHARLEVOIX COANTRIM CO
CHARLEVOIX COANTRIM CO
ANTRIM COKALKASKA CO
ANTRIM COKALKASKA CO
AN
TR
IM C
OO
TS
EG
O C
OA
NT
RIM
CO
OT
SE
GO
CO
GR
AN
D T
RA
VE
RS
E C
OK
AL
KA
SK
A C
OG
RA
ND
TR
AV
ER
SE
CO
KA
LK
AS
KA
CO
LEELANAU COGRAND TRAVERSE CO
LEELANAU COGRAND TRAVERSE CO
NorthportNorthport
SuttonsBay
SuttonsBay
Traverse City
Traverse City
ElkRapids
ElkRapids
KingsleyKingsley
KalkaskaKalkaska
MancelonaMancelona
BellaireBellaire
CentralLake
CentralLake
EllsworthEllsworthEast
JordanEast
Jordan
BoyneCity
BoyneCity
FifeLakeFifeLake
BoyneFalls
BoyneFalls
GaylordGaylord
ElkLake
TorchLake
LakeLeelanau
LakeLeelanau
LongLakeLongLake
DuckLakeDuckLake
GreenLake
GreenLake
LakeLeelanau
LakeLeelanau
OtsegoLake
OtsegoLake
LakeCharlevoix
LakeCharlevoix
SouthArm
SouthArm
LakeBellaire
ManisteeLake
ManisteeLake
IntermediateLake
LakeSkegemog
Manistee R
iver
Manistee R
iver
Rapid River
Jordan River
Jordan River
N. Br. Boardman R
ive
r
SpiderLake
Boardma n River
0 4 8 122Miles
0 5 10 152.5Kilometers
GRAND TRAVERSE BAY WATERSHED
Boardman River
Watershed
Boardman River
Watershed
Elk River Chain of Lakes
Watershed
Elk River Chain of Lakes
Watershed
West Bay Shoreline
Watershed
West Bay Shoreline
Watershed
Old Mission PeninsulaWatershed
Old Mission PeninsulaWatershed
East Bay Shoreline
Watershed
East Bay Shoreline
Watershed
Mitchell Creek
Watershed
Mitchell Creek
Watershed
PtobegoCreek
Watershed
PtobegoCreek
Watershed
YubaCreek
Watershed
YubaCreek
Watershed
AcmeCreek
Watershed
AcmeCreek
Watershed
FIGURE 2: SUBWATERSHEDS
12/16/03
Map produced by:
Grand Traverse Bay Watershed
Legend
Lakes & Ponds
Rivers & Streams
Political Boundaries
Subwatersheds:
Acme Creek
Boardman River
East Bay Shoreline
Elk River
Mitchell Creek
Old Mission Peninsula
Ptobego Creek
West Bay Shoreline
Yuba Creek
13
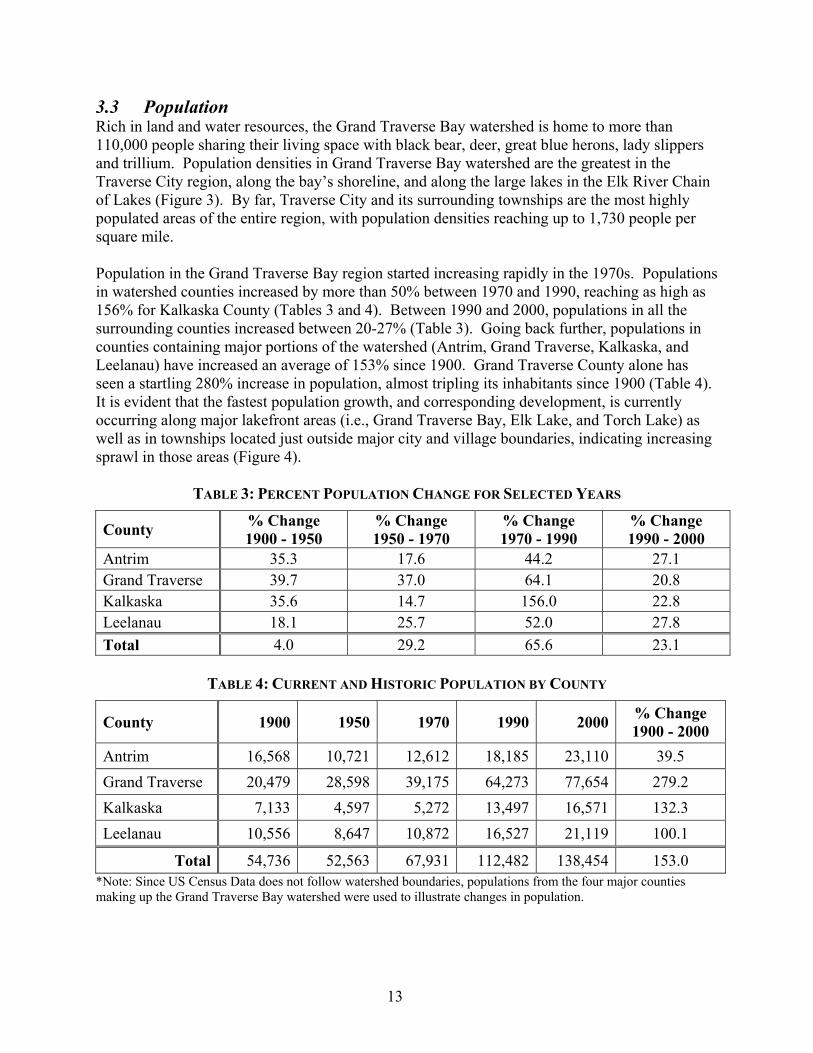
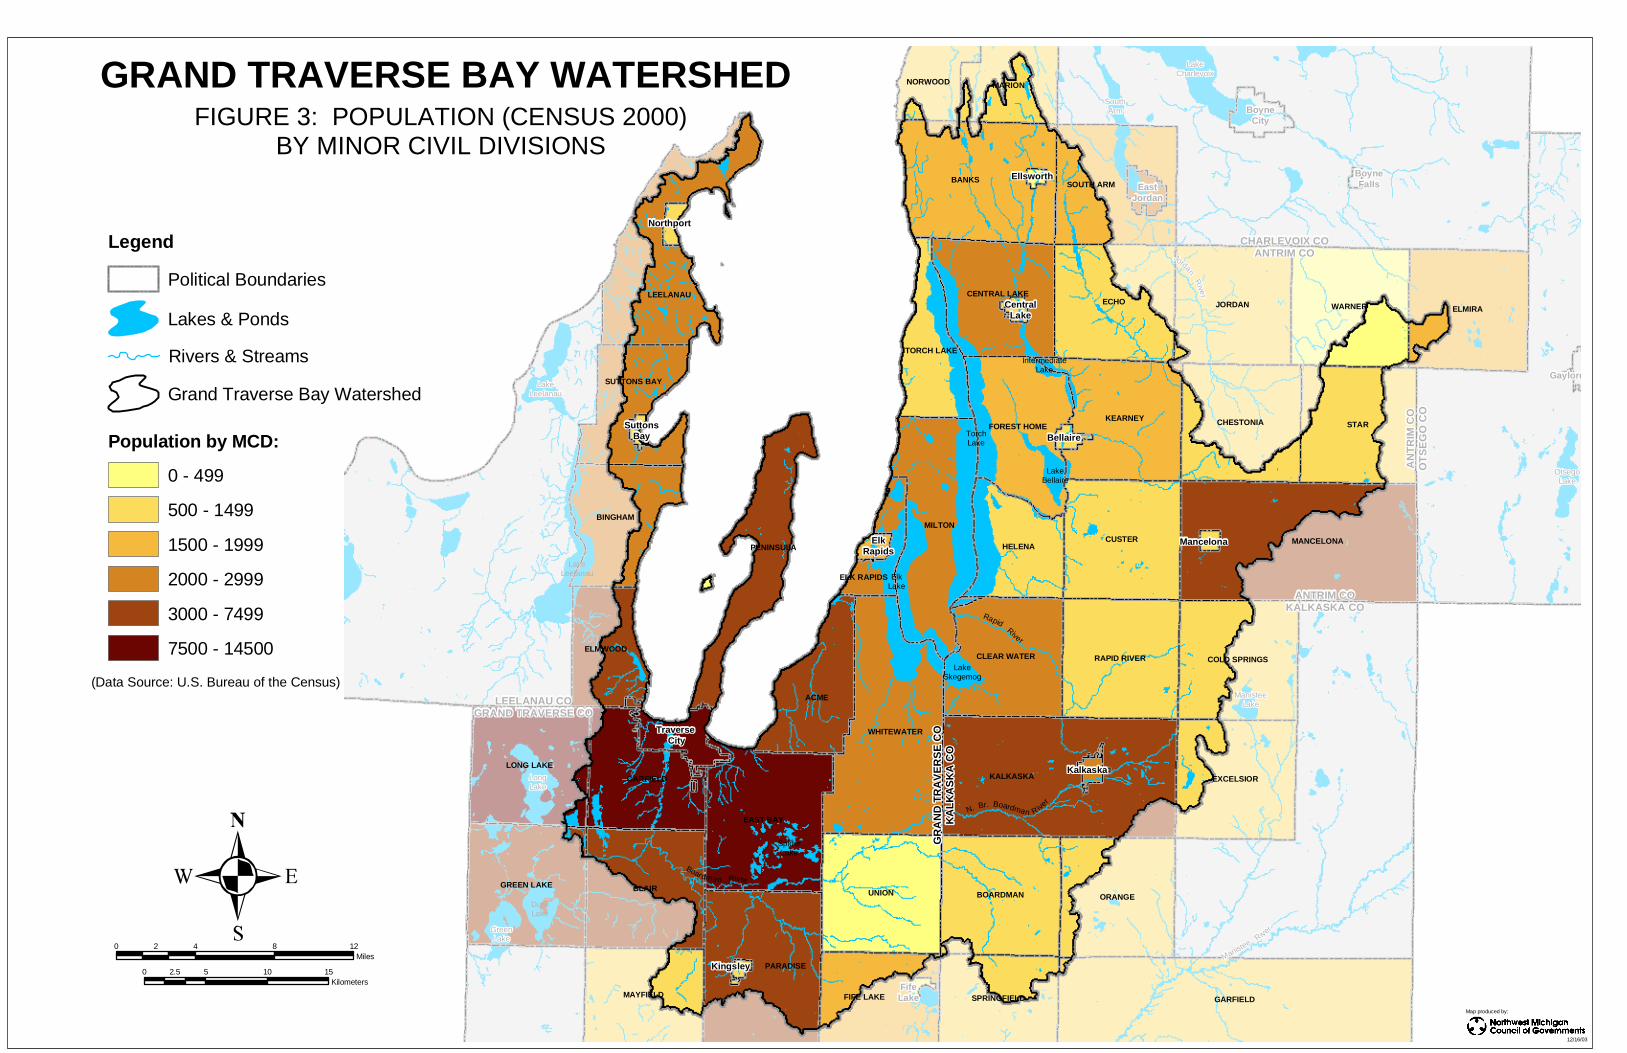
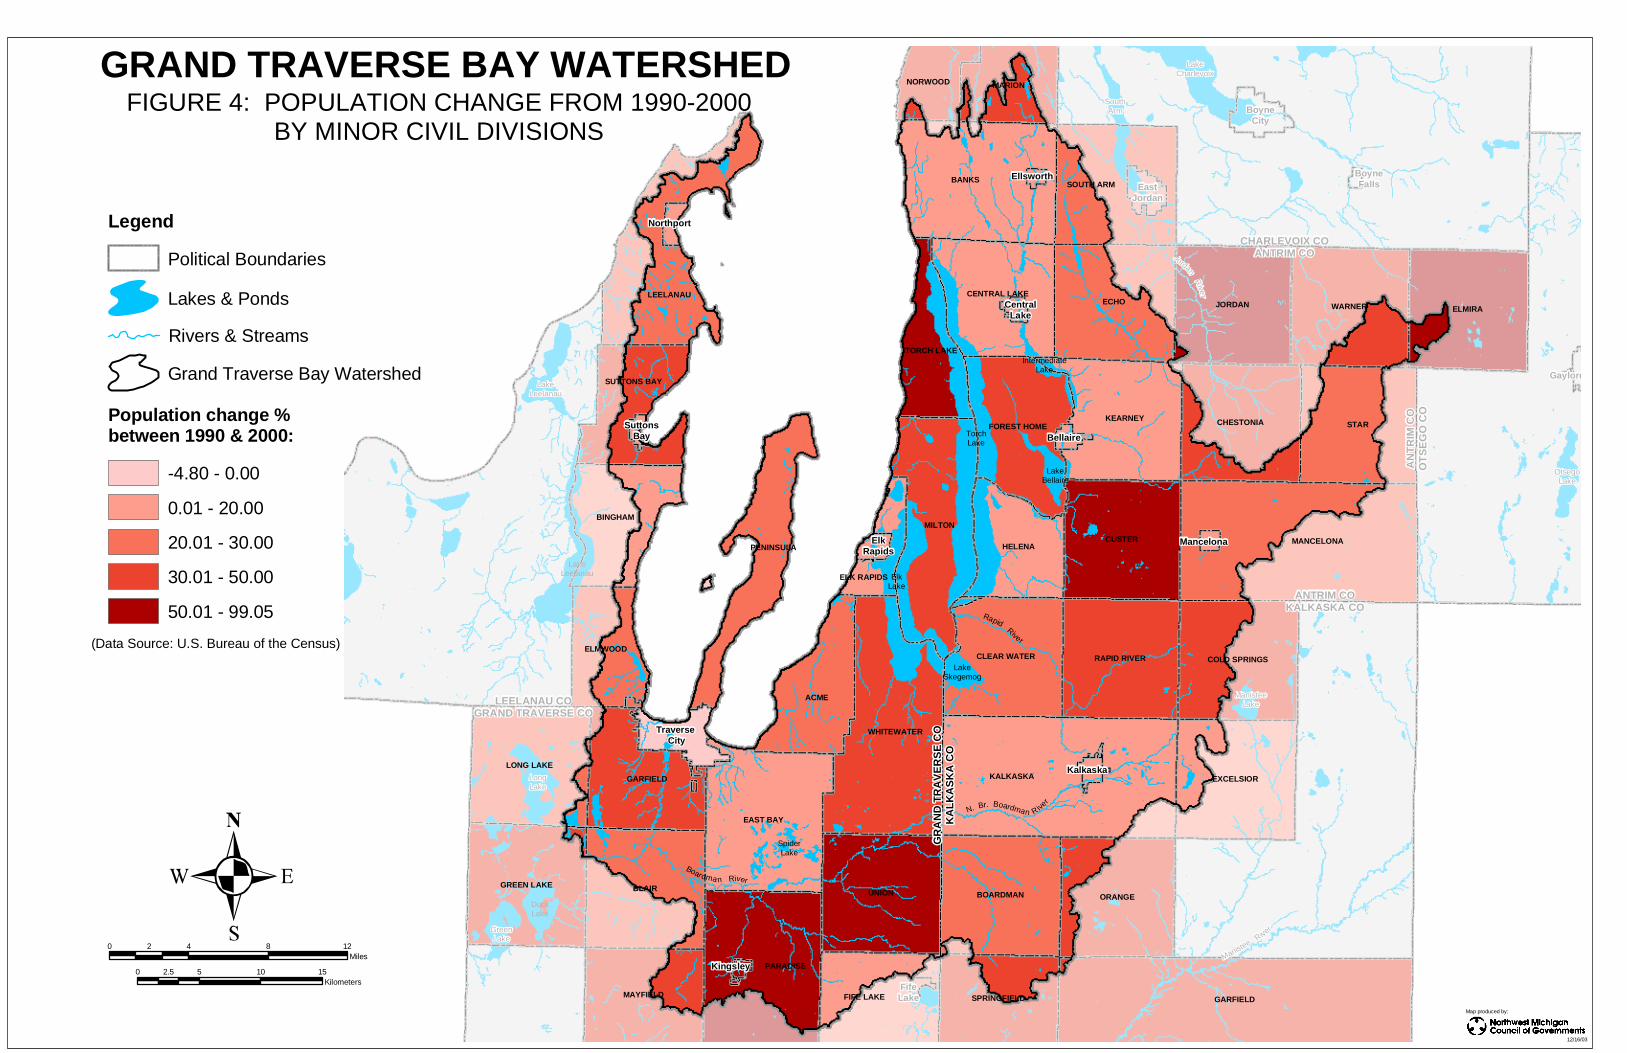
3.3 Population Rich in land and water resources, the Grand Traverse Bay watershed is home to more than 110,000 people sharing their living space with black bear, deer, great blue herons, lady slippers and trillium. Population densities in Grand Traverse Bay watershed are the greatest in the Traverse City region, along the bay’s shoreline, and along the large lakes in the Elk River Chain of Lakes (Figure 3). By far, Traverse City and its surrounding townships are the most highly populated areas of the entire region, with population densities reaching up to 1,730 people per square mile. Population in the Grand Traverse Bay region started increasing rapidly in the 1970s. Populations in watershed counties increased by more than 50% between 1970 and 1990, reaching as high as 156% for Kalkaska County (Tables 3 and 4). Between 1990 and 2000, populations in all the surrounding counties increased between 20-27% (Table 3). Going back further, populations in counties containing major portions of the watershed (Antrim, Grand Traverse, Kalkaska, and Leelanau) have increased an average of 153% since 1900. Grand Traverse County alone has seen a startling 280% increase in population, almost tripling its inhabitants since 1900 (Table 4). It is evident that the fastest population growth, and corresponding development, is currently occurring along major lakefront areas (i.e., Grand Traverse Bay, Elk Lake, and Torch Lake) as well as in townships located just outside major city and village boundaries, indicating increasing sprawl in those areas (Figure 4).
TABLE 3: PERCENT POPULATION CHANGE FOR SELECTED YEARS
Total 54,736 52,563 67,931 112,482 138,454 153.0 *Note: Since US Census Data does not follow watershed boundaries, populations from the four major counties making up the Grand Traverse Bay watershed were used to illustrate changes in population.
14
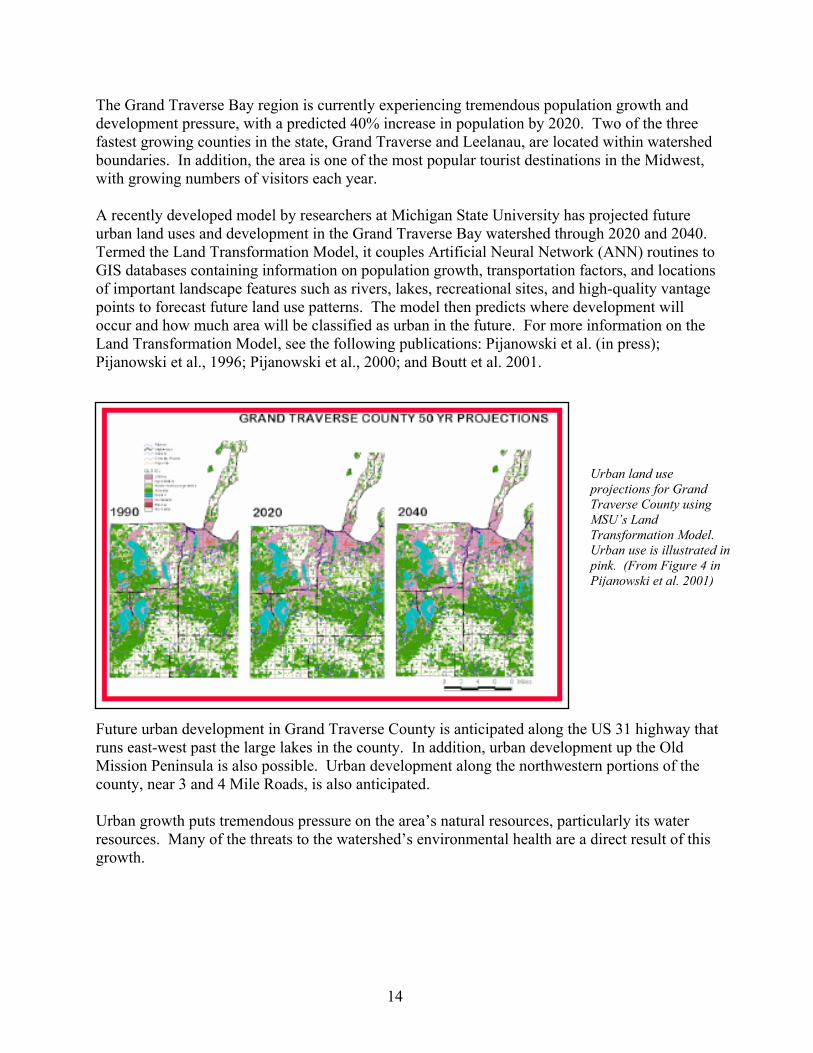
Urban land use projections for Grand Traverse County using MSU’s Land Transformation Model. Urban use is illustrated in pink. (From Figure 4 in Pijanowski et al. 2001)
The Grand Traverse Bay region is currently experiencing tremendous population growth and development pressure, with a predicted 40% increase in population by 2020. Two of the three fastest growing counties in the state, Grand Traverse and Leelanau, are located within watershed boundaries. In addition, the area is one of the most popular tourist destinations in the Midwest, with growing numbers of visitors each year. A recently developed model by researchers at Michigan State University has projected future urban land uses and development in the Grand Traverse Bay watershed through 2020 and 2040. Termed the Land Transformation Model, it couples Artificial Neural Network (ANN) routines to GIS databases containing information on population growth, transportation factors, and locations of important landscape features such as rivers, lakes, recreational sites, and high-quality vantage points to forecast future land use patterns. The model then predicts where development will occur and how much area will be classified as urban in the future. For more information on the Land Transformation Model, see the following publications: Pijanowski et al. (in press); Pijanowski et al., 1996; Pijanowski et al., 2000; and Boutt et al. 2001.
Future urban development in Grand Traverse County is anticipated along the US 31 highway that runs east-west past the large lakes in the county. In addition, urban development up the Old Mission Peninsula is also possible. Urban development along the northwestern portions of the county, near 3 and 4 Mile Roads, is also anticipated. Urban growth puts tremendous pressure on the area’s natural resources, particularly its water resources. Many of the threats to the watershed’s environmental health are a direct result of this growth.
CHARLEVOIX COANTRIM CO
CHARLEVOIX COANTRIM CO
ANTRIM COKALKASKA CO
ANTRIM COKALKASKA CO
AN
TR
IM C
OO
TS
EG
O C
OA
NT
RIM
CO
OT
SE
GO
CO
GR
AN
D T
RA
VE
RS
E C
OK
AL
KA
SK
A C
OG
RA
ND
TR
AV
ER
SE
CO
KA
LK
AS
KA
CO
LEELANAU COGRAND TRAVERSE CO
LEELANAU COGRAND TRAVERSE CO
NorthportNorthport
SuttonsBay
SuttonsBay
Traverse City
Traverse City
ElkRapids
ElkRapids
KingsleyKingsley
KalkaskaKalkaska
MancelonaMancelona
BellaireBellaire
CentralLake
CentralLake
EllsworthEllsworthEast
JordanEast
Jordan
BoyneCity
BoyneCity
FifeLakeFifeLake
BoyneFalls
BoyneFalls
GaylordGaylord
ElkLake
TorchLake
LakeLeelanau
LongLakeLongLake
DuckLake
GreenLake
GreenLake
LakeLeelanau
LakeLeelanau
OtsegoLake
OtsegoLake
LakeCharlevoix
LakeCharlevoix
SouthArm
SouthArm
LakeBellaire
ManisteeLake
ManisteeLake
IntermediateLake
LakeSkegemog
Manistee Rive
r
Manistee Rive
r
Rapid River
Jordan River
Jordan River
N. Br. Boardman Rive
r
SpiderLake
Boardma n River
GARFIELD
BANKS
KALKASKA
STAR
ECHO
BLAIR UNION
MANCELONA
MILTON
ELMIRA
PARADISE
CUSTER
EAST BAY
JORDAN
ACME
WHITEWATER
ORANGE
WARNERLEELANAU
KEARNEY
EXCELSIOR
BOARDMAN
SOUTH ARM
CHESTONIA
LONG LAKE
MAYFIELD
GREEN LAKE
HELENA
GARFIELD
RAPID RIVER
BINGHAM
FIFE LAKE
PENINSULA
COLD SPRINGSCLEAR WATER
FOREST HOME
MARION
CENTRAL LAKE
ELMWOOD
SPRINGFIELD
SUTTONS BAY
TORCH LAKE
NORWOOD
ELK RAPIDS
0 4 8 122Miles
0 5 10 152.5Kilometers
GRAND TRAVERSE BAY WATERSHEDFIGURE 3: POPULATION (CENSUS 2000)
BY MINOR CIVIL DIVISIONS
Legend
Lakes & Ponds
Rivers & Streams
Political Boundaries
Grand Traverse Bay Watershed
(Data Source: U.S. Bureau of the Census)
Population by MCD:
0 - 499
500 - 1499
1500 - 1999
2000 - 2999
3000 - 7499
7500 - 14500
12/16/03
Map produced by:
CHARLEVOIX COANTRIM CO
CHARLEVOIX COANTRIM CO
ANTRIM COKALKASKA CO
ANTRIM COKALKASKA CO
AN
TR
IM C
OO
TS
EG
O C
OA
NT
RIM
CO
OT
SE
GO
CO
GR
AN
D T
RA
VE
RS
E C
OK
AL
KA
SK
A C
OG
RA
ND
TR
AV
ER
SE
CO
KA
LK
AS
KA
CO
LEELANAU COGRAND TRAVERSE CO
LEELANAU COGRAND TRAVERSE CO
NorthportNorthport
SuttonsBay
SuttonsBay
Traverse City
Traverse City
ElkRapids
ElkRapids
KingsleyKingsley
KalkaskaKalkaska
MancelonaMancelona
BellaireBellaire
CentralLake
CentralLake
EllsworthEllsworthEast
JordanEast
Jordan
BoyneCity
BoyneCity
FifeLakeFifeLake
BoyneFalls
BoyneFalls
GaylordGaylord
ElkLake
TorchLake
LakeLeelanau
LongLakeLongLake
DuckLake
GreenLake
GreenLake
LakeLeelanau
LakeLeelanau
OtsegoLake
OtsegoLake
LakeCharlevoix
LakeCharlevoix
SouthArm
SouthArm
LakeBellaire
ManisteeLake
ManisteeLake
IntermediateLake
LakeSkegemog
Manistee Rive
r
Manistee Rive
r
Rapid River
Jordan River
Jordan River
N. Br. Boardman Rive
r
SpiderLake
Boardma n River
GARFIELD
BANKS
KALKASKA
STAR
ECHO
BLAIR UNION
MANCELONA
MILTON
ELMIRA
PARADISE
CUSTER
EAST BAY
JORDAN
ACME
WHITEWATER
ORANGE
WARNERLEELANAU
KEARNEY
EXCELSIOR
BOARDMAN
SOUTH ARM
CHESTONIA
LONG LAKE
MAYFIELD
GREEN LAKE
HELENA
GARFIELD
RAPID RIVER
BINGHAM
FIFE LAKE
PENINSULA
COLD SPRINGSCLEAR WATER
FOREST HOME
MARION
CENTRAL LAKE
ELMWOOD
SPRINGFIELD
SUTTONS BAY
TORCH LAKE
NORWOOD
ELK RAPIDS
0 4 8 122Miles
0 5 10 152.5Kilometers
GRAND TRAVERSE BAY WATERSHEDFIGURE 4: POPULATION CHANGE FROM 1990-2000
BY MINOR CIVIL DIVISIONS
Legend
Lakes & Ponds
Rivers & Streams
Political Boundaries
Grand Traverse Bay Watershed
(Data Source: U.S. Bureau of the Census)
Population change %between 1990 & 2000:
-4.80 - 0.00
0.01 - 20.00
20.01 - 30.00
30.01 - 50.00
50.01 - 99.05
12/16/03
Map produced by:
17
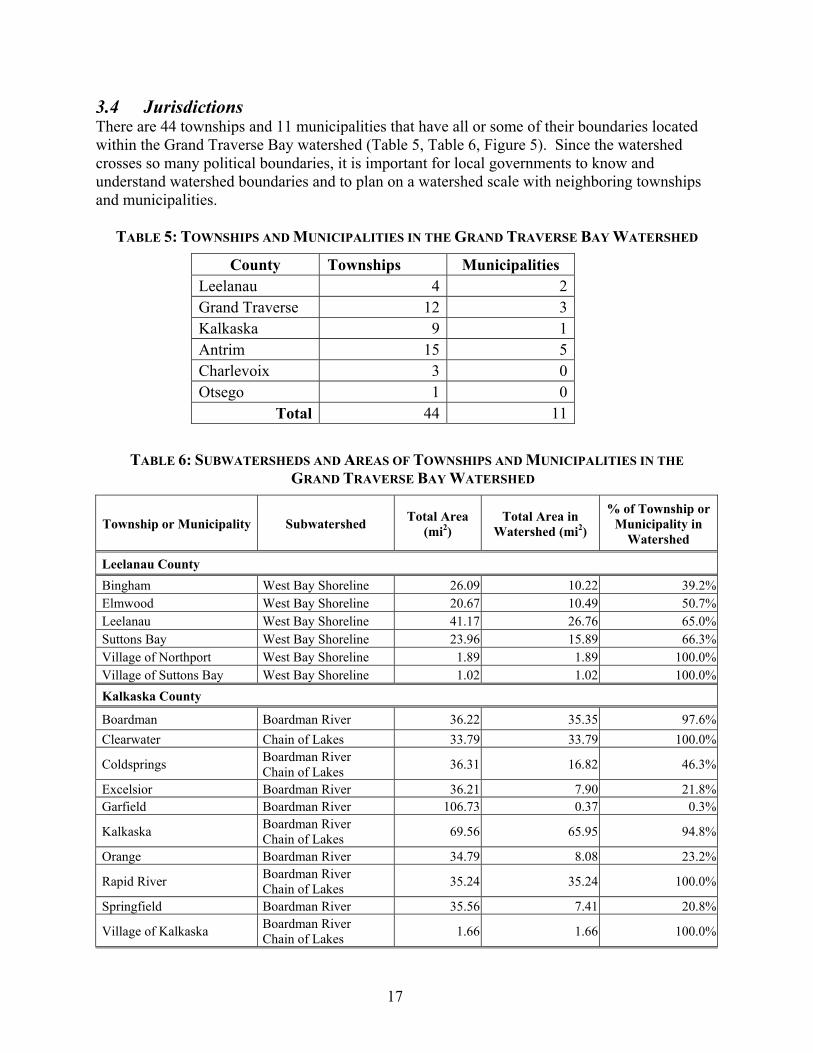
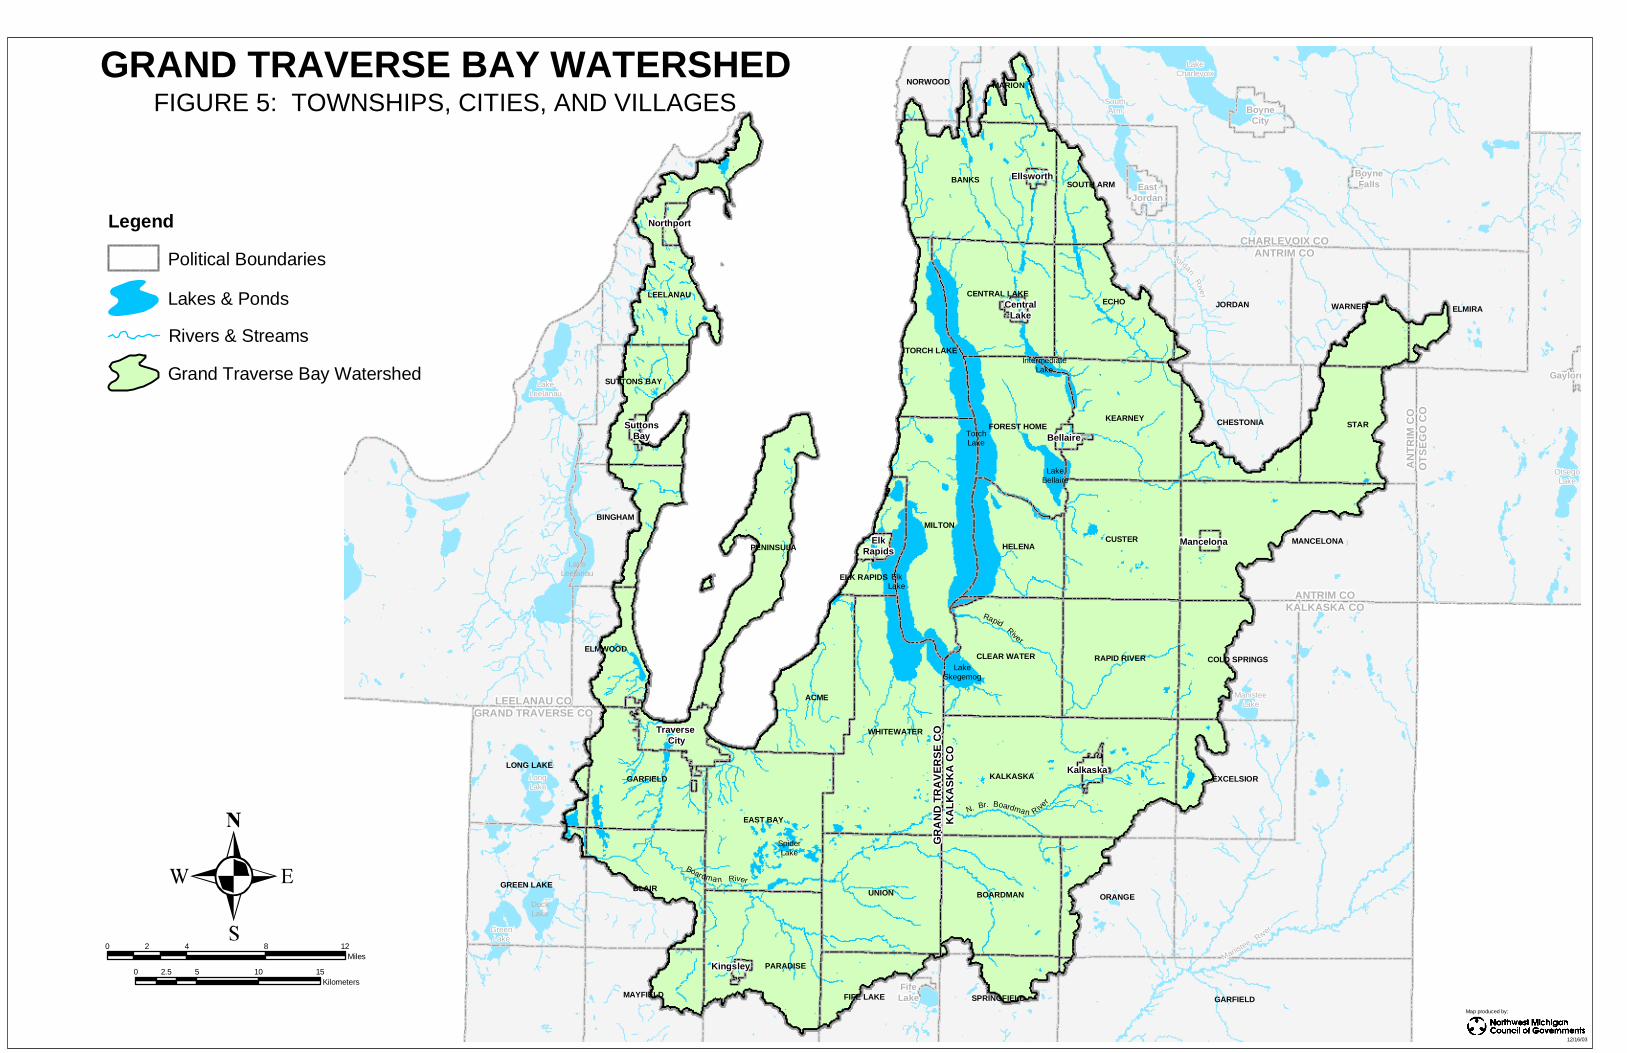
3.4 Jurisdictions There are 44 townships and 11 municipalities that have all or some of their boundaries located within the Grand Traverse Bay watershed (Table 5, Table 6, Figure 5). Since the watershed crosses so many political boundaries, it is important for local governments to know and understand watershed boundaries and to plan on a watershed scale with neighboring townships and municipalities.
TABLE 5: TOWNSHIPS AND MUNICIPALITIES IN THE GRAND TRAVERSE BAY WATERSHED
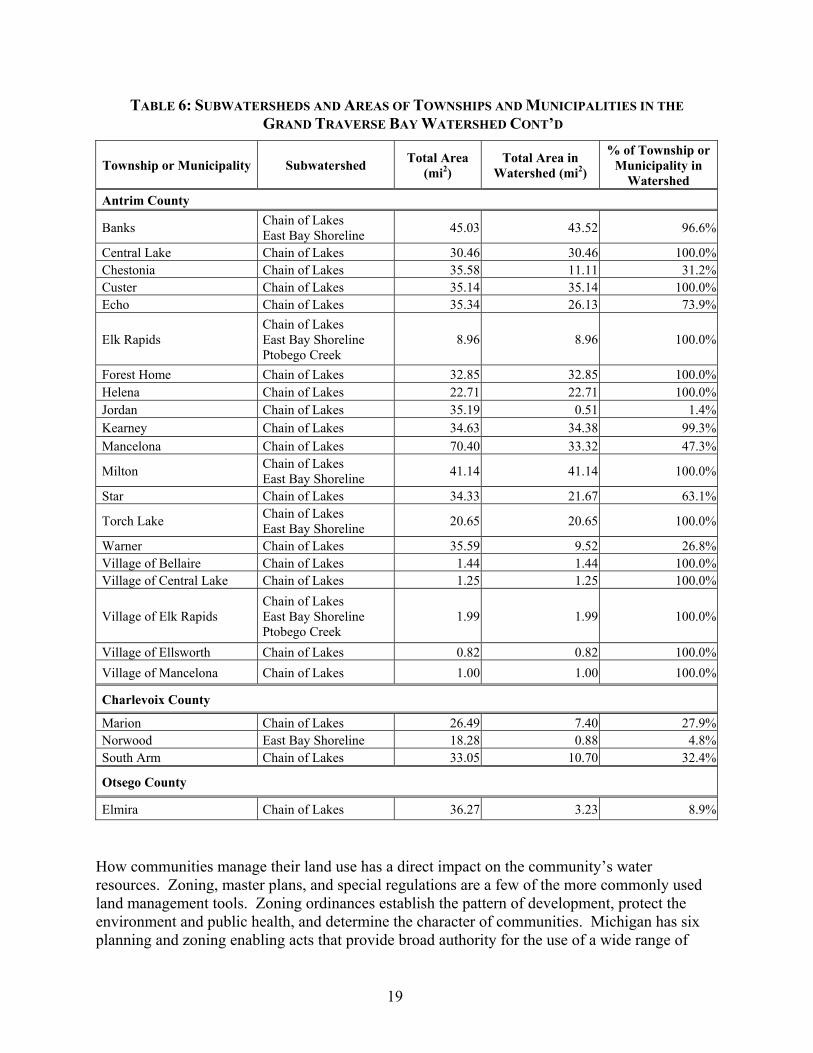
TABLE 6: SUBWATERSHEDS AND AREAS OF TOWNSHIPS AND MUNICIPALITIES IN THE GRAND TRAVERSE BAY WATERSHED
Township or Municipality Subwatershed Total Area (mi2)
Total Area in Watershed (mi2)
% of Township or Municipality in
Watershed
Leelanau County Bingham West Bay Shoreline 26.09 10.22 39.2%Elmwood West Bay Shoreline 20.67 10.49 50.7%Leelanau West Bay Shoreline 41.17 26.76 65.0%Suttons Bay West Bay Shoreline 23.96 15.89 66.3%Village of Northport West Bay Shoreline 1.89 1.89 100.0%Village of Suttons Bay West Bay Shoreline 1.02 1.02 100.0%Kalkaska County
Boardman Boardman River 36.22 35.35 97.6%Clearwater Chain of Lakes 33.79 33.79 100.0%
Coldsprings Boardman River Chain of Lakes 36.31 16.82 46.3%
Excelsior Boardman River 36.21 7.90 21.8%Garfield Boardman River 106.73 0.37 0.3%
Kalkaska Boardman River Chain of Lakes 69.56 65.95 94.8%
Orange Boardman River 34.79 8.08 23.2%
Rapid River Boardman River Chain of Lakes 35.24 35.24 100.0%
Springfield Boardman River 35.56 7.41 20.8%
Village of Kalkaska Boardman River Chain of Lakes 1.66 1.66 100.0%
18
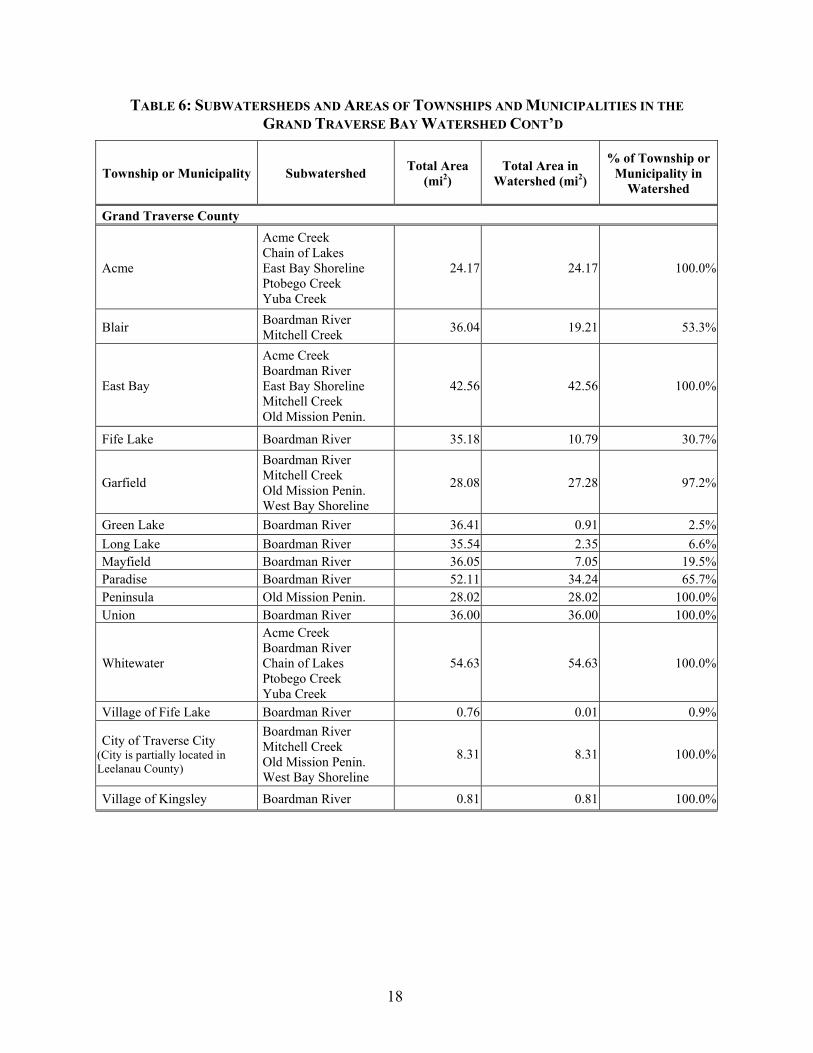
TABLE 6: SUBWATERSHEDS AND AREAS OF TOWNSHIPS AND MUNICIPALITIES IN THE GRAND TRAVERSE BAY WATERSHED CONT’D
Township or Municipality Subwatershed Total Area (mi2)
Total Area in Watershed (mi2)
% of Township or Municipality in
Watershed
Grand Traverse County
Acme
Acme Creek Chain of Lakes East Bay Shoreline Ptobego Creek Yuba Creek
24.17 24.17 100.0%
Blair Boardman River Mitchell Creek 36.04 19.21 53.3%
East Bay
Acme Creek Boardman River East Bay Shoreline Mitchell Creek Old Mission Penin.
42.56 42.56 100.0%
Fife Lake Boardman River 35.18 10.79 30.7%
Garfield
Boardman River Mitchell Creek Old Mission Penin. West Bay Shoreline
28.08 27.28 97.2%
Green Lake Boardman River 36.41 0.91 2.5%Long Lake Boardman River 35.54 2.35 6.6%Mayfield Boardman River 36.05 7.05 19.5%Paradise Boardman River 52.11 34.24 65.7%Peninsula Old Mission Penin. 28.02 28.02 100.0%Union Boardman River 36.00 36.00 100.0%
Whitewater
Acme Creek Boardman River Chain of Lakes Ptobego Creek Yuba Creek
54.63 54.63 100.0%
Village of Fife Lake Boardman River 0.76 0.01 0.9%
City of Traverse City (City is partially located in Leelanau County)
Boardman River Mitchell Creek Old Mission Penin. West Bay Shoreline
8.31 8.31 100.0%
Village of Kingsley Boardman River 0.81 0.81 100.0%
19
TABLE 6: SUBWATERSHEDS AND AREAS OF TOWNSHIPS AND MUNICIPALITIES IN THE GRAND TRAVERSE BAY WATERSHED CONT’D
Township or Municipality Subwatershed Total Area (mi2)
Total Area in Watershed (mi2)
% of Township or Municipality in
Watershed Antrim County
Banks Chain of Lakes East Bay Shoreline 45.03 43.52 96.6%
Central Lake Chain of Lakes 30.46 30.46 100.0%Chestonia Chain of Lakes 35.58 11.11 31.2%Custer Chain of Lakes 35.14 35.14 100.0%Echo Chain of Lakes 35.34 26.13 73.9%
Elk Rapids Chain of Lakes East Bay Shoreline Ptobego Creek
8.96 8.96 100.0%
Forest Home Chain of Lakes 32.85 32.85 100.0%Helena Chain of Lakes 22.71 22.71 100.0%Jordan Chain of Lakes 35.19 0.51 1.4%Kearney Chain of Lakes 34.63 34.38 99.3%Mancelona Chain of Lakes 70.40 33.32 47.3%
Milton Chain of Lakes East Bay Shoreline 41.14 41.14 100.0%
Star Chain of Lakes 34.33 21.67 63.1%
Torch Lake Chain of Lakes East Bay Shoreline 20.65 20.65 100.0%
Warner Chain of Lakes 35.59 9.52 26.8%Village of Bellaire Chain of Lakes 1.44 1.44 100.0%Village of Central Lake Chain of Lakes 1.25 1.25 100.0%
Village of Elk Rapids Chain of Lakes East Bay Shoreline Ptobego Creek
1.99 1.99 100.0%
Village of Ellsworth Chain of Lakes 0.82 0.82 100.0%Village of Mancelona Chain of Lakes 1.00 1.00 100.0%
Charlevoix County
Marion Chain of Lakes 26.49 7.40 27.9%Norwood East Bay Shoreline 18.28 0.88 4.8%South Arm Chain of Lakes 33.05 10.70 32.4%
Otsego County
Elmira Chain of Lakes 36.27 3.23 8.9% How communities manage their land use has a direct impact on the community’s water resources. Zoning, master plans, and special regulations are a few of the more commonly used land management tools. Zoning ordinances establish the pattern of development, protect the environment and public health, and determine the character of communities. Michigan has six planning and zoning enabling acts that provide broad authority for the use of a wide range of
20
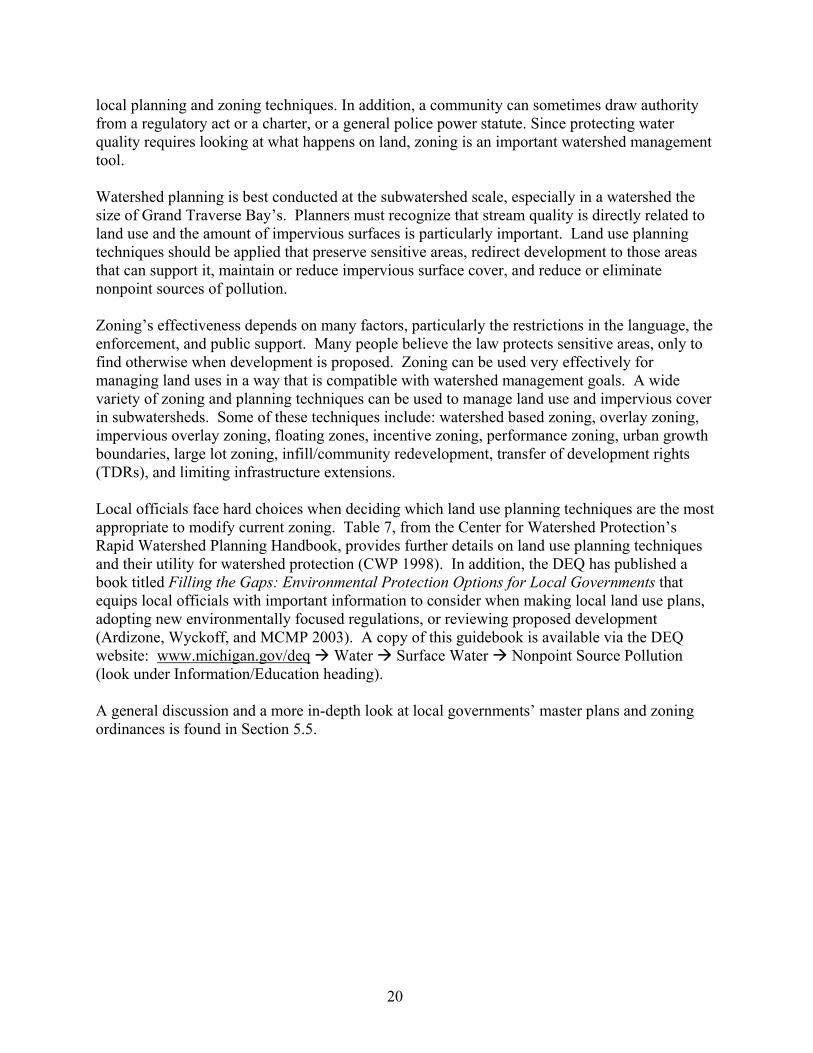
local planning and zoning techniques. In addition, a community can sometimes draw authority from a regulatory act or a charter, or a general police power statute. Since protecting water quality requires looking at what happens on land, zoning is an important watershed management tool. Watershed planning is best conducted at the subwatershed scale, especially in a watershed the size of Grand Traverse Bay’s. Planners must recognize that stream quality is directly related to land use and the amount of impervious surfaces is particularly important. Land use planning techniques should be applied that preserve sensitive areas, redirect development to those areas that can support it, maintain or reduce impervious surface cover, and reduce or eliminate nonpoint sources of pollution. Zoning’s effectiveness depends on many factors, particularly the restrictions in the language, the enforcement, and public support. Many people believe the law protects sensitive areas, only to find otherwise when development is proposed. Zoning can be used very effectively for managing land uses in a way that is compatible with watershed management goals. A wide variety of zoning and planning techniques can be used to manage land use and impervious cover in subwatersheds. Some of these techniques include: watershed based zoning, overlay zoning, impervious overlay zoning, floating zones, incentive zoning, performance zoning, urban growth boundaries, large lot zoning, infill/community redevelopment, transfer of development rights (TDRs), and limiting infrastructure extensions. Local officials face hard choices when deciding which land use planning techniques are the most appropriate to modify current zoning. Table 7, from the Center for Watershed Protection’s Rapid Watershed Planning Handbook, provides further details on land use planning techniques and their utility for watershed protection (CWP 1998). In addition, the DEQ has published a book titled Filling the Gaps: Environmental Protection Options for Local Governments that equips local officials with important information to consider when making local land use plans, adopting new environmentally focused regulations, or reviewing proposed development (Ardizone, Wyckoff, and MCMP 2003). A copy of this guidebook is available via the DEQ website: www.michigan.gov/deq Water Surface Water Nonpoint Source Pollution (look under Information/Education heading). A general discussion and a more in-depth look at local governments’ master plans and zoning ordinances is found in Section 5.5.
Description Utility as a Watershed Protection Tool
Watershed-Based Zoning
Watershed and subwatershed boundaries are in the foundation for land use planning.
Can be used to protect receiving water quality on the subwatershed scale by relocating development out of particular subwatersheds.
Overlay Zoning
Superimposes additional regulations for specific development criteria within specific mapped districts.
Can require development restrictions or allow alternative site design techniques in specific areas.
Impervious Overlay Zoning
Specific overlay zoning that limits total impervious cover within mapped districts.
Can be used to protect receiving water quality at both the subwatershed and site level.
Floating Zones
Applies a special zoning district without identifying the exact location until land owner specifically requests the zone.
May be used to obtain proffers or other watershed protective measures that accompany specific land uses within the district.
Incentive Zoning
Applies bonuses or incentives to encourage creation of amenities or environmental protection.
Can be used to encourage development within a particular subwatershed or to obtain open space in exchange for a density bonus at the site level.
Performance Zoning
Specifies a performance requirement that accompanies a zoning district.
Can be used to require additional levels of performance within a subwatershed or at the site level.
Urban Growth Boundaries
Establishes a dividing line that defines where a growth limit is to occur and where agricultural or rural land is to be preserved.
Can be used in conjunction with natural watershed or subwatershed boundaries to protect specific water bodies.
Large Lot Zoning Zones land at very low densities.
May be used to decrease impervious cover at the site or subwatershed level, but may have an adverse impact on regional or watershed imperviousness.
Infill/ Community Redevelopment
Encourage new development and redevelopment within existing developed areas.
May be used in conjunction with watershed based zoning or other zoning tools to restrict development in sensitive areas and foster development in areas with existing infrastructure.
Transfer of Development Rights (TDRs)
Transfers potential development from a designated “sending area” to a designated “receiving area”.
May be used in conjunction with watershed based zoning to restrict development in sensitive areas and encourage development in areas capable of accommodating increase densities.
Limiting Infrastructure Extensions
A conscious decision is made to limit or deny extending infrastructure (such as public sewer, water, or roads) to designated areas to avoid increased development in these areas.
May be used as a temporary method to control growth in a targeted watershed or subwatershed. Usually delays development until the economic or political climate changes.
Table from Center for Watershed Protection’s Rapid Watershed Planning Handbook – page 2.4-5
22
Statewide Survey of Elected and Township Officials (by MSUE Victor Institute) In spring 2002, Michigan State University Extension conducted a statewide survey of local officials to assess their perspectives on land use issues and decision-making as well as educational needs. One set of surveys was sent to county commissioners, county planning and zoning commissioners, township supervisors, trustees, and other township personnel (Suvedi et al. November 2002). Another set was sent to just township officials including supervisors, administrators, trustees, and other personnel (Suvedi et al. December 2002). Results of these surveys indicate that more than 75% of all respondents expect growth pressures to increase significantly in the next five years. When indicating the top ten future problems facing local governments, seven of the top ten problems were related to growth and water resource issues, indicating a strong concern for protection of natural resources by local officials. Growth issues:
• Loss of open spaces for other uses • Loss of forestland • Loss of farmland • Beginning of suburban sprawl
Water Resource Issues:
• Ground water quality • Surface water quality • Over development of lakeshores
As far as barriers to meeting land use challenges in local governments, more than 60% of both survey respondents ranked “poor public understanding of land use issues” and “poor public support for difficult land use decisions” as the top two reasons. This clearly indicates a strong need for public education to increase awareness of land use issues throughout local governments in the state.
CHARLEVOIX COANTRIM CO
CHARLEVOIX COANTRIM CO
ANTRIM COKALKASKA CO
ANTRIM COKALKASKA CO
AN
TR
IM C
OO
TS
EG
O C
OA
NT
RIM
CO
OT
SE
GO
CO
GR
AN
D T
RA
VE
RS
E C
OK
AL
KA
SK
A C
OG
RA
ND
TR
AV
ER
SE
CO
KA
LK
AS
KA
CO
LEELANAU COGRAND TRAVERSE CO
LEELANAU COGRAND TRAVERSE CO
NorthportNorthport
SuttonsBay
SuttonsBay
Traverse City
Traverse City
ElkRapids
ElkRapids
KingsleyKingsley
KalkaskaKalkaska
MancelonaMancelona
BellaireBellaire
CentralLake
CentralLake
EllsworthEllsworthEast
JordanEast
Jordan
BoyneCity
BoyneCity
FifeLakeFifeLake
BoyneFalls
BoyneFalls
GaylordGaylord
ElkLake
TorchLake
LakeLeelanau
LongLakeLongLake
DuckLake
GreenLake
GreenLake
LakeLeelanau
LakeLeelanau
OtsegoLake
OtsegoLake
LakeCharlevoix
LakeCharlevoix
SouthArm
SouthArm
LakeBellaire
ManisteeLake
ManisteeLake
IntermediateLake
LakeSkegemog
Manistee Rive
r
Manistee Rive
r
Rapid River
Jordan River
Jordan River
N. Br. Boardman Rive
r
SpiderLake
Boardma n River
GARFIELD
BANKS
KALKASKA
STAR
ECHO
BLAIR UNION
MANCELONA
MILTON
ELMIRA
PARADISE
CUSTER
EAST BAY
JORDAN
ACME
WHITEWATER
ORANGE
WARNERLEELANAU
KEARNEY
EXCELSIOR
BOARDMAN
SOUTH ARM
CHESTONIA
LONG LAKE
MAYFIELD
GREEN LAKE
HELENA
GARFIELD
RAPID RIVER
BINGHAM
FIFE LAKE
PENINSULA
COLD SPRINGSCLEAR WATER
FOREST HOME
MARION
CENTRAL LAKE
ELMWOOD
SPRINGFIELD
SUTTONS BAY
TORCH LAKE
NORWOOD
ELK RAPIDS
0 4 8 122Miles
0 5 10 152.5Kilometers
GRAND TRAVERSE BAY WATERSHEDFIGURE 5: TOWNSHIPS, CITIES, AND VILLAGES
Legend
Lakes & Ponds
Rivers & Streams
Political Boundaries
Grand Traverse Bay Watershed
12/16/03
Map produced by:
24
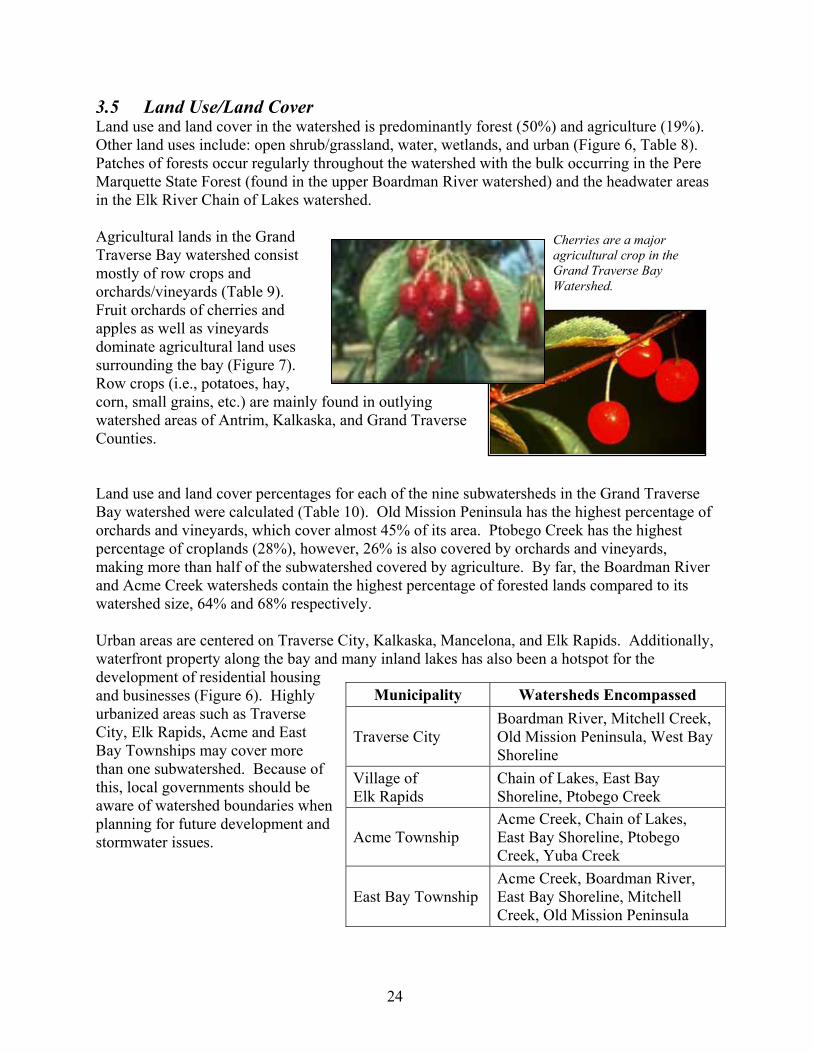
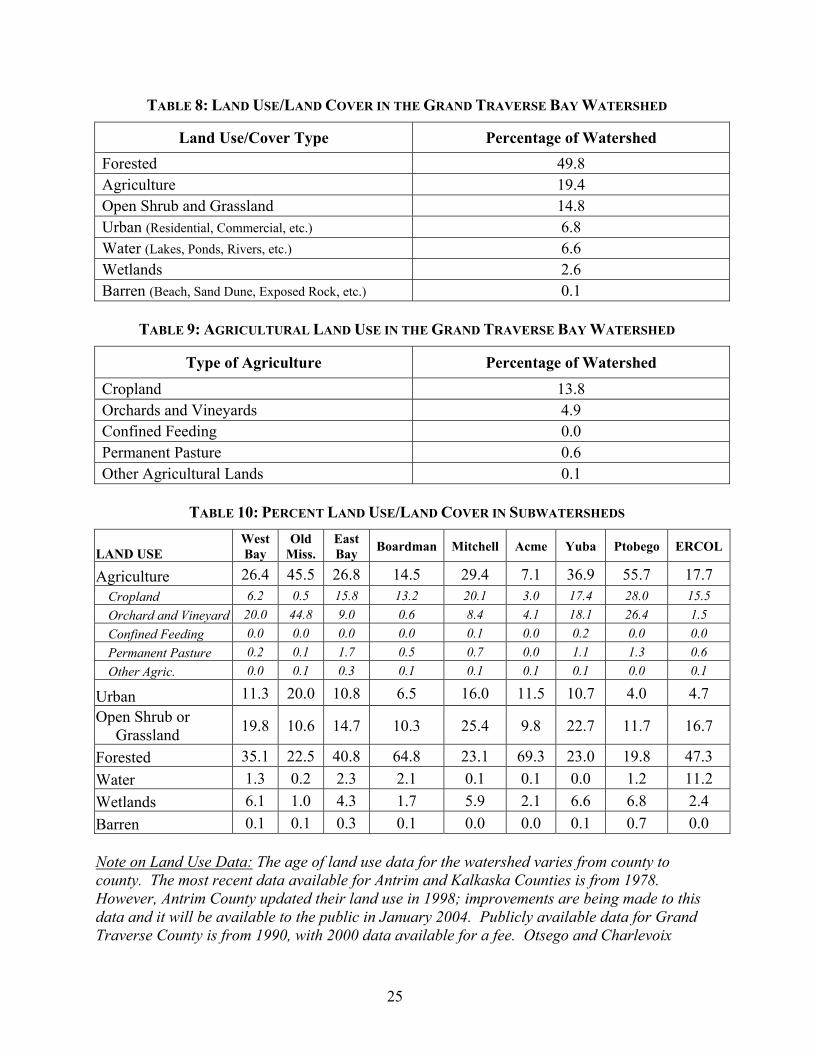
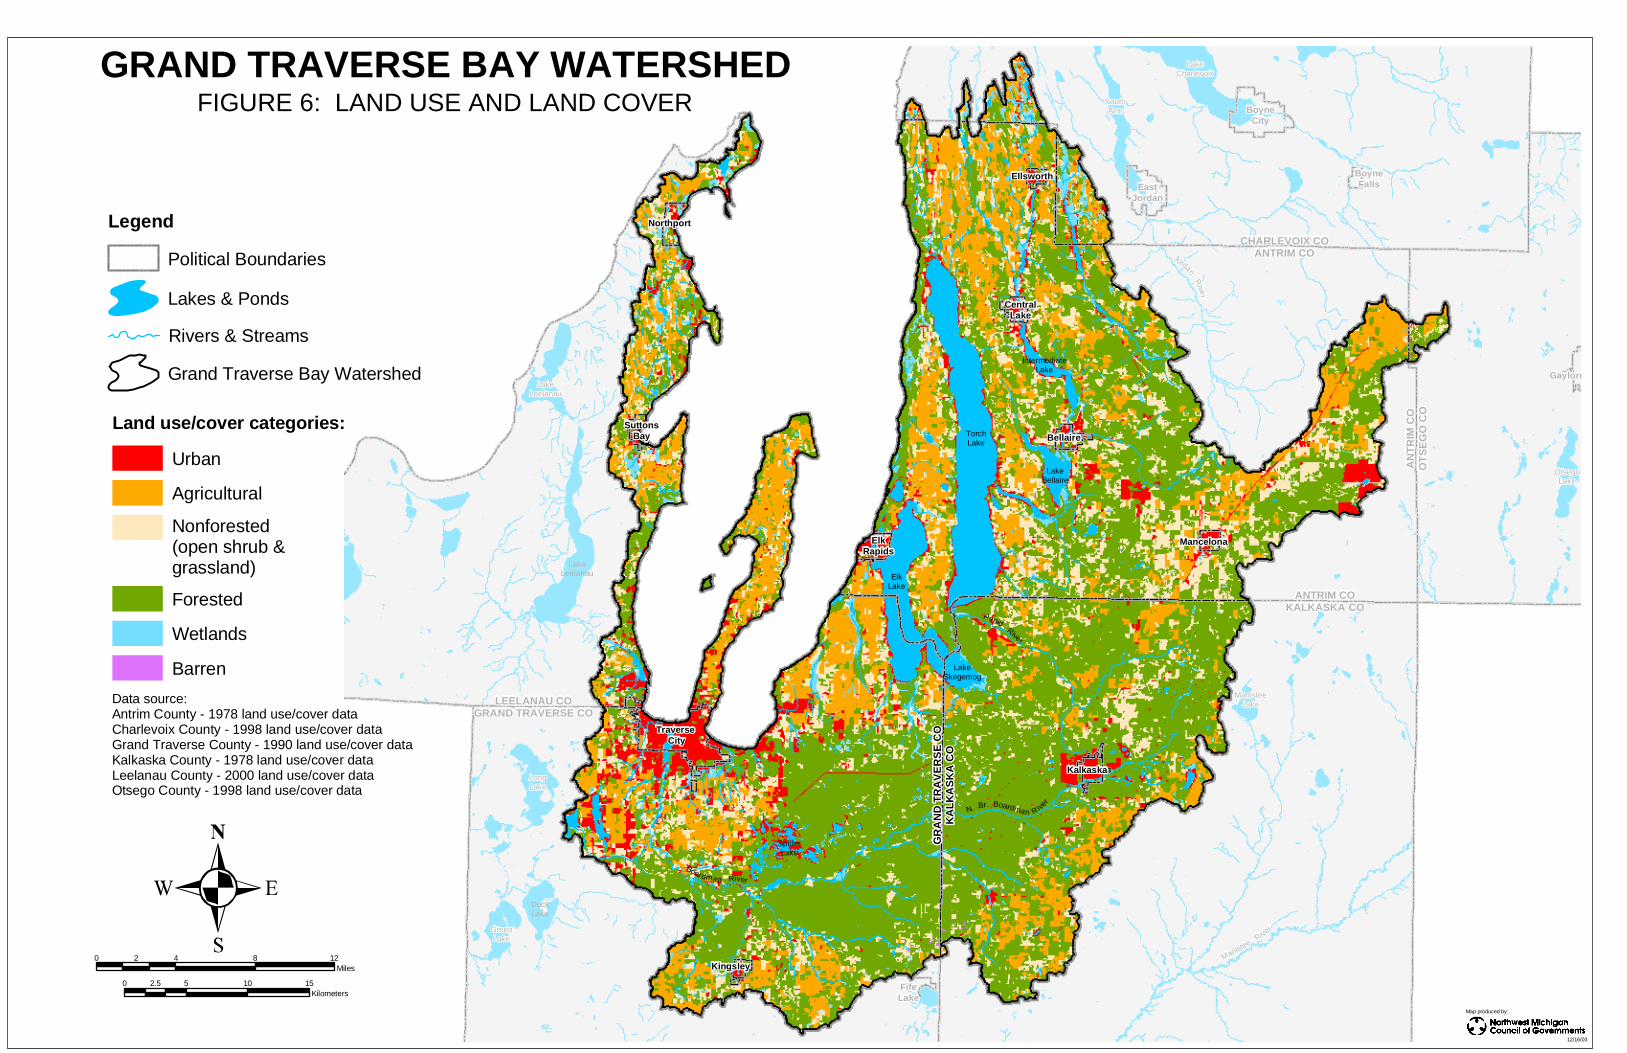
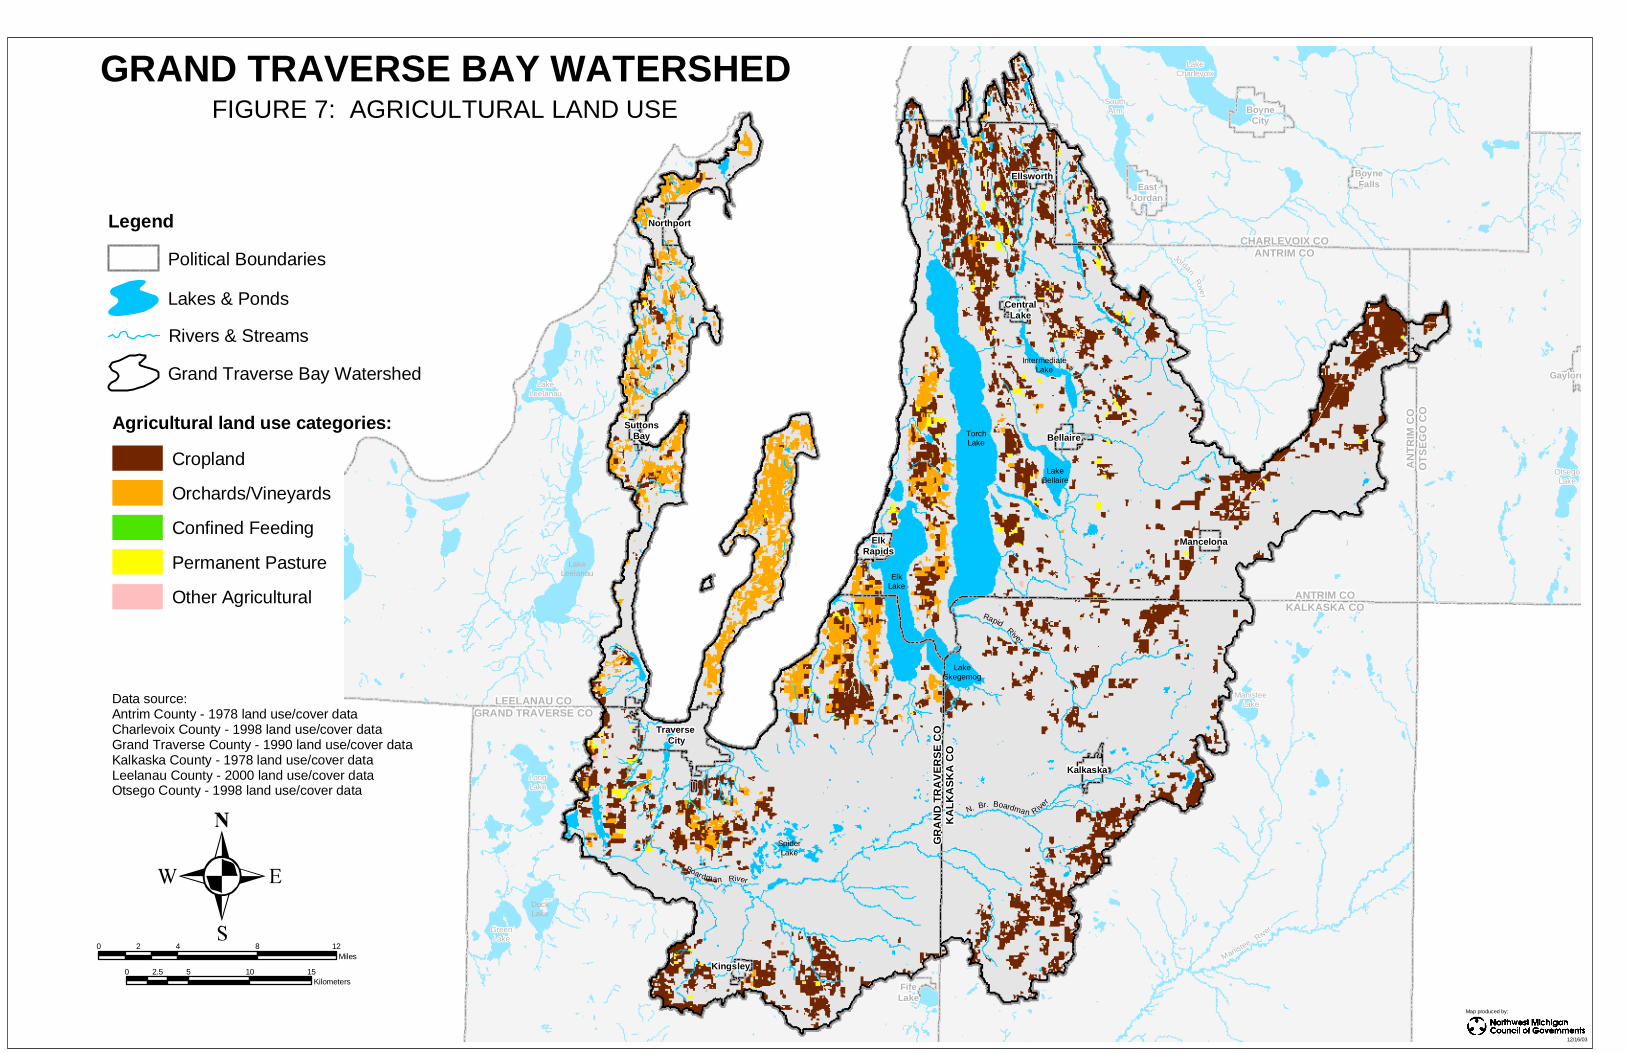
3.5 Land Use/Land Cover Land use and land cover in the watershed is predominantly forest (50%) and agriculture (19%). Other land uses include: open shrub/grassland, water, wetlands, and urban (Figure 6, Table 8). Patches of forests occur regularly throughout the watershed with the bulk occurring in the Pere Marquette State Forest (found in the upper Boardman River watershed) and the headwater areas in the Elk River Chain of Lakes watershed. Agricultural lands in the Grand Traverse Bay watershed consist mostly of row crops and orchards/vineyards (Table 9). Fruit orchards of cherries and apples as well as vineyards dominate agricultural land uses surrounding the bay (Figure 7). Row crops (i.e., potatoes, hay, corn, small grains, etc.) are mainly found in outlying watershed areas of Antrim, Kalkaska, and Grand Traverse Counties. Land use and land cover percentages for each of the nine subwatersheds in the Grand Traverse Bay watershed were calculated (Table 10). Old Mission Peninsula has the highest percentage of orchards and vineyards, which cover almost 45% of its area. Ptobego Creek has the highest percentage of croplands (28%), however, 26% is also covered by orchards and vineyards, making more than half of the subwatershed covered by agriculture. By far, the Boardman River and Acme Creek watersheds contain the highest percentage of forested lands compared to its watershed size, 64% and 68% respectively. Urban areas are centered on Traverse City, Kalkaska, Mancelona, and Elk Rapids. Additionally, waterfront property along the bay and many inland lakes has also been a hotspot for the development of residential housing and businesses (Figure 6). Highly urbanized areas such as Traverse City, Elk Rapids, Acme and East Bay Townships may cover more than one subwatershed. Because of this, local governments should be aware of watershed boundaries when planning for future development and stormwater issues.
Municipality Watersheds Encompassed
Traverse City Boardman River, Mitchell Creek, Old Mission Peninsula, West Bay Shoreline
Village of Elk Rapids
Chain of Lakes, East Bay Shoreline, Ptobego Creek
Acme Township Acme Creek, Chain of Lakes, East Bay Shoreline, Ptobego Creek, Yuba Creek
East Bay Township Acme Creek, Boardman River, East Bay Shoreline, Mitchell Creek, Old Mission Peninsula
Cherries are a major agricultural crop in the Grand Traverse Bay Watershed.
25
TABLE 8: LAND USE/LAND COVER IN THE GRAND TRAVERSE BAY WATERSHED
Land Use/Cover Type Percentage of Watershed Forested 49.8 Agriculture 19.4 Open Shrub and Grassland 14.8 Urban (Residential, Commercial, etc.) 6.8 Water (Lakes, Ponds, Rivers, etc.) 6.6 Wetlands 2.6 Barren (Beach, Sand Dune, Exposed Rock, etc.) 0.1
TABLE 9: AGRICULTURAL LAND USE IN THE GRAND TRAVERSE BAY WATERSHED
Type of Agriculture Percentage of Watershed
Cropland 13.8 Orchards and Vineyards 4.9 Confined Feeding 0.0 Permanent Pasture 0.6 Other Agricultural Lands 0.1
TABLE 10: PERCENT LAND USE/LAND COVER IN SUBWATERSHEDS
LAND USE West Bay
Old Miss.
East Bay Boardman Mitchell Acme Yuba Ptobego ERCOL
Forested 35.1 22.5 40.8 64.8 23.1 69.3 23.0 19.8 47.3 Water 1.3 0.2 2.3 2.1 0.1 0.1 0.0 1.2 11.2 Wetlands 6.1 1.0 4.3 1.7 5.9 2.1 6.6 6.8 2.4 Barren 0.1 0.1 0.3 0.1 0.0 0.0 0.1 0.7 0.0 Note on Land Use Data: The age of land use data for the watershed varies from county to county. The most recent data available for Antrim and Kalkaska Counties is from 1978. However, Antrim County updated their land use in 1998; improvements are being made to this data and it will be available to the public in January 2004. Publicly available data for Grand Traverse County is from 1990, with 2000 data available for a fee. Otsego and Charlevoix
26
Counties have data from 1998, and Leelanau County has data as recent as 2000. Since the age of land use data varies so much, it is important to note that the land use percentages in the above tables may be slightly different from what is actually seen on the ground today. For example, some of the agricultural land may now be fallow and some agricultural and forested lands may now be developed.
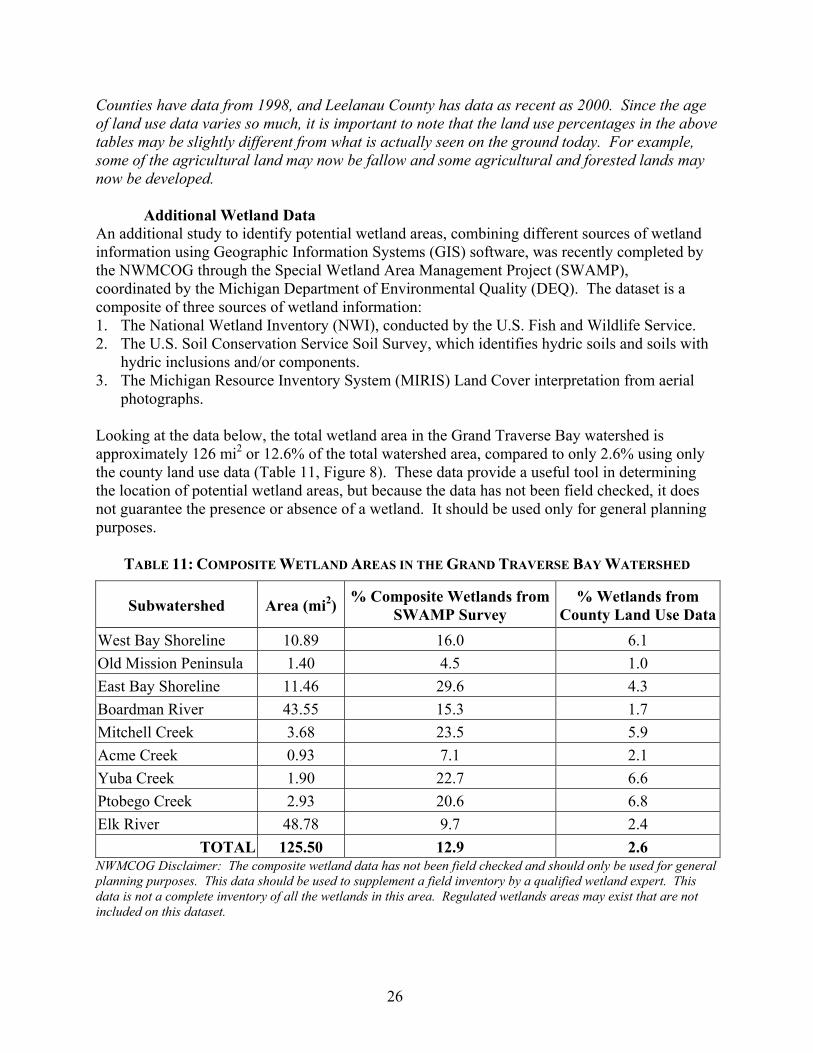
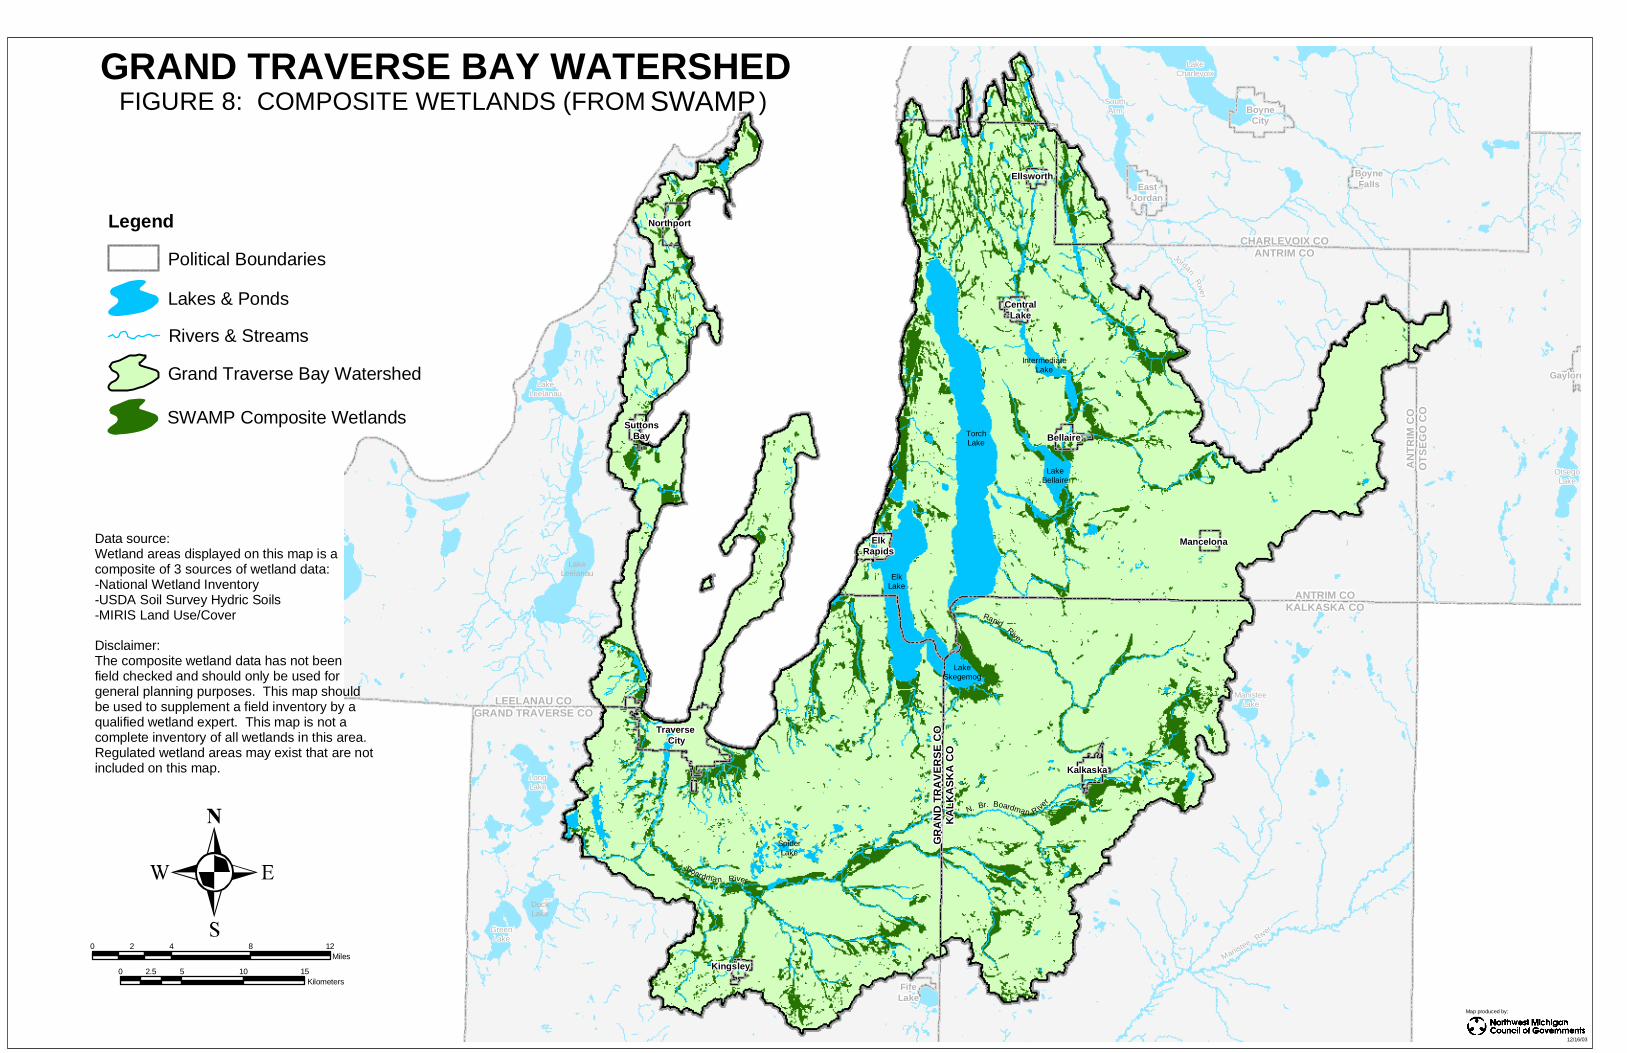
Additional Wetland Data An additional study to identify potential wetland areas, combining different sources of wetland information using Geographic Information Systems (GIS) software, was recently completed by the NWMCOG through the Special Wetland Area Management Project (SWAMP), coordinated by the Michigan Department of Environmental Quality (DEQ). The dataset is a composite of three sources of wetland information: 1. The National Wetland Inventory (NWI), conducted by the U.S. Fish and Wildlife Service. 2. The U.S. Soil Conservation Service Soil Survey, which identifies hydric soils and soils with
hydric inclusions and/or components. 3. The Michigan Resource Inventory System (MIRIS) Land Cover interpretation from aerial
photographs. Looking at the data below, the total wetland area in the Grand Traverse Bay watershed is approximately 126 mi2 or 12.6% of the total watershed area, compared to only 2.6% using only the county land use data (Table 11, Figure 8). These data provide a useful tool in determining the location of potential wetland areas, but because the data has not been field checked, it does not guarantee the presence or absence of a wetland. It should be used only for general planning purposes.
TABLE 11: COMPOSITE WETLAND AREAS IN THE GRAND TRAVERSE BAY WATERSHED
Subwatershed Area (mi2) % Composite Wetlands from SWAMP Survey
% Wetlands from County Land Use Data
West Bay Shoreline 10.89 16.0 6.1 Old Mission Peninsula 1.40 4.5 1.0 East Bay Shoreline 11.46 29.6 4.3 Boardman River 43.55 15.3 1.7 Mitchell Creek 3.68 23.5 5.9 Acme Creek 0.93 7.1 2.1 Yuba Creek 1.90 22.7 6.6 Ptobego Creek 2.93 20.6 6.8 Elk River 48.78 9.7 2.4
TOTAL 125.50 12.9 2.6 NWMCOG Disclaimer: The composite wetland data has not been field checked and should only be used for general planning purposes. This data should be used to supplement a field inventory by a qualified wetland expert. This data is not a complete inventory of all the wetlands in this area. Regulated wetlands areas may exist that are not included on this dataset.
CHARLEVOIX COANTRIM CO
CHARLEVOIX COANTRIM CO
ANTRIM COKALKASKA CO
ANTRIM COKALKASKA CO
AN
TR
IM C
OO
TS
EG
O C
OA
NT
RIM
CO
OT
SE
GO
CO
GR
AN
D T
RA
VE
RS
E C
OK
AL
KA
SK
A C
OG
RA
ND
TR
AV
ER
SE
CO
KA
LK
AS
KA
CO
LEELANAU COGRAND TRAVERSE CO
LEELANAU COGRAND TRAVERSE CO
NorthportNorthport
SuttonsBay
SuttonsBay
Traverse City
Traverse City
ElkRapids
ElkRapids
KingsleyKingsley
KalkaskaKalkaska
MancelonaMancelona
BellaireBellaire
CentralLake
CentralLake
EllsworthEllsworthEast
JordanEast
Jordan
BoyneCity
BoyneCity
FifeLakeFifeLake
BoyneFalls
BoyneFalls
GaylordGaylord
ElkLake
TorchLake
LakeLeelanau
LongLakeLongLake
DuckLake
GreenLake
GreenLake
LakeLeelanau
LakeLeelanau
OtsegoLake
OtsegoLake
LakeCharlevoix
LakeCharlevoix
SouthArm
SouthArm
LakeBellaire
ManisteeLake
ManisteeLake
IntermediateLake
LakeSkegemog
Manistee Rive
r
Manistee Rive
r
Rapid River
Jordan River
Jordan River
N. Br. Boardman Rive
r
SpiderLake
Boardma n River
0 4 8 122Miles
0 5 10 152.5Kilometers
GRAND TRAVERSE BAY WATERSHEDFIGURE 6: LAND USE AND LAND COVER
Data source: Antrim County - 1978 land use/cover dataCharlevoix County - 1998 land use/cover dataGrand Traverse County - 1990 land use/cover dataKalkaska County - 1978 land use/cover dataLeelanau County - 2000 land use/cover dataOtsego County - 1998 land use/cover data
Legend
Lakes & Ponds
Rivers & Streams
Political Boundaries
Grand Traverse Bay Watershed
Land use/cover categories:
Urban
Agricultural
Nonforested (open shrub & grassland)
Forested
Wetlands
Barren
12/16/03
Map produced by:
CHARLEVOIX COANTRIM CO
CHARLEVOIX COANTRIM CO
ANTRIM COKALKASKA CO
ANTRIM COKALKASKA CO
AN
TR
IM C
OO
TS
EG
O C
OA
NT
RIM
CO
OT
SE
GO
CO
GR
AN
D T
RA
VE
RS
E C
OK
AL
KA
SK
A C
OG
RA
ND
TR
AV
ER
SE
CO
KA
LK
AS
KA
CO
LEELANAU COGRAND TRAVERSE CO
LEELANAU COGRAND TRAVERSE CO
NorthportNorthport
SuttonsBay
SuttonsBay
Traverse City
Traverse City
ElkRapids
ElkRapids
KingsleyKingsley
KalkaskaKalkaska
MancelonaMancelona
BellaireBellaire
CentralLake
CentralLake
EllsworthEllsworthEast
JordanEast
Jordan
BoyneCity
BoyneCity
FifeLakeFifeLake
BoyneFalls
BoyneFalls
GaylordGaylord
ElkLake
TorchLake
LakeLeelanau
LongLakeLongLake
DuckLake
GreenLake
GreenLake
LakeLeelanau
LakeLeelanau
OtsegoLake
OtsegoLake
LakeCharlevoix
LakeCharlevoix
SouthArm
SouthArm
LakeBellaire
ManisteeLake
ManisteeLake
IntermediateLake
LakeSkegemog
Manistee Rive
r
Manistee Rive
r
Rapid River
Jordan River
Jordan River
N. Br. Boardman Rive
r
SpiderLake
Boardma n River
0 4 8 122Miles
0 5 10 152.5Kilometers
GRAND TRAVERSE BAY WATERSHEDFIGURE 7: AGRICULTURAL LAND USE
Data source: Antrim County - 1978 land use/cover dataCharlevoix County - 1998 land use/cover dataGrand Traverse County - 1990 land use/cover dataKalkaska County - 1978 land use/cover dataLeelanau County - 2000 land use/cover dataOtsego County - 1998 land use/cover data
Legend
Lakes & Ponds
Rivers & Streams
Political Boundaries
Grand Traverse Bay Watershed
Agricultural land use categories:
Cropland
Orchards/Vineyards
Confined Feeding
Permanent Pasture
Other Agricultural
12/16/03
Map produced by:
CHARLEVOIX COANTRIM CO
CHARLEVOIX COANTRIM CO
ANTRIM COKALKASKA CO
ANTRIM COKALKASKA CO
AN
TR
IM C
OO
TS
EG
O C
OA
NT
RIM
CO
OT
SE
GO
CO
GR
AN
D T
RA
VE
RS
E C
OK
AL
KA
SK
A C
OG
RA
ND
TR
AV
ER
SE
CO
KA
LK
AS
KA
CO
LEELANAU COGRAND TRAVERSE CO
LEELANAU COGRAND TRAVERSE CO
NorthportNorthport
SuttonsBay
SuttonsBay
Traverse City
Traverse City
ElkRapids
ElkRapids
KingsleyKingsley
KalkaskaKalkaska
MancelonaMancelona
BellaireBellaire
CentralLake
CentralLake
EllsworthEllsworthEast
JordanEast
Jordan
BoyneCity
BoyneCity
FifeLakeFifeLake
BoyneFalls
BoyneFalls
GaylordGaylord
ElkLake
TorchLake
LakeLeelanau
LongLakeLongLake
DuckLake
GreenLake
GreenLake
LakeLeelanau
LakeLeelanau
OtsegoLake
OtsegoLake
LakeCharlevoix
LakeCharlevoix
SouthArm
SouthArm
LakeBellaire
ManisteeLake
ManisteeLake
IntermediateLake
LakeSkegemog
Manistee Rive
r
Manistee Rive
r
Rapid River
Jordan River
Jordan River
N. Br. Boardman Rive
r
SpiderLake
Boardma n River
0 4 8 122Miles
0 5 10 152.5Kilometers
GRAND TRAVERSE BAY WATERSHED
Data source: Wetland areas displayed on this map is a composite of 3 sources of wetland data:-National Wetland Inventory-USDA Soil Survey Hydric Soils-MIRIS Land Use/Cover
Disclaimer:The composite wetland data has not beenfield checked and should only be used forgeneral planning purposes. This map shouldbe used to supplement a field inventory by aqualified wetland expert. This map is not acomplete inventory of all wetlands in this area.Regulated wetland areas may exist that are notincluded on this map.
Legend
Lakes & Ponds
Rivers & Streams
Political Boundaries
Grand Traverse Bay Watershed
SWAMP Composite Wetlands
12/16/03
Map produced by:
FIGURE 8: COMPOSITE WETLANDS (FROM )SWAMP
30
History of Land Use in the Grand Traverse Region: (Excerpted portions from The Watershed Center’s “State of the Bay 2000 CD Resource Guide.”) The land known today as the Grand Traverse region began to be settled by Europeans in the mid-19th century. The new settlers joined the Ojibwa (also referred to as Chippewa, an English mispronunciation) and Ottawa (pronounced O-dah-wah) who made this land their home for generations prior, subsisting on hunting, fishing, gathering wild foods, and raising crops such as beans, corn, and squash. The opening of the Erie Canal in 1825 between Albany and Buffalo created a new water highway, making the largely undeveloped lands of Michigan accessible to those traveling along the all-water route between Buffalo and Chicago. The new settlers of the region found wealth in the land's virgin forests. Ancient forests of white pine, white cedar, maple, beech, and hemlock were cut, taken to sawmills, and then used for construction, tools, barrels, and fuel. Hardwoods were also used for processing steel. Fueling
docks were established along the region's shoreline to supply passing steamships with wood for fuel. The forest products industry dominated the region's economy until the turn of the century, when it became
apparent that the logging industry could not be sustained at its previous levels.
The abundance of fish in the waters of Lake Michigan and the inland lakes provided an important source of food both for the Native American and pioneer settlers. The Native peoples fished using fiber nets, spears and hooks. Offshore shoals were spawning grounds for lake trout and whitefish in the spring and sturgeon and northern pike in the fall. In the warmer waters of the inland lakes were yellow perch, largemouth and smallmouth bass, and northern pike. Later, residents harvested these fish for everyday use and later caught and exported lake trout and whitefish to cities in the east. Commercial fishing was one of the region's first industries, and sport fishing became a popular pastime of residents and visitors.
Photo Courtesy of the Leelanau Historical Museum
Photos courtesy of the Leelanau Historical Museum and Grand Traverse Pioneer & Historical Society
31
Agriculture began as an industry in the Grand Traverse Region in the late 1800s. Over the years, the major crops have included potatoes and a wide variety of fruits including apples, cherries, peaches, raspberries, cranberries, and more recently, grapes for wine.
Food processing developed around the region's crops; Hannah Lay & Co. established a grist mill on the Boardman River, canning factories were needed for the cherry harvest, and apples were turned into cider, juice, jelly, and butter.
Photos Courtesy of the Grand Traverse Pioneer and Historical Society
Photos Courtesy of the Grand Traverse Pioneer & Historical Society
32
3.6 Geology, Soils, and Topography The watershed has a rich and complex geologic history. During the last glacial advance, glaciers carved deep valleys into the shale and limestone bedrock and deposited enormous sediment accumulations, some as thick as 1197 feet. Sediment characteristics vary widely throughout the watershed, in some areas changing from thick, lacustrine clay to a coarse grained moraine within a hundred meters (Boutt et al. 2001). Predominant soils in the watershed are sandy. Bedrock geology formations include Antrim Shale, Berea Sandstone, Ellsworth Shale, Traverse Group, and many others (Figure 9a). Glacial topology ranges from broad and pitted outwash plains to moraine ridges with kettle lakes and flat lake plains (Figure 9b). Elevation in the watershed ranges from a low of 484 feet above sea level to a high of 1,543 feet above sea level (Figure 10). Both the highest and steepest sections of the watershed are located in the headwater areas of the Elk River Chain of Lakes and Boardman River. The following text and drawings illustrate the geological history of the Grand Traverse Bay Region and are excerpted from “The Glacial Lakes Around Michigan” by R.W. Kelley and W.R. Farrand (Kelley and Farrand 1967) and The Watershed Center’s “State of the Bay 2000 CD Resource Guide.”
Grand Traverse Bay was formed by Pleistocene glaciers that moved across Michigan, covering the land one mile thick in places.
When the last of the glaciers retreated, water filled the valley left by the glaciers…
…forming the Great Lakes and the Grand Traverse Bay.
CHARLEVOIX COANTRIM CO
CHARLEVOIX COANTRIM CO
ANTRIM COKALKASKA CO
ANTRIM COKALKASKA CO
AN
TR
IM C
OO
TS
EG
O C
OA
NT
RIM
CO
OT
SE
GO
CO
GR
AN
D T
RA
VE
RS
E C
OK
AL
KA
SK
A C
OG
RA
ND
TR
AV
ER
SE
CO
KA
LK
AS
KA
CO
LEELANAU COGRAND TRAVERSE CO
LEELANAU COGRAND TRAVERSE CO
NorthportNorthport
SuttonsBay
SuttonsBay
Traverse City
Traverse City
ElkRapids
ElkRapids
KingsleyKingsley
KalkaskaKalkaska
MancelonaMancelona
BellaireBellaire
CentralLake
CentralLake
EllsworthEllsworthEast
JordanEast
Jordan
BoyneCity
BoyneCity
FifeLakeFifeLake
BoyneFalls
BoyneFalls
GaylordGaylord
ElkLake
TorchLake
LakeLeelanau
LongLakeLongLake
DuckLake
GreenLake
GreenLake
LakeLeelanau
LakeLeelanau
OtsegoLake
OtsegoLake
LakeCharlevoix
LakeCharlevoix
SouthArm
SouthArm
LakeBellaire
ManisteeLake
ManisteeLake
IntermediateLake
LakeSkegemog
Manistee Rive
r
Manistee Rive
r
Rapid River
Jordan River
Jordan River
N. Br. Boardman Rive
r
SpiderLake
Boardma n River
0 4 8 122Miles
0 5 10 152.5Kilometers
GRAND TRAVERSE BAY WATERSHEDFIGURE 9A: BEDROCK GEOLOGY
Legend
Lakes & Ponds
Rivers & Streams
Political Boundaries
Grand Traverse Bay Watershed
Bedrock Formation:
Berea Sandstone
Coldwater Shale
Ellsworth Shale
Marshall Formation
Sunbury Shale
Traverse Group
Antrim Shale
Michigan Formation
Data source: MDEQ Geological Survey Division (1987)
12/16/03
Map produced by:
CHARLEVOIX COANTRIM CO
CHARLEVOIX COANTRIM CO
ANTRIM COKALKASKA CO
ANTRIM COKALKASKA CO
AN
TR
IM C
OO
TS
EG
O C
OA
NT
RIM
CO
OT
SE
GO
CO
GR
AN
D T
RA
VE
RS
E C
OK
AL
KA
SK
A C
OG
RA
ND
TR
AV
ER
SE
CO
KA
LK
AS
KA
CO
LEELANAU COGRAND TRAVERSE CO
LEELANAU COGRAND TRAVERSE CO
NorthportNorthport
SuttonsBay
SuttonsBay
Traverse City
Traverse City
ElkRapids
ElkRapids
KingsleyKingsley
KalkaskaKalkaska
MancelonaMancelona
BellaireBellaire
CentralLake
CentralLake
EllsworthEllsworthEast
JordanEast
Jordan
BoyneCity
BoyneCity
FifeLakeFifeLake
BoyneFalls
BoyneFalls
GaylordGaylord
ElkLake
TorchLake
LakeLeelanau
LongLakeLongLake
DuckLake
GreenLake
GreenLake
LakeLeelanau
LakeLeelanau
OtsegoLake
OtsegoLake
LakeCharlevoix
LakeCharlevoix
SouthArm
SouthArm
LakeBellaire
ManisteeLake
ManisteeLake
IntermediateLake
LakeSkegemog
Manistee Rive
r
Manistee Rive
r
Rapid River
Jordan River
Jordan River
N. Br. Boardman Rive
r
SpiderLake
Boardma n River
0 4 8 122Miles
0 5 10 152.5Kilometers
GRAND TRAVERSE BAY WATERSHEDFIGURE 9B: GLACIAL TOPOLOGY
Data source: Land Type Associations (LTA) ofNorthern Michigan, compiled by the MichiganNatural Features Inventory.
Legend
Lakes & Ponds
Rivers & Streams
Political Boundaries
Grand Traverse Bay Watershed
Broad moraine ridgesor upland drumlin field
Flat moraine or till plain
Large, open dunes
Moraine ridges; few kettle lakes
Moraine ridges; many kettle lakes
Narrow outwash channel
Pitted outwash plain
Flat lake plain
Broad, flat outwash plain
12/16/03
Map produced by:
CHARLEVOIX COANTRIM CO
CHARLEVOIX COANTRIM CO
ANTRIM COKALKASKA CO
ANTRIM COKALKASKA CO
AN
TR
IM C
OO
TS
EG
O C
OA
NT
RIM
CO
OT
SE
GO
CO
GR
AN
D T
RA
VE
RS
E C
OK
AL
KA
SK
A C
OG
RA
ND
TR
AV
ER
SE
CO
KA
LK
AS
KA
CO
LEELANAU COGRAND TRAVERSE CO
LEELANAU COGRAND TRAVERSE CO
NorthportNorthport
SuttonsBay
SuttonsBay
Traverse City
Traverse City
ElkRapids
ElkRapids
KingsleyKingsley
KalkaskaKalkaska
MancelonaMancelona
BellaireBellaire
CentralLake
CentralLake
EllsworthEllsworthEast
JordanEast
Jordan
BoyneCity
BoyneCity
FifeLakeFifeLake
BoyneFalls
BoyneFalls
GaylordGaylord
VanderbiltVanderbilt
ElkLake
TorchLake
LakeLeelanau
LongLake
DuckLake
GreenLake
LakeLeelanau
OtsegoLake
LakeCharlevoix
SouthArm
LakeBellaire
ManisteeLake
IntermediateLake
LakeSkegemog
Manistee Rive
r
Rapid River
Jordan River
N. Br. Boardman Rive
r
SpiderLake
Boardma n River
0 4 8 122Miles
0 4 8 122Kilometers
Data Source: Digital Elevation Model provided by Center for Geographic Information, Michigan Department of Information Technology
High : 1543.3 feet
Low : 484.2 feet
Elevation (above sea level)
GRAND TRAVERSE BAY WATERSHEDFIGURE 10: TOPOLOGY/DIGITAL ELEVATION MODEL
Legend
Lakes & Ponds
Rivers & Streams
Political Boundaries
Grand Traverse Bay Watershed
12/16/03
Map produced by:
36
3.7 Hydrology and Climate The Grand Traverse Bay region receives an average annual rainfall of 42”, of which approximately 16” is recharged to the water table, 20” is evapotranspired, and the other 6” becomes overland flow to streams (Boutt et al. 2001, Holtschlag 1997). The majority of water entering the bay comes from surrounding tributaries, approximately 604 million gallons of water a day. These tributaries carry replacement water, oxygen, and nutrient and provide habitat for waterfowl, insects, and fish spawning. They are also a source of shelter and food for the bay’s inhabitants. Tributaries also carry human-derived wastes such as trace metals, road salts and solvents, excessive nutrients, and wastewater from drains (State of the Bay 2000 CD Resource Guide). The two principal river systems of the Grand Traverse Bay watershed are the Boardman River and the Elk River-Chain of Lakes. The Elk River delivers 60% of the surface flow to the bay, and the Boardman delivers 30%. The remaining 10% of surface water flow to Grand Traverse Bay comes from other small tributaries draining directly to the bay. Most of the rainfall and snowmelt falling on watershed lands seeps into the soil and recharges the groundwater. This groundwater flows into rivers, lakes and streams, which then flow to the bay. A smaller portion of the groundwater flows go directly into the bay in the form of seeps (about 7% of the total discharge of water to the bay) (State of the Bay 2000). Of all the water entering the bay annually, 35% is from rain or snowfall, 60% is from tributaries, and the other 5% is from direct groundwater flow (State of the Bay 2000 CD Resource Guide). A total of 373 billion gallons of water leaves Grand Traverse Bay annually. Outflow to Lake Michigan
accounts for 70% of the water leaving the bay, with evaporation taking the remaining 30%. On average, twenty-six inches of water evaporate from the bay’s surface area each year (State of the Bay 2000 CD Resource Guide). The exchange of water between Grand Traverse Bay and Lake Michigan is significantly influenced by the presence of a sill along the bottom of the bay at its northern extent, which averages approximately 15 meters in depth. The presence of this sill generates a large gyre (ring-like system of currents), which rotates in the northeastern portion of the bay and impedes water exchange with Lake Michigan (Johnson 1975).
Inflow of Water to Grand Traverse Bay
Outflow of Water from Grand Traverse Bay
37
The primary site of water exchange between the bay and Lake Michigan is at the western edge of the sill, where there is an approximately 43 meter deep trench in the sill. Circulation within the bay is reduced at the southern ends of each arm (GLEC 2005).
Discharge/Flow Discharge measurements are not readily available on a watershed wide scale. Baseflow discharge values were obtained by extrapolating and making some simple assumptions using actual measured historical data taken at various locations throughout the watershed. The major assumption is that flow (discharge) throughout the Grand Traverse Bay watershed is proportional on a per unit area basis. This means that the ratio of flow to watershed area at any point along the stream is a constant. Therefore (where Q = discharge and A = drainage area):
Qx/Ax = constant (k) and Qx = Axk It is important to note that these are extrapolated baseflow measurements that do not take into account storm flow events or spring runoff. Further in-depth hydrologic studies are needed to determine specific stream flows and discharges throughout the watershed. Table 12 lists known measured flow values for various streams throughout the watershed taken over the past 30 years. The average k value for all data was 1.13. Table 13 uses this value and lists estimated discharges for each subwatershed in the Grand Traverse Bay watershed. It is noted that the Old Mission Peninsula and East Bay Shoreline and Tributaries subwatersheds have no significant tributaries, and therefore, even though they comprise about 70 mi2 of watershed area, discharge values were not calculated for them. Additionally, it has long been noted that the Elk River Chain of Lakes accounts for approximately 60% of the discharge to the bay and the Boardman River accounts for 30%. The values in Table 13 support this.
TABLE 12: CONSTANT (K) VALUES FOR DISCHARGE MEASURED DRAINAGE AREAS
Basin Area (mi2)
Measured Flows (cfs)
Constant (k)
Elk River Chain of Lakes (State of the Bay) 502.6 582 1.16Elk River Chain of Lakes (ERCOL Plan) 502.6 669 1.33Elk River Chain of Lakes (Sea Grant) 490.35 567.98 1.16Boardman River (State of the Bay) 283.8 295 1.04Boardman River (Sea Grant) 278.77 294.88 1.06Boardman River (USGS Gauge above Brown Bridge) 141 138.4 0.98Mitchell Creek (NPS Pollution Study) 15.7 18.6 1.18Mitchell Creek (Sea Grant) 14 16.76 1.20Acme Creek (Planning Project) 13.2 13.9 1.05Acme Creek (Sea Grant) 13.01 14.54 1.12Yuba Creek (Sea Grant) 8.19 9.12 1.11GT Bay Watershed (State of the Bay) 976 935.3 0.96
Average k 1.13Flow Data Sources
• Acme Creek Watershed Planning Project – April/May 1995 (GTCDC June 1995) • Elk River Chain of Lakes Clean Lakes Phase I Diagnostic Feasibility Study – April 1990 - March 1991
(Bednarz 1993)
38
• Final Report: Mitchell Creek Watershed Non-point Source Pollution Study – 1990/91 (GCA & GLEC 1991)
• The Limnology of Grand Traverse Bay - MI Sea Grant 1976 (Auer et. al 1975) • State of the Bay 1998 • USGS Gauging Station February 2004 - February 2005 Data for Boardman River above Brown Bridge
(USGS 2005)
TABLE 13: DISCHARGE MEASUREMENTS BY SUBWATERSHED
Subwatershed Area (mi2) Estimated Flow (cfs) *using k=1.13
% of Total Discharge to Bay
Elk River Chain of Lakes 502.6 567.9 55.5 Boardman River 283.8 320.7 31.3 West Bay Shoreline and Tributaries 68 76.8 7.5
East Bay Shoreline and Tributaries* 38.8 -- --
Old Mission Peninsula* 31.3 -- -- Mitchell Creek 15.7 17.7 1.7 Ptobego Creek 14.2 16.0 1.6 Acme Creek 13.2 14.9 1.5 Yuba Creek 8.4 9.5 0.9
Total 976 1023.7 100*There are no significant tributaries in these two subwatersheds and surface water discharge to the Bay is negligible. Most of the precipitation getting to the Bay from these subwatersheds is from groundwater.
Groundwater Data from a study by MSU and USGS to model the impacts of land use changes on the region’s water quality indicate that modeled hydraulic heads, which denote where the groundwater table is, in the watershed vary from 177 meters above sea level along the Grand Traverse Bay to more than 350 meters above sea level in the eastern high topography area (Pijanowski et al. 2001, Boutt et al. 2001). The Boardman River southeast of Traverse City is noted as a dominant groundwater discharge area due to the significant slopes of the water table in the region (Boutt et al. 2001). The study also demonstrates that groundwater processes have a major role in the hydrology within the watershed and that there is a considerable legacy of land use on surface water quality. For example, the model demonstrates that “solutes that are applied to portions of the watershed will likely take over 50 years to move through the shallow groundwater, thus current human activities will have an impact on water quality for several decades to come,” (State of the Bay 2000). Additionally, research from MSU show that modeled data from road salt application (using chlorides as tracers) can have a considerable temporal impact across the Grand Traverse Bay watershed; even after a fifty-year simulation, chloride only travels 40-50 miles. In some cases, the temporal legacy of land use can exceed 100 years (Pijanowski et al. 2001, Boutt et al. 2001).
39
10 years
0 50 100 Concentration (mg/l)
90 years
Chloride concentrations across the watershed based on halite application to roads and dispersed through the groundwater system. These maps represent a computer model simulation of groundwater chloride concentration for a scenario where 100 mg/L of chloride (through road salt) is applied to the major highways across the Grand Traverse Bay region at a constant rate over the 90 year simulation period. Figure courtesy of David Hyndman, Michigan State University
40
How does hydrology affect aquatic life in the watershed?
The hydrology of a river system, which is mainly determined by soils, geology, and land use, is a critical physical factor to aquatic life (O’Neal 1997). In streams where groundwater is the principal water source, stable flow patterns occur, characterized by low seasonal and daily fluctuations in discharge. Stable flows promote stable habitat for aquatic life in the form of diverse bottom substrates, secure in-stream cover, and moderate water velocities and temperatures. Unstable water flow patterns occur in streams with high contributions of surface water runoff and are characterized by high seasonal and daily fluctuations in discharge. During periods of heavy rain or snow melt, flows increase quickly and to high levels, which then lead to increases in water velocities and streambank erosion, the removal of in-stream cover, and decreased bottom substrate diversity due to scouring. Additionally, during drought conditions, excessively low flows occur that cause extremes in water temperatures and expose and reduce in-stream cover and bottom substrates. Some factors contributing to increases in stream flow are urban and agricultural land development, logging, drains and irrigation, water discharges, hydroelectric dams, and lake-level control structures.
The stream pictured here has downcut several feet in elevation because of increased stormwater flow. In this case, the forested wetland in the floodplain is now hydraulically disconnected from the stream that sustained it. Photo Copyright 1999, Center for Watershed Protection
Aquatic insects such as mayflies (above) and caddisflies (below)
depend on stable flows, high water quality, and sufficient in-
stream habitat for survival.
41
3.8 Economy, Tourism, and Recreation Traditional uses of watershed resources have included agriculture, tourism and recreation. Cherries and other fruit crops dominate agricultural production in the Traverse Bay region, and are harvested for the global market. Northwestern Michigan, also known as the Cherry Capital of the World, produces half the state’s tart cherry crop and more than 80% of its sweet cherries. The National Cherry Festival in Traverse City attracts more than 500,000 participants each year who celebrate the harvest and revel with festivities over an eight-day period each summer. Other tourism and recreational activities include: boating, biking, swimming, golfing, fishing, camping, and skiing. Attracted to the natural beauty of Grand Traverse Bay and its surroundings, tourists from around the world come to enjoy the pleasures of the region, away from the busy rush of more urban areas. These recreational opportunities can be quite profitable for businesses like marinas, rental shops (for activities such as water recreation, biking, and skiing), ski resorts, golf resorts, hotels, restaurants, and bed and breakfasts. The area also supports a thriving regional business community representing many economic sectors including banking, healthcare, retail, light industry and others. While many tourists come to the Grand Traverse Bay watershed to recreate, there are also year-round residents who benefit from the many recreational opportunities the bay and watershed offer. A public telephone survey conducted in Summer 2002 revealed that more than 1/3 of residents in the region use the Grand Traverse Bay as their primary water recreation source. More than half those surveyed use the bay at least a few times a year and at least 1/3 use it monthly. As far as using any type of water body for recreation, almost all of those surveyed indicated that they use water for recreation at the very least a few times per year (see chart). The survey found that while more people think the water quality in the Grand Traverse Bay has worsened rather than improved, the bulk of respondents indicated they felt water quality has not
How often have you used water for recreation in the past year?
Weekly54%
Monthly23%
A Few Times22%
Not At All1%
Data taken from 2002 Household Telephone Survey
42
changed at all, nor has it affected recreational use on the bay. More than three quarters of the survey respondents indicated that they felt current water quality conditions in the bay make it safe to both eat the fish and swim. Swimming is by far the recreational activity used by most people living around the bay. Other highly used recreational activities include boating, walking and hiking, fishing and sailing (see chart below).
Recreational Activities People Have Used Most on the Grand Traverse Bay in the Past Year
Fishing
Sailing
Scuba DivingOther
Personal Water Craft
KayakCanoeing
Beach Walking
Power Boating
Swimming
0
20
40
60
80
100
120
140
160
180
Num
ber
of p
eopl
e
Data taken from 2002 Household Telephone Survey
43
3.9 Subwatershed Summaries
Elk River Chain of Lakes The Elk River Chain of Lakes (ERCOL) is the largest subwatershed in the Grand Traverse Bay watershed, spanning an impressive 500 mi2. Villages in the ERCOL include Elk Rapids, Kalkaska, Bellaire, Mancelona, Central Lake, and Ellsworth. The ERCOL is a unique series of 14 interconnected lakes and rivers in Antrim and Kalkaska counties (Figure 11). This ‘Chain of Lakes’ empties into East Grand Traverse Bay through the Elk River in Elk Rapids, providing approximately 60% (Table 13) of the bay’s input of surface water. The ERCOL watershed area has more than 200 streams, with 138 miles as designated trout streams. Of the 500 mi2 of watershed, more than 10% is covered by water. From the uppermost lake in the chain, the waters flow 55 miles and drop 40 feet in elevation on their way to the bay (Fuller 2001). With the exception of two dams, you can travel from Elk Lake all the way up to Beals Lake, which is the headwater area for the Chain of Lakes. The Northwest Michigan Council of Governments (NWMCOG) developed a management plan for the ERCOL watershed in 1989, which the Conservation Resource Alliance updated in July 2001. Water quality threats and concerns identified in the management plan for the watershed include: planning and zoning for development; septic tanks; loss of wetlands, natural areas, and open space; use conflicts; stormwater runoff; erosion and sedimentation; industrial pollution; oil, gas, and brine wells and underground storage tanks; and low and fluctuating water levels in upper Chain of Lakes area. Some of the major conclusions in the plan are that the headwaters are just as important as the more visible lakes and streams, maintaining the natural vegetation and wetlands is important to maintain the quality of the watershed, and that inputs from septics, stormwater, and other chemicals should be reduced (NWMCOG 1989). The ERCOL project’s steering committee has come up with a series of six goals with specific objectives and actions, aimed at preserving, protecting, and enhancing the land and water resources of the watershed (CRA 2001).
Boardman River The Boardman River is the largest tributary to the west arm of Grand Traverse Bay and contributes approximately 30% (Table 13) of the water to the surface water input for the entire bay. Its watershed comprises 284 mi2 and covers portions of Grand Traverse County on the west and Kalkaska County to the east (Figure 12). Urban areas in the Boardman River watershed include Traverse City, Kingsley, and Kalkaska. The Boardman River is a state-designated "Blue Ribbon" trout stream and a state designated Natural River. The Boardman River and its watershed provide immense recreational opportunities in the area; residents and visitors alike inject hundreds of thousands of dollars into the local economy (Largent 1991). More than 60% of the watershed is forested (most of which is located in the Pere Marquette State Forest), with the majority of the remainder being dedicated to agriculture and open space; urban land uses occur in 7% of the watershed (Table 10, Figure 12).
44
The Boardman River watershed has an in-depth management plan written for it, as well as a large, ongoing project by the Grand Traverse Conservation District (GTCD) to "restore, enhance and protect the "Blue Ribbon" integrity of the Boardman River watershed as a recreational resource, rural greenbelt, and economic resource for the use and enjoyment of this and future generations". The Boardman River Restoration and Protection Project was started in 1991 by the GTCD with an erosion inventory of the entire Boardman River watershed. It has since identified nearly 600 erosion sites on the Boardman, 85% the result of human activity. To date, nearly 200 erosion sites have been restored and five sand traps installed. In the future, the GTCD will continue restoration work on the Boardman River as well as conduct educational activities. The following is a collection of excerpts taken from the Boardman River Watershed Management Plan (Largent 1991):
“Michigan Department of Natural Resources (MDNR) Procedure 51 biological surveys conducted from 1993-96 revealed that 54% of the (13) index stations rated "good" and 46% rated only "fair". The experience of many long-term river users indicates that this data reflects a downward trend that has continued for many years. Given the rapid population growth of the area, many are concerned about the further degradation of the River's water quality, aquatic habitat, and other recreational values. “Although most of the Boardman River supports its state designated use as a cold water fishery, the river's productivity was severely impacted by increased sedimentation. Over 600 individual erosion sites were documented throughout the Boardman River watershed. Several potential sites were also noted in the inventory in an attempt to stop a problem before it becomes worse. Also noted within the inventory were the sites that contribute obvious nutrient loading or thermal pollution to the river system. The primary causes of sediment in their order of importance are: streambank erosion (~40%), road/stream crossings (~35%), high flow velocities (~15%), and agricultural activities (~10%). Eighty five (85%) of these sites are either directly, or indirectly, the result of human activity. “Although the primary pollutant of concern in the watershed is sedimentation, there are other pollutants contributing to the overall decline of water quality. Instances of nitrates in private wells are well documented and gas and oil extraction within the watershed has introduced hydrocarbons into ground
Aerial view of Boardman Lake; Grand Traverse Bay can be seen at the top of the photo.
45
Documented erosion site along the Boardman River. Photo courtesy of the Grand Traverse Conservation District
water aquifers. This problem is expected to be widespread but has been only recently discovered. Nearly all residents within the watershed outside of Traverse City rely on groundwater for their domestic water supply.”
Boardman River’s Importance as a Trout Stream As a "Blue Ribbon" trout stream and one of the top ten trout streams in Michigan, the Boardman River system has excellent water quality. However, the Boardman River Watershed Report (1991) indicates that the habitat conducive to good trout production is being threatened by sediment inputs at nearly 600 erosion sites along the river. Gravel important for trout growth and reproduction is being covered up by sand. Gary Marek, Trout Unlimited member and former state chapter president, remembers how the Boardman River, not too long ago, used to
"teem with trout, but not anymore". According to Ralph Hay, MDNR Fisheries Biologist, "if current trends continue the Boardman River will lose its top rate status as a trout stream" (Largent 1991).
“In a report to the MDNR titled "Economic Value of Damages to the Pigeon River" (1988) Theodore Graham-Tomasi noted that the Pigeon River was reduced from a top rate to a second rate trout stream when the Lansing Club Dam was removed too quickly, flushing thousands of tons of sediment downstream. Graham-Tomasi determined that the capitalized value of a "top rate" trout stream is $10,000 per mile, a figure that was upheld in court when the downstream landowners sued. “Doug Jester, MDNR Economist stated that, with a $10,000/mile capitalized value and figuring a 7% discount rate, a one-time expenditure of up to $142,800 per-stream mile could be made for restoration efforts and still result in a positive cost/benefit ratio. “The economic benefit of trout streams is amply demonstrated by Kalkaska County's annual National Trout Festival, which draws nearly 8,000 participants. Unfortunately, the North Branch of the Boardman River, which flows through the heart of the Village of
Photo court
46
Kalkaska, is heavily impacted by human activity. Shifting sands cover up the once exposed and productive cobble substrate threatening the very purpose of the trout festival” (Largent 1991).
Boardman Lake
In addition to a management plan written for the Boardman River watershed, The Watershed Center has compiled a management plan specifically for the Boardman Lake watershed (TWC 2003). Historically, Boardman Lake has received industrial pollution from shoreline facilities. In January 2003, The Watershed Center contracted with Ball Environmental Associates and Great Lakes Environmental Center (GLEC) to research historic data; complete a water quality, macrophyte, and macroinvertebrate assessment; and to inventory the city’s storm drain system to determine the actual watershed boundaries. The study identified and evaluated the physical, biological, and built infrastructure resources of the Boardman Lake watershed for potential impacts to the water quality of Boardman Lake and the lower reaches of the Boardman River. Compilation of data was useful in developing specific recommendations and actions for reducing existing and future threats to pollution for the Boardman Lake watershed. More than half the land use percentage (52%) in the Boardman Lake watershed is comprised of residential, commercial, industrial, or transportation/utility. Based on aerial photo interpretation and computer modeling, impervious surfaces cover almost 25% of the watershed. According to data from the Center for Watershed Protection, water quality degradation is observed at 12-15% impervious surface coverage within a watershed. The Boardman Lake watershed is more than two times this threshold, which is not uncommon for a highly urbanized watershed. Additionally, based on historic aerial photo interpretation, an estimated 36% of the original wetlands in the watershed have been filled (TWC 2003). Some other major findings of the study include:
• 43 sites of environmental contamination exist within the Boardman Lake watershed, of which 29 (67%) were determined to currently represent potential threats to the lake or river.
• Two sediment “hot spots” in Boardman River with petroleum constituent and heavy metal contamination were found in addition to evidence of leachates from a former waste disposal site on the lake.
• Evidence of nutrient and bacterial contamination were found at numerous spots including tributaries and storm drains draining to the watershed.
• An area lacking aquatic life was found on the bottomlands of west Boardman Lake in the nearshore environment approximately 150 yards long and extending 75 yards into the lake.
Specific recommendations and actions for reducing these existing and future threats to pollution for the Boardman Lake watershed are incorporated with general watershed recommendations for protecting water quality throughout the entire Grand Traverse Bay watershed in Chapter 7.
47
Mitchell Creek Mitchell Creek, located at the southern end of East Bay, is the third largest single tributary watershed to the Grand Traverse Bay (Figure 13). Draining approximately 16 mi2 of land, the watershed is principally located in East Bay and Garfield Townships and contains 16 miles of high quality trout stream. From its outlet next to the Traverse City State Park, the Mitchell Creek watershed has a significant portion of its downstream area in an urban setting. Headwater areas in Blair, Garfield and East Bay Townships are mostly agriculture (26%) or forested (31%) and contain steep slopes (Table 10, Figure 13). The middle and lower portions of the watershed are flatter and contain a greater amount of wetland areas. Mitchell Creek is classified as a gaining stream because of significant groundwater contributions to its flow. The watershed is experiencing increased pressure from development and land use in the area and is beginning to shift from agriculture and forest to urban and residential. In 1991, Gosling Czubak Associates and the Great Lakes Environmental Center completed a Nonpoint Source Pollution Study for Mitchell Creek watershed (GCA and GLEC 1991). This study found water quality and aquatic diversity to be ‘good’ in spite of obvious signs of degradation. The study recommended measures to further protect the natural integrity of Mitchell Creek by controlling soil erosion, sedimentation and thermal impacts. Upon completion of the Nonpoint Source Pollution Study, the Grand Traverse County Drain Commissioner’s Office (GTCDC) launched a 45-month Implementation Project on the creek from 1991-1995 (GTCDC August 1995, GTCDC February 1995). This project focused on correcting existing nonpoint source problems and maximizing the potential for long-term water resource protection on the Mitchell Creek watershed. Major accomplishments of the Implementation Project included:
• The development of a Watershed Protection Strategy that, among other things, offered recommendations to local governments to assist in watershed planning (GTCDC February 1995). One such recommendation is the concept of a special ‘watershed overlay zoning district’ that would establish minimum creek setbacks and wildlife corridors as well as provide provisions to encourage appropriate development in ecologically sensitive areas.
• Implementation of Best Management Practices throughout the watershed focusing on four areas: urban, agricultural, recreational facilities, and streambank erosion from road/stream crossings.
• Land protection activities coordinated by the Grand Traverse Regional Land Conservancy including educational programs and the promotion of voluntary land protection options. As part of the activities, a landowner’s handbook was developed and 158 acres of land in the watershed were protected through conservation easements and gifts of land.
• Information and Education Program including: watershed clean-ups, tree plantings, placement of roadside watershed signs, watershed festival, distribution of a landowner’s handbook, and an educational video which describes threats to surface water quality in the Mitchell Creek due to urbanization.
48
Research by the Grand Traverse County Drain Commission shows that 8.9% of the Mitchell Creek watershed is covered by impervious surfaces (Harrison and Dunlap 1998). (This study was also conducted on the Acme and Yuba Creek watersheds.) Impervious surfaces are those areas on land that cannot effectively absorb or infiltrate rainfall. Areas such as these may include: roads, streets, sidewalks, parking lots, and rooftops. Research suggests that there is a threshold to the amount of impervious cover that can occur within a watershed at which aquatic systems degradation occurs. Findings reveal that stream degradation consistently occurs when impervious surface levels in a watershed reach between 10-20% (CWP 1994).
Acme Creek Acme Creek covers 13 mi2 and is located at the southern end of East Grand Traverse Bay. It covers portions of three townships in Grand Traverse County: Acme, East Bay, and Whitewater (Figure 13). Along with Mitchell Creek, the Acme Creek watershed is under increasing pressure from urbanization. The Acme Creek and its tributaries originate from groundwater seeps in a near-pristine area at the southern end of the watershed in East Bay and Whitewater Townships (GTCDC June 1995). Land use in this watershed consists of 62% forest, 12% urban, 10% open, and 9% wetlands (Table 10, Figure 13). The Acme Creek system, which is replenished mostly from groundwater, is designated as a cold water trout stream (GTCDC June 1995). A GTCDC study shows that the percent impervious coverage in the Acme Creek watershed in 1995 was 4.2% (Harrison and Dunlap 1998). (Please see the section on Mitchell Creek for a discussion regarding impervious surfaces.) A Watershed Planning Project for Acme Creek was completed in 1995 by the GTCDC. The project listed the following as the most significant current and future water quality and quantity impacts on Acme Creek: sedimentation; nutrient loading from golf courses, residential and agricultural lands; and stormwater runoff resulting from increased impervious surfaces. In addition to noting threats to water quality, the project also completed a number of other tasks. A watershed database was developed that included information on wetlands, parcel lines, slopes, land cover, township zoning, and potentially sensitive areas. Local township ordinances were reviewed and found to be weak and not targeted to the protection of the creek and its fisheries habitat. Specific streambank erosion sites and inadequate culverts were identified for future restoration and remediation. Also, public input sessions were held where concerns were raised regarding golf course practices, road construction, and the current level of protection for public and private lands near the creek’s headwaters (GTCDC June 1995). An Implementation Project was also conducted by the GTCDC from April 1997 – March 2000 that included restoration efforts in Acme Creek as well as Yuba Creek (GTCDC 2000). This report is further described in the next section.
Yuba Creek Yuba Creek watershed is the smallest subwatershed to the Grand Traverse Bay, covering just 8 mi2. It is adjacent to the Acme Creek watershed and located almost entirely in Acme Township, on the outskirts of Traverse City (Figure 13). Much like Acme Creek, the Yuba Creek watershed is in the rapidly developing area outside of Traverse City. Most of the land use in the Yuba Creek watershed is agriculture, with significant amounts of forest and open space (Table 10,
49
Figure 13). As of 1995, the percent impervious coverage in the Yuba Creek watershed was only 2.4% (Harrison and Dunlap 1998). (Please see the section on Mitchell Creek for a discussion regarding impervious surfaces.) No management plan has been developed for the Yuba Creek watershed, but preliminary protection and monitoring work has been completed as part of a GTCDC Implementation Project in conjunction with Acme Creek from April 1997 – March 2000. The project successfully completed the following tasks (GTCDC 2000):
• Promoted use of stream buffers as primary water resource management tool in Acme and East Bay Townships. (NOTE: As of June 2003, East Bay Township, which houses Acme and Mitchell Creeks, had just enacted a model ordinance that established a riparian buffer overlay zone for the township.)
• Protected the following parcels of land: o Deepwater Point Natural Preserve: 17 acres and 2000 feet of East Bay shoreline o Frost Property: 465 acres at the headwaters of Acme Creek o Spindrift property: ‘Yuba Creek Natural Area’; top priority for protection in Yuba
Creek watershed; 456 acres of wetlands, scenic ridges, and active orchards along Yuba Creek
• Increased public awareness of water resource issues in Acme and Yuba Creek watersheds including the development of the following:
o Watershed landowner’s handbook o Watershed road signs marking the entrance to each watershed o Articles, press releases and announcements
• Corrected all severe runoff erosion sites through the use of streambank erosion Best Management Practices and prevented 73 (Acme Creek) and 70 (Yuba Creek) tons of sediment/year from entering watershed Ptobego Creek
The Ptobego Creek watershed is widely considered by some to be the most beautiful wetland area in the entire Grand Traverse Bay watershed. The majority of the 14 mi2 watershed area is located in Grand Traverse County’s Whitewater and Acme Townships, with a smaller portion in Antrim County’s Elk Rapids Township (Figure 13). Also spelled Tobego or Tobeco, the Ptobego Creek watershed includes a vast complex of wetlands near its outlet to the Grand Traverse Bay and is home to a thriving wildlife population.
Aerial View of Lower Ptobego Pond entering Grand Traverse Bay
50
Approximately 55% of the watershed is covered by agriculture, 26% consists of orchards near downstream areas along US-31, and 28% is croplands in headwater areas (Table 10, Figure 13). The watershed is made up of a single creek that flows lazily into the Upper Ptobego Pond and then meanders through a wetland complex into the Lower Ptobego Pond, which then outlets into the bay. The Ptobego Creek Wildlife Preserve and State Game Area, an approximate 400-acre parcel of land, is centered on these two ponds in Grand Traverse County. Additionally, the Grand Traverse Regional Land Conservancy recently secured a deal to establish the Maple Bay Farms Natural Area in the watershed, a 400+ acre parcel of land adjacent to the wildlife preserve.
West Bay Shoreline and Tributaries This 68 mi2 watershed area stretches along a small sliver of Leelanau County on the west side of Grand Traverse Bay and encompasses the land draining all tributaries and groundwater seeps entering the bay (Figure 14). Tributaries along the West Bay shoreline include: Cedar, Leo, Lee, Belanger, Weaver, Ennis, and Northport creeks. Villages along this portion of the watershed include Suttons Bay, Omena, Northport, and Peshawbestown, which is the governmental seat of the Grand Traverse Band of Ottawa and Chippewa Indians (GTBOCI). The Leelanau State Park is located at the tip of this watershed. Most of the land use along this area is either forested or agriculture, with developed areas along the shoreline (Table 10, Figure 14). The GTBOCI has conducted extensive water quality monitoring along the West Bay shoreline since 1999, as well as completing a road stream crossing survey in 2003. Water quality sampling sites include: Ennis Creek, Belanger Creek, and several sites in West Grand Traverse Bay (Lee Point, Suttons Bay, Peshawbestown, Northport, Omena Bay). Overall, results from their monitoring suggest that water quality in these streams and at the West Bay locations is good, although it is noted that habitat diversity in Ennis and Belanger Creeks is being threatened by sedimentation (Personal Communication with Mary Wilson, GTBOCI Aquatic Biologist, March 2003). Results from the road stream crossing survey identify 8 sites with severe erosion problems and 19 sites with moderate erosion (Personal Communication with Mary Wilson, GTBOCI Aquatic Biologist, September 2003).
East Bay Shoreline and Tributaries The East Bay Shoreline watershed encompasses 39 mi2 of mostly forested land along the east side of East Grand Traverse Bay in Antrim and Grand Traverse Counties (Figure 15). Major tributaries in this watershed include: Baker Creek in Grand Traverse County, and Guyer and Antrim Creeks in Antrim County. A recent shoreline inventory along the Antrim County portion of East Bay (Appendix C) reveals that there are a total of twenty-four small streams and many groundwater seeps entering the bay from the Village of Elk Rapids up to Norwood. The most interesting and beautiful seeps were observed north of Eastport seeping from the blue Antrim Shale Bluffs. Also, the Antrim Creek Natural Area is located in the northern section of this watershed.
51
Old Mission Peninsula The watershed of the Old Mission Peninsula is perhaps one of the most unique of the smaller subwatersheds to the bay. Located in the middle of Grand Traverse Bay, forming the East and West Bays, the 31 mi2 watershed area is covered extensively by orchards and vineyards (about 45%) and is known for its exquisite beauty (Table 10, Figure 16). Only 3 miles at its widest point, the peninsula offers breathtaking panoramic views of both East and West Bay from its highest ridges. The tip of the peninsula, Old Mission Point, is largely a public accessible area with township and state parks. The watershed has no major streams or lakes, and its water flows or seeps into either West or East Grand Traverse Bay.
View of Grand Traverse Bay from Old Mission Peninsula
BANKS
STAR
ECHO
MANCELONA
MILTON
KALKASKA
CUSTER
JORDAN
ACME
ELMIRAWARNER
KEARNEY
WHITEWATER
SOUTH ARM
CHESTONIA
HELENA
RAPID RIVER
EXCELSIOR
PENINSULA
COLD SPRINGSCLEAR WATER
FOREST HOME
MARION
CENTRAL LAKE
LEELANAU
EAST BAY
TORCH LAKE
NORWOOD
ELK RAPIDS
GARFIELD
SUTTONS BAY
BINGHAM
ANTRIM COKALKASKA CO
ANTRIM COKALKASKA CO
Grand Traverse BayWatershed
GR
AN
D T
RA
VE
RS
E C
OK
AL
KA
SK
A C
OG
RA
ND
TR
AV
ER
SE
CO
KA
LK
AS
KA
CO
Elk Lake
LakeSkegemog
N. Br. B
oardman River
TorchLake
LakeBellaire
Rapid River
Acm
e C
ree
k
Yu
ba C
ree
k
Will
iam
burg
s C
reek
Ba
ttle
Cre
ek
To
beco
Cre
ek
BearLake
Elk River/Chain of Lakes
Watershed
ManisteeLake
N. B
r. Manistee R
iver
Cedar River
Lake ofthe Woods
Spencer Creek
IntermediateLake
Jordan River
SixmileLake
EllsworthLake
WilsonLake
Ben-wayLake
HanleyLake
ScottsLake
BealsLake
SouthArm
Deer Creek
DeerLake
LakeCharlevoix
Boyne River
Poter Creek
Warner Creek
CHARLEVOIX COANTRIM CO
CHARLEVOIX COANTRIM CO
Green R
iver
BirchLake
PtobagoPond
WalloonLake
Inw
ood
Cre
ek
Ba
rna
rd C
ree
k
Toad Creek
Intermediate River
Ogletree C
reek
King C
reek
Skinner C
reek
Monroe Creek
S. Br. Boyne River
ThumbLake
S. Br. Bear River
ClamLake
Jordan River
HoffmanLake
Lake27
AN
TR
IM C
OO
TS
EG
O C
OA
NT
RIM
CO
OT
SE
GO
CO
KA
LK
AS
KA
CO
CR
AW
FO
RD
CO
KA
LK
AS
KA
CO
CR
AW
FO
RD
CO
Goose C
reek
0 4 8 122Miles
0 4 8 122Kilometers
BoyneCity
BoyneCity
BoyneFalls
BoyneFalls
EastJordan
EastJordan
EllsworthEllsworth
Central Lake
Central Lake
BellaireBellaire
MancelonaMancelonaElkRapids
ElkRapids
KalkaskaKalkaska
GRAND TRAVERSE BAY WATERSHEDFIGURE 11: ELK RIVER CHAIN OF LAKES WATERSHED
Legend
Lakes & Ponds
Rivers & Streams
Grand Traverse Bay Watershed
Highways
Major Roads
Political Boundaries
Land use/cover categories:
Forested
Wetlands
Barren
Urban
Agricultural
Nonforested (open shrub & grassland)
12/16/03
Map produced by:
KALKASKA
BLAIRUNION
GARFIELD
PARADISE
CUSTER
EAST BAY
ACME
MILTON
WHITEWATER
ORANGE
MAYFIELD FIFE LAKE
BOARDMAN
HELENA
GARFIELD
RAPID RIVER
BINGHAM
SPRINGFIELD
CLEAR WATERELMWOOD
PENINSULA
EXCELSIOR
MANCELONA
COLD SPRINGS
LONG LAKE
GREEN LAKE
ELK RAPIDS
FOREST HOME
KEARNEY CHESTONIA
East ArmG.T. Bay
ANTRIM COKALKASKA CO
ANTRIM COKALKASKA CO
Grand Traverse BayWatershed
West ArmG.T. Bay
GR
AN
D T
RA
VE
RS
E C
OK
AL
KA
SK
A C
OG
RA
ND
TR
AV
ER
SE
CO
KA
LK
AS
KA
CO
LEELANAU COGRAND TRAVERSE CO
LEELANAU COGRAND TRAVERSE CO
Elk Lake
LakeSkegemog
SpiderLake
BoardmanLake
Boardman R
iver
N. Br. Boardman River
S. Br. Boardman River
CedarLake
Rapid River
Acm
e C
reek
Crofton Creek
Failing Creek
Taylor Creek
Carpenter Creek
Twentytwo Creek
East Creek
Parker CreekBancroft C
reek
Jackson Creek
Sw
ains
ton
Cre
ek
Yub
a C
reek
Will
iam
burg
s C
reek
Bat
tle C
reek
Tob
eco
Cre
ek
Mitchell Creek
SilverLake
BassLake
Kid
s C
reek
FifeLake
Board
man
Rive
r
Man
iste
e R
iver
Brown BridgePond
CrawfordLake
LakeLeelanau
Boardman RiverWatershed
PtobegoPond
ManisteeLake
SabinPond
KeystonePond
Mason Creek
Bakers C
reek
0 4 8 122Miles
0 4 8 122Kilometers
Legend
Lakes & Ponds
Rivers & Streams
Grand Traverse Bay Watershed
Highways
Major Roads
Political Boundaries
Land use/cover categories:
Forested
Wetlands
Barren
Urban
Agricultural
Nonforested (open shrub & grassland)
Traverse CityTraverse City
KingsleyKingsley
Fife LakeFife Lake
GRAND TRAVERSE BAY WATERSHEDFIGURE 12: BOARDMAN RIVER WATERSHED
KalkaskaKalkaska
12/16/03
Map produced by:
ACME
WHITEWATER
EAST BAY
GARFIELD
MILTON
PENINSULA
ELMWOOD
BLAIRUNION
BINGHAM
ELK RAPIDS
KALKASKA
CLEAR WATER
BOARDMAN
East ArmG.T. Bay
Grand Traverse BayWatershed
West ArmG.T. Bay
Elk Lake
SpiderLake
BoardmanLake
Acm
e C
reek
Yub
a C
reek
Tob
eco
Cre
ek
Mitchell Creek
Acme CreekWatershed
PtobegoPond
Bakers C
reek
Ptobego CreekWatershed
Mitchell CreekWatershed
Yuba CreekWatershed
Boa
rdm
an R
iver
Will
iam
sbur
gs C
reek
Legend
Lakes & Ponds
Rivers & Streams
Grand Traverse Bay Watershed
Highways
Major Roads
Political Boundaries
Land use/cover categories:
Forested
Wetlands
Barren
Urban
Agricultural
Nonforested (open shrub & grassland)
Elk RapidsElk Rapids
Traverse CityTraverse City
0 2 4 61Miles
0 2 4 61Kilometers
Ptobego Creek Watershed
Ptobego Creek Watershed
Acme Creek Watershed
Acme Creek Watershed
Yuba Creek Watershed
Yuba Creek Watershed
Mitchell Creek Watershed
Mitchell Creek Watershed
GRAND TRAVERSE BAY WATERSHEDFIGURE 13: MITCHELL, ACME, YUBA,
AND PTOBEGO WATERSHED
12/16/03
Map produced by:
BANKS
MILTON
KALKASKA
ECHO
ACME
LEELANAU
WHITEWATER
CUSTERHELENA
BINGHAM
LONG LAKE
GARFIELD
PENINSULA
CLEAR WATER
KEARNEY
FOREST HOME
SOUTH ARM
CENTRAL LAKE
EAST BAY
ELMWOOD
RAPID RIVER
SUTTONS BAY
TORCH LAKE
MARION
ELK RAPIDS
NORWOOD
East ArmG.T. Bay
ANTRIM COKALKASKA CO
ANTRIM COKALKASKA CO
West ArmG.T. Bay
GR
AN
D T
RA
VE
RS
E C
OK
AL
KA
SK
A C
OG
RA
ND
TR
AV
ER
SE
CO
KA
LK
AS
KA
CO
LEELANAU COGRAND TRAVERSE CO
LEELANAU COGRAND TRAVERSE CO
Elk Lake
LakeSkegemog
BoardmanLake
Boa
rdm
an R
iver
N. Br. Boardman River
CedarLake
TorchLake
LakeBellaire
Rapid River
Acm
e C
ree
k
Yub
a C
ree
k
Will
iam
burg
s C
reek
Bat
tle C
ree
k
Tob
eco
Cre
ek
Mitchell Creek
SilverLake
LongLake
Kid
s C
reek
LakeLeelanau
BassLake
Lake ofthe Woods
Spencer Creek
IntermediateLake
SixmileLake
EllsworthLake
WilsonLake
Ben-wayLake
HanleyLake
Wilk
inson
Cre
ek
CHARLEVOIX COANTRIM CO
CHARLEVOIX COANTRIM CO
BirchLake
PtobegoPond
Toad Creek
MudLake
East
port
Cre
ek
Guy
er C
reek
Ant
rim C
reek
Monroe Creek
ClamLake
Paradine Creek
Ennis Creek
BassLake
LakeLeelanau
Weaver C
reek
Bela
ngers Creek
Mebert Creek
Belnap CreekMann Creek
Cedar Creek
Weisler C
reek
Bakers Creek
NorthportNorthport
Suttons BaySuttons Bay
Traverse CityTraverse City
Elk RapidsElk Rapids
Central LakeCentral Lake
BellaireBellaire
EllsworthEllsworth
KalkaskaKalkaska
0 2 4 61Miles
0 2 4 61Kilometers
GRAND TRAVERSE BAY WATERSHEDFIGURE 14: WEST BAY SHORELINE WATERSHED
Grand Traverse BayWatershed
West Bay Shoreline Watershed
Legend
Highways
Major Roads
Political Boundaries
Lakes & Ponds
Rivers & Streams
Grand Traverse Bay Watershed
Cropland
Permanent Pasture
Other Agricultural
Land use/cover categories:
Wetlands
Barren
Urban
Forested
Nonforested (open shrub & grassland)
Orchards/Vineyards
OmenaOmena
PeshawbestownPeshawbestown
Northport Creek
Leo
Cre
ek
Lee Creek
12/16/03
Map produced by:
BANKS
MILTON
KALKASKA
ECHO
ACME
LEELANAU
WHITEWATER
CUSTERHELENA
BINGHAM
LONG LAKE
GARFIELD
PENINSULA
CLEAR WATER
KEARNEY
FOREST HOME
SOUTH ARM
CENTRAL LAKE
EAST BAY
ELMWOOD
RAPID RIVER
SUTTONS BAY
TORCH LAKE
MARION
ELK RAPIDS
NORWOOD
East ArmG.T. Bay
ANTRIM COKALKASKA CO
ANTRIM COKALKASKA CO
West ArmG.T. Bay
GR
AN
D T
RA
VE
RS
E C
OK
AL
KA
SK
A C
OG
RA
ND
TR
AV
ER
SE
CO
KA
LK
AS
KA
CO
LEELANAU COGRAND TRAVERSE CO
LEELANAU COGRAND TRAVERSE CO
Elk Lake
LakeSkegemog
BoardmanLake
Boa
rdm
an R
iver
N. Br. Boardman River
CedarLake
TorchLake
LakeBellaire
Rapid River
Acm
e C
ree
k
Yub
a C
ree
k
Will
iam
burg
s C
reek
Bat
tle C
ree
k
Tob
eco
Cre
ek
Mitchell Creek
SilverLake
LongLake
Kid
s C
reek
LakeLeelanau
BassLake
Lake ofthe Woods
Spencer Creek
IntermediateLake
SixmileLake
EllsworthLake
WilsonLake
Ben-wayLake
HanleyLake
Wilk
inson
Cre
ek
CHARLEVOIX COANTRIM CO
CHARLEVOIX COANTRIM CO
BirchLake
PtobegoPond
Toad Creek
MudLake
East
port
Cre
ek
Guy
er C
reek
Ant
rim C
reek
Monroe Creek
ClamLake
Paradine Creek
Ennis Creek
BassLake
LakeLeelanau
Weaver C
reek
Bela
ngers Creek
Mebert Creek
Belnap CreekMann Creek
Cedar Creek
Weisler C
reek
Bakers Creek
NorthportNorthport
Suttons BaySuttons Bay
Traverse CityTraverse City
Elk RapidsElk Rapids
Central LakeCentral Lake
BellaireBellaire
EllsworthEllsworth
KalkaskaKalkaska
0 2 4 61Miles
0 2 4 61Kilometers
Grand Traverse BayWatershed
East Bay Shoreline Watershed
GRAND TRAVERSE BAY WATERSHEDFIGURE 15: EAST BAY SHORELINE WATERSHED
Legend
Highways
Major Roads
Political Boundaries
Lakes & Ponds
Rivers & Streams
Grand Traverse Bay Watershed
Cropland
Permanent Pasture
Other Agricultural
Land use/cover categories:
Wetlands
Barren
Urban
Forested
Nonforested (open shrub & grassland)
Orchards/Vineyards
12/16/03
Map produced by:
ACME WHITEWATER
PENINSULA
MILTON
BINGHAM
ELMWOOD
GARFIELD
EAST BAY
SUTTONS BAY
ELK RAPIDS
TORCH LAKE
East ArmG.T. Bay
West ArmG.T. Bay
LEELANAU COGRAND TRAVERSE CO
LEELANAU COGRAND TRAVERSE CO
Elk Lake
BoardmanLake
Boa
rdm
an R
iver
CedarLake
Acm
e C
reek
Yub
a C
reek
Will
iam
burg
s C
reek B
attle
Cre
ek
Tob
eco
Cre
ek
Mitchell Creek
SilverLake
Kid
s C
reek
BirchLake
PtobegoPond
Paradine C
reek
Leo
Cre
ek
Cedar Creek
Bakers C
reek
0 1 2 30.5Miles
0 1 2 30.5Kilometers
GRAND TRAVERSE BAY WATERSHEDFIGURE 16: OLD MISSION PENINSULA WATERSHED
Traverse CityTraverse City
Elk RapidsElk Rapids
Suttons BaySuttons Bay
Grand Traverse BayWatershed
Old MissionPeninsulaWatershed
Legend
Highways
Major Roads
Political Boundaries
Lakes & Ponds
Rivers & Streams
Grand Traverse Bay Watershed
Cropland
Permanent Pasture
Other Agricultural
Land use/cover categories:
Wetlands
Barren
Urban
Forested
Nonforested (open shrub & grassland)
Orchards/Vineyards
12/16/03
Map produced by:
58
3.10 Other Considerations: Groundwater Groundwater is an important source of hydrologic input throughout the Grand Traverse Bay watershed. It should be valued and managed efficiently not only for its quality but for its quantity as well. It is important to note that most groundwater will eventually become surface water; it only depends on how long it will take. By protecting groundwater quality, surface water quality will also be protected. Additionally, protecting groundwater resources is important due to the vast majority of watershed residents (most everybody except for City of Traverse City residents) using groundwater for their drinking water source. There are some significant groundwater contamination issues within the Grand Traverse Bay watershed related primarily to underground storage tanks that have leaked or poor historical waste disposal practices. There are a number of other pollutants to groundwater in the Grand Traverse Bay watershed as well. For example, commercial agricultural fertilizers, if applied excessively, also have the potential to leach into the ground and eventually contaminate drinking water wells, as is the case in parts of Old Mission Peninsula in Grand Traverse County. Past fertilization practices in orchards on the peninsula have led to high nitrate levels in groundwater wells, leading some residents to consider pumping water from Traverse City to use for drinking water. Additionally, pesticides and other types of toxic compounds used at agricultural facilities have the potential to be spilled and leach into the ground. Agricultural areas that irrigate their waste and wastewater onto land can introduce excessive nutrients to the ground, mostly in the form of nitrogen. Examples of this type of pollutant include irrigation from milkhouse wastewater and manure lagoons. Abandoned wells and oil wells are other examples of potential ways pollutants can reach groundwater. When a well is drilled and abandoned, however many years later, and either capped improperly or not at all, it leaves an open conduit to groundwater. Pollutants can either reach groundwater sources down through the drilled well shaft itself or down along the outside of the well shaft. In this same way, existing wells may be potential sources for groundwater pollution. Wellhead protection programs are important where a threat to groundwater exists if there is a pollutant spill, such as oil or gasoline, which can seep down along the sides of a well shaft into the aquifers below. Other sources of pollutants to groundwater are from leaking septic systems. Places in the Grand Traverse Bay watershed that have a high density of residents utilizing septic systems pose an increased threat to groundwater contamination. Overall, groundwater is a precious resource and it must be protected. Sound management decisions must be made to protect groundwater contamination wherever and whenever possible. In Conservation Districts and MSU-Extension offices throughout the State of Michigan, there is a groundwater stewardship resource person to educate the public on these specific issues. In addition, it is important to manage the quantity of groundwater supplying the Grand Traverse Bay watershed. Many businesses, agricultural operations, and local residents draw water from lakes, rivers, and groundwater for a variety of purposes. The issue of drawing groundwater from underground aquifers is contentious in parts of the state.
59
Groundwater quantity and its withdrawal from the watershed is an issue that goes beyond the scope of the Grand Traverse Bay Watershed Protection Plan. However, it is an issue that should and will be debated in the near future by watershed residents, local governments, local and national businesses, watershed groups, and state and federal agencies. Combined, these groups must come to a general consensus and determine guidelines for proper groundwater management. Recommended actions to reduce the risks to groundwater contamination are found in Sections 7.3 and 7.4.
60
3.11 Existing Water Quality Information and Results for Grand Traverse Bay Watershed
Overall, the prevailing opinion among experts is that the water quality in the Grand Traverse Bay is excellent, but there are several potential threats to that quality. Excessive nutrients and toxic contaminants from runoff are just two examples of potential threats to the bay. For the most part, the Grand Traverse Bay is typical of other oligotrophic embayments in the Great Lakes; deep, clear, cold, with an overall low productivity. A unique characteristic of Grand Traverse Bay is the exchange of water between the bay and Lake Michigan is significantly influenced by the presence of a sill (deep trench) along the bottom northern part of the bay. This sill affects water circulation and currents in the bay. As a result, the flushing rates at the southern base of West Grand Traverse Bay, where the Boardman River empties, can be dramatically lower than other bay regions (GLEC 2005). This may affect nutrient concentrations in the bay since they vary from one location to another.
Water Quality in Grand Traverse Bay The information boxes following this section highlight some of the most recent findings on various aspects of water quality in the Grand Traverse Bay. The information was summarized from the following publications:
• Water Quality Monitoring of Saginaw and Grand Traverse Bays – 2005 o Research Great Lakes Environmental Center (GLEC) completed for the Michigan
Department of Environmental Quality from 2001-2003 o A variety of parameters were measured including phosphorus, nitrogen,
chlorophyll a, metals, and others; please see publication for specific details (GLEC 2005)
• State of the Bay 2000
o A collection and summary of publications and ongoing research studies and information about the Grand Traverse Bay and its watershed; please see publication for specific details and references (State of the Bay 2000).
• Integrated Habitat and Water Quality Inventory for the Grand Traverse Bay – 2000
o Research Great Lakes Environmental Center (GLEC) completed for The Watershed Center (GLEC/DEQ 2005) Included historical information from the following reports:
The Limnology of Grand Traverse Bay, Lake Michigan (Auer et al., 1975) Some Aspects of the physical Limnology of Grand Traverse Bay (Lauff,
1957) Final Report for the Grand Traverse Bay Watershed Initiative: Part II,
Water Quality of the Bay and Tributaries (Shuey et al., 1992) (Note: The Grand Traverse Bay Watershed Initiative has changed its name to The Watershed Center Grand Traverse Bay)
The Acme Creek Ecological Project: Natural Features Inventory and Land Management Plan (GLEC 1994)
61
Peshawbestown and Omena Bay Baseline Water and Sediment Quality Study (GLEC 1998)
• Stormwater Source Identification, Sampling and Analysis at Select Storm Drains and
Tributaries to Grand Traverse Bay (Lake Michigan) – 2001 o A stormwater and stormdrain study GLEC completed for The Watershed Center
• Information obtained from other sources is noted where applicable.
A summary of this information can be found in Appendix D: “Summary of Existing Watershed Plans and Other Research Studies”. Results from these and other research projects in the Grand Traverse Bay are also found in The Watershed Center’s online interactive water quality database at www.gtbay.org/wqquery.asp. This database was designed to provide a comprehensive storehouse of available water quality data, collected by The Watershed Center, volunteer monitoring projects, researchers from universities, and other organizations, for the entire Grand Traverse Bay watershed. More than 27 reports have been entered into the database so far, with plans to enter new reports and data as they become available. Users can search for specific results by parameter (nitrogen, phosphorus, etc.), report, or location (river, lake, open bay, etc.). Additionally, the database has a mapping feature where users can search for water quality data using an interactive map. General Characteristics (Dissolved Oxygen – DO, Temperature, Secchi Disk)
• DO and temperature indicate little stratification • DO at or near saturation most of year • Secchi Disk, Transparency
The Secchi disk is a measure of water transparency, which is directly linked to inorganic suspended solids and plankton abundance. Transparency and secchi disk readings vary throughout year, with generally greater readings in Spring. Generally, secchi disk readings have increased over the past 15 years. o Transparency exceeds 7-8m o Average water clarity increased 20% from 1990-2000 in West Arm of Bay o 1957-10.5m (34ft); 1975-7.0m (23ft); 1992-5.7m (19ft); 1999-8.5m (28ft); Spring
2000 (Inland Seas Education Association)-9.8m (32ft) at lower West Bay, 11.6m (38ft) in Suttons Bay; Summer 2002 (GT Bay Power Squadron)- range of 12.2-14.3m (40-47ft)
o Increase in water clarity attributed to decrease in plankton community and introduction and proliferation of zebra mussels in the bay
• Quality is good, typically coarse sand with numerous areas of cobble and gravel; at 100+ft depth the bottom is silt and clay
• Increases in silt and organic detritus along nearshore bottom • Isolated areas that are relatively rich in inorganic matter (i.e., Omena Bay) • Sediment does not contribute significant concentrations of nutrients to water column;
most of the phosphorus in the sediment is organically bound • There are few rooted macrophyte beds (possibly due to lack of suitable substrate) • Seiche events (which are large scale periodic movements of water) can re-suspend
sediments in deeper portions of the bay. If carried into the water column, they can release contaminants deposited decades ago.
Nutrients
• Nutrients are relatively low (have continually declined since the 1970’s), overall productivity low
• Urban tributaries and stormwater drains are a significant source of nutrients to the bay • Total Phosphorus(TP): Growth limiting nutrient for the bay o Have historically been some of the lowest concentrations in the Great Lakes o Decline since early 1970’s: 1975 - 7.8ug/L, 1992 – 5.4ug/L, 1994 – 4.9ug/L, 1998 –
o TP higher at nearshore than offshore: nearshore average 1998 = 4.6ug/L; offshore average 1998 = 2.8ug/L
o Significant differences between offshore surface and bottom samples in Omena Bay (due to sediment quality and incomplete mixing of Omena Bay with GT Bay): Spring 1999- 2ug/L at surface; 64ug/L at 80ft
o Significantly higher levels of TP at mouth of Boardman River and Acme Creek o Highest concentration of TP are found at stormwater outfalls- Table 2 in State of the
Bay 2000 • Nitrate: Not a growth limiting nutrient for the bay
o Generally higher in offshore near bottom than surface samples (except in Omena Bay)
o Consistently low levels, slight rise in measurements are unlikely to bring negative impacts to the bay at this time
Notes: In general, total phosphorus concentrations greater than 10ug/L are indicative of impaired water quality The nitrogen requirements of microorganisms are about 10 times that of phosphorus. Because nitrogen/phosphorus ratios exceed 10:1 in most freshwater systems (including Grand Traverse Bay watershed), nitrogen is not usually the limiting nutrient.
63
Weed and Macrophyte Beds
• Weed bed numbers have nearly doubled from 64 growth areas (in 1991) to 124 areas (in 1998). These numbers are still low overall compared to the size of the bay, however, there should be some concern that numbers have doubled in the span of 8 years.
• Growth is most concentrated at South end of West Bay (an area with higher amount of phosphorus entering the bay) which is influenced by rapid development; nutrient inputs and the amount of water flushing an area were most important determinants for locations of beds
Escherichia coli
• Significant potential for fecal contamination following storm events; extremely high concentrations of E. coli and Enterococci were noted during some wet weather samples (For example: November 2000 E. coli = 15,300 colonies/100mL in Bryant Park; 80,000 colonies/100mL in East Bay Park)- Table 2 in State of the Bay 2000
• Summer storm events have potential for significant public health risk at local beaches because of stormwater outfalls and urban tributaries: At risk= West End, Clinch Park, and Bryant Park Beaches; East Bay Park; Elk Rapids City Park; Northport Beach; Southshore Park Beach (Suttons Bay); and waterfront homes near urban areas such as Traverse City
Note: EPA recommends measuring recreational water quality by the abundance of Escherichia coli (E.coli): Water is unsafe for swimming if measurements are either 1) 130+colonies/100mL in 5 samples over 30-day period or 2) 300+colonies/100mL in any 1 sample
• See Section 5.2 – Pathogens for a more in-depth discussion of E.Coli Climate
• Significant changes in dates of freeze-up and break-up of Grand Traverse Bay between 1851-1993 o Average freeze-up date is 12 days later o Average break-up date is 19 days earlier
• Since 1997 the bay has only frozen over once (2003) • 2002 marked the 6th consecutive year that the bay did not freeze over in the last one
hundred years on record. Freezing records obtained from the Traverse City Chamber of Commerce: West Grand Traverse Bay only, must be frozen out to Power Island
64
Endangered and Exotic Species
• Five federally listed endangered or threatened species in the watershed (+1 candidate): Bald Eagle, Kirtland’s Warbler, Piping Plover, Pitcher’s Thistle, Michigan Monkey Flower, Eastern Massasauga Rattlesnake
• Three new exotic species found in Bay since 1999: Fishhook Water Flea, Rusty Crayfish, and the Spiney Water Flea
• Other current exotic species in the bay include: sea lamprey, zebra mussels, Eurasian Ruffe, alewife
Minerals
• Levels of Calcium, Magnesium, Sulfates, and Chlorides are typical of high quality freshwater lakes, no suggestion of water quality degradation
• Concentrations are all consistent and vary little among sampled sites and years • Slight rise in Chloride measurements since 1998, however, levels still close to average
chloride concentration in natural freshwater
Heavy Metals
• Cadmium, Chromium, Lead, Zinc, Nickel: all relatively low, consistent with other lakes
• Copper decreased by 60% => 1ug/L (1975), 0.4ug/L (1998) • Mercury levels low => 0.26ng/L, slightly higher at South end of West Arm and North
end of East Arm (because of loadings from Boardman and Elk River); Higher level recorded in 1999 (concentrations were greater than the Michigan water quality value of 1.3ng/L), but returned to low levels in subsequent years
Silica
• Found in colloidal and suspended matter or in biomass (diatoms) • Declined dramatically in past 40yrs: 1957 - 3.6mg/L, 1976 - 0.423mg/L, 1992 -
0.410mg/L, 1998/9 - 1.06mg/L Silica occurs naturally in the water; it is an essential element used by diatoms (planktonic organisms) for cell structure.
65
Chlorophyll a
• Relatively low readings, varies with seasons • Even though slight increases have been shown for chlorophyll a, the bay is still
oligotrophic with overall low productivity • Overall Bay chlorophyll a average = 1.04ug/L • No significant change since 1975
Chlorophyll a is a pigment found in plants that is necessary for photosynthesis. Measurements of chlorophyll a indicate the amount of suspended algae. Many limnologists argue that lower concentrations of chlorophyll a are associated with better waters quality, although certain amounts are a normal part of a functioning aquatic ecosystem.
Phytoplankton, Zooplankton, and Fish
• Phytoplankton o Greatest abundance in Spring, 21 total species observed in study; dominant
ones typical of oligotrophic systems o Historically: Auer 1957 stated West Arm transitioning towards eutrophication o Current: West Arm has more organisms/liter than East Arm in late summer, this
suggests more nutrients available in West Arm and a higher level of eutrophication
o Overall samples taken have been typical of oligotrophic systems and there is no suggestion of eutrophication
• Zooplankton o Assemblages are similar to those typically found in Lake Michigan and Great
Lakes o Diporeia: As in the rest of Lake Michigan, there are declining levels in Grand
Traverse Bay (correspondence with Inland Seas Education Association), however, they have not been studied extensively here.
Diporeia is a quarter-inch long shrimp-like creature that lives in the sediment at the bottom of most of the Great Lakes. They are considered one of the basic building blocks of the Great Lakes food chain. Researchers used to find 10,000 diporeia in a square yard of sediment. Today researchers are finding only hundreds in a square yard and sometimes finding none at all. Severe declines in diporeia populations will have an effect on Lake Michigan food webs and fish populations (like whitefish or lake trout), either starving some of them or resulting in lower fish weights and size.
• Fish o Approximately 39 species of native and non-native fish live in Bay; diverse
assortment of other insects and invertebrates
66
Tributary and Pollutant Loading for Nitrogen and Phosphorus Annual loadings for Phosphorus (P) and Nitrogen (N) were calculated for tributaries in the watershed draining to Grand Traverse Bay (Table 14). Data for P and N were obtained from The Watershed Center’s online water quality database, with the most recent data available for each subwatershed used. It is assumed that these values were taken during baseflow conditions. Values for P and N were averaged to obtain an annual average concentration for each parameter. Data across multiple years were averaged as well. In the case of the West Bay Shoreline and Tributaries subwatershed, pollutant loadings from individual streams (i.e. Northport Creek, Leo Creek, Suttons Bay Creek, Cedar Creek, etc.) were added together to obtain a measurement for the whole subwatershed. Flow values in Table 14 were taken from Table 12. As noted previously, the discharge measurements in Table 12 are extrapolated from historical values and are only estimated measurements of baseflow conditions. They do not take into account pollutant loading from spring runoff or storm flow events, the latter of which contributes to something called the ‘first flush’ phenomenon. First flush refers to the large percentage of pollutant loading that is produced by a relatively small percentage of the runoff volume during the initial stages storm runoff. Therefore the values in Table 14 may potentially be underestimated. It is recommended that in-depth hydrologic studies be conducted to determine year-round stream flows as well as water quality measurements during baseflow, storm events, and spring runoff. This will provide a better estimate of pollutant loading throughout the Grand Traverse Bay watershed. Table 14 shows that approximately 1.15 million pounds of Nitrogen and 43,000 pounds of Phosphorus enter the Grand Traverse Bay each year.
67
Data Years Used: Elk River Chain of Lakes: P – 2000; N – 2000 Boardman River: P – 1990-91; N – 2002-03 West Bay Shoreline: P – 1990-96; N – 1990-96 Mitchell Creek: P – 1990-91; N – 1997-98 Ptobego Creek: P – 1986; N – 1986-1998 (various years)Acme Creek: P – 1990-91; N – 1997-98 Yuba Creek: P – 1990-91; N – 1997-98
TABLE 14: POLLUTANT LOADING FOR PHOSPHORUS AND NITROGEN BY SUBWATERSHED
Subwatershed Area (mi2)
Flow (cfs)
Ave P (µg/L) P ton/yr P
lbs/yr NOx*
(mg/L) NOx
ton/yr NOx
lbs/yr
Elk River Chain of Lakes 502.6 567.9 18.1 9.3 20,396 0.425 217.2 478,919
Boardman River 283.8 320.7 28.1 8.1 17,880 0.457 131.9 290,790
West Bay Shoreline and Tributaries
68 76.8 15.6 1.1 2,371 2.186 151.2 333,280
Mitchell Creek 15.7 17.7 22.5 0.4 792 0.521 8.3 18,340
Ptobego Creek 14.2 16.0 15 0.2 478 0.153 2.2 4,871
*Values are from NO3 or NO3+NO2 (in most cases NO2 adds a negligible amount) **There are no significant tributaries in these two subwatersheds and surface water discharge to the Bay is negligible; therefore nitrogen and phosphorus loads were not calculated
Load Calculation Ton/yr = Discharge (ft3/s) x Concentration (mg/L) x L/.035ft3 x 1x10-9ton/1mg x 3.15x107s/yr Lbs/yr = ton/yr x 2204.6 lbs/ton
68
CHAPTER 4 DESIGNATED AND DESIRED USES
4.1 Designated Uses in the State of Michigan Each of Michigan’s surface waters is protected by water quality standards for specific designated uses (Table 15). These standards and designated uses are designed to 1) protect the public’s health and welfare, 2) to enhance and maintain the quality of water, and 3) to protect the state’s natural resources.
TABLE 15: DESIGNATED USES FOR SURFACE WATERS IN THE STATE OF MICHIGAN
All surface waters in the state of Michigan are designated for and shall be protected for all of the following uses:
1. Agricultural
2. Industrial
3. Public water supply at point of intake
4. Navigation
5. Warmwater or coldwater fishery
6. Other indigenous aquatic life and wildlife
7. Partial body contact recreation
8. Total body contact recreation between May 1 – October 31
Citation: R323.1100 of Part 4, Part 31 of the Natural Resources and Environmental Protection Act, 1994 PA 451, as amended
If a body of water or stream reach is not meeting the water quality standards set for a specific designated use, then it is said to be in ‘nonattainment’. An annually published listing of the bodies of water and stream reaches in the state of Michigan that are in nonattainment can be found in the DEQ’s Section 303(d) Report (DEQ 2002). The DEQ uses a rotating watershed cycle for surface water quality monitoring where each of the 58 major watersheds in the state is scheduled for monitoring at least once every five years. The Grand Traverse Bay watershed was last monitored in the summer of 2003, and results should be available shortly. Results from the 1998 monitoring indicate that there are no widespread impairments to the designated uses in the Grand Traverse Bay watershed. The only stream in nonattainment is a small section of Kid’s Creek, a tributary to the Boardman River (Table 16).
69
TABLE 16: RIVER SEGMENT IN GRAND TRAVERSE BAY WATERSHED IN ‘NONATTAINMENT’
Stream or Lake Designated Uses Not Met
Reason for Nonattainment Status
Kid’s Creek (From confluence with Boardman River u/s to M-37/US-31)
Cold water fishery Other aquatic life
Macroinvertebrate community rated poor
However, due to widespread mercury contamination and public health fish consumption advisories, all of Michigan’s inland lakes, including those in the Grand Traverse Bay watershed, are included on the Section 303(d) list (MDNR 1997). For further information on mercury sources in the environment and mercury pollution prevention strategies, please refer to publications by Sills (1992) and Mehan (1996), respectively. These two reports resulted from two specific DEQ task force investigations into mercury in the environment, sources, and prevention. The problem of mercury contamination and other related widespread toxic contamination problems in the Grand Traverse Bay watershed will not be discussed in this Management Plan. The DEQ has taken the lead to develop pollution prevention and abatement strategies throughout the State of Michigan for mercury contamination and other related toxins.
70
4.2 Impacted Designated Uses in the Grand Traverse Bay Watershed None of the designated uses for the Grand Traverse Bay watershed are impaired on a watershed wide scale. However, in some cases, activities and resulting pollutants in the watershed may prove to be a threat to water quality and designated uses. Threatened waterbodies are defined as those that currently meet water quality standards, but may not in the future. The Grand Traverse Bay Watershed Protection Plan will focus on five designated uses to protect in order to maintain water quality throughout the Grand Traverse Bay and its watershed. The designated uses include the cold water fishery, other indigenous aquatic life, total body contact, navigation, and public water supply at point of intake (Table 17). Threatened designated uses were ascertained through scientific research reports, existing subwatershed management plans, DEQ water quality reports, field observations by the Project Coordinator, steering committee members, and personal contact with watershed residents and scientific experts on the Grand Traverse Bay watershed.
TABLE 17: THREATENED DESIGNATED USES IN THE GRAND TRAVERSE BAY WATERSHED
Designated Uses
Public Water Supply at Point of Intake Threatened (For Traverse City municipal intake on East Bay only)
Navigation Threatened
Coldwater Fishery Threatened
Other Indigenous Aquatic Life Threatened
Total Body Contact Recreation (May1-Oct 31) Threatened
71
4.3 Desired Uses In addition to researching regulated designated uses, the project’s steering committee has also identified a number of locally determined desired uses for the watershed. Desired uses can be defined as the ways in which people use the watershed and think should be protected and/or preserved for future generations. They may be very general or very specific, or somewhere in between. Desired uses for the Grand Traverse Bay watershed include uses for recreational, aesthetic, and ecosystem preservation purposes (Table 18).
TABLE 18: GENERAL DESIRED USES FOR THE GRAND TRAVERSE BAY WATERSHED
Desired Use Category Goal
Recreation
• Maintain high quality areas in the watershed for recreation such as fishing, canoeing, boating, hiking, camping, and birding.
• Develop additional Designated Natural Areas throughout the
watershed for recreation and education. • Increase the number of boardwalks, gardens, and public parks
along rivers and lakes in urban settings.
Aesthetics
• Preserve the distinctive aesthetic character and inherent beauty of the bay and its watershed.
• Design and promote development that supports privacy,
security, visual quality throughout the watershed.
Ecosystem Preservation
• Maintain and preserve wildlife corridors throughout the watershed.
72
CHAPTER 5 WATER QUALITY PROBLEMS
5.1 Threatened Designated Uses: Pollutants, Sources, and Causes For each designated use to protect in the Grand Traverse Bay watershed there are a number of different pollutants and environmental stressors that adversely affect each of the designated uses, or have the potential to (Table 19). The term environmental stressor is used to describe those factors that may have a negative effect on the ecosystem, but aren’t necessarily categorized as contaminants that change water chemistry. Examples of environmental stressors include changes to hydrologic flow, low dissolved oxygen levels, and loss of habitat.
TABLE 19: POLLUTANTS AFFECTING DESIGNATED USES IN THE
GRAND TRAVERSE BAY WATERSHED
Pollutant or Environmental Stressor Designated Uses Affected
Sediment Coldwater Fishery Other Indigenous Aquatic Life Navigation
Nutrients Coldwater Fishery Other Indigenous Aquatic Life Total Body Contact Public Water Supply
Thermal Pollution Coldwater Fishery Other Indigenous Aquatic Life
Changes to Hydrologic Flow Coldwater Fishery Other Indigenous Aquatic Life Navigation
Invasive Species
Coldwater Fishery Other Indigenous Aquatic Life Navigation Total Body Contact Public Water Supply
Pathogens (E. Coli and Fecal Coliform indicators)
Total Body Contact Public Water Supply
Loss of Habitat Coldwater Fishery Other Indigenous Aquatic Life
Note: This is a general list that encompasses pollutants for the entire Grand Traverse Bay watershed. Not all reaches in the watershed are impacted by all of the pollutants listed above.
73
Sources and Causes of Pollutants A Comprehensive Watershed Management Table was developed listing sources and causes of watershed pollutants and environmental stressors (Table 20). This table summarizes key information necessary to begin water quality protection, provides specific targets to act upon for watershed management, and forms the basis for all future implementation projects to protect the quality of the watershed. Sources and causes were identified using a wide variety of methods including: streambank erosion and road stream crossing inventories; physical inventories that note specific sources along stream reaches (such as locations of soil erosion, stormwater drains, presence of waterfowl, lawns mowed to edge of stream, etc.); review of existing subwatershed management plans; meetings with steering committee members; and personal contact with watershed residents and scientific experts on the Grand Traverse Bay watershed. TABLE 20: POLLUTANTS, SOURCES, AND CAUSES TO WATER QUALITY DEGRADATION IN THE
Improper application (amount, timing, frequency, location, method, P content) (k)
Septic Systems (s) Poorly designed, sited, and maintained (s) High density/age of systems (s)
Urban/Agricultural/ Rural Storm Water (k)
Poor storm water management practices (k) Development (k)
Lack of Riparian Buffer (k)
Development (k) Clearing by landowner (k) Lack of adequate shoreline setbacks (p)
WWTP (p) Discharge of nutrients in waste water (p)
Agriculture (p) (fertilizer, manure, & livestock)
Improper manure application (amt., timing, freq., location) (p) Improper storage/handling/application (p) Close proximity to Bay/Tributaries (p) Grazing near stream edge (p)
Animal Waste (k) Geese/ducks along shore & beach areas (k)
Nutrients
*Coldwater Fishery *Other Indigenous Aquatic Life *Total Body Contact *Public Water Supply
Reduction of Wetlands (k) Development and filling (k)
Fluctuating Water Levels (k)
Dams and lake-level control structures (k) Urban storm water runoff (k) Inc. development & imperv surfaces (k) Loss of terrestrial vegetation (k) Global warming (p)
Reduction of Groundwater Recharge (k)
Increasing develop. on recharge areas (k) Loss of terrestrial vegetation (k) Global warming (p)
Sedimentation (k) Erosion (k)
Dams, Lake-level Control Structures (k)
Dam removal (p) Changes in operation (p) Creation/destruction of beaver dams (k)
Connected Waterways (k) Unrestricted movement thru waterways (k)
Boat Hulls and Bilges (k)
Lack of restrictions on boat travel (k) Lack of public knowledge on impact (k)
Invasive Species (Eurasian Milfoil Only – Clam River)
*Coldwater Fishery *Other Indigenous Aquatic Life *Navigation
Other Biota (i.e. birds, frogs) (k) ‘Hitching’ a ride (k)
Development (including ‘re-development’) (k)
Poor development and design practices (k) Lack of knowledge on impact (k) New construction (p) Inadequate laws or regulations (p) Lack of adequate enforcement (p) Habitat fragmentation (k) Wetland loss (k)
Loss of Habitat
*Coldwater Fishery *Other Indigenous Aquatic Life
Shoreline Erosion & Stabilization (k)
Wave/ice action (k) High lake/river levels (k) Improperly designed/sited sea walls (k) Removal or lack of riparian vegetation (k)
Urban/Agricultural/ Rural Storm Water (k) Poor storm water management practices (k)
Impervious Surfaces (k)
More roads, roofs, and parking lots due to development (k)
Lack of Streamside or Shoreline Canopy and Riparian Buffer (k)
Development (k) Clearing by landowner (k)
Thermal Pollution
*Coldwater Fishery *Other Indigenous Aquatic Life
Dams, Lake-level Control Structures (k)
Top draw structures (k) Hydrology – low flows at times (k)
76
TABLE 20: POLLUTANTS, SOURCES, AND CAUSES TO WATER QUALITY DEGRADATION IN THE GRAND TRAVERSE BAY WATERSHED CONT’D
Air Deposition (k) Vehicle combustion (k) Industrial/comm./municipal facilities (k)
Urban/Agricultural/ Rural Storm Water (k) Poor storm water management practices (k)
Animal Waste (k) Geese/ducks along shore & beach areas (k) Riparian Grazing (p)
Septic Systems (p) Improperly designed and maintained (p)
Pathogens (E. Coli and Fecal Coliform indicators)
*Total Body Contact
WWTP (p) Overflowing sewer systems in high flow (p) Hydrology (p)
77
Sources and Causes of Pollutants in the Grand Traverse Bay Only An additional Comprehensive Watershed Management Table was developed for pollutants, sources, and causes to the Grand Traverse Bay only (Table 21). Why differentiate between the two? First, it is important to realize that the bay and its watershed are connected, but inherently different. What happens at the extreme outer edges of the watershed will eventually affect the Grand Traverse Bay. However, while the watershed itself encompasses rivers, streams, lakes, and 973 square miles of land, the bay is a large open body of water that is connected to Lake Michigan. Certain pollutants have more of an impact on streams and lakes than on larger bodies of water like the Grand Traverse Bay (i.e., thermal pollution and sediment), but other pollutants are more of a concern for the Grand Traverse Bay and its associated designated uses. For example, the East Arm of Grand Traverse Bay is the main source of drinking water for Traverse City and fulfills the designated use of providing a public water supply. The rest of the watershed residents mainly get their water from wells (not surface water). Additionally, invasive species are a greater concern for the Grand Traverse Bay than for areas in its watershed. (It should be noted that all of the information contained in Table 21 is also contained in Table 20, which deals with the entire watershed.)
TABLE 21: POLLUTANTS, SOURCES, AND CAUSES TO WATER QUALITY DEGRADATION IN THE GRAND TRAVERSE BAY ONLY
(COMPREHENSIVE WATERSHED MANAGEMENT TABLE)
Environmental Stressor or Pollutant
Impaired or Threatened Use
Sources K = known, S = suspected,
P = potential Causes
K = known, S = suspected, P = potential
Residential or Commercial Fertilizer Use (k)
Improper application (amount, timing, frequency, location, method, P content) (k)
Septic Systems (s) Poorly designed, sited, and maintained (s) High density/age of system (s)
Urban/Agricultural/ Rural Storm Water (k)
Poor storm water management practices (k) Development (k)
Lack of Riparian Buffer (k)
Development (k) Clearing by landowner (k) Lack of adequate shoreline setbacks (p)
WWTP (p) Discharge of nutrients in waste water (p)
Agriculture (p) (fertilizer, manure, & livestock)
Improper application (amt., timing, freq., location, method, P content) (p) Improper storage/handling/application (p) Close proximity to Bay/Tributaries (p)
Animal Waste (k) Geese/ducks along shore & beach areas (k)
Nutrients
*Coldwater Fishery *Other Indigenous Aquatic Life *Total Body Contact *Public Water Supply
Reduction of Wetlands (k) Development and filling
78
TABLE 21: POLLUTANTS, SOURCES, AND CAUSES TO WATER QUALITY DEGRADATION IN THE GRAND TRAVERSE BAY ONLY CONT’D
Poor development and design practices (k) Lack of knowledge on impact (k) New construction (p) Inadequate laws or regulations (p) Lack of adequate enforcement (p) Habitat fragmentation (k) Wetland loss (k)
Loss of Habitat
*Coldwater Fishery *Other Indigenous Aquatic Life
Shoreline Erosion and Stabilization (k)
Wave/ice action (k) High lake/river levels (k) Improperly designed/sited sea walls (k) Removal or lack of riparian vegetation (k)
Urban/Agricultural/ Rural Storm Water (k) Poor storm water management practices (k)
Motor Boats (k) Inefficient (2-cycle) or poorly maintained watercraft motors (k) Fuel spills (p)
Improper Chemical Use/Disposal (s)
Poor public knowledge of consequences (s) Lack of disposal facilities and/or limited hours of operation (s)
Air Emissions (k) Vehicle combustion (k) Industrial/comm./municipal facilities (k)
Illegal Dumping (p) Lack of restrictions and enforcement (p)
Urban/Agricultural/ Rural Storm Water (k) Poor storm water management practices (k)
Animal Waste (k) Geese/ducks along shore & beach areas (k) Livestock-access to streams near Bay (p)
Illegal Discharges from Boats (p)
Lack of enforcement (p) Lack of public knowledge on impact (k)
Septic Systems (s) Improperly designed and maintained septic systems (s)
Pathogens (E. Coli and Fecal Coliform indicators)
*Total Body Contact *Public Water Supply
WWTP (p) Overflowing sewer systems in high flow (p) Hydrology (p)
The Comprehensive Watershed Management Tables (Tables 20 and 21) may be used as a reference to distinguish what the major sources of pollutants are on a watershed-wide scale. However, they do not distinguish between pollutants and their sources and causes in individual subwatersheds. And, as stated earlier, not all of the pollutants listed are a problem everywhere in the watershed. There are differences among the nine subwatersheds making up the Grand Traverse Bay watershed. Each one is unique in the challenges it faces to maintain water quality protection. For example, the Ptobego Creek watershed is mainly a wetland type area and does not contain much development. In contrast, the Mitchell Creek watershed, just a few miles down the bay, faces extreme pressure from future development. Each must face water quality protection measures in its own way. See Section 3.9 for a discussion of each subwatershed.
80
5.2 Priority Pollutant Ranking The pollutants listed in Section 5.1 were ranked and prioritized based on the how they most affect (or have the potential to affect) the watershed’s threatened designated uses (Tables 22, 23, and 24). Overall, nutrients are a high priority pollutant for both the Grand Traverse Bay and its tributaries, while sediment is a high priority pollutant in the surrounding watershed (Table 22). Maintaining the low productivity (oligotrophic status) for Grand Traverse Bay will require minimizing the amount of nutrient pollution that enters the lake from adjacent properties and tributaries. Nutrients often attach to soil particles, thereby linking sediment and nutrient pollution. Changes to hydrologic flow, mainly due to stormwater inputs are also a concern throughout the watershed. Along with hydrologic changes, stormwater may carry an excessive amount of nutrients, sediments, and toxins to the bay and its tributaries. Additionally, the impact invasive species have on its ecosystem (both currently and in the future) is of great concern for the Grand Traverse Bay. While not a primary concern throughout portions of the watershed just yet, invasive species are already beginning to change the ecosystem and habitat dynamics in Grand Traverse Bay.
TABLE 22: POLLUTANT PRIORITIES FOR THE GRAND TRAVERSE BAY WATERSHED
Pathogens (E. Coli and Fecal Coliform indicators) 7 5
Thermal Pollution 8 -- NOTE: Even though the bay is oligotrophic and low in nutrients overall, excessive nutrient loading is still a threat, especially in shallow, near shore areas where excessive nutrients cause increased algae and plant growth. As the nutrients get washed out into the deeper bay areas, there is some dilution; therefore nutrient levels still remain low. However, if excessive inputs of nutrients continue, nutrient levels in the deeper, open water areas of the bay could increase, causing drastic and harmful changes to the bay’s ecosystem. Additionally, excessive nutrients
81
may accumulate in the sediment lining the bottom of the bay, causing sharp increases in plant growth. Each pollutant has a different effect on the threatened designated uses for the Grand Traverse Bay watershed (Table 23). For example, large amounts of bacteria in the water make the water unsafe for swimming and total body contact, but bacteria has little if any effect on navigation.
TABLE 23: POLLUTANT PRIORITIES FOR THREATENED DESIGNATED USES
Threatened Designated Use Pollutant or Environmental Stressor Priority Ranking
Coldwater Fishery
Sediment Changes to Hydrologic Flow Loss of Habitat Nutrients Thermal Pollution Toxins Pathogens Invasive Species
1 2 3 4 5 6 7 8
Other Indigenous Aquatic Life
Nutrients Sediment Loss of Habitat Changes to Hydrologic Flow Toxins Thermal Pollution Pathogens Invasive Species
1 2 3 4 5 6 7 8
Navigation Sediment Changes to Hydrologic Flow Invasive Species
1 2 3
Total Body Contact Pathogens Nutrients Invasive Species
1 2 3
Public Water Supply Nutrients Invasive Species Pathogens
1 2 3
In Grand Traverse Bay Only
Coldwater Fishery & Other Indigenous Aquatic Life
Nutrients Invasive Species Loss of Habitat Toxins Pathogens
1 2 3 4 5
82
The project steering committee noted that it is difficult to rank all the pollutants and environmental stressors in the watershed because all are important and should be priorities for maintaining the health of the bay. The pollutant ranking really depends on which area of the watershed is analyzed. In some places, sediment may be the biggest threat, while in others it could be pathogens. Almost always, the pollutants and stressors are interconnected with each other and changes in one causes changes to the others. For instance, increasing the hydrologic flow in a stream could increase the amount of sedimentation and erosion, which may then increase thermal pollution and the amount of nutrients entering the system. Additionally, losing valuable habitat in a stream could itself be the result of excessive sedimentation and subsequently affect the amount of nutrients and toxins entering the stream, as well as pave the way for invasive species to populate the area. The project steering committee has decided that the specific sources for each pollutant and stressor are the most important items to rank and prioritize in this protection plan because that is where one can actually stop pollution from entering waterways (Table 24). Additionally, as noted above, because most of the pollutants and stressors are interconnected, dealing with one source and its causes could actually reduce a number of different pollutants and stressors from affecting a stream or waterbody.
TABLE 24: POLLUTANT SOURCE PRIORITY RANKING
Environmental Stressor or Pollutant Sources Priority
RankingRoad Stream Crossings (k) 1 Bank/Shoreline Erosion (k) 2 Urban/Agricultural/Rural Storm Water (k) 3 Construction (k) 4 Oil and gas well development (k) 5 Wetland Filling (k) 6 Livestock (p) 7
Sediment
Dams, Lake-level Control Structures (p) 8
Residential/Commercial Fertilizer Use (k) 1
Urban/Agricultural/Rural Storm Water (k) 2
Lack of Riparian Buffer (k) 3 Reduction of Wetlands (k) 4 Septic Systems (s) 5 Agriculture (p) (fertilizer, manure, & livestock) 6 Animal Waste (k) 7
Impervious Surfaces (k) 1 Urban/Agricultural/Rural Storm Water (k) 2
Lack of Streamside and Shoreline Canopy and Riparian Buffer (k) 3
Thermal Pollution
Dams, Lake-level Control Structures (k) 4
84
5.3 Priority Areas Priority areas in the Grand Traverse Bay watershed are defined as the portions of the watershed that are most sensitive to environmental impacts and have the greatest likelihood to affect water quality and aquatic habitat. They are areas that may contribute the greatest amount of pollutants to the watershed, either now or in the future, and are considered targets for future water quality improvement efforts. The priority areas were identified by analyzing the Comprehensive Watershed Management Tables (Tables 20 and 21) and identifying the major areas where most of the threats to water pollution exist. Other resources used to identify the priority areas include; scientific research reports, existing subwatershed management plans, DEQ water quality reports, Grand Traverse Bay shoreline survey, field observations by the Project Coordinator, steering committee members, and personal contact with watershed residents and scientific experts on the Grand Traverse Bay watershed. The priority areas for the Grand Traverse Bay watershed cover approximately 58% of the watershed (563 square miles) and include the following areas (Table 25, Figure 17):
• Riparian Corridors: Areas within 1,000 feet of bodies of water (i.e. Grand Traverse Bay, rivers and streams, lakes)
• Wetlands: All wetlands and areas within 1,000 feet of wetlands identified in the SWAMP (done by NWMCOG)
• City and Village Centers: Urban areas that drain to surface waters via storm sewers. • Headwater Areas: Areas where there is a greater amount of groundwater recharge.
(Data on exact delineation of these areas are still needed for the entire watershed. These areas are not included in Figure 17.)
TABLE 25: PRIORITY AREAS IN THE GRAND TRAVERSE BAY WATERSHED
Priority Area Top Priority Pollutant(s) Contributing Priority Causes
GT Bay Nutrients Fertilizer, Stormwater, Lack of buffers
Riparian corridors Tributaries
& Lakes Sediment Nutrients
Sediment: Road crossings, Bank erosion, Stormwater, Wetland filling Nutrients: Fertilizer, Stormwater, Lack of buffers
Wetlands Sediment Nutrients
Sediment: Wetland filling Nutrients: Reduction of wetlands
City and Village Centers Sediment Nutrients Changes to Hydro Flow
Stormwater
Headwater areas Sediment Changes to Hydro Flow Development
CHARLEVOIX COANTRIM CO
CHARLEVOIX COANTRIM CO
ANTRIM COKALKASKA CO
ANTRIM COKALKASKA CO
AN
TR
IM C
OO
TS
EG
O C
OA
NT
RIM
CO
OT
SE
GO
CO
GR
AN
D T
RA
VE
RS
E C
OK
AL
KA
SK
A C
OG
RA
ND
TR
AV
ER
SE
CO
KA
LK
AS
KA
CO
LEELANAU COGRAND TRAVERSE CO
LEELANAU COGRAND TRAVERSE CO
NorthportNorthport
SuttonsBay
SuttonsBay
Traverse City
Traverse City
ElkRapids
ElkRapids
KingsleyKingsley
KalkaskaKalkaska
MancelonaMancelona
BellaireBellaire
CentralLake
CentralLake
EllsworthEllsworthEast
JordanEast
Jordan
BoyneCity
BoyneCity
FifeLakeFifeLake
BoyneFalls
BoyneFalls
GaylordGaylord
ElkLake
TorchLake
LakeLeelanau
LongLakeLongLake
DuckLake
GreenLake
GreenLake
LakeLeelanau
LakeLeelanau
OtsegoLake
OtsegoLake
LakeCharlevoix
LakeCharlevoix
SouthArm
SouthArm
LakeBellaire
ManisteeLake
ManisteeLake
IntermediateLake
LakeSkegemog
Manistee Rive
r
Manistee Rive
r
Rapid River
Jordan River
Jordan River
N. Br. Boardman Rive
r
SpiderLake
Boardma n River
0 4 8 122Miles
0 5 10 152.5Kilometers
GRAND TRAVERSE BAY WATERSHEDFIGURE 17: PRIORITY AREAS
Legend
Lakes & Ponds
Rivers & Streams
Political Boundaries
Grand Traverse Bay Watershed
Priority Areas Identified:
-Riparian Corridors: Areas within 1000 feet of bodies of water.-Wetlands: All wetlands and areas within 1000 feet of wetlands.-City & Village Centers: Urban areas that drain to surface water via storm sewers.
12/16/03
Map produced by:
86
Specific Priority Areas: Boardman River Watershed and Leelanau County In order to maintain the high quality resources of the Grand Traverse Bay watershed, it is essential to address known sources of pollution while at the same time working towards the reduction of future sources of pollution and watershed disturbance. Protecting priority areas associated with Grand Traverse Bay and its tributaries through purchase, donation, or conservation easement are excellent strategies to meet this objective. There are two local land conservancies using these strategies to protect land in the Grand Traverse Bay watershed: the Grand Traverse Regional Land Conservancy and the Leelanau Conservancy. In cooperation with these entities, private parcels of land in the Boardman River watershed and Leelanau County were reviewed for their potential contribution to improving the water quality of Grand Traverse Bay and its watershed. Both conservancies utilized geographic information systems (GIS) to assist in delineating priority parcels. The reports are summarized below, for a complete copy of each report please contact The Watershed Center. Boardman River The Grand Traverse Regional Land Conservancy developed three primary goals for the parcel prioritization of the Boardman River watershed, which spans both Grand Traverse and Kalkaska counties. These goals included preserving water quality, conserving the diversity and quantity of vital ecological areas, and promoting the spatial integrity of the landscape. Identifying which areas are vital to meeting these goals was accomplished by taking into account a variety of key factors, called conservation drivers. Areas of high ecological importance with significant water quality impact were determined on a parcel by parcel basis by considering the following conservation drivers: acreage; unfragmented landscapes; the spatial location of both small and extensive tracts of wetland and riparian ecosystems; adjacency to protected lands; endangered or threatened flora and fauna; and groundwater recharge areas. Additionally, the threat of development and the history of landowner contact were considered in order to determine the feasibility of pursuing a land conservation option. After each conservation driver was considered and a score was awarded for every parcel, all conservation driver scores were then summed for every parcel, resulting in a final prioritization scheme which shows the most desirable geographic areas, as high, medium, or low priority, for proactive land preservation efforts within the Boardman River Watershed (Figure 18). The Grand Traverse Regional Land Conservancy emphasizes that the results are an accurate representation of parcel prioritization in the Boardman River watershed since seven of the top thirteen scored parcels are already active land protection projects through the GTRLC and an additional five priority parcel landowners have already been contacted by conservancy staff. These results prove through an organized method that the parcels already targeted by earlier, intuitive methods are, in fact, priority areas in the Boardman River watershed. Leelanau County The Leelanau Conservancy identified areas of Leelanau County whose protection is integral to maintaining the high water quality of Grand Traverse Bay and its associated tributaries. To determine priority areas for land conservation efforts that will most effectively maintain and improve water quality, several key parameters were investigated on a parcel by parcel basis and compared across the watershed: size; proximity to wetlands; proximity to surface water; and
87
proximity to permanently protected land (i.e., conservation easements or Leelanau Conservancy Natural Areas). These factors were all considered to be vital in determining the priority protection areas. Parcels that were found to contain surface water and wetlands were designated as ‘High’ priority for land protection. Parcels that were found to contain surface water and wetlands while in addition to being adjacent to permanently protected areas were given the ‘Highest’ level of priority for land protection efforts. Priority protection areas were identified by incorporating the results of the parcel prioritization process with on-the-ground investigations and aerial photograph review of the high and highest priority parcels (Figures 19A-D). In some cases, areas were identified as having a high priority for protection but when looked at from an aerial photograph or by walking the property, it was determined that land protection efforts would not be appropriate for such areas. In some cases there were also parcels that were not identified as being the highest land protection priorities through the GIS process due to the fact they were not considered to be adjacent to permanently protected areas, but after further analysis, they were then determined to be part of highest protection areas. Land Protection staff from the Leelanau Conservancy will attempt to establish landowner contact and work with the highest priority parcels followed by the high priority parcels within each of the priority protection areas. Land protection options will emphasize the donation or purchase of conservation easements on parcels within the priority protection areas.
Specific Priority Area: Grand Traverse Bay Shoreline Because of its sheer size and ability to affect the water quality of the bay, the entire shoreline of Grand Traverse Bay is deemed a priority area. As part of the Grand Traverse Bay Watershed Planning Project, The Watershed Center (TWC) completed a shoreline inventory of the entire 132-mile shoreline of the Grand Traverse Bay. The Grand Traverse Baykeeper, John Nelson, along with TWC staff and local volunteers, walked and inventoried the bay’s shoreline in order to assess the current conditions surrounding the bay. Results for this survey were compiled into a final report (Appendix C) and were also placed onto TWC’s website (www.gtbay.org) into a searchable database. During the survey, inventory field sheets were used in conjunction with 1992 series USGS digital ortho-quad aerial photographs and the shoreline was divided into segments containing similar characteristics. Features such as nearshore substrate (clay, sand, stones, rock, macrophytes, etc.), endangered and exotic plant species, streams, seeps, public access, human impact (shore hardening, beach alterations), and beach characteristics (sand/stone/rock, bluffs, dunes, wetland, beach width) were noted as either specific points or as general segment characteristics. A
Example of shore hardening using large rock rip-rap.
specific point was noted if it was only seen a few times along a segment, otherwise, if a feature was common it was noted as a segment characteristic. Features and beach segments were indicated by letters on the photos and keyed by letter on the inventory sheets. The inventory found significant increases in shoreline hardening compared to a similar study done in 1958 by the MSU Department of Resource Development’s Agricultural Experiment Station. Other changes include the building of groins and the “creation” of beaches by moving the stones into groins, as well as the construction of marinas, both public and private, with their associated dredging. Also noted were considerable increases in algae growth on benthic substrates in the bay over the past 10 years, including significant carpets (or mats) of cladophora and chara growing on the substrate. More than one hundred small streams were observed flowing into the bay. Both land development as well as economic development place pressure on the need for small shoreline communities to properly dispose of their wastewater. The discharge of wastewater, from both failing septic systems and over-taxed treatment facilities, has the potential to dramatically degrade the water quality of the bay. Added nutrients from wastewater would increase the amount of algae and plants noted in the water, causing even more of an increase than what was noted in this survey. Intense development increases the amount of stormwater discharge to the bay, due to increases in impervious surfaces. Numerous stormwater discharge pipes were noted entering the bay in Traverse City, as well as significant increases in the amount of impervious surfaces covering land adjacent to the bay.
“In the past many activities have been undertaken in these beach areas with little or no awareness of the dynamic, ever changing properties of a shoreline area. Use must be planned in accordance with the natural characteristics and natural changes; otherwise the user may expect problems that are not only unpleasant, but expensive,” (MSU 1958 historical shoreline inventory).
90
FIGURE 19A: LEELANAU COUNTY PRIORITY PROTECTION AREAS –
NORTHERN SECTION, CATHEAD POINT
LEGEND
Village of Northport
Northport
Suttons Bay
Traverse City
91
FIGURE 19B: LEELANAU COUNTY PRIORITY PROTECTION AREAS OMENA BAY AREA
LEGEND
Omena Bay
Suttons Bay
Village of Northport
92
FIGURE 19C: LEELANAU COUNTY PRIORITY PROTECTION AREAS – SUTTONS BAY AREA
LEGEND
Suttons Bay
Stoney Point
Lee Point
LEGEND
93
FIGURE 19D: LEELANAU COUNTY PRIORITY PROTECTION AREAS – SOUTHERN SECTION, CEDAR LAKE AREA
LEGEND
94
During construction, vegetation is cleared and the development site is graded to prepare for construction. With the trees and topsoil removed, soils are particularly susceptible to erosion. Photo Copyright 2000, Center for Watershed Protection
5.4 Pollutants of Concern Sediment
Sediment is fine inorganic soil or sand particles and sedimentation is the process whereby sediment is deposited in a stream or lake bottom. It occurs naturally in all stream and lake environments due to land erosion by wind and water. However, excessive sedimentation can severely degrade an entire riparian system (Waters 1995) and has been identified as a major cause of degradation to aquatic life in many Michigan streams and rivers (DEQ 1998). Excessive sediment deposition in many of Michigan’s streams also severely impacts the amount of suitable habitat needed to support healthy and diverse communities of fish and fish food organisms. When sediment enters a stream it covers gravel, rocky, and woody habitat areas, thereby leading to decreases in habitat diversity and aquatic plant production. Sedimentation caused by streambank erosion may increase channel widening and cause changes in stream water temperatures. Significant sources of sediment to streams include activities that cause streambank erosion such as road/stream crossings, increased flow levels (rapidly changing stream levels), boat traffic, removing streamside vegetation, users entering and exiting the river, recreational trails that cross streams and historical logging practices. Other sources are clearing land for agriculture, development, or other purposes. This also creates a host of other erosion related problems including flooding, polluted runoff, loss of topsoil from surface runoff, and a reduction in fisheries and channel depth. Any kind of excavation, earth moving, drainage, bridging, tunneling, or other activity in which soil is disturbed can result in sediment transport to nearby streams. Alexander and Hansen (1988) report that increases in sediment erosion from development are detrimental to aquatic communities. Increased sediment loads also will continue past the development construction phase due to the resulting increase in stormwater runoff from the newly created impervious surfaces. Roads, rooftops, and parking lots are examples of impervious surfaces that replace rural and forestland during development. Development results in decreased water-retention capacities, increased flood frequencies, and rapid filling of stormwater detention systems. Agricultural grazing on or near streambanks also may contribute to increased sedimentation in streams. Most effects of grazing in riparian areas include increased fine-sediment generation and channel widening caused by bank exposure and animal access, sediment entering from slumping streambanks, increased deposition on the streambed, and much greater streambank damage from storm events (Kauffman et al. 1983, Sheffield et al. 1997).
95
Road stream crossings, like this one shown on the Rapid River in Kalkaska County, are a common source of sediment to streams. Photo courtesy of the Kalkaska Conservation District
Sediment is identified as a major pollutant present in the Grand Traverse Bay watershed based on field inspections and inventories conducted throughout the watershed, as well as through existing research and historical evidence. Significant known sources of sediment include streambank erosion and road/stream crossings, surface runoff, and construction zones. Recent surveys show that there are at least 486 road stream crossings in the Grand Traverse Bay watershed; 46 of them currently ranked as having severe erosion (Figure 20, Table 26). In addition, there are 357 documented streambank erosion sites along the Boardman River alone, 129 of which are ranked as severe (Table 26). Depending on the severity and number of erosion sites and road stream crossings, a significant amount of sediment, and, subsequently, phosphorus (P) and nitrogen (N) may be released into river systems. In the Boardman River watershed it is estimated that severe erosion sites contribute at least 810 tons of sediment each year, in addition to more than 900 lbs of P and 1,800 lbs of N (Table 27). The 129 documented severe streambank erosion sites on the Boardman River contribute an additional 1,000 tons of sediment, 1200 lb of P, and 2,300 lb of N each year (Table 28). It should be noted that these are approximate values and specific erosion and sediment loading calculations were not performed for each site inventoried due to time and budget constraints. General estimates were used for typical minor, moderate, and severe sites for each subwatershed. Estimates for soil loss and erosion were obtained from two resource professionals (from different watershed areas). These are rough estimates only and are based on their best professional judgment, but Tables 27 and 28 show that these estimates can vary widely. For example, a typical severe road stream crossing on the Boardman River or Mitchell Creek can contribute more than 30 tons of sediment each year, but a severe site in the Chain of Lakes watershed is said to contribute only 10 cubic yards (or 12.5 tons) each year. Additionally, only those river systems that were defined as navigable with a canoe were inventoried for streambank erosion (i.e. Boardman River and Elk River Chain of Lakes). Previously available streambank erosion information for other streams is noted where applicable (Table 26). It was also noted by a resource professional from the Grand Traverse Conservation District that, in their opinion, road stream crossing rankings and subsequent sediment loading estimates should not differ between subwatersheds because road stream crossings and their severity are a function of the particular factors surrounding the road (width, slope, etc.), and not dependent upon stream size. This is why the sediment loading estimates for Mitchell, Acme, Ptobego, and Yuba Creeks are the same as Boardman River. According to the Grand Traverse Conservation
96
District, a severely rank road stream crossing on Yuba or Mitchell Creek will have the same sediment load as one on the Boardman River. Following along these lines, immediate impacts from severe and moderate ranked road stream crossings would be more harmful to smaller streams like Yuba and Acme Creeks than to larger streams like the Boardman River. This is because the Boardman River has stronger flows that have the ability to flush the sediment along the river and transport it out of the system, unlike the smaller creeks which do not receive this ‘flushing flow’. Sediment will tend to linger in these smaller streams longer because flows will not be strong enough to transport it out of the system.
TABLE 26: ROAD STREAM CROSSING AND STREAMBANK EROSION INVENTORIES IN THE GRAND TRAVERSE BAY WATERSHED
Inventory Organization Results
Boardman River and Tributaries* 457 erosion sites identified (100 road stream crossings, 357 streambank)
269 shoreline property sites exhibiting evidence of visible, accelerated erosion. (Estimate each shoreline parcel as 100 feet.) (Includes a shoreline erosion inventory on only lakes and major connecting rivers in the Chain of Lakes system. Results do not include pictures or specific measurements.)
97
TABLE 26: ROAD STREAM CROSSING AND STREAMBANK EROSION INVENTORIES IN THE GRAND TRAVERSE BAY WATERSHED CONT’D
Inventory Organization Results
Elk River Chain of Lakes (Rapid River – Kalkaska County)
Reported Road Crossings: 3 severe West Hansen Road Day Road West Old M-72
Streambank Erosion Sites: None *Other Notes: 15,000 yd3 of sediment in Rapid River between Arwood Road Bridge and Torch River that needs to be dredged and/or sand trapped and removed.
Conservation Resource Alliance (Formerly Northwest MI RC&D) (Updated info from Grand Traverse Conservation District)
Road Stream Crossings (17 total) Severe: 0 Moderate: 10 Minor: 7 (includes 5 recently fixed sites) Unranked: 0 Streambank Erosion Sites (3 total) Severe: 0 Moderate: 3 Minor: 0 Since inventory, 4 moderate and 1 unranked road stream crossings sites and 1 minor streambank erosion site have been fixed (table reflects new data).
Yuba Creek
Road Stream Crossing and Nonpoint Source Pollution Inventory – 2005
Grand Traverse Conservation District
Road Stream Crossings (12 total) Severe: 2 Moderate: 4 Minor: 4 Unranked: 2 Other sites where nonpoint source pollution was noted: 7
Ptobego Creek
Road Stream Crossing and Nonpoint Source Pollution Inventory – 2005
Grand Traverse Conservation District
Road Stream Crossings (13 total) Severe: 3 Moderate: 2 Minor: 8 Unranked: 0 Existing road crossing site information also contains notes on other source of nonpoint source pollution.
Notes: Old Mission Peninsula subwatershed has no road stream crossings. Data compiled from listed organizations, meetings with resource professionals (to determine any work completed since inventories), and GIS mapping analysis. Where applicable, see specific reports for details. All reports are on file at The Watershed Center office. * The Boardman River watershed inventory was not completed by the time of printing – the inventory was approximately 80% complete (missing 10 miles of Boardman River main stem, 8 miles of North Branch and other tributaries). Completion is expected by spring 2006.
99
TABLE 27: ROAD STREAM CROSSING EROSION ANALYSIS BY SUBWATERSHED
Notes: * Boardman River, and Mitchell, Acme, Yuba, and Ptobego Creek erosion estimates provided by Grand Traverse
Conservation District (1 yd3 soil ~ 1.5 ton ~ 3,000 lbs) ** Elk River Chain of Lakes (Antrim County) erosion estimates provided by Antrim Conservation District (1 yd3 soil
~ 2800 lbs; 1 ton ~ 2240lbs) *** Elk River Chain of Lakes (Kalkaska County) erosion estimates provided by Kalkaska Conservation District **** West Bay Shoreline and Tributaries subwatershed road crossing survey did not include estimates for sediment
erosion. However, since this subwatershed is mostly non-residential, where the land uses are primarily open grassland, forest, and agriculture, erosion estimates from the Elk River Chain of Lakes and East Bay Shoreline and Tributaries subwatersheds (from Antrim Conservation District), which has similar land use characteristics, were used.
Streambank erosion sites along Kid’s Creek in Traverse City
101
TABLE 28: STREAMBANK EROSION ANALYSIS BY SUBWATERSHED
Subwatershed Average Erosion for Severity Type
# of Each Type Soil Loss/yr Phosphorus
Load/yr Nitrogen Load/yr
Severe: dam removal is required at this site n/a n/a n/a n/a
Note: The remaining subwatersheds were not inventoried for streambank erosion because they did not meet the survey threshold of being navigable by canoe. These subwatersheds were: West and East Bay Shoreline and Tributaries, Yuba Creek, Ptobego Creek, Old Mission Peninsula, Acme Creek and Mitchell Creek. However, Acme, Mitchell, and Yuba Creek all have streambank erosion sites noted on their inventory reports – see Table 26 for a listing of these sites. See reports on file at The Watershed Center for more details regarding these erosion sites. Calculations used to determine phosphorus and nitrogen load for Tables 27 and 28 were taken from the MDEQ Pollutants Controlled Manual (DEQ 1999). More discussion regarding calculating streambank and shoreline erosion, as well as phosphorus and nitrogen loads is in Section 7.2.
Typical Impacts from Sedimentation Impact #1: Sand and sediment harm aquatic life by covering natural stream and lake
substrate, which fish and prey species rely upon for spawning and feeding. Impact #2: Sediment also increases turbidity, decreasing visibility and clogging fish and
insect gills. Turbid stream flow also dislodges fish eggs and insect prey. Impact #3: When more sand and sediment is deposited than can be moved by stream flow,
water levels are raised, causing streambank erosion and potential flooding. Excessive sedimentation may also fill lakes, ponds, and wetlands.
Impact #4: Nutrients, heavy metals, and other pollutants can attach to finer sediment
particles and enter the water when suspended. Impact #5: Excess sedimentation can potentially impair navigation by making the water too
shallow for boats and boat access.
103
Rooted aquatic plants (bulrushes) in Grand Traverse Bay
Nutrients Nutrients are elements such as nitrogen, phosphorus, carbon, sulfur, calcium, potassium, iron, manganese, boron, and cobalt that are essential to the growth of living things. In particular, nitrogen (N) and phosphorus (P) are critical nutrients for all types of plants, including aquatic species. The N requirements of these species are typically about 10 times that of P. Because N/P ratios exceed 10:1 in most freshwater systems (including Grand Traverse Bay watershed), N is not usually the limiting nutrient. In Michigan, rooted aquatic vegetation and algal growth are most commonly limited by the amount of P in the water column. Ordinarily, as the amount of P in the water column increases, rooted plant and algal growth increase as well. Generally speaking, total P concentrations greater than 10ug/L may contribute to increased aquatic plant growth and are indicative of impaired water quality. Since 2000, P concentrations in Grand Traverse Bay have ranged between 3.5 and 8.3 ug/L. When elevated levels of P occur in the water column, rooted plant and algae growth can be quite excessive, resulting in nuisance conditions. Blooms of algae resulting from nutrient enrichment eventually die and decompose, removing oxygen from the water and potentially leading to levels of dissolved oxygen that are insufficient to sustain aquatic life (Allan 1995). In terms of water quality, nutrients have a negative impact on the system when their concentrations exceed natural background levels. This condition can effectively reduce the recreational value of the waters by making the water unpleasant and undesirable for swimming, fishing, or boating due to increased algae and aquatic plant growth. Nutrients speed up the natural aging process of lakes and ponds. This process is called eutrophication. The signs of an aging water body are deeper bottom sediments and heavy weed growth. This aging process would normally be measured in hundreds of thousands of years if not for the added sediments, fertilizers, and other organic wastes supplied by runoff from a developed watershed. Sources of nutrients to the Grand Traverse Bay watershed resulting from human activities include stormwater runoff from agricultural, residential, and urban areas (see Section 5.5 for a discussion on stormwater), commercial fertilizer use (by residents, businesses, golf courses, and agricultural operations), and runoff from animal waste (from both residential and agriculture sources).
104
Fertilizers applied to residential lawns are a significant source of nutrient input in the watershed.
Evidence of locally increased concentrations of nutrients, and most likely P, in the bay is seen by the increase in the amount of weed and macrophyte beds, which nearly doubled from 1991 (64 areas) to 1998 (124 areas). These numbers are still low overall compared to the size of the bay, however, the growths are most concentrated at the south end of West Grand Traverse Bay which is attributed to rapid development and nutrient flushing from stormwater inputs, and a higher amount of phosphorus entering the bay. Fertilizers are a large source of nutrient input the watershed. Since phosphorus (P) is most often the limiting nutrient in aquatic systems, phosphorus concentrations in fertilizers and consequently in runoff from lawns has a dramatic impact in the watershed. While no detailed studies involving nutrient runoff from lawns are available for the Grand Traverse Bay watershed, information from lawn studies done in Wisconsin indicate a large amount of P in the water stemming from fertilizer use. One study conducted in an urban area reported that lawns accounted for 24% of runoff volume, but 56-70% of P export (Waschbusch et al. 1999). Another study conducted on a lake with 70% of its shoreline developed with lawns mowed to the water’s edge reported that lakeshore lawn drainage area provided just 4% of the water inflow to the lake, but comprised 51% of the total P input (Garn 2002). The same study measured total P concentrations in runoff for different fertilizer categories (no fertilizer, no-P fertilizer, and regular fertilizer) and found that total P concentrations in runoff from lawn sites with the no-P fertilizer applications were similar to that of unfertilized sites (Garn 2002). This indicates that no-P fertilizer use may be an effective, low-cost practice for reducing P in runoff. Fertilizers and other pollutants used on agricultural lands in the watershed may also be of concern. Agricultural lands in the Grand Traverse Bay watershed consist mostly of row crops and orchards/vineyards (Table 9). Fruit orchards of cherries and apples as well as vineyards dominate agricultural land uses surrounding the bay (Figure 7). Orchards and vineyards by nature do not get fertilized often and do not have a high potential for soil erosion, although there is significant potential for ‘wind drift’ of sprayed on pesticides. Other types of agriculture lands, like row crops and permanent pasture areas, however, may potentially have high soil erosion and nutrient runoff rates. Row crops (i.e., potatoes, hay, corn, small grains, etc.) are mainly found in outlying watershed areas of Antrim, Kalkaska, and Grand Traverse Counties. Currently there are approximately 120 mi2 of cropland located in priority areas of the Grand Traverse Bay watershed (Table 29). Figure 21 shows how much of each type of agriculture are located in designated priority areas (see Section 5.3 for a discussion of priority areas).
105
The potential for nutrient pollution coming from fertilized croplands largely depends on the frequency, rate, and time of year fertilizer is applied, runoff rates, and the proximity to a water source. Aerial shot of small farms in Leelanau County with orchards, crops, and windbreaks. Photo courtesy USDA-NRCS
TABLE 29: AGRICULTURAL LAND USES IN GRAND TRAVERSE BAY WATERSHED
PRIORITY AREAS
Land Use Acres Square Miles Cropland 77,765 122 Orchards 29,324 45.8 Confined Feeding 15 0.02 Permanent Pasture 3,495 5.5 Other Ag Lands 539 0.8
Another potential source of nutrient enrichment in the Grand Traverse Bay watershed is from septic systems. Septic systems are used to treat and discharge wastewater from toilets, wash basins, bathtubs, washing machines, and other water-consumptive items, many of which can be source of high pollutant loads. They are particularly common in rural or large lot settings, where centralized wastewater treatment systems are not economical. Nationally, one out of every four homes uses some form of septic system, with a combined discharge of over one trillions gallons of waste each year to subsurface and surface waters (NSFC 1995). According to the Northwest Michigan Council of Governments, there are approximately 28,000 housing units in the Grand Traverse Bay watershed that are not located in areas with sewer service and most likely are serviced by a septic system. This is just over half of all the housing units in the entire watershed. Of those 28,000 housing units, approximately 21,000 are located in a watershed priority area (Figure 22).
106
A septic system consists of two basic parts: a septic tank and a soil absorption field or drainfield. Wastes flow from the house into the septic tank where most solids are separated to the bottom and are partially decomposed by bacteria to form sludge. Some solids float and form a scum mat on top of the water. The liquid effluent from the septic tank, carrying disease-causing organisms and liquid waste products, is discharged into the soil absorption field. In the absorption field, the water is further purified by filtration and decomposition by microorganisms in the soil. The semi-purified wastewater then percolates to the groundwater system. Image and information courtesy of MSU Institute for Water Research: www.iwr.msu.edu/edmodule/water/septic
A failing septic system is considered to be one that discharges effluent with pollutant concentrations exceeding established water quality standards. Failure rates for septic systems typically range between one and five percent each year (De Walle 1981) but can be much higher in some regions (Schueler and Holland 2000, Article 123). According to data from the National Environmental Service Center’s 1992 and 1998 summary of the status of onsite wastewater treatment systems in the United States, the septic system failure rate for the counties located in the Grand Traverse Bay watershed is 1.14%. This means that of the 28,000 homes with septic systems in the watershed, about 319 are currently failing, 239 of which are in the designated priority area. Identifying and eliminating these possible failing septic systems will help control contamination of ground and surface water supplies in the watershed from untreated wastewater discharges. The best way to prevent septic system failure is to ensure that a new system is sited and sized properly and to employ appropriate treatment technology and maintenance. Design requirements will vary according to local site factors such as soil percolation rate, grain size, and depth to water table. The effectiveness of septic systems at removing pollutants from wastewater varies depending on the type of system used and the conditions at the site. The fact is, even a properly operating septic system can release more than 10 pounds of nitrogen per year to the groundwater for each person using it (Septic System Fact Sheet – www.stormwatercenter.net). The average pollutant removal effectiveness for a conventional septic system is as follows: total suspended solids – 72%, biological oxygen demand – 45%, total nitrogen – 28%, and total phosphorus – 57% (USEPA 1993). This shows that even properly operating conventional septic systems have relatively low nutrient removal capability, and can be a cause of eutrophication in lakes and coastal areas.
Although not identified as a known pollutant in the watershed, failing and improperly maintained septic systems are a concern in rural places of the watershed with no sewer service and increasing development such as in the Elk River Chain of Lakes and Leelanau County. More in-depth research is required to get a better idea of the specific amount of pollution coming from failing septic systems in the watershed.
Typical Impacts from Excessive Nutrients Impact #1: Increased weed and algae growth impact water recreation and navigation. Impact #2: Decomposition of algae and weeds removes oxygen from lakes, harming aquatic
life and reducing the recreational and commercial fishery. Impact #3: Exotic plant species like Eurasian Watermilfoil and Purple Loosestrife can better
compete with native plants when nutrients are abundant. Impact #4: Some algae (i.e., blue-green algae) are toxic to animals and humans and may
cause taste and odor problems in drinking water. Impact #5: High nitrogen levels in drinking water are a known human health risk.
Grand Traverse Bay WatershedFigure 22: Septic Systems in Priority Areas
Map Date: 31 October 2005Map Produced By:
LegendWatershed BoundaryPriority AreasAreas with Sewer Service
¨Data Source: Michigan Center for Geographic Information, Michigan Geographic Framework Version 4b
110
Thermal Pollution Not normally thought of as a pollutant, heated stormwater runoff and elevated stream temperatures are a concern in developing watersheds like the Grand Traverse Bay watershed. When water temperature increases, its ability to hold dissolved oxygen decreases, thereby reducing the available amount of oxygen in the water to fish and other aquatic life. Temperature also influences the rate of physical and physiological reactions such as enzyme activity, mobility of gases, diffusion, and osmosis in aquatic organisms. For most fish, body temperature will be almost precisely the temperature of the water. So, as water temperature increases, a fish’s body temperature increases, which changes their metabolic rate and other physical or chemical processes as well. When thermal stress occurs, fish cannot efficiently meet these energetic demands (Diana 1995). By far, the greatest amount of thermal pollution in the Grand Traverse Bay watershed is the result of heated runoff from paved surfaces and the removal of shade vegetation along streams and lake shorelines (see Stormwater discussion in Section 5.5). Thermal pollution also occurs through industrial discharges of warmed process water, solar warming of stagnant pond water and stormwater, and from discharges of warmed water behind dams and other lake-level control structures. Major dams in the Grand Traverse Bay watershed include hydro-electric dams along the Boardman River and in the Elk River Chain of Lakes. However, there are many more lake-level control structures located throughout the entire Grand Traverse Bay watershed. Excessive inputs of sediment into streams and lakes may also contribute to thermal pollution. Sediment inputs can fill stream pools and lakes, making them shallower and wider and, consequently, more susceptible to warming from solar radiation. Changes in climate due to global activities also may enhance the degree of thermal pollution in a watershed. Average global surface temperatures are projected to increase by 1.5oC to 5.8oC by the year 2100 (Houghton et al. 2001). Increases in surface temperatures may increase stream water temperatures as well, although impacts will vary by region. Overall, increases in stream water temperature will negatively affect cold-water aquatic species. For example, cold-water fish, such as trout and salmon, are projected to disappear from large portions of their current geographic range in the continental United States due to an increased warming of surface waters (Poff et al. 2002).
Typical Impacts from Thermal Pollution
Impact #1: Surges of heated water during rainstorms can shock and stress aquatic life, which have adapted to cold water environments. Aquatic diversity is ultimately reduced. Constant heating of rivers and lakes ultimately changes the biological character and thus the fishery value.
Impact #2: Thermal pollution decreases the amount of oxygen available to organisms in the
water, potential suffocating them. Impact #3: Warm water increases the metabolism of toxins in aquatic animals. Impact #4: Algae and weeds thrive in warmer waters.
111
Toxins Toxic substances such as pesticides, herbicides, oils, gas, grease, and metals often enter waterways unnoticed via stormwater runoff. These types of toxins are perhaps the most threatening of all the watershed pollutants because of their potential to affect human and aquatic health. It is highly probably that at any given moment, somewhere in the watershed there is a leaking automobile radiator, a landowner applying herbicides or pesticides to their lawns, or someone spilling gasoline while filling up their car. Every time it rains, these toxic pollutants are washed from the roads, parking lots, driveways, and lawns into the nearest storm drain or road ditch, eventually reaching nearby lakes and streams. Each winter, hundreds of tons of road salt and sand are spread over area roadways; when spring rolls around, it all gets washed into the nearest waterway. Additionally, farms, businesses, and homes throughout the watershed are potential sites of groundwater contamination from improperly disposed and stored pesticides, solvents, oils, and chemicals. Two examples of noted toxic pollution to groundwater in the watershed from businesses are the trichloroethylene (TCE) plume in Mancelona (Skillings 1982) and the Cone Drive Textron site in Traverse City. Most of the pollution from toxic substances in the Grand Traverse Bay watershed comes from stormwater and urban runoff containing oils, grease, gasoline, and solids (see Stormwater discussion in Section 5.5). Urban areas with high amounts of imperviousness such as those found in Traverse City, Elk Rapids, Suttons Bay, Northport, and Kalkaska all contribute toxic substances to the watershed during storm events when water runs off streets, parking lots, and roofs, and enters storm drains leading to the area streams and lakes, and eventually, Grand Traverse Bay. There is also widespread atmospheric mercury deposition into Michigan’s surface waters. The organic form of mercury, methylmercury, is a highly bioaccumulative toxic pollutant that is hazardous to wildlife and human health. Elemental mercury is converted to the organic form through natural processes, particularly in inland lakes. This has caused elevated mercury concentrations in inland lake sediments (Evans et al., 1991) and fish tissues (Day 1997) throughout the state. As a result, there is a statewide, mercury-based fish consumption advisory that is applied to all of Michigan’s inland lakes (MDNR 1997).
entire reaches of a stream to be killed off if the concentrations of contaminants are high enough.
Impact #2: Persistent toxic pollution in a stream may put human health and recreation at
risk. Impact #3: Contaminated groundwater may pose a problem for homes and businesses
throughout the watershed that rely upon groundwater wells for their drinking water. This poses a risk to human health and often requires difficult and costly cleanup measures.
112
Changes to Hydrologic Flow Sometimes excessive hydrologic flow in a watershed system may cause problems. The term hydrologic flow encompasses all the factors affecting the stream flow and discharge in a watershed. By far, the most notable and significant alteration in stream flow is caused by urban and stormwater runoff (see Stormwater discussion in Section 5.5). Stream channel shape, meander pattern, base flow, and storm flow characteristics are largely determined by watershed runoff characteristics. Hydroelectric facilities, lake-level control structures, excessive sedimentation, and channelization by road culverts are additional sources of fluctuations in hydrologic flow. Surges of water from dams and lake-level control structures may cause peak stream flows to increase, leading to unstable bottom substrates, flooding and sedimentation which destroys aquatic habitats and causes property damage (while also changing stream hydrology further). Changes in hydrologic flow may also be affected by the amount of groundwater recharge in the watershed. As more and more development paves over forests and fills wetlands, valuable recharge areas are cut off, and stream base flows may eventually be affected. Freshwater ecosystems, such as the Grand Traverse Bay watershed, have specific requirements in terms of the quantity, quality, and seasonality of their water supplies. In order for the system to be sustainable, it must fluctuate within a range of natural variation. If the quantity of the water flow through a system is disrupted, long-term sustainability within the system will be lost.
Typical Impacts from Changes to Hydrologic Flow Impact #1: Deviations in storm flow caused by increased runoff from paved surfaces or
channeled flow through culverts often causes erosion of the stream channel, which leads to sedimentation problems.
Impact #2: In some stream reaches, storm surges can spill over banks causing localized
flooding, endangering humans and causing widespread economic damage. Impact #3: Severe fluctuations in stream flow may disrupt aquatic habitat and strand aquatic
organisms, while also interfering with recreational uses of the river.
113
Rusty Crayfish
Zebra Mussels
Invasive Species Invasive species (also called exotic or non-native species) have threatened the Great Lakes ever since Europeans settled in the region. Exotic species are organisms that are introduced into areas where they are not native. While many exotic species are introduced accidentally, others are intentionally released, often to enhance recreational opportunities such as sport fishing. The Pacific salmon, which was purposely stocked in the Great Lakes, is an exotic species, but they are not a "nuisance" species. Species are considered a nuisance when they disrupt native species populations and threaten the ecology of an ecosystem as well as causing damage to local industry and commerce. Without pressure from the competitors, parasites, and pathogens that normally keep their numbers in check, invasive species, may undergo large population increases. Since the 1800s, more than 140 exotic aquatic organisms of all types, including plants, fish, algae, and mollusks have become established in the Great Lakes. As human activity has increased in the Great Lakes watershed, the rate of introduction of invasive species has increased as well. More than one-third of the current invasive species have been introduced in the past 30 years, a surge coinciding with the opening of the St. Lawrence Seaway. Once introduced, invasive species must be managed and controlled as they are virtually impossible to eradicate (GLIN 2001). While many non-native species have no serious ecological impact, the introduction of a single key species, such as the sea lamprey, can cause a sudden and dramatic shift in the entire ecosystem's structure. New species can significantly change the interactions between existing species, creating ecosystems that are unstable and unpredictable. A few of the exotic aquatic animal species found in the Grand Traverse Bay and its watershed include the rusty crayfish (Orconectes rusticus), zebra mussels (Dreissena polymorpha), spiny water flea (Bythotrephes cederstroemi), and the fishhook water flea (Cercopagis pengoi).
Rusty Crayfish Rusty crayfish are native to streams in the Ohio, Kentucky, and Tennessee region. Spread by
anglers who use them as bait, rusty crayfish are prolific and can severely reduce lake and stream vegetation, depriving native fish and their prey of cover and food. They also reduce native crayfish populations (GLIN 2001). Rusty crayfish were spotted in the West arm of Grand Traverse Bay in Spring 2000.
Zebra Mussels
Zebra mussels are small, fingernail-sized mussels native to the Caspian Sea region of Asia and a stark example of the explosive growth potential of the introduction of a non-native species. They are believed to have been transported to the Great Lakes via ballast water from a trans-oceanic vessel. The ballast water, taken on in a freshwater European port, was
114
subsequently discharged into Lake St. Clair near Detroit, where the mussel was discovered in 1988. Since that time, they have spread rapidly to all of the Great Lakes and waterways in many states, as well as Ontario and Quebec. The zebra mussel out competes native organisms and clogs water-intake systems of power plants. Large water users on the Great lakes spend an annual average of $350,000 to $400,000 per user just to clear zebra mussels from their intake pipes. The organisms are most likely spread through microscopic larvae carried in livewells or bilgewater and as adults attached to boats or boating equipment moved from lake to lake (and rivers) (GLIN 2001). Larvae may also drift downstream through connecting channels. Diving ducks and freshwater drum eat zebra mussels, but will not significantly control them. The U.S. Fish and Wildlife Service estimate the potential economic impact of zebra mussels over the next ten years at $5 billion to U.S. and Canadian water users within the Great Lakes region alone (USGS-Great Lakes Science Center website, www.glsc.usgs.gov/). Excessive amounts of zebra mussels have been located in Grand Traverse Bay as well as lakes throughout the watershed.
Spiny Water Flea Originally limited to lakes in Eastern and Western Europe and China, the spiny water flea (Bythotrephes cederstroemi) is a crustacean that invaded North America in the 1980s and is now established in all the Great Lakes. The spiny water flea is a small shrimp-like zooplankton that grows to an average of 10 millimeters (0.4 inch) in length and feeds on other small aquatic animals. It has powerful limbs for swimming and grasping food items, and a large pigmented eye for seeing light and images in the water. When Bythotrephes captures a food item, it inserts its mouthparts into its victim and, much like a vampire bat, sucks out all the fluids. A carnivorous zooplankton such as Bythotrephes could have profound effects on Great Lakes fish because it feeds on other zooplankton that small fish depend on for survival. Although Bythotrephes itself is tasty to fish, it is protected from small fish predators by an unusually long tail spine with up to four pairs of protruding barbs. Because of its long tail spine and barbs, both small and young fish have great difficulty ingesting the spiny creature, potentially causing them to starve to death. Fish shift their habitats and food preferences as they grow -- often feeding on zooplankton when they are young and eating other fish when they are older. Food that is difficult for a young or small fish to swallow may not be difficult for a larger fish to swallow. This may be why scientists find large numbers of Bythotrephes in the stomachs of adult fish in the Great Lakes. However, all fish start out small, and so at some point in their lives are vulnerable to the presence of Bythotrephes in the Great Lakes. Smaller fish depend heavily on zooplankton and are vulnerable to predators. Although older fish might benefit from eating Bythotrephes, the losses in energy, resources and time younger fish experience as a result of Bythotrephes may be greater
than any later benefits (Michigan Sea Grant Program, Inland Seas Education Association, State of the Bay CD 2000).
Fishhook Water Flea
Students aboard the Great Lakes Schoolship Inland Seas discovered a new invader to Lake Michigan and Grand Traverse Bay in September 1999, the fishhook water flea or, Cercopagis pengoi. This discovery was the first reported sighting of the animal in Lake Michigan since it was found in Lake Ontario in July of 1998. The fishhook water flea is known by its long tail
spine (up to ½ inch) and by the kink near the end of this tail. Cercopagis originates from the Caspian, Black, Azov, and Aral Seas. Ocean-going freighters most likely carried this invader in their ballast water to Lake Ontario. Within a year, ships traveling within the Great Lakes probably carried it to Grand Traverse Bay.
Cercopagis is expected to further upset the current food chain in Lake Michigan. Like the well-known spiny water flea, Cercopagis is a predator on smaller zooplankton. Small fish that feed upon zooplankton are discouraged from eating Cercopagis because of its long spiked tail spine (Michigan Sea Grant Program and Inland Seas, State of the Bay CD 2000).
Invasive Plant Species Nonindigenous aquatic plants, such as Eurasian watermilfoil (Myriophyllum spicatum), purple loosestrife (Lythrum salicaria), and curly leaf pondweed (Potamogeton crispus), quickly establish themselves and can displace native plants. Environmental and economic problems caused by these plants include impairment of water-based recreation, impairments to navigation and flood control systems, degradation of water quality and fish and wildlife habitat, and accelerated filling of lakes and reservoirs. For example, Eurasian watermilfoil was accidentally introduced to North America from Europe, spread westward into inland lakes (primarily by boats and waterbirds) and was first seen in Midwestern states by the 1950s. In nutrient-rich lakes, it forms thick stands of tangled stems underwater and vast mats of vegetation at the surface of the water. In shallow areas, the plant can
Fishhook Water Flea
116
interfere with water recreation such as boating, fishing, and swimming. The plant's floating canopy can also crowd out important native water plants (GLIN 2001). A key factor in the success of Eurasian watermilfoil is its ability to reproduce through stem fragmentation and underground runners. Single segments of stems and leaves are able to root and form new colonies when broken off. Fragments that cling to boats and trailers spread the plant from lake to lake. Watershed residents trying to mechanically clear weed beds for beaches, docks, and landings unintentionally create thousands of new stem fragments and end up forming more new plants. Eurasian watermilfoil has difficulty becoming established in lakes with healthy populations of native plants. In some lakes the plant appears to coexist with native flora and has little impact on fish and other aquatic animals (GLIN 2001). Excessive amounts of Eurasian watermilfoil have been located in lakes throughout the Grand Traverse Bay watershed as well as in the bay itself. Below is a timeline listing the introduction of some major invasive species into the Great Lakes.
Typical Impacts from Invasive Species
Impact #1: Invasive species often have no natural predators and can out-compete native species for food and habitat.
Impact #2: Introduction of a single key species can cause a sudden and dramatic shift in the
entire ecosystem's structure. New species can significantly change the interactions between existing species, creating ecosystems that are unstable and unpredictable.
Impact #3: In some instances invasive species can interfere with recreation in the watershed
For example, rows of zebra mussel shells washed up on shore can cut beach walkers’ feet, and Eurasian watermilfoil can get tangled up in boat propellers.
117
Pathogens Pathogens are organisms that cause disease and include a variety of bacteria, viruses, protozoa and small worms. These pathogens can be present in water and may pose a hazard to human health. The US Environmental Protection Agency (EPA) recommends that freshwater recreational water quality be measured by the abundance of Escherichia coli (E. coli) or by a group of bacteria called Enterococci. Michigan has adopted the EPA’s E. coli water quality standards. E. coli is a common intestinal organism, so the presence of E. coli in water indicates that fecal pollution has occurred. However, the kinds of E. coli measured in recreational water do not generally cause disease; rather, they are an indicator for the potential presence of other disease causing pathogens. EPA studies indicate that when the numbers of E. coli in fresh water exceed water quality standards, swimmers are at increased risk of developing gastroenteritis (stomach upsets) from pathogens carried in fecal pollutions. The presence of E. coli in water does indicate what kinds of pathogens may be present, if any. If more than 130 E. coli are present in 100mL of water in 5 samples over 30 days, or if more than 300 E. coli per 100mL of water are present in a single sample, the water is considered unsafe for swimming. Fecal pollution entering the Grand Traverse Bay watershed may come from urban stormwater runoff, inadequately treated wastewater, agricultural runoff, illegal sewage discharge from boats, or from animals on the land or in the water. Different sources of fecal pollution may carry different pathogens. Peak E. coli concentrations often occur during high flow periods when floodwater is washing away possible contaminants along the streambank such as waste from ducks and geese. Streams such as Kid’s Creek, Boardman River, Suttons Bay Creek and Northport Creek have exhibited high E. coli counts at times during storm events (The Watershed Center’s E. coli monitoring program; please see interactive water quality database for specific information: www.gtbay.org/wqquery.asp). There are a number of public beaches on the bay near the outlets of these streams and high counts of E. coli pose a risk to beachgoers in these areas. Each year the amount of swimming beaches in the state closing due to high E. coli levels increases. Another source of possible E. coli contamination is from improperly functioning septic systems within the Grand Traverse Bay watershed. Due to the unknown nature of groundwater flow in some watershed areas and the relatively random location of septic systems, it is very difficult to accurately assess their impact to the watershed. Failing septic systems are a suspected source of contamination for parts of the Grand Traverse Bay watershed, especially where there is a high density of residential development using septic systems, such as in the Elk River Chain of Lakes watershed.
Typical Impacts from Pathogens
Impact: High levels of potential pathogens in the water pose a threat to human health and can reduce the recreational value of lakes and the bay.
Stream or Beach E. coli (colonies/100mL) Date
Kid’s Creek 1,986 8/26/03Boardman River 517 5/14/03Suttons Bay Creek 727 8/26/03Northport Cr. 770 8/18/03TC State Park Beach 518 6/9/03 Milliken Park Beach 2,419 6/9/03
Road and roof runoff are two sources of stormwater. Photo Copyright 1999, Center for Watershed Protection
5.5 Special Sources of Concern: Stormwater, Lack of Riparian Buffer, and Master Plans and Zoning Ordinances Stormwater
One of the major pathways by which many types of pollutants get to lakes and streams is through stormwater runoff. Stormwater runoff results when drops of rain fall to the ground, or snow melts, and the resulting water that does not infiltrate into the ground flows over the surface of the land. This stormwater flow often dislodges and carries soil or sediment particles (causing streambank erosion in some places) to which many pollutants are attached. The stormwater flow may also directly move the pollutant itself (i.e., garbage, oils, grease, gas, pesticides, etc.). The amount of stormwater runoff that occurs is dependent upon a variety of conditions including storm intensity and duration, topography, time of year, soil moisture levels, soil permeability, vegetative cover types, the extent of vegetated cover, and the amount of impervious surfaces. Urban locations, like Traverse City, Elk Rapids, and Suttons Bay, often produce greater amounts of stormwater flow due to the increased amount of impervious surfaces in these urban areas relative to more rural settings within the watershed. Impervious surfaces are those areas on land that cannot effectively absorb or infiltrate rainfall. Areas such as these may include: roads, streets, sidewalks, parking lots, and rooftops. Research suggests that there is a threshold to the amount of impervious cover that can occur within a watershed at which the degradation of aquatic systems occurs. Findings reveal that stream degradation consistently occurs when impervious surface levels in a watershed reach between 10-20% (CWP 1994). Stormwater entering the Bay and its tributaries from storm drain outlets contributes a significant amount of pollution. When added up, inputs from all these small, single inputs of stormwater can result in a massive amount of pollution entering Grand Traverse Bay. Most often the pollution coming from these storm drains is at its worst during heavy rain and snowmelt events. Table 30 lists phosphorus, nitrate, suspended sediment, and E. Coli measurements taken during a single storm event at various storm drains in the watershed (GLEC 2001).
CITY OF TRAVERSE CITY STORM DRAIN OUTLETS
51 total storm drain outlets into: Grand Traverse Bay Boardman River Kid’s Creek
119
TABLE 30: POLLUTANTS MEASURED AT SELECTED STORM DRAINS FROM A SINGLE STORM EVENT (11/9/00)
Storm Drain Measured Flow (cfs)
Total P (mg/L)
Nitrate (mg/L)
Suspended Sediment
(mg/L)
Average E Coli
CFU/100mL East 8th St. – TC 0.36 0.57 0.15 15.33 51,330**
East Bay Park – TC 3.20 0.44 0.13 6.63 80,000**
Maple St. – TC 0.51 0.12 0.14 13.23 2,700**
Hope St. – TC 1.33 0.07 0.09 7.03 15,300**
Bryant Park – TC 2.31 (estimated) 0.37 0.30 43.60 487**
Suttons Bay 0.12 * 0.38 13.75 162
Northport 0.13 * 0.32 210.33 713 Source of data in table: GLEC 2001 *not measured **Above EPA and Michigan Water Quality Standard for a single sample event, see previous section on Pathogens. Due to a high amount of impervious surfaces, the City of Traverse City generates the largest amount of stormwater input to Grand Traverse Bay during rain and snow melt events and city officials there consider stormwater to be a high priority issue. Kid’s Creek, a tributary to the Boardman River located in Traverse City, experiences severe changes in flow due to stormwater inputs during storm events. The creek exhibits signs of flashiness and causes regular flooding upstream of a number of culverts within the city limits. This flashiness has led to scoured stream bottoms and increased sedimentation (from eroding stream banks) within the stream. This is one of the main reasons that Kid’s Creek is on the state impaired waters list and is said to be in “nonattainment” (Section 4.1). Data from the Rouge River National Wet Weather Demonstration Project (Cave et al. 1994) in Southeast Michigan present the typical pollutant concentration in stormwater from various land uses (Table 31). As expected, developed land uses (such as residential and commercial) and impervious surfaces (i.e. roads) have noticeable higher concentrations of pollutants compared to forest and open spaces.
120
Stormwater can increase stream velocities and carry pollutants (like sediment) downstream.
TABLE 31: TYPICAL STORMWATER POLLUTANT CONCENTRATIONS FROM LAND USES IN SOUTHEAST MICHIGAN
Land Use Pollutant (mg/L)
Total Phosphorus Total Nitrogen Total Suspended Sediment Lead
Road 0.43 1.82 141 0.014 Commercial 0.33 1.74 77 0.049 Industrial 0.32 2.08 149 0.072 Low Density Residential 0.52 3.32 70 0.057 High Density Residential 0.24 1.17 97 0.041 Forest 0.11 0.94 51 0.000 Urban Open Space 0.11 0.94 51 0.014 Pasture, Agriculture 0.37 1.92 145 0.000
(Source for data in table: Cave et al., 1994) Stormwater also contributes directly to thermal pollution. As stormwater runs over the land, it can be warmed by the land surface and may cause significant increases in water temperatures when it is deposited into a stream or other body of water. Spikes of warm temperatures in
streams can be fatal to fish and other aquatic life. Any reductions to stormwater flow, as well as better management of stormwater, will decrease the amount of sediment, nutrients, thermal pollution, toxins, and pathogens that enter area waterbodies.
121
Lack of Riparian Buffer Riparian buffers are widely considered one of the best ways to control and reduce the amount of non-point source pollution entering a water body. Also called vegetated stream buffers, filter strips, or greenbelts, these buffers consist of strips of trees, shrubs, and other vegetation lining a stream corridor or lakefront. These linear strips of vegetation serve as a stream's last line of defense against human activities such as agriculture, grazing, and urban development. Riparian buffers help to reduce the impact of almost all of the pollutants that currently threaten the Grand Traverse Bay watershed: sediment, nutrients, toxins, thermal pollution, pathogens, changes to hydrology, and loss of habitat. Benefits of riparian buffers include: Stabilization of Streambanks – The deep rooted vegetation binds the soil along streambanks, which prevents bank erosion during periods of high runoff. Improved Water Quality – Trees, shrubs, and grasses along streams remove sediment, nutrients, pesticides, pathogens, and other potential pollutants before they enter surface water. Fertilizers and other pollutants that originate on the land are taken up by tree roots and stored in leaves, limbs and roots of the vegetation instead of reaching the stream. Studies have shown dramatic reductions of 30% to 98% in nutrients (nitrogen and phosphorus), sediment, pesticides, and other pollutants in surface and groundwater after passing through a riparian forest buffer (Chesapeake Bay Program website: www.chesapeakebay.net). Reduced Flooding and Sedimentation – Trees and shrubs help to retain runoff longer, improve infiltration, and filter out sediment that might otherwise be delivered downstream during floods. Reduction of Thermal Pollution (Stream Warming) – The canopy provided by the leaves of the vegetation provide shading to the stream, which moderates water temperatures and protects against rapid fluctuations that can harm stream health and reduce fish spawning and survival. Cool stream temperatures maintained by riparian vegetation are essential to the health of aquatic species. Elevated temperatures also accelerate algae growth and reduce the amount of dissolved oxygen the water can hold, further degrading water quality. In a small stream, temperatures may rise 1.5 degrees in just 100 feet of exposure without a leaf canopy. The leaf canopy also improves air quality by filtering dust from wind erosion, construction or farm machinery. Enhanced Wildlife Habitat – The trees and shrubs contained in a riparian buffer supply a tremendous diversity of habitat and travel corridors for many wildlife species in both the aquatic and upland areas. Travel corridors are particularly important where habitat is limited. In addition, woody debris (fallen trees and limbs) in the stream provides both habitat and cover for fish and other macroinvertebrate species. Leaves that fall into a stream are trapped on woody debris and rocks where they provide food and habitat for small bottom-dwelling creatures (i.e. crustaceans, amphibians, insects and small fish), which are critical to the aquatic food chain. Improved Scenery (Desired Uses) – Strips of trees and shrubs along streams add diversity and beauty to the landscape.
Riparian buffers vary in character, effectiveness, and size based on the environmental setting, proposed management, level of protection desired and landowner objectives. To protect water quality, a buffer at least 55 – 100 feet wide should be preserved or created around all bodies of water and wetlands, with strip widths increasing with increasing slope. Research shows that when the buffer is less than 100 feet, stream quality begins to diminish (DEQ 2001). Most riparian buffers are composed of three zones, the width of each determined by site conditions and landowner objectives. This three-zone concept provides a conceptual framework in which water quality, habitat, and landowner objectives can be accomplished. The picture and accompanying text on the next page describes the components of each zone. Streamside areas lacking a riparian buffer have a reduced filtering capacity and do not effectively filter out watershed pollutants. While the lack of a riparian buffer along a stream or lakefront does not add any pollutants to the watershed and is technically not a source of pollution, the lack of a buffer significantly increases the possibility of pollutants reaching a body of water. The actual sources of the pollution are coming from another place and the buffer only reduces their effects on the watershed. Therefore, for the purposes of this protection plan, the lack of a riparian buffer (and streamside canopy) is referred to as sources of pollution and environmental stress in the watershed, with the general understanding that increases in the amounts of riparian buffers will decrease the amount of various pollutants entering the watershed.
123
Zone Description from the DEQ’s Guidebook of Best Management Practices for Michigan Watersheds & the USDA – NRCS website (www.mi.nrcs.usda.gov):
Zone 1 – The Streamside Zone: This zone is usually made up of mature trees and shrubs that provide shade, leaf litter, and woody debris to the stream, as well as erosion protections. The minimum width of this zone is 15 – 25 feet. Land uses in this zone should be limited to footpaths and well-designed watercourse crossings (for utilities, roads, etc.). The mature forest along the edge of the water maintains habitat, food, and water temperature and helps to stabilize streambanks, reduce flood impact, and remove nutrients. Zone 2 – The Middle Zone: This zone extends from the outer edge of the streamside zone and protects the stream’s ecosystem by providing a larger protective area between the stream and upland development. Ideally, this zone will also be composed of mature trees and shrubs and will be between 20 – 50 feet, with widths increasing to ensure the 100-year floodplain. A primary function of Zone 2 is to filter runoff by removing sediment, nutrients and other pollutants from surface and groundwater. Zone 3 – The Outer Zone: The outer zone extends from Zone 2 to the nearest permanent structure and is composed of grass and other herbaceous cover. This is the main filtering part of the riparian buffer strip. The vegetation included in this zone is useful in spreading and filtering runoff that may be transporting sediment, nutrients, or pesticides.
Illustration courtesy of the ISU Forestry Extension Website
Master Plans and Zoning Ordinances While not necessarily a direct source of pollution, local governments’ master plans and zoning ordinances have great potential to affect water quality. Zoning ordinances primarily affect land development in a region and are related to site design and access. They are used to regulate permitted uses of the land, for example, setting minimum/maximum lot sizes and setback requirements (from neighbors, roads, water bodies). Overall, zoning ordinances are enacted to protect the use of a property and ensure the public’s safety, health, and welfare. As stated in Section 3.4, how communities manage their land use has a direct impact on the community’s water resources. Since protecting water quality requires looking at what happens on land, zoning can be an extremely important watershed management tool. Examples of ways to utilize zoning to protect water quality include requiring vegetative buffer zones along bodies of water (see previous section on ‘Lack of Riparian Buffer’), requiring greenbelt areas, protecting the integrity of soil by having filtered views along stream corridors (protects banks from erosion), or protecting wetlands. Zoning’s effectiveness depends on many factors, particularly the restrictions in the language, enforcement, and public support. Zoning is a sensitive issue for some units of government within the region and there are many challenges to implementing and enforcing a strong ordinance (community support, fiscal, legal, etc.). Many people believe the law protects sensitive areas, only to find otherwise when development is proposed. Zoning can be used very effectively for managing land uses in a way that is compatible with watershed management goals. Some benefits of zoning include: increased local control/autonomy over land use decision-making; communicating clear expectations with developers based on community needs; and an opportunity for the residents of the area to design the type of community they want to live in - one that respects their unique cultural, historic, and natural resource values. Local governance can be a complicated issue. Some counties within the watershed have zoning, but townships in those counties may or may not have their own zoning. Furthermore, if a township does not have zoning and is located within a county that does, that township may or may not elect to follow the county zoning regulations. If they choose to follow county zoning, then the county is responsible for enforcing the regulations. Generally, local governments may enact zoning laws that are more stringent than the next highest ranking form of government, but not less. In any case, all applicable State laws must be followed. Also, it is important to consider that coming under county zoning does not always ensure that zoning regulations will be enforced, even if the regulations are relatively strong related to natural resource protection. There have been instances in northwest Lower Michigan where the lack of staff and financial resources to support adequate enforcement levels has led to frustration and disappointment (due to unfulfilled expectations) among townships that have come under county zoning. In fall 2005, the Northwest Michigan Council of Governments (NWMCOG) reviewed the master plans and zoning ordinances for all townships and municipalities in the Grand Traverse Bay watershed specifically looking for types of protection given to water quality and natural resources. Information for each jurisdiction regarding natural resources was pulled and
125
summarized from available master plans and zoning ordinances (full summaries are available through The Watershed Center). Some information was not summarized because there was no response from the jurisdiction for document requests (or it was not provided in time), it didn’t exist, it was mistakenly left out (2 townships/villages), or was skipped because the jurisdiction has such a small area in the watershed (4 townships/villages). Of the local governments surveyed that responded to document requests, 24 have master plans and 30 have zoning ordinances. There is no requirement that townships or municipalities must have a master plan or zoning. However, if a community chooses to exercise its zoning authority, its zoning ordinance should be based on its master plan. Table 32 lists the document status for each jurisdiction.
TABLE 32: MASTER PLAN AND ZONING ORDINANCE STATUS SUMMARY FOR LOCAL GOVERNMENTS IN WATERSHED
Unit of government Master Plan Status* Zoning Status*
Antrim County Plan being updated None Banks Twp Reviewed Reviewed Central Lake Twp None None Chestonia Twp None None Custer Twp None None Echo Twp None Non Elk Rapids Twp Reviewed Reviewed Forest Home Twp -NP- -NP- Helena Twp -NP- -NP- Jordan Twp None None Kearney Twp -NP- -NP- Mancelona Twp -NP- -NP- Milton Twp Reviewed Reviewed Star Twp None None Torch Lake Twp -NP- Reviewed Warner Twp None None Village of Bellaire Reviewed Reviewed Village of Elk Rapids Reviewed Reviewed Village of Mancelona -NP- Reviewed Grand Traverse County Reviewed Did not review Acme Twp Reviewed Reviewed Blair Twp Reviewed Reviewed East Bay Twp Reviewed Reviewed Fife Lake Twp Reviewed Reviewed Garfield Twp Reviewed Reviewed Long Lake Twp Reviewed Reviewed Mayfield Twp Reviewed Reviewed Paradise Twp Reviewed Reviewed Peninsula Twp Reviewed Reviewed Union Twp Reviewed Reviewed
Document Status Master Plan
Zoning Ordinance
Document Exists and was Reviewed 24 30
No Response or Documents Not Provided
12 5
Does Not Have 13 14
126
TABLE 32: MASTER PLAN AND ZONING ORDINANCE STATUS SUMMARY FOR LOCAL GOVERNMENTS IN WATERSHED CONT’D
Unit of government Master Plan Status* Zoning Status*
Whitewater Twp Reviewed Reviewed City of Traverse City Reviewed Reviewed Village of Kingsley Reviewed Reviewed Kalkaska County Reviewed Reviewed Boardman Twp -NP- Reviewed Clearwater Twp None -NP- Coldsprings Twp None None Excelsior Twp None None Kalkaska Twp None None Orange Twp None None Rapid River Township None None Springfield Twp None None Village of Kalkaska Reviewed Reviewed Leelanau County Reviewed None Bingham Twp Reviewed Reviewed Elmwood Twp Reviewed Reviewed Leelanau Twp -NP- Reviewed Suttons Bay Twp Reviewed Reviewed Village of Northport Reviewed Reviewed Village of Suttons Bay Reviewed Reviewed Charlevoix County -NP- None Marion Twp -NP- Reviewed Norwood Twp -NP- None South Arm Twp -NP- Reviewed
* ‘NP’ – Unit of government did not provide document by project deadline OR no response to document request Available master plans and zoning documents were further summarized on a watershed-wide scale to determine types of protection given to water quality and natural resources (Table 33a and 33b). Most of the master plans reviewed contain all of the environmental provisions researched. The only categories lacking in some plans were protection for shoreline and Grand Traverse Bay and outlining measures to reduce soil erosion and stormwater pollution, both of which are very important in maintaining water quality throughout the watershed (Table 33a). However, master plans, for the most part, are merely used as guidelines to outline a community’s values and goals. The only enforceable way to achieve those goals is through zoning ordinances. The 30 available zoning ordinances were reviewed to see if they included regulations for the following: special districts for environmental sensitive areas; special approval or permits for environmentally sensitive areas; special requirements for shoreline/Grand Traverse Bay; special requirements for wetland areas; special provisions to protect streams, surface water, or groundwater; soil erosion or stormwater provisions; sewer/water provisions; and open space regulations (Table 33b). Less than half of the zoning ordinances have special requirements for wetlands or shoreline areas (including Grand Traverse Bay), as well as special provisions regarding environmentally sensitive areas. On an encouraging note, 23 of the ordinances include special provisions to protect streams, surface water, and groundwater.
127
Research done by the NWMCOG suggests that existing ordinances are lacking in areas such as: requiring setbacks from water features, establishing vegetative buffers along water bodies, hillside protection (in steep sloped areas), and protecting the quality of intermittent streams. Further more, not many townships are exercising their right to utilize special districts and overlay zoning to protect sensitive areas and water features. These are all important tools for protecting water quality which could be strengthened in most jurisdictions in the Grand Traverse Bay watershed. In addition, it is important for communities that have high growth rates and/or high populations (see Figures 3 and 4) to enact and enforce zoning regulations that protect water quality and natural resources before these things become degraded. Zoning is a great opportunity for these communities to decide what kind of development and growth they want in their area, as well as what kind of protection they want for water resources. For the most part, it is easy to see from the master plans that most communities have good intentions when it comes to protecting natural resources. The natural resources of this area are why most people choose to live in the Grand Traverse Region. However, townships and communities often lack the knowledge on how to draft and enact effective, yet enforceable, zoning requirements. The validity of a zoning ordinance, particularly those that are more restrictive is often challenged by developers and others. Local governments may have trouble obtaining information to back up their ordinances that will stand up in court. Additionally, it is often an argument of property rights vs. the public good, with local governments trying to show and prove that a certain ordinance is important to protect water quality. An example of this would be a township wanting to enact a buffer ordinance that requires a 100-foot vegetated riparian buffer along streams and lakes in the township. Initially, the township would have to prove to skeptical landowners that, first, protecting water quality is necessary and, second, that a riparian buffer will help accomplish this. It is also intuitive to most people that the wider the buffer, the better the protection. However, the community would have to decide just how much protection they want, and scientific evidence regarding buffer effectiveness in northern Michigan is lacking.
Soil Erosion and Stormwater Ordinances It is important to note that, in addition to zoning ordinances, counties and townships may have separate soil erosion and/or stormwater ordinances. These ordinances come under different state enabling acts than local zoning ordinances. So, even if a township or municipality does not have zoning, they still may have soil erosion or stormwater regulations to follow (most often as determined and outlined by the county they are in). These soil erosion and stormwater ordinances are extremely valuable tools in protecting water quality. Townships do not have the option to ‘opt out’ of county soil erosion/stormwater ordinances as they do for county zoning. The scope of the master plan and zoning review completed by the NWMCOG did not include a review of any existing soil erosion and/or stormwater ordinances in the watershed. At this time, both Grand Traverse and Leelanau Counties have Soil Erosion, Sedimentation, and Stormwater Runoff Control Ordinances; Antrim County is in the process of drafting a soil erosion ordinance; and Kalkaska County has none. It is also important to note that there are existing State and Federal statutes regarding soil erosion and stormwater runoff that must be followed as well.
128
Tough Choices
Local officials face hard choices when deciding which land use planning techniques are the most appropriate to modify current zoning. Table 7 from Section 3.4 provides further details on land use planning techniques and their utility for watershed protection. In addition, the DEQ has published a book titled Filling the Gaps: Environmental Protection Options for Local Governments that equips local officials with important information to consider when making local land use plans, adopting new environmentally focused regulations, or reviewing proposed development (Ardizone, Wyckoff, and MCMP 2003). An overview of Federal, State, and local roles in environmental protection is provided, as well as information regarding current environmental laws and regulations including wetlands, soil erosion, inland lakes and streams, natural rivers, floodplains, and more. The book also outlines regulatory options for better natural resources and environmental protection at the local level. A copy of this guidebook is available via the DEQ website: www.michigan.gov/deq Water Surface Water Nonpoint Source Pollution (look under Information/Education heading). Assisting local governments in updating and enacting strong zoning ordinances to protect water quality and secure natural areas is extremely important in the Grand Traverse Bay watershed and is a high priority for implementation efforts (Sections 7.3 and 8.1). While the State of Michigan has laws to protect clean water, much more can be done at the local level because townships know their land resources better than the State does. For example, local governments can enact more stringent wetland regulations. The Federal Army Corps of Engineers and the State of Michigan regulate wetlands that are 5 acres or greater, but no protection is provided for wetlands of a smaller size unless they are connected to the Great Lakes. Local governments have the opportunity to fill loopholes in wetland regulations using a variety of zoning tools.
TABLE 33A: MASTER PLAN REVIEW SUMMARY FOR LOCAL GOVERNMENTS IN WATERSHED Master Plan Goals/ Narrative Address:
Unit of government
Master Plan Status*
Maintain/ Promote Comm.
Character
Land Use Limitations Based On
Env. Constraints
Protect Shoreline/ GT Bay
Protecting Wetlands
Preserve and Protect Streams, Surface Water, Groundwater
Soil erosion/ Stormwater Measures
Protect Dunes,
Hills, Slopes
Protect Forests,
Agriculture, Open Space
Antrim County Plan being updated --- --- --- --- --- --- --- ---
Banks Twp Reviewed X X X X X X X X Central Lake Twp None --- --- --- --- --- --- --- --- Chestonia Twp None --- --- --- --- --- --- --- --- Custer Twp None --- --- --- --- --- --- --- --- Echo Twp None --- --- --- --- --- --- --- --- Elk Rapids Twp Reviewed X X X X X X X X Forest Home Twp -NP- --- --- --- --- --- --- --- --- Helena Twp -NP- --- --- --- --- --- --- --- --- Jordan Twp None --- --- --- --- --- --- --- --- Kearney Twp -NP- --- --- --- --- --- --- --- --- Mancelona Twp -NP- --- --- --- --- --- --- --- --- Milton Twp Reviewed X X X X X X X X Star Twp None --- --- --- --- --- --- --- --- Torch Lake Twp -NP- --- --- --- --- --- --- --- --- Warner Twp None --- --- --- --- --- --- --- --- Village of Bellaire Reviewed X X X X X X X X
Village of Elk Rapids Reviewed X X X X X X X X
Village of Mancelona -NP- --- --- --- --- --- --- --- ---
130
TABLE 33A: MASTER PLAN REVIEW SUMMARY FOR LOCAL GOVERNMENTS IN WATERSHED CONT’D Master Plan Goals/ Narrative Address:
Unit of government
Master Plan Status*
Maintain/ Promote Comm.
Character
Land Use Limitations Based On
Env. Constraints
Protect Shoreline/ GT Bay
Protecting Wetlands
Preserve and Protect Streams, Surface Water, Groundwater
Soil erosion/ Stormwater Measures
Protect Dunes,
Hills, Slopes
Protect Forests,
Agriculture, Open Space
Grand Traverse County Reviewed X X X X X X X X
Acme Twp Reviewed X X X X X X X Blair Twp Reviewed X X X X X X X East Bay Twp Reviewed X X X X X Fife Lake Twp Reviewed X X X X X Garfield Twp Reviewed X X X X X X X Long Lake Twp Reviewed X X X X X X Mayfield Twp Reviewed X X X X X X Paradise Twp Reviewed X X X X Peninsula Twp Reviewed X X X X X X X X Union Twp Reviewed X X X X Whitewater Twp Reviewed X X X X X X City of Traverse City Reviewed X X X X X X X X
Springfield Twp None --- --- --- --- --- --- --- --- Village of Kalkaska Reviewed X X X X
131
TABLE 33A: MASTER PLAN REVIEW SUMMARY FOR LOCAL GOVERNMENTS IN WATERSHED CONT’D Master Plan Goals/ Narrative Address:
Unit of government
Master Plan Status*
Maintain/ Promote Comm.
Character
Land Use Limitations Based On
Env. Constraints
Protect Shoreline/ GT Bay
Protecting Wetlands
Preserve and Protect Streams, Surface Water, Groundwater
Soil erosion/ Stormwater Measures
Protect Dunes,
Hills, Slopes
Protect Forests,
Agriculture, Open Space
Leelanau County Reviewed X X X X X X X X Bingham Twp Reviewed X X X X X X X X Elmwood Twp Reviewed X X X X X X X Leelanau Twp -NP- --- --- --- --- --- --- --- --- Suttons Bay Twp Reviewed X X X X X X X X Village of Northport Reviewed X X X X X X X
* ‘NP’ – Unit of government did not provide document by project deadline OR no response to document request
132
TABLE 33B: ZONING ORDINANCE REVIEW SUMMARY FOR LOCAL GOVERNMENTS IN WATERSHED
Ordinance Regulations Include:
Unit of government
Zoning Status*
Special Districts for Env. Sensitive
Areas
Special Approval or Permits for
Env. Sensitive Areas or Uses
Special Req. for Shoreline
or Grand Traverse Bay
Special Req. for Wetland
Areas**
Special Provisions to
Protect Streams, Surface Water, Groundwater
Soil Erosion or
Stormwater Provisions
Sewer/ Water
Provisions
Open Space Req.
Antrim County None --- --- --- --- --- --- --- --- Banks Twp Reviewed X X Central Lake Twp None --- --- --- --- --- --- --- --- Chestonia Twp None --- --- --- --- --- --- --- --- Custer Township None --- --- --- --- --- --- --- --- Echo Twp None --- --- --- --- --- --- --- --- Elk Rapids Twp Reviewed X X X X X X Forest Home Twp -NP- --- --- --- --- --- --- --- --- Helena Twp -NP- --- --- --- --- --- --- --- --- Jordan Twp None --- --- --- --- --- --- --- --- Kearney Twp -NP- --- --- --- --- --- --- --- --- Mancelona Twp -NP- --- --- --- --- --- --- --- --- Milton Twp Reviewed X X X X X X X Star Twp None --- --- --- --- --- --- --- --- Torch Lake Twp Reviewed X X X X X X Warner Twp None --- --- --- --- --- --- --- --- Village of Bellaire Reviewed X X X X X X X X
Village of Elk Rapids Reviewed X X X X X
Village of Mancelona Reviewed X
133
TABLE 33B: ZONING ORDINANCE REVIEW SUMMARY FOR LOCAL GOVERNMENTS IN WATERSHED CONT’D
Ordinance Regulations Include:
Unit of government
Zoning Status*
Special Districts for Env. Sensitive
Areas
Special Approval or Permits for
Env. Sensitive Areas or Uses
Special Req. for Shoreline
or Grand Traverse Bay
Special Req. for Wetland
Areas**
Special Provisions to
Protect Streams, Surface Water, Groundwater
Soil Erosion or
Stormwater Provisions
Sewer/ Water
Provisions
Open Space Req.
Grand Traverse County
Did not have to review --- --- --- --- --- --- --- ---
Acme Twp Reviewed X X X X X X X Blair Twp Reviewed X X X East Bay Twp Reviewed X X X Fife Lake Twp Reviewed X X Garfield Twp Reviewed X X X X X X Long Lake Twp Reviewed X X X X Mayfield Twp Reviewed X X X X Paradise Twp Reviewed X X X X Peninsula Twp Reviewed X X X X X X Union Twp Reviewed X X Whitewater Twp Reviewed X X X X X X X X City of Traverse City Reviewed X X X Village of Kingsley Reviewed X X X X X X Kalkaska Cnty Reviewed X X X X X Boardman Twp Reviewed X X X X X Clearwater Twp -NP- --- --- --- --- --- --- --- --- Coldsprings Twp None --- --- --- --- --- --- --- --- Excelsior Twp None --- --- --- --- --- --- --- --- Kalkaska Twp None --- --- --- --- --- --- --- --- Orange Twp None --- --- --- --- --- --- --- --- Rapid River Twp None --- --- --- --- --- --- --- --- Springfield Twp None --- --- --- --- --- --- --- --- Village of Kalkaska Reviewed
134
TABLE 33B: ZONING ORDINANCE REVIEW SUMMARY FOR LOCAL GOVERNMENTS IN WATERSHED CONT’D
Bingham Twp Reviewed X X X X Elmwood Twp Reviewed X X X X X Leelanau Twp Reviewed X X X X Suttons Bay Twp Reviewed X X X X X X Village of Northport Reviewed X
Marion Twp Reviewed X X X X X X Norwood Twp None --- --- --- --- --- --- --- --- South Arm Twp Reviewed X X X X X
* ‘NP’ – Unit of government did not provide document by project deadline OR no response to document request ** For example, areas not regulated by DEQ or US Army Corp. of Engineers
135
CHAPTER 6 WATERSHED GOALS AND OBJECTIVES
The Grand Traverse Bay watershed is a high quality waterbody of international significance and should be protected and maintained as such. The overall mission for the Grand Traverse Bay Watershed Protection Plan is to provide guidance for the implementation of actions that will reduce the negative impact that pollutants and environmental stressors have on the designated watershed uses. The envisioned endpoint is to have Grand Traverse Bay and all lakes and streams within its watershed support appropriate designated and desired uses while maintaining their distinctive environmental characteristics and aquatic biological communities. Using suggestions obtained from stakeholder meetings conducted throughout the watershed and examples from other watershed management plans, the project steering committee developed six broad goals for the Grand Traverse Bay watershed (Table 34). Working to attain these goals will ensure that the threatened designated uses described Chapter 4 are maintained or improved.
TABLE 34: GRAND TRAVERSE BAY WATERSHED GOALS
Goal Designated or Desired Use Addressed
Pollutant(s) Addressed
1. Protect the integrity of aquatic and terrestrial ecosystems within the watershed.
Coldwater Fishery Other Aquatic Life Desired Use: Ecosystem Preservation
Sediment Nutrients Changes to Hydro Flow Invasive Species Thermal Pollution
2. Protect and improve the quality of water resources within Grand Traverse Bay and its watershed.
Coldwater Fishery Other Aquatic Life Public Water Supply Total Body Contact
Nutrients Thermal Pollution Toxins Pathogens
3. Establish and promote land and water management practices that conserve and protect the natural resources of the watershed.
Coldwater Fishery Other Aquatic Life Navigation
Sediment Nutrients Thermal Pollution Toxins Changes to Hydro Flow Pathogens
4. Enhance the amount and quality of recreational opportunities and support a sustainable local economy.
Desired Use: Recreation All
5. Establish and promote educational programs that support stewardship and watershed planning goals, activities, and programs.
All All
6. Preserve the distinctive character and aesthetic qualities of the watershed. Desired Use: Aesthetics All
136
Goal #1 Protect the integrity of aquatic and terrestrial ecosystems within the
watershed. Designated Use: Coldwater Fishery and Other Aquatic Life Desired Use: Ecosystem Preservation Pollutant or Stressor Addressed: Sediment, Changes to Hydrologic Flow, Invasive Species
Objective 1 Protect and restore desirable habitat areas for aquatic organisms in streams and
lakes throughout the watershed and the Grand Traverse Bay and preserve the biodiversity of populations and communities of aquatic organisms in the watershed.
• Maintain and enhance stream canopy of trees and shrubs. • Prevent spread of disease between animal, fish, and avian populations
by utilizing latest research and techniques. • Promote proper riparian land management and bank stability
practices to reduce the amount of sediment influxes to protect aquatic habitat.
• Promote and maintain naturally reproducing native fish populations. • Manage fish and other animal populations for species appropriate for
the area, with an attempt to maintain the diversity of species already present (i.e., stocking, fishing/hunting/trapping regulations, species introductions and reintroductions, habitat improvement efforts).
Objective 2 Protect shoreline habitats by minimizing artificial shoreline alteration, including
hardening and grooming. • If shoreline erosion protective measures are needed, make sure they
are sited, designed, and installed properly to minimize the impact on beaches, nearshore sand drift, and habitat. Support shoreline stabilization procedures that are as natural as possible.
• Support proper beach grooming techniques that do not disrupt the natural habitat.
Objective 3 Minimize hydrologic flow fluctuations from the following sources:
• Dams and lake-level control structures • Stormwater • Road stream crossings • Beaver dams • Other sources
Objective 4 Work to stop wetland and other types of lowland filling. Objective 5 Reduce the magnitude of overland stormwater runoff to streams.
137
Objective 6 Promote the reduction of potential global warming factors to limit projected evaporative losses from the bay and inland lakes.
Objective 7 Reduce and/or minimize sediment inputs to streams and lakes in watershed from
the following sources: • Stream bank and lakeshore erosion • Road steam crossings • Recreational access • Boating • Agricultural access • Land use practices
Objective 8 Prevent the spread of existing invasive species and the introduction of new ones
in area watersheds. • Boat hulls and bilges • Other biota • Connected waterways • Purposeful and accidental human introductions
Objective 9 Maintain terrestrial habitat and preserve the biodiversity of populations and
communities of terrestrial organisms in the watershed. Objective 10 Minimize the negative effects of recreational boating and other types of
watercraft from pollutants such as sediment, toxins, and pathogens.
138
Goal #2 Protect and improve the quality of water resources within Grand Traverse
Bay and its watershed.
Designated Use: Public Water Supply, Coldwater Fishery, Other Aquatic Life, Total Body Contact Pollutant or Stressor Addressed: Nutrients, Thermal Pollution, Toxins, E. Coli and Pathogens
Note: One of the major pathways by which many pollutants get to lakes and streams is through stormwater runoff. Stormwater runoff results when drops of rain fall to the ground, or snow melts, and water flows over the surface of the land. This stormwater flow often dislodges and carries soil or sediment particles to which many pollutants are attached, or directly moves the pollutant itself. The amount of stormwater runoff that occurs is dependent upon a variety of conditions including: storm intensity and duration, topography, time of year, soil moisture levels, soil permeability, vegetative cover types, the extent of vegetated cover, and the amount of impervious surfaces (surfaces that water cannot penetrate such as paved roads, parking lots, and roofs). Urban locations like Traverse City often produce greater amounts of stormwater flow due to the increased amount of impervious surfaces in urban areas relative to more rural settings. Stormwater contributes directly to thermal pollution as well; as the water runs over the land, it can be warmed by the land surface and may cause significant increases in stream temperatures. Any reductions to stormwater flow will decrease the amount of sediment, nutrients, thermal pollution, toxins, and pathogens that enter area waterbodies. See Section 5.5 of the Protection Plan for further details regarding stormwater. Objective 1 Control and/or minimize the input of nutrients, pathogens, and toxic compounds
(herbicides, pesticides, heavy metals, etc.) into surface water and groundwater. Objective 2 Maintain current levels of phosphorus and nitrogen in Grand Traverse Bay. Objective 3 Control and reduce the amount of stormwater runoff entering Bay and tributaries;
control and reduce the amount of pollutant in stormwater as well. Objective 4 Control and reduce thermal pollution in the watershed resulting from stormwater
inputs, impervious surfaces, lack of stream canopy, dams and lake-level control structures, and reduced groundwater inputs.
Objective 5 Maintain dissolved oxygen levels that support cold-water fish and other aquatic
species in cold-water lakes and streams. • Excessive Nutrients and Eutrophication: increases dissolved oxygen
use from plant respiration as well as from decaying plants Objective 6 Protect groundwater and surface water recharge areas and discourage water
withdrawals that negatively impact the sustainability of the aquatic system and water supply.
Objective 7 Minimize air deposition into surface water from sources including vehicles and
industrial, commercial, and municipal facilities.
139
Goal #3
Establish and promote land and water management practices that conserve and protect the natural resources of the watershed.
Designated Use: Navigation, Coldwater Fishery, Other Aquatic Life Pollutant or Stressor Addressed: Sediment, Nutrients, Thermal Pollution, Toxins, Changes to Hydrologic Flow, E. Coli and Pathogens
Objective 1 Establish and promote land management practices that conserve natural resources
and protect water quality throughout the watershed. • Avoid development that encroaches upon sensitive or biologically
important areas. • Preserve open space, sensitive/important natural areas, wetlands, and
desirable species of aquatic vegetation. • Protect critical riparian areas. • Minimize the change of terrestrial vegetation types from forest/shrub
species to turf or cropland species. • Limit habitat fragmentation by maintaining compact communities. • Properly manage working lands such as farms and woodlots. • Maintain or reduce the amount of impervious surfaces in the
watershed, especially in areas of high groundwater recharge. • Shift development to those areas (or subwatersheds) that can support a
particular type of land use or density. Objective 2 Promote voluntary arrangements and regulatory tools that help prevent
degradation of natural resources. Objective 3 Assist townships with zoning and master plans in developing ordinances to
protect water quality and natural resources, where an interest has been expressed. Examples of items to address include:
• Adequate setbacks for buildings • Minimize development clearings by landowners • Establish riparian buffers along waterways • Protecting wetlands
Objective 4 Establish and support stormwater best management practices that reduce the
amount and harmful effects of stormwater entering waterways. Improve stormwater management throughout the watershed.
Objective 6 When new or redevelopment of existing property takes place along shoreline and
residential areas, encourage appropriate provisions for water quality and natural resources in the approval process.
140
Objective 7 Increase awareness of developers and townships on the impacts of development on natural resources and biological communities from development.
Objective 8 Develop new and maintain existing wildlife corridors; minimize habitat
fragmentation due to development, dams/lake-level control structures, and other sources.
Note: Consider the private property rights of public citizens when developing and implementing tasks.
141
Goal #4
Enhance the amount and quality of recreational opportunities and support a sustainable local economy.
Desired Use: Recreation Pollutant or Stressor Addressed: Invasive Species, E. Coli and Pathogens
Objective 1 Watershed lakes and streams will support appropriate designated and desired
uses while maintaining their distinctive environmental characteristics and aquatic biological communities.
Objective 2 Maintain desirable sport, commercial, and tribal fishing quality throughout
watershed and Grand Traverse Bay. • Have fishing regulations that support a diverse fishing experience. • Ensure sufficient public access to fishing sites. • Maintain natural environments for fish habitat.
Objective 3 Increase the amount of connected trails for pedestrian use. Objective 4 Increase the number of boardwalks, gardens, and public parks along rivers and
lakes in urban settings. Objective 5 Ensure sufficient access to beaches, lakes, and streams for public use that does
not jeopardize the integrity of the resource. Objective 6 Ensure safe and clean areas for public swimming and other types of water
recreation. Objective 7 Ensure sufficient access for recreational boating. Objective 8 Reduce the impact of invasive species on recreation in the watershed. Objective 9 Focus on promoting a balance between environmental, local economy, and
societal needs. Note: Consider the following items when developing and implementing tasks:
• Tourism is a major source of revenue for all areas in the watershed. • The private rights of individuals must be protected while at the same time providing ample opportunity
for public recreation. • Weigh the factors between supporting a sustainable economy and protecting the environment. • Be sensitive to businesses’ rights to profit.
142
Goal #5 Establish and promote educational programs that support stewardship and
watershed planning goals, activities, and programs.
Public I/E Campaign Pollutant or Stressor Addressed: All
Objective 1 Establish a successful public Information and Education (IE) Program throughout
the Grand Traverse Bay watershed. This public IE strategy is outlined in Section 7.4 in the protection plan.
Objective 2 Educate watershed users and the general public about the value of the watershed
and bay to the community and of their responsibility to be stewards of this community asset.
Objective 3 Regularly inform public about the watershed, activities, study findings,
success/example projects, and opportunities for contribution (organization to public).
Objective 4 Provide focused information to residents, visitors, local governments, and other
target groups on priority topics (organization to individual). Objective 5 Involve the citizens, public agencies, user groups and landowners in
implementation of the watershed plan through meetings and workshops with individuals or groups.
Objective 6 Develop ‘tourism ethic’ for area businesses to pass on to tourists. Market the fact
that residents and businesses of the Grand Traverse Bay watershed are committed to protecting the watershed and that tourists who come here to enjoy the bay and watershed should do the same. “If you come here, you must protect it too.”
143
Goal #6 Preserve the distinctive character and aesthetic qualities of the watershed.
Desired Use: Aesthetic Character Pollutant/Environmental Stressor Addressed: All
Objective 1 Support public and private needs while promoting economic sustainability and a
sense of community. Preserve existing settings of particular historical and/or cultural importance.
Objective 2 Maintain the visual quality of desirable viewsheds while supporting landowner
desires for property use, privacy, and security. Objective 3 Maintain open space, parks, greenways, and natural areas to allow for aesthetic
enjoyment and to sustain the perception of the high quality of life that brings people to the area.
Objective 4 Increase access to recreational lands and viewsheds through local land trusts.
144
CHAPTER 7 IMPLEMENTATION TASKS 7.1 Summary of Implementation Tasks In an effort to successfully accomplish the goals and objectives listed in Chapter 6, specific and tangible recommendations were developed based on the prioritization of watershed pollutants, sources, and causes while also looking at the priority areas in the watershed (Tables 20, 21, 24, and 25). These implementation tasks (also known as Best Management Practices or BMPs – See next section for discussion) are listed in Section 7.3 and represent an integrative approach, combining watershed goals and covering more than one pollutant at times, to reduce existing sources of priority pollutants and prevent future contributions. It is intended that these BMPs be implemented in priority areas in the watershed (Figure 17, Table25). Table 35 suggests guidelines for locating some of the BMPs listed and notes specific watershed areas for implementation. The project steering committee found it helpful to summarize the implementation tasks by the pollutant and/or source it deals with, placing all implementation tasks into various categories. In this way, organizations may work on a specific issue (i.e., urban stormwater or shoreline restoration) that may contribute more than one type of watershed pollutant and meet more than one watershed goal. The categories are as follows:
1. Shoreline Protection and Restoration 2. Road Stream Crossings 3. Agriculture 4. Hydrology 5. Habitat, Fish and Wildlife 6. Stormwater 7. Wastewater 8. Human Health 9. Wetlands 10. Invasive Species 11. Land Protection and Management 12. Development 13. Zoning and Land Use 14. Groundwater 15. Monitoring 16. Desired Uses
For each action step, the organization(s) best suited to help implement the task along with estimated costs to implement each item has been identified where possible. A timeframe of 10 years was used to determine the scope of activities and the estimated costs for implementing the
145
tasks. Tasks that should be done in the short term were given a timeframe of 3 years. Tasks that should be undertaken annually were given a timeframe of “ongoing.” Finally, the project steering committee looked at the major sources of pollution in the watershed and carefully considered the impacts of each and measures that need to be taken to reduce their impacts. Feasibility of task implementation and its likelihood of pollutant reduction were considered as well. It was decided that focusing on reducing and/or eliminating the following pollutant sources will address the bulk of pollution entering the Grand Traverse Bay and its surrounding watershed (listed in no particular order):
• Streambank and Shoreline Erosion • Stormwater • Road Stream Crossings • Fertilizer Use • Lack of Riparian Buffer • Reduction of Wetlands
146
7.2 Best Management Practices Best Management Practices (BMPs) are any structural, vegetative, or managerial practices used to protect and improve surface water and groundwater (DEQ 2001). It is important to note that 1) no BMP can be used at every site, and 2) no BMP can include so many specifications that all possible uses and all possible conditions are included. Each site must be evaluated, and specific BMPs can be selected which will perform under the site conditions. For Best Management Practices to be effective, the correct method, installation, and maintenance need to be considered for each site. Addressing each of these factors will result in a conservation practice that can prevent or reduce nonpoint source pollution. Structural BMPs are physical systems that are constructed for pollutant removal and/or reduction. This can include rip-rap along a streambank, rock check dams along a steep roadway or detention/retention basins, oil/grit separators, and porous asphalt for stormwater control. Non-structural BMPs include managerial, educational, and vegetative practices designed to prevent or reduce pollutants from entering a watershed. These BMPs include buffers and filter strips, but also include education and public involvement programs, land use planning, natural resource protection, regulations, operation and maintenance or any other initiative that does not involve designing and building a physical structure. Although most of these non-structural BMPs are difficult to measure quantitatively in terms of overall pollutant reduction and other parameters, research demonstrates that these BMPs have a large impact on changing policy, enforcing protection standards, improving operating procedures and changing public awareness and behaviors to improve water quality and quantity in a watershed over the long term. Moreover, they target source control which has been shown to be more cost effective than end-of-the-pipe solutions (i.e. “An ounce of prevention is worth a pound of cure”). Therefore, these BMPs should not be overlooked, and in some cases, should be the emphasis of a water quality management program. It is important to note that installing a single BMP has the potential to reduce more than one type of pollutant (and source as well). For example, installing a riparian buffer will reduce a number of different pollutants (sediment, nutrients, toxins, etc.), as well as reduce impacts from fertilizer use and streambank erosion. Also, installing more than one BMP at a single site will increase the likelihood of pollutant reduction, but the effects will not be cumulative. The following table (Table 35) suggests general guidelines to use when deciding specific locations to install or use BMPs in the Grand Traverse Bay watershed. The last row on the table suggests different areas within the watershed to apply types of BMPs.
147
TABLE 35: GENERAL GUIDELINES FOR LOCATING BMPS
Amount of Development Undeveloped Developing Developed
• Maintain pre-development hydrology and prevent loss of habitat
• Minimize sediment and nutrient inputs
• Emphasize filtering systems
• Maintain pre-development hydrology and prevent loss of habitat
• Maximize pollutant removal
• Emphasize filtering systems
• Focus on stormwater management
• Maximize pollutant (sediment, nutrients, toxics) removal and quantity control
• Implement systems that reduce hydrologic instability
• Emphasize filtering systems
Example Locations in Designated Priority Areas
Headwater Areas: Chain of Lakes Upper Boardman River Leelanau County
Sprawl Areas: Garfield Township East Bay Township Acme Township Elmwood Township Village of Elk Rapids Village of Suttons Bay
City of Traverse City Garfield Township
Table concept taken from Mill Creek Watershed Management Plan (HRWC 2003); BMP location guidelines are adapted from the rapid watershed assessment protocol of the Center for Watershed Protection (CWP 1998) Table 36 lists potential systems of commonly used Best Management Practices (BMPs) that deal with various types of pollutant sources, as well as where to find more information about each type of BMP. The table also lists, where possible, the potential load reduction for each type of BMP. However, some of this information was not obtained due to the timeframe and scope of this project, and the fact that some of this type of information is not readily available. In addition, some of the research found was not relevant because it was either conducted in a vastly different region (i.e. southern United States) or done on a much smaller scale.
148
TABLE 36: BMP EXAMPLES BY SOURCE
Major Source or Cause
Affected Pollutant
Potential System of BMPs (not inclusive)
Potential Load
Reduction BMP Manual or Agency Contact
Bank/Shoreline Erosion Sediment Habitat Loss Stream bank stabilization
Varies (see milestones in Section 7.3)
Guidebook of BMPs for Michigan Watersheds Michigan Ag BMP Manual
Lack of Streamside Canopy and Riparian Buffer
Nutrients Thermal Poll. Riparian buffers See Table 37
Guidebook of BMPs for Michigan Watersheds Natural Resources Protection Strategy for Michigan Golf Courses
Stormwater and Impervious Surfaces
Sediment Nutrients Toxins Pathogens Thermal Poll Changes to Hydro Flow
*Numerous – See Table 37 *Develop stormwater management plans
See Table 37
Stormwater Management Guidebook Guidebook of BMPs for Michigan Watersheds Public Information and Education Strategy Center for Watershed Protection – Stormwater Center Website
Road Crossings - eroding, failing, outdated
Sediment Changes to Hydro Flow
Road Crossing BMPs (vary widely – See Road Stream Crossings in Section 7.3)
Varies (see milestones in Section 7.3)
Guidebook of BMPs for Michigan Watersheds
Residential/Commercial Fertilizer Use Nutrients Workshops, Brochures,
Flyers, Videos, Etc.
Varies/ Not available/ See Riparian Buffer
Public Information and Education Strategy
Agriculture Fertilizers Nutrients
*Cover crops *Grassed Waterway *Grade Stabiliz. Structures *Conservation Crop Rotation w/ Tillage *Other Ag BMPs from manual *NRCS Cost-Share Programs
Varies/ Not available
Michigan Ag BMP Manual USDA – NRCS
Agriculture – Fuel Spills Toxins Spill centers for fueling stations Not available Michigan Ag BMP Manual USDA – NRCS
149
TABLE 36: BMP EXAMPLES BY SOURCE CONT’D
Major Source or Cause
Affected Pollutant(s)
Potential System of BMPs (not inclusive)
Potential Load
Reduction BMP Manual or Agency Contact
Animal Waste
Nutrients Pathogens
*Watercourse crossings *Fence livestock out of streams *Waste Storage Facility *Riparian buffers *NRCS Cost-Share Programs
Not available (Riparian Buffer – See Table 37)
Michigan Ag BMP Manual Guidebook of BMPs for Michigan Watersheds USDA – NRCS
Septic Systems (Leaking) Nutrients Pathogens
*Workshops, Brochures, Flyers, Videos, Etc. * Mandatory inspections *Ensure proper septic system design *Demo projects for alternative wastewater treatment systems
Varies/ Not available Public Information and Education Strategy
Reduction of Wetlands
Sediment Nutrients Changes to Hydro Flow
Restoration of wetlands See Table 37 Guidebook of BMPs for Michigan Watersheds Center for Watershed Protection
Development and Construction
Sediment Habitat Loss
*Initiatives to promote open space and land preservation and protection *Encourage ‘watershed friendly design’ *Implement soil erosion control measures *Construction BMPs (Construction barriers, Staging and scheduling, Access roads, Grading) *Workshops, Brochures, Flyers, Videos, Etc.
Varies/ Not available
Guidebook of BMPs for Michigan Watersheds Public Information and Education Strategy
150
TABLE 36: BMP EXAMPLES BY SOURCE CONT’D
Major Source or Cause
Affected Pollutant(s)
Potential System of BMPs (not inclusive)
Potential Load
Reduction BMP Manual or Agency Contact
Erosion stemming from human access problems Sediment Barriers, signs, stairs to
prevent human access Not available Guidebook of BMPs for Michigan Watersheds
Marinas and Gas Stations Toxins Spill containment kits Not available
Dams N/A *Dam Removal *Cold Water Outlet Installation *Bypass for Fish Ladder
Not available MDNR
Purposeful or Accidental Introduction of Invasive Species
Invasive Species
*Boat washing stations *Workshops, Brochures, Flyers, Videos, Etc. *Educational Programs
Not available Public Information and Education Strategy
Not available Guidebook of BMPs for Michigan Watersheds Stormwater Management Guidebook
151
Pollutant Reduction Estimates for Stormwater BMPs The Center for Watershed Protection has compiled a considerable amount of information regarding the effectiveness of selected stormwater BMPs. However, in total, very little information is available regarding the effectiveness of stormwater BMPs. Table 37 lists the total percent removal of phosphorus, nitrogen, sediment (total suspended solids), and metals and bacteria for selected stormwater BMPs. Listing BMP effectiveness by percentage is a much more useful way of displaying the data rather than using specific values, which can be deceiving depending on the size of BMP implemented or installed. This is because specific values for pollutant removal depend on 1) the size of BMP implemented (feet of riparian buffer installed or acres of stormwater detention ponds), and 2) how much pollution was initially coming from the source. It should be noted that it is assumed that the percent removal values in Table 37 are comparative numbers that state how much pollutant was removed compared to no BMP implementation at the site. For example, it is assumed that Porous Pavement values state the percentage of pollutant removed compared to if regular pavement were there instead; or that Riparian Buffer values state the percentage of pollutant removed compared to if no buffer was there and it was landscaped lawn instead. For more specific information on these stormwater BMPs, please see the Center for Watershed Protection’s Stormwater Center website at www.stormwatercenter.net. Additionally, keep in mind that not every BMP may be the best selection for every site. Some places are better suited for specific kinds of BMPs. There are other factors to consider besides pollutant removal efficiency when deciding which BMP to use at a site. Other factors include the size of site, money available for implementation, and the purpose of the land (i.e., what the site will be used for).
TABLE 37: POLLUTANT REMOVAL EFFECTIVENESS OF SELECTED STORMWATER BMPS
Management Practice
Total % Phosphorus
Removal
Total % Nitrogen Removal
Total % Suspended
Solids Removal
% Metal and Bacteria Removal
Other Considerations
Riparian Buffer* Grass: 39-88 Forest: 23-42
Grass: 17-87 Forest: 85
Grass: 63-89 Forest: N/A n/a - Increase in property value
$45,700 for a 1 acre-foot pond - Proper design and maintenance improves performance - Relatively inexpensive
153
TABLE 37: POLLUTANT REMOVAL EFFECTIVENESS OF SELECTED STORMWATER BMPS CONT’D
Management Practice
Total % Phosphorus
Removal
Total % Nitrogen Removal
Total % Suspended
Solids Removal
% Metal and Bacteria Removal
Other Considerations
Street Sweeping (dry-vacuum assisted)
15-40 15-40 50-88 n/a
Sweeper: $60,000 - $180,000 - Costs also include staff and training
Stabilize Soils on Construction Sites n/a n/a 80-90 n/a
Sediment Basins or Traps at Construction Sites
n/a n/a 65 n/a
Oil Grit Separator*** 37 15 41
Metals: Lead: 10 Zinc: 39
- Should be ‘off-line’ from major stormwater conveyance system - Sand filters much more effective
*Pollutant removal efficiencies will increase as buffer width increases. Grasses in this case mean native grasses and not regular lawn or turf grass. ** Wetlands are among the most effective stormwater practices in terms of pollutant removal, and also offer aesthetic value. While natural wetlands can sometimes be used to treat stormwater runoff that has been properly pretreated, stormwater wetlands are fundamentally different from natural wetland systems. Stormwater wetlands are designed specifically for the purpose of treating stormwater runoff, and typically have less biodiversity than natural wetlands both in terms of plant and animal life. There are several design variations of the stormwater wetland, each design differing in the relative amounts of shallow and deep water, and dry storage above the wetland. ***Evidence for oil grit separators overwhelmingly suggests that oil-grit separators are a very poor stormwater practice and should probably be dropped as a treatment option unless these systems are designed off-line and with the same treatment volume of other stormwater practices. Values obtained from Center for Watershed Protection’s Stormwater Center website (www.stormwatercenter.net) and Practice of Watershed Protection Manual (Schueler and Holland 2000). It should be noted that information regarding the pollutant removal efficiency, costs, and designs of structural stormwater BMPs is constantly evolving and improving. As a result, information contained in Tables 36 and 37 is dynamic and subject to change.
Calculating Streambank and Shoreline Erosion Erosion from streambanks and shorelines can vary widely. In general, one can calculate the sediment and nutrients saved from entering a stream by eliminating the source of erosion using the MDEQ Pollutants Controlled Manual and the Channel Erosion Equation (DEQ 1999):
Sediment Reduced (T/yr) = Length (ft.) x Height (ft.) x LRR (ft./yr.) x Soil weight (ton/ft3)
LRR: Lateral Recession Rate Soil weight: Values available in MDEQ Pollutants Controlled Manual, Exhibit 1 (DEQ 1999)
In turn, phosphorus and nitrogen attached to soil particles will be saved from entering the stream. The following calculations may be used to estimate the amount of phosphorus and nitrogen reduced by repairing an erosion source.
Phosphorus Reduced (lb/yr) =
Sediment reduced (T/yr) x 2000 lb/T x 0.0005 lb P/lb of soil x correction factor
Nutrient Reduced (lb/yr) = Sediment reduced (T/yr) x 2000 lb/T x 0.001 lb N/lb of soil x correction factor
Correction factor: Soil texture correction factors available in
Categories: 1. Shoreline Protection and Restoration 2. Road Stream Crossings 3. Agriculture 4. Hydrology 5. Habitat, Fish and Wildlife 6. Stormwater 7. Wastewater 8. Human Health
9. Wetlands 10. Invasive Species 11. Land Protection and Management 12. Development 13. Zoning and Land Use 14. Groundwater 15. Monitoring 16. Desired Uses
Organization Acronyms:A-CD – Antrim Conservation District CDs – All Conservation Districts City of TC – City of Traverse City CGOV – County Governments CRA – Conservation Resource Alliance MDEQ – Michigan Department of Environmental Quality MDNR – Michigan Department of Natural Resources ERCOL – Elk River Chain of Lakes Steering Committee EPA – Environmental Protection Agency FERC – Federal Energy Regulatory Commission GLEC – Great Lakes Environmental Center GTBOCI – Grand Traverse Band of Ottawa and Chippewa Indians GT-CD – Grand Traverse Conservation District GT County – Grand Traverse County GTRLC – Grand Traverse Regional Land
Conservancy Health Depts. – Local Health Departments ISEA – Inland Seas Education Association K-CD – Kalkaska Conservation District LA – Lake Associations LC – Leelanau Conservancy L-CD – Leelanau Conservation District LGOV – Local Governments M-DOT – Michigan Department of Transportation
MLUI – Michigan Land Use Institute MSU-E – Michigan State University Extension NRCS – USDA Natural Resources Conservation
Service NWMCOG – Northwest Michigan Council of
Governments RCs – County Road Commissions TART – Traverse Area Recreational and
Transportation Trails Inc. TCLP – Traverse City Light and Power TOMWC – Tip of the Mitt Watershed Council TWC – The Watershed Center Grand Traverse Bay OWTTF – Onsite Wastewater Treatment Task Force USGS – United States Geological Survey USCG – United States Coast Guard
Other Organizations: Chambers of Commerce, Convention Visitors Bureau Economic Development Corporation GT County Resource Recovery Office Local Realtors, Businesses MI Agricultural Stewardship Assoc. MSU-E Groundwater Stewardship New Designs for Growth Northern Lakes Economic Alliance Trash Haulers Schools, Universities
Estimated Costs and Timeframe: For costs associated with salaries, an average watershed technician rate of $35/hour was applied. For tasks to be completed by a specialized consultant, a rate of $50/hour was used. Tasks that will be done on a yearly or site by site basis are noted as such ($X/yr or $X/site). Appendix E lists average rates for costs associated with purchasing materials for and installing standard BMPs. Further details are noted where applicable. Tasks that should be completed in the short-term were given a timeframe of 3 years; long-term tasks were given a timeframe of 10 years; tasks that should be undertaken annually were given a timeframe of “ongoing.”
IMPLEMENTATION TASKS
156
Task Milestones: Project milestones for specific tasks were established where feasible. The milestones identify when the noted task should be completed. They are meant to guide implementation priorities and measure progress. Key milestones include completing streambank erosion restoration projects, repairing road stream crossings, developing stormwater management plans and starting stormwater remediation efforts in urban areas, and updating zoning ordinances (Table 38).
TABLE 38: SUMMARY OF PROJECT MILESTONES FOR IMPLEMENTATION TASKS
Task Milestone and Timeline
Shoreline Protection and Restoration
Task 3: Riparian buffers on publicly owned property in the watershed.
1. 50% in priority area by 2010 2. 75% in priority area by 2015
Task 4: Riparian buffers on private property 10% in priority area by 2015
Task 6: Conduct or evaluate existing streambank and shoreline erosion surveys; compile list of priority areas.
Update again in 2015
Task 7: Stabilize streambanks at priority sites
Boardman River 1. Complete update – June 2006 2. Restore 12 road stream crossing or
streambank erosion sites each year Elk River Chain of Lakes 3 moderate sites fixed by 2010
Task 8: Continue current streambank restoration efforts in Kid’s Creek and its tributaries; stabilize streambanks; install stormwater and road crossing BMPs where necessary; install riparian buffers
1. Task list by 2008 2. Riparian buffer along 30% of Kids
Creek length in Traverse City and Garfield Township by 2015
Task 10: Update local ordinances to ensure best management practices are utilized on private property along the water’s edge; Adopt ordinances or establish policies that maintain these practices for the maintenance of public lands as well.
1. Update local ordinances in City of Traverse City and Garfield Township by 2010.
2. Update local ordinances in townships around Torch Lake by 2007
3. Adopt appropriate ordinance upgrades for other townships and municipalities along Grand Traverse Bay by 2015
Task 12: Marina BMPs BMPs at 3 marinas on GT Bay by 2010.
157
TABLE 38: SUMMARY OF PROJECT MILESTONES FOR IMPLEMENTATION TASKS CONT’D
Task Milestone and Timeline Road Stream Crossings
Task 2: Road stream crossing BMPs
West Bay Shoreline and Tributaries Fix 8 severe sites by 2015 Boardman River Complete update – June 2006 Restore 12 road stream crossing or streambank erosion sites each year Kalkaska County (Rapid River) Fix last 3 sites on Rapid River by 2010 Elk River Chain of Lakes – Antrim Co. Fix 6 road crossing sites (2 severe, 4 moderate) by 2015
Task 5: Stormwater BMPs in urban areas One major stormwater BMP installed each year
Task 6: Stormwater BMPs in Kid’s Creek within the urban areas of Traverse City including low impact design elements
BMPs installed and completed by 2015
Task 7: Construct wetland area in Suttons Bay at Inland Seas Education Association
Complete by 2006
158
TABLE 38: SUMMARY OF PROJECT MILESTONES FOR IMPLEMENTATION TASKS CONT’D
Task Milestone and Timeline Stormwater cont’d Task 9: Upgrade or update applicable ordinances for
local governments to accommodate and encourage more innovative forms of stormwater management
1. Update local ordinances in City of Traverse City and Garfield Township by 2010.
2. Update local ordinances in townships around Torch Lake by 2007
3. Adopt appropriate ordinance upgrades for other townships and municipalities along Grand Traverse Bay by 2015
Wastewater and Septics
Task 1: Complete shoreline cladophora survey Complete survey by 2010
Task 3: Demonstration projects utilizing alternative onsite wastewater treatment systems One demonstration site in place by 2010
Human Health Issues None Wetlands None
Invasive Species Task 1: Boat washing stations at marinas and boat
launches One boat washing station a year
Task 5: Purple loosestrife eradication program Program in place by 2008 Land Protection and Management None
Development Task 4: Monitor Soil Erosion and Sedimentation
construction permits Establish tracking system by 2007
Zoning and Land Use Task 2: Assist townships with zoning and master plans to
develop ordinances that protect water quality and natural resources.
1. Update local ordinances in City of Traverse City and Garfield Township by 2010.
2. Update local ordinances in townships around Torch Lake by 2007
3. Adopt appropriate ordinance upgrades for other townships and municipalities along Grand Traverse Bay by 2015
Groundwater None
159
TABLE 38: SUMMARY OF PROJECT MILESTONES FOR IMPLEMENTATION TASKS CONT’D
Task Milestone and Timeline Monitoring Task 3: Update shoreline inventory of Grand Traverse
Bay every 5 years Update by 2008
Task 4: Inventory of near- and offshore areas along Grand Traverse Bay; sediment analysis of nearshore areas; aquatic weed bed surveys
Complete inventory by 2009
Task 8: Further evaluation and monitoring of nutrient, bacterial and toxic pollution sites identified in the Boardman Lake Watershed Management Plan
Complete task by 2009
Task 10: Document the effectiveness of BMP implementation; Work with partners to develop a standardized methodology
Develop standard methodology by 2008
160
Shoreline Protection and Restoration
Goal(s) Accomplished:
1) Aquatic and terrestrial ecosystems 2) Quality of water resources
3) Land and water management Task 1: Inventory riparian corridors on public property (and parks) to determine priority
areas where riparian vegetated stream and lakeshore buffers should be installed. (See Section 5.5 of protection plan for a discussion about buffers.)
Estimated Cost: $10,000 Timeline: 3 years Priority: High Potential Project Partners: TWC, CRA, MDNR, CDs, GTBOCI, TOMWC, LA, LGOV, ERCOL Task 2: Inventory riparian corridors on private property to determine priority areas where
riparian vegetated stream and lakeshore buffers should be installed. (See Section 5.5 of protection plan for a discussion about buffers.)
Estimated Cost: $40,000 Timeline: 3 years Priority: High Potential Project Partners: TWC, CRA, MDNR, CDs, GTBOCI, TOMWC, LA, LGOV, ERCOL Task 3: Work with municipalities and other government organizations to install riparian
buffers on publicly owned property in the watershed. Pollutant/Environmental Stressors Reduced: Changes to Hydrology, Loss of Habitat, Nutrients, Thermal Pollution, Toxics, Sediment
Estimated Cost: $50,000/yr Timeline: 10 years Priority: High Potential Project Partners: TWC, CRA, CDs, GTBOCI, TOMWC, LA, MDNR, LGOV, ERCOL Milestone: 50% of buffers established on public property by 2010, 75% established by 2015 Task 4: In areas that have already been inventoried, work with interested landowners to
install riparian buffers in priority areas. Pollutant/Environmental Stressors Reduced: Changes to Hydrology, Loss of Habitat, Nutrients, Thermal Pollution, Toxics, Sediment
Estimated Cost: $50,000/yr Timeline: 10 years Priority: High Potential Project Partners: TWC, CRA, CDs, GTBOCI, TOMWC, LA, ERCOL Milestone: 10% of buffers established on private property by 2015
161
Task 5: Establish shoreline riparian buffer demonstration sites to show riparian
landowners how to create buffers that are both aesthetic and effective. Pollutant/Environmental Stressors Reduced: Changes to Hydrology, Loss of Habitat, Nutrients,
Pathogens, Thermal Pollution, Toxics, Sediment Estimated Cost: $5,000/site Timeline: 10 years Priority: High Potential Project Partners: TWC, CDs, MSU-E Groundwater Stewardship, TOMWC, LA, ERCOL Milestone: 2 riparian buffers demo sites by 2008 Task 6: Conduct or evaluate existing streambank and shoreline erosion surveys to
determine sites where bank stabilization and restoration is needed and compile list of priority areas.
Estimated Cost: $90,000 Timeline: ongoing, update every 10 years Priority: High Potential Project Partners: TWC, CRA, CDs, GTBOCI, TOMWC, LA, ERCOL Milestone: Update again in 2015 Task 7: Stabilize streambanks at priority sites and use biotechnical methods where
possible. Include costs and time for maintenance of stabilized sites. (Note: There are many more sites that need streambank stabilization than what is listed here.) Pollutant/Environmental Stressors Reduced: Changes to Hydrology, Loss of Habitat, Nutrients, Thermal Pollution, Toxics, Sediment
Boardman River Estimated Cost: ~$3,500/ea (varies depending on proposed BMPs) Timeline: 10 years Priority: High Potential Project Partners: TWC, GT-CD, CRA, City of Traverse City Milestone 1: Complete road stream crossing and streambank erosion update – June 2006 Milestone 2: Restore 12 road stream crossing/streambank erosion sites each year (combo of severe and moderate ranked sites). Elk River Chain of Lakes Estimated Cost: Lakeshore stabilization: $160,000 ($80/ft x 100ft lot x 20 lots) Streambank Erosion Sites: ~$3,000/ea (varies depending on proposed BMPs) Timeline: 10 years Priority: High Potential Project Partners: TWC, CRA, A-CD, TOMWC, LA, ERCOL Milestone: 3 moderate sites fixed by 2010 (preventing 57 yd3 of soil, 79.8 lb P, and 159.6 lb N from entering watershed)
162
Task 8: Continue current streambank restoration efforts in Kid’s Creek and its tributaries. Work with municipalities and the Conservation District to stabilize eroding streambanks identified in 1991 erosion survey and install stormwater and road crossing BMPs where necessary (See Stormwater Task #6). Work with residents and municipalities to install riparian buffers where possible.
Pollutant/Environmental Stressors Reduced: Changes to Hydrology, Loss of Habitat, Nutrients, Thermal Pollution, Toxics, Sediment
Estimated Cost: $150,000/year Timeline: 10 years Priority: High Potential Project Partners: TWC, GT-CD, City of Traverse City, Garfield Twp. Milestone 1: Task list developed (including specific priority sites for stormwater and road crossing BMPs and streambank erosion sites) by 2008 Milestone 2: Riparian buffer installed along 30% of Kids Creek length in Traverse City and Garfield Township by 2015 Task 9: Identify and work with landowners along portions of the Grand Traverse Bay
identified in the 2002 shoreline inventory (Appendix C in Protection Plan) to stabilize the shoreline using biotechnical and soft engineering techniques. (Work with and gain permission from MDOT and private property owners.) Pollutant/Environmental Stressors Reduced: Changes to Hydrology, Loss of Habitat, Nutrients, Thermal Pollution, Toxics, Sediment
Estimated Cost: $15,000/year Timeline: 10 years Priority: Medium Potential Project Partners: TWC, CRA, CDs, GTBOCI, M-DOT Task 10: Update local ordinances to ensure best management practices are utilized on
private property along the water’s edge including the retention or establishment of shoreline vegetative buffers, minimizing vegetation removal and mowing to the water’s edge, and eliminating the dumping of grass clippings and other yard/solid wastes into the water. Adopt ordinances or establish policies that maintain these practices for the maintenance of public lands as well.
Pollutant/Environmental Stressors Reduced: Changes to Hydrology, Loss of Habitat, Nutrients, Thermal Pollution, Toxics, Sediment, Pathogens
Estimate Cost: $15,000 per ordinance Timeline: 10 years Priority: High Potential Project Partners: LGOV, ERCOL, LA Milestone 1: Update local ordinances in townships around Torch Lake by 2007 (A-CD). Milestone 2: Update local ordinances in City of Traverse City and Garfield Township by 2010. Milestone 3: Adopt appropriate ordinance upgrades for other townships and municipalities along Grand Traverse Bay by 2015 (see Zoning and Land Use Task #2).
163
Task 11: Install barriers, signage, or stairs where needed to manage human access to stream
and lakeside banks at risk of erosion (steep slopes, sandy soils) from recreational foot traffic. Pollutant/Environmental Stressors Reduced: Changes to Hydrology, Loss of Habitat, Nutrients, Thermal Pollution, Toxics, Sediment
Estimated Cost: $35,000/year Timeline: 10 years Priority: Medium Potential Project Partners: TWC, CRA, MDNR, CDs, LGOV, TOMWC, LA (Also: canoe, hiking, fishing and sportsman groups) Task 12: Work with area marinas to install and promote BMPs (like spill response carts
containing brooms, pads and absorbents; bilge sponges; emergency shut-off valves; and stormwater detention areas and buffer strips) that will reduce the amount of pollution coming from boat fuels, wastewater, erosion, and lack of riparian buffers. Pollutant/Environmental Stressors Reduced: Nutrients, Pathogens, Toxics, Sediment, Invasive Species
Estimated Cost: $10,000/year (cost for staff time and BMPs for one marina) Timeline: 3 years Priority: Medium Potential Project Partners: TWC, GTBOCI, TOMWC, CDs, ERCOL, LA, Local Businesses Milestone: BMPs installed at 3 marinas on GT Bay by 2010. Task 13: Minimize stormwater contamination from vehicle fuel by installing and
maintaining spill containment kits for gas and other fueling stations where necessary. Pollutant/Environmental Stressors Reduced: Toxics
Estimated Cost: $5,000/year Timeline: 10 years Priority: Medium Potential Project Partners: TWC, NRCS, CDs, GTBOCI, LGOV, LA, ERCOL, Chambers of Commerce Task 14: Continue Home*A*Syst, Lake*A*Syst, and Lawn*A*Syst programs in
watershed and encourage residents to utilize them. Pollutant/Environmental Stressors Reduced: Changes to Hydrology, Loss of Habitat, Nutrients,
Pathogens, Thermal Pollution, Toxics, Sediment Estimated Cost: $35,000/yr Timeline: 10 years Priority: Medium Potential Project Partners: MSU-E Groundwater Stewardship, CDs, TWC, NRCS, LA, ERCOL, Chambers of Commerce, Local Realtors
164
Task 15: Work with Conservation Districts to include native plants for riparian buffers in
annual plant sales. Pollutant/Environmental Stressors Reduced: Changes to Hydrology, Loss of Habitat, Nutrients,
Pathogens, Thermal Pollution, Toxics, Sediment Estimated Cost: $2,500 Timeline: 10 years Priority: Medium Potential Project Partners: CDs, TWC Task 16: Work with appropriate agencies to identify key areas where ‘no boat wake’ zones
should be implemented and support enforcement of those zones. Pollutant/Environmental Stressors Reduced: Changes to Hydrology, Loss of Habitat, Nutrients, Thermal Pollution, Toxics, Sediment
Estimated Cost: $5,500/year Timeline: 3 years, supporting enforcement is ongoing Priority: Low Potential Project Partners: TWC, MDNR, CDs, LGOV Task 17: Assist local and state government groups in enforcing shoreline regulations where
applicable. Pollutant/Environmental Stressors Reduced: Changes to Hydrology, Loss of Habitat, Nutrients, Pathogens, Thermal Pollution, Toxics, Sediment
Estimated Cost: $5,500/year Timeline: Ongoing Priority: Low Potential Project Partners: TWC, LA, CDs Task 18: Work with area businesses and property owners to encourage proper maintenance
and monitoring of underground fuel storage tanks and replace them when there is a risk of leakage from tank age, poor maintenance, or damage. Pollutant/Environmental Stressors Reduced: Toxics
1) Aquatic and terrestrial ecosystems 2) Quality of water resources
Task 1: Reevaluate list of priority road stream crossings needing remediation work every
10 years. Reevaluation work includes: 1) Obtain MDEQ completed road stream crossing inventory and expand the inventory of priority ranked areas to include a greater level of detail equal to other inventories in the area (completed for Antrim County streams), 2) Obtain any new data regarding road stream crossing inventories and completed improvement projects, 3) Inventory any remaining road stream crossings that have not been surveyed and determine priority areas. Estimated Cost: $10,000 Timeline: 3 years Priority: High Potential Project Partners: TWC, CRA, CDs, LGOV, ERCOL
Task 2: Where priority road stream crossings have been identified, improve, repair, or
replace outdated, failing, or eroding road stream crossings by implementing the appropriate BMPs from the following;
1. Road Crossings a) Remove obstructions that restrict flow through the culvert b) Replace undersized (too small or too short) culverts c) Remove and replace perched or misaligned culverts to avoid erosion
and provide for fish passage d) Install bottomless culverts and bridges where possible e) Replace culverts with a length that allows for > 3:1 slope on
embankments f) Revegetate all disturbed or bare soils on embankments
2. Road Approaches a) Create diversion outlets and spillways to direct road runoff and
stormwater away streams b) Pave steep, sandy approaches where feasible c) Dig or maintain ditches where needed and construct check dams if
required 3. Road Maintenance
a) Encourage Road Commissions to look at the long-term savings of crossing improvements over cumulative maintenance costs
4. Road Construction and Closure a) Minimize the number of access roads needed for oil, timber and gas
exploration. b) When constructing new roads, avoid streams if possible and maintain
natural channels to greatest extent possible. c) Close private roads that are no longer needed and restore stream
channel to natural condition if feasible.
166
Pollutant/Environmental Stressors Reduced: Changes to Hydrology, Loss of Habitat, Nutrients, Pathogens, Thermal Pollution, Toxics, Sediment
West Bay Shoreline and Tributaries Milestone: Fix 8 severe sites by 2015 Estimated Milestone Cost: $83,000 (includes costs for revegetation only) Timeline: 10 years Priority: High Potential Project Partners: TWC, CRA, L-CD, GTBOCI, RCs Boardman River watershed Milestone 1: Complete road stream crossing and streambank erosion update – June 2006 (revise goals in 2006 if necessary) Milestone 2: Restore 12 road stream crossing/streambank erosion sites each year (combo of severe and moderate ranked sites). Estimated Milestone 2 Cost: $50,000 each road stream crossing (highly variable depending on proposed BMPs) Timeline: 10 years Priority: High Potential Project Partners: TWC, CRA, GT-CD, RCs Kalkaska County (Rapid River) Milestone: Fix last 3 sites on Rapid River by 2010 Estimated Milestone Cost: $195,000 (costs obtained from KCD) Timeline: 10 years Priority: High Potential Project Partners: TWC, CRA, K-CD, RCs Antrim County (Elk River Chain of Lakes) Milestone: Fix 6 road crossing sites (2 severe, 4 moderate) by 2015 Estimated Milestone Cost: $295,000 (costs obtained from ACD) Timeline: 10 years Priority: High Potential Project Partners: TWC, CRA, A-CD, RCs Task 3: Map oil and natural gas well sites, pipelines, access roads that cross streams, and
processing facilities and disseminate to city and township planning commissions. Pollutant/Environmental Stressors Reduced: Changes to Hydrology, Thermal Pollution, Toxics, Sediment
Estimated Cost: $11,000 (consultant rate) Timeline: Ongoing Priority: Medium Potential Project Partners: TWC, CRA, CDs, TOMWC, NWMCOG, CGOV Task 4: Work with appropriate agencies to establish minimum setback of oil and gas wells
and their access roads from sensitive areas. Pollutant/Environmental Stressors Reduced: Changes to Hydrology, Loss of Habitat, Nutrients, Pathogens, Thermal Pollution, Toxics, Sediment
1) Aquatic and terrestrial ecosystems 2) Quality of water resources
3) Land and water management 6) Distinctive character and aesthetic qualities of watershed
Note: The Natural Resources Conservation Service (NRCS) of the United States Department of Agriculture is the primary federal agency that works with private landowners to help them conserve, maintain and improve their natural resources. NRCS's conservation programs help people reduce soil erosion, enhance water supplies, improve water quality, increase wildlife habitat, and reduce damages caused by floods and other natural disasters. Public benefits include enhanced natural resources that help sustain agricultural productivity and environmental quality while supporting continued economic development, recreation, and scenic beauty. The Grand Traverse Bay watershed was one of two Michigan watersheds selected for the 2006 Conservation Security Program (CSP) sign-up. CSP is a voluntary conservation program and has a unique role among USDA programs. It identifies and rewards those farmers and ranchers who meet the highest standards of conservation and environmental management on their operations. It creates powerful incentives for other producers to meet those same standards of conservation performance on their operations, and provides public benefits for generations to come. Task 1: Develop Conservation Plans, Resource Management Plans, or Progressive Plans
for all farms in the watershed that do not currently have one. As appropriate, information should be included on: crop nutrient management, weed and pest management, grassed waterways, sod centers in orchard rows, conservation buffers, proper manure management, conservation tillage, fencing off stream access to livestock, installing watercourse crossings, planting cover crops, and crop rotation. In addition, Conservation Plans that are more than 3 years old should be reviewed and updated to keep them eligible for USDA cost-share programs.
Pollutant/Environmental Stressors Reduced: Changes to Hydrology, Loss of Habitat, Nutrients, Pathogens, Thermal Pollution, Toxics, Sediment
Task 2: Work with agricultural producers that have an approved Conservation Plan to implement USDA-NRCS cost-share programs that provide cost incentives and/or rental payments to farmers who implement eligible conservation practices on their land. Examples of these types of programs include: Environmental Quality Incentives Program (EQIP), Conservation Security Program (CSP) and the Conservation Reserve Program (CRP). More information on these and other cost-share programs are on the USDA-NRCS website at http://www.nrcs.usda.gov/.
Pollutant/Environmental Stressors Reduced: Changes to Hydrology, Loss of Habitat, Nutrients, Pathogens, Thermal Pollution, Toxics, Sediment
Estimated Cost: $200,000/year Timeline: 10 years Priority: High Potential Project Partners: NRCS, MSU-E, CDs Milestone: Implement 10-15 plans/yr Task 3: Where appropriate, work with farmers to plant cover crops in fall on agricultural
lands vulnerable to runoff (i.e., corn, potatoes, etc.). Pollutant/Environmental Stressors Reduced: Changes to Hydrology, Nutrients, Thermal Pollution,
Toxics, Sediment Estimated Cost: $5,500 (salary costs only) Timeline: Ongoing Priority: High Potential Project Partners: NRCS, CDs, TWC Task 4: Minimize water contamination from farm vehicle fuel by installing and
maintaining spill containment centers for above ground fueling stations where necessary and possible. Pollutant/Environmental Stressors Reduced: Toxics
Estimated Cost: $5,500/station Timeline: 10 years Priority: High Potential Project Partners: TWC, NRCS, CDs, GTBOCI Task 5: Fence livestock and other animals out of streams and wetlands and establish
riparian buffers where needed in agricultural areas (Boardman River Valley and Elk River Chain of Lakes).
Pollutant/Environmental Stressors Reduced: Nutrients, Pathogens, Thermal Pollution, Sediment Estimated Cost: Varies with length of fence and buffer, the type of watercourse crossing, and water supply needed Timeline: 10 years Priority: Medium Potential Project Partners: NRCS, CDs, TWC
Task 6: Continue Farm*A*Syst program in watershed and encourage farmers to utilize it. Pollutant/Environmental Stressors Reduced: Changes to Hydrology, Nutrients, Thermal
Pollution, Toxics, Sediment Estimated Cost: $35,000/yr Timeline: 10 years Priority: Medium Potential Project Partners: MSU-E Groundwater Stewardship, NRCS, CDs, TWC Task 7: Promote sustainable agriculture (both financial and ecological) and value-added
ventures (taking a raw commodity and making their own product) for farmers. Value added ventures may include: bottling your own milk or operating a farm market/road side stand.
Pollutant/Environmental Stressors Reduced: Nutrients, Toxics Estimated Cost: $2,500/yr Timeline: Ongoing Priority: Low Potential Project Partners: NRCS, CDs, MI Agricultural Stewardship Assoc., Northern Lakes Economic Alliance, MLUI, Economic Development Corporation, TWC, Chambers of Commerce, Local Businesses Task 8: Explore the benefits, need for, and feasibility of developing local ordinances to
ensure appropriate management of and to protect against the negative water quality impacts of confined animal feeding operations (CAFOs) of 1,000 animal units or more.
1) Aquatic and terrestrial ecosystems 2) Quality of water resources
3) Land and water management See also: Road Stream Crossings; Stormwater Task 1: Map groundwater flow and major aquifers in the watershed. Estimated Cost: $350,000 Timeline: 3 years Priority: High
Potential Project Partners: TWC, USGS, CGOV, MDEQ, Universities Task 2: Conduct in-depth hydrologic analysis to determine year-round stream flows as
well as water quality measurements during baseflow, storm events, and spring runoff in order to provide a better estimate of pollutant loading throughout the Grand Traverse Bay watershed.
Estimated Cost: $25,000 - $50,000/yr Timeline: 10 years Priority: High
Potential Project Partners: TWC, LGOV, MDNR, MDEQ Task 3: Install BMPs where needed to constrain unnaturally wide channels and
concentrate channel flow into deeper, narrower channels. Pollutant/Environmental Stressors Reduced: Changes to Hydrology, Loss of Habitat, Nutrients, Thermal Pollution, Sediment
Estimated Cost: $25,000/year Timeline: 10 years Priority: High
Potential Project Partners: TWC, CRA, MDNR, CDs, TOMWC Task 4: Inventory and map existing dams and lake-level control structures to identify
inoperative, failing, or economically unfeasible dams that should be removed. Estimated Cost: $5,500 Timeline: 3 years Priority: Medium
Potential Project Partners: TWC, CRA, MDNR, TCLP, City of TC, CGOV Milestone: Complete inventory by 2009
171
Task 5: Work with owners and operators of dams and lake-control structures to ensure these structures are operated so that they mimic natural flow conditions of the river. Pollutant/Environmental Stressors Reduced: Changes to Hydrology, Loss of Habitat, Nutrients, Thermal Pollution, Sediment
Estimated Cost: $2,500/year Timeline: Ongoing Priority: Medium
Potential Project Partners: TWC, FERC, CGOV Task 6: Remove inoperative, failing, or economically unfeasible dams as well as priority
dams that are blocking fish passage. Pollutant/Environmental Stressors Reduced: Changes to Hydrology, Loss of Habitat, Thermal
Pollution, Sediment Estimated Cost: $1,000,000/removal Timeline: 10 years Priority: Low
Potential Project Partners: TWC, MDNR, CDs, TCLP, City of TC, CGOV
172
Habitat, Fish, and Wildlife
Goal(s) Accomplished:
1) Aquatic and terrestrial ecosystems 2) Quality of water resources
3) Land and water management 6) Distinctive character and aesthetic qualities of watershed
Task 2: Collect information that exists, and conduct stream inventories where needed, to
evaluate appropriate sites for in-stream habitat improvement projects such as lunker structures, island structures, half-log structures or log jams. Criteria to be assessed includes: woody debris, bank stability, riparian vegetation, in-stream cover, flow dynamics, and fish population structure
Estimated Cost: $35,000 Timeline: 3 years Priority: High
Task 4: Continue to implement the Conservation Resource Alliance’s Wild-Link program in the Grand Traverse Bay watershed to protect and enhance fish and wildlife habitat on private property within ecological corridors throughout the watershed. Pollutant/Environmental Stressors Reduced: Loss of Habitat
Estimated Cost: $72,000-$100,000/year Timeline: Ongoing Priority: High
Potential Project Partners: CRA Milestone: Have 60-70% participation rate from private property
owners in selected Grand Traverse Bay watershed corridor by 2015. This would achieve the estimated amount of coverage needed for a wildlife corridor to function.
Task 5: Assist local land conservancies with protection of lands that maintain or expand
wildlife corridors, protect sensitive wildlife and fisheries habitats such as wetlands, riparian corridors, etc., and protect habitat for threatened and endangered species.
See Land Protection and Management Tasks Task 6: Work with local units of government to explore feasibility of a locally funded
purchase of development rights/conservation easement acquisition program focused on preserving lands critical to water quality and wildlife habitat preservation. Use Peninsula Township as an example.
See Land Protection and Management Tasks Task 7: Work with owners and operators of dams and lake-control structures to 1) prevent
structural failures that often result in the release of sediments behind the dams and to ensure the proper disposal of dredge spoils, 2) install fish ladders where appropriate and necessary, and 3) install cold water withdrawals/outlets where needed. Pollutant/Environmental Stressors Reduced: Changes to Hydrology, Loss of Habitat, Nutrients, Thermal Pollution, Toxics, Sediment
Estimated Cost: $2,500/year Timeline: Ongoing Priority: Medium
Potential Project Partners: TWC, MDNR, CGOV
174
Stormwater
Goal(s) Accomplished:
1) Aquatic and terrestrial ecosystems 2) Quality of water resources
3) Land and water management Task 1: Form an area-wide Stormwater Task Force to tackle urban stormwater issues and
to provide a forum for discussing and finding solutions to problems by implementing stormwater BMPs and education initiatives. Pollutant/Environmental Stressors Reduced: Changes to Hydrology, Loss of Habitat, Nutrients, Pathogens, Thermal Pollution, Toxics, Sediment
Estimated Cost: $15,000 Timeline: 3 years Priority: High
Potential Project Partners: TWC, LGOV Milestone: Task force formed by 2006
Task 2: Conduct impervious surface assessments in the following subwatersheds: West
Bay Shoreline and Tributaries, Boardman River (upstream of Sabin Pond and Kid’s Creek), Old Mission Peninsula, Ptobego Creek, East Bay Shoreline and Tributaries, and the Elk River Chain of Lakes.
Estimated Cost: $100,000 (consultant rate) Timeline: 3 years Priority: High
Potential Project Partners: TWC, CGOV Milestone: Complete assessment by 2010.
Task 3: Map and count number of culverts/storm drain outlets in villages and other
municipalities that drain to major rivers, lakes, streams, and the Grand Traverse Bay. This has already been completed for the Boardman Lake watershed downstream of Sabin Pond, excluding Kid’s Creek, and for the rest of Traverse City.
Estimated Cost: $100,000 (consultant rate) Timeline: 3 years Priority: High
Task 4: Work cooperatively with local units of government to develop stormwater management plans and/or ordinances for each community using a variety of tools including mapping of existing storm sewers; identifying locations where retrofitting is needed; working with adjacent townships to manage joint stormwater; and ensure that emergency response plans exist for pollutant spills. Pollutant/Environmental Stressors Reduced: Changes to Hydrology, Loss of Habitat, Nutrients, Pathogens, Thermal Pollution, Toxics, Sediment
Estimated Cost: $25,000 Timeline: 10 years Priority: High
Potential Project Partners: TWC, LGOV Milestone: Complete one management plan every 2 years.
Task 5: Work with local governments, area businesses, and property owners to install the following stormwater BMPs in urban areas where appropriate. See Section 7.2 for stormwater BMP ideas and their pollutant removal effectiveness.
From the Center for Watershed Protection’s Approaches to Stormwater Treatment and Stormwater Practice and Design CDs, Watershed Leadership Kit Volumes 4 and 5.
3. Infiltration Practices: Infiltration Trench or Basin, Porous Pavement 4. Retention and Detention Ponds 5. Other Low Impact Design Elements: Rain/Roof Gardens, Native
Plantings, Riparian Buffers Pollutant/Environmental Stressors Reduced: Changes to Hydrology, Loss of Habitat, Nutrients, Pathogens, Thermal Pollution, Toxics, Sediment
Estimated Cost: $25,000/year (salary costs only) >$10,000,000 (BMP costs) Timeline: 10 years Priority: High
Potential Project Partners: TWC, LGOV, CDs, Local Businesses Milestone: One major stormwater BMP installed each year
Task 6: Implement stormwater BMPs in Kid’s Creek within the urban areas of Traverse
City including low impact design elements (i.e. rain gardens), riparian buffers and filter strips, and stormwater filtering and retention systems. Pollutant/Environmental Stressors Reduced: Changes to Hydrology, Loss of Habitat, Nutrients, Pathogens, Thermal Pollution, Toxics, Sediment
Estimated Cost: >$1,000,000 (BMP costs) Timeline: 10 years Priority: High
Potential Project Partners: City of TC, GTCD (Related Milestone from Shoreline Protection and Restoration Task #8:
Riparian buffer installed along 30% of Kids Creek length in Traverse City by 2015)
Milestone: BMPs installed and completed by 2015
176
Task 7: Construct wetland area in Suttons Bay at Inland Seas Education Association
property to filter out pollutants from stormwater coming from downtown Suttons Bay. Pollutant/Environmental Stressors Reduced: Changes to Hydrology, Loss of Habitat, Nutrients, Pathogens, Thermal Pollution, Toxics, Sediment
Estimated Cost: $40,000 Timeline: 3 years Priority: Medium
Potential Project Partners: ISEA Milestone: Complete by 2006
Task 8: Encourage the use of “low impact development” stormwater treatment techniques
in the Boardman Lake watershed to minimize the impacts of impervious surfaces, runoff and other potential impairments to water quality.
Pollutant/Environmental Stressors Reduced: Changes to Hydrology, Loss of Habitat, Nutrients, Thermal Pollution, Toxics, Sediment, Pathogens
Estimate Cost: $ Timeline: Ongoing Priority: High Potential Project Partners: TWC, City of TC, Garfield Township Task 9: Upgrade or update applicable ordinances for local governments to accommodate
and encourage more innovative forms of stormwater management. Pollutant/Environmental Stressors Reduced: Changes to Hydrology, Loss of Habitat, Nutrients,
Thermal Pollution, Toxics, Sediment, Pathogens Estimate Cost: $15,000 per ordinance Timeline: 3 years Priority: High Potential Project Partners: TWC, LGOV (Related Milestone from Shoreline Protection and Restoration Task #10) Milestone 1: Update local ordinances in townships around Torch Lake by 2007 (A-CD). Milestone 2: Update local ordinances in City of Traverse City and Garfield Township by 2010. Milestone 3: Adopt appropriate ordinance upgrades for other townships and municipalities along Grand Traverse Bay by 2015 (see Zoning and Land Use Task #2).
See Zoning and Land Use Tasks
177
Wastewater and Septics
Goal(s) Accomplished:
1) Aquatic and terrestrial ecosystems 2) Quality of water resources
3) Land and water management Task 1: Complete shoreline cladophora survey (follow TOMWC project conducted in
Chain of Lakes) to determine potential sites where there may be improperly working septic systems. Work with landowners to conduct dye testing to determine which septic systems are leaking, if any, in potential sited areas.
Estimated Cost: $72,000 Timeline: 10 years Priority: High
Potential Project Partners: TWC, TOMWC, LGOV, ERCOL, LA Milestone: Complete survey by 2010
Task 2: Offer advice and assistance to riparian landowners to help identify malfunctioning
Estimated Cost: $100,000 Timeline: 3 years Priority: High
Potential Project Partners: TWC, OWTTF, Health Depts., ERCOL, LA Milestone: One demonstration site in place by 2010
Task 4: Develop regulatory and financial mechanisms to assure adequate financing at
reasonable rates for onsite wastewater treatment systems, community collection and treatment systems, operation and maintenance. Pollutant/Environmental Stressors Reduced: Nutrients, Pathogens
Estimated Cost: $25,000 Timeline: 10 years Priority: High
Potential Project Partners: OWTTF, Health Depts., MLUI, LGOV
178
Task 5: Advocate for higher water quality standards (like those for Outstanding State Designated Resource Waters) for new and updated wastewater treatment systems.
Pollutant/Environmental Stressors Reduced: Nutrients, Pathogens Estimated Cost: $5,500/year Timeline: 10 years Priority: High
Potential Project Partners: TWC Task 6: Work with local governments and health departments to establish regular,
mandatory septic system inspections (through ordinances or by other means) in priority areas.
Pollutant/Environmental Stressors Reduced: Nutrients, Pathogens Estimated Cost: $2,500/year Timeline: 10 years Priority: Medium
Potential Project Partners: TWC, Health Depts., LGOV, OWTTF, ERCOL, LA
Task 7: Work with MDEQ and local governments to support actions to minimize nutrient
and pathogen discharges from municipal wastewater treatment plants, industrial/commercial facilities, and sanitary sewer overflows. Pollutant/Environmental Stressors Reduced: Changes to Hydrology, Loss of Habitat, Nutrients, Pathogens, Thermal Pollution, Toxics, Sediment Estimated Cost: $2,500/year Timeline: Ongoing Priority: Medium Potential Project Partners: TWC, LGOV, Health Depts., MDEQ, EPA
Task 8: Evaluate the water quality merits of replacing septic systems with a community
wastewater conveyance and treatment system where there is a high density of old or improperly working septic systems. Use the community wastewater treatment system being constructed at Northpoint Point as an example. Pollutant/Environmental Stressors Reduced: Nutrients, Pathogens
Estimated Cost: $2,500/year Timeline: 10 years Priority: Medium
Potential Project Partners: TWC, Health Depts., OWTTF, LGOV Task 9: Work with local health department officials who issue permits for new septic
systems to ensure property owners implement proper septic system design for the site conditions and consider their proximity to lakes, streams, and water table levels. Pollutant/Environmental Stressors Reduced: Nutrients, Pathogens
Estimated Cost: $1,500/year Timeline: Ongoing Priority: Medium
Potential Project Partners: TWC, Health Depts., OWTTF, ERCOL, LA
179
Task 10: Work with MDEQ, MDNR, and the Coast Guard to help monitor enforcement to
prevent illegal boat (recreational and commercial) discharges of sewage and gray water. Pollutant/Environmental Stressors Reduced: Changes to Hydrology, Loss of Habitat, Nutrients, Pathogens, Thermal Pollution, Toxics, Sediment
Potential Project Partners: TWC, Health Depts., MDEQ, LGOV
180
Human Health Issues
Goal(s) Accomplished:
2) Quality of water resources See also: Wastewater and Septics; Monitoring Task 1: Develop and promote Integrated Pest Management plans for agriculture, industrial
facilities, businesses, golf courses, schools, and residences. (These plans generally begin with preventative measures for reducing pest infestations and involve less toxic treatment of infestations when they do occur, such as natural native predators.)
Pollutant/Environmental Stressors Reduced: Toxics, Nutrients Estimated Cost: $50,000/year Timeline: 10 years Priority: High
Potential Project Partners: TWC, MSU-E, NRCS, Local Businesses, Audubon Society (they certify golf courses that are using IPM, chemical and pesticide free, or env. friendly)
Task 2: Establish air quality monitoring stations to detect trends in air quality. Estimated Cost: $75,000/each Timeline: 10 years Priority: Medium
Potential Project Partners: TWC, GTBOCI, MDEQ, GLEC, CGOV Task 3: Initiate burn barrel exchange program where people can trade in their burn barrels
for a discount on waste hauling and/or garbage bags, or free or discounted compost bins.
Potential Project Partners: TWC, GTBOCI, Health Dept., Trash Haulers, LGOV, GT County Resource Recovery Office
Task 4: Work with local authorities to develop ordinances that ban trash burning. Pollutant/Environmental Stressors Reduced: Toxics Estimated Cost: $25,000 Timeline: 10 years Priority: Low
Potential Project Partners: TWC, Local Gov
181
Wetlands
Goal(s) Accomplished:
1) Aquatic and terrestrial ecosystems 2) Quality of water resources
3) Land and water management See also: Land Protection and Management; Development; Zoning and Land Use Task 1: Work with local governments and lake associations to ground-truth existing
wetland maps throughout the watershed and put information into a GIS format. Estimated Cost: $100,000 (consultant rate) Timeline: 3 years Priority: High
Task 2: Identify wetlands of particularly high value, based on plant/animal species, etc.
Pollutant/Environmental Stressors Reduced: All Estimated Cost: $100,000 (should be combined with Task 1) Timeline: 3 years Priority: High
Potential Project Partners: TWC, LGOV, GTRLC, LC Task 3: Work with local governments, landowners, land conservancies, and other
organizations to restore wetland areas where appropriate. Enroll landowners in the NRCS Wetland Reserve Program. Pollutant/Environmental Stressors Reduced: All
Estimated Cost: $35,000/year Timeline: 10 years Priority: Medium
Task 4: Monitor enforcement of possible wetland filling violations.
Pollutant/Environmental Stressors Reduced: All Estimated Cost: $3,500/year Timeline: ongoing Priority: Medium
Potential Project Partners: TWC, LGOV, MDEQ
182
Invasive Species
Goal(s) Accomplished:
1) Aquatic and terrestrial ecosystems 4) Recreational opportunities and quality, sustainable local economy
Task 1: Work with local governments and businesses to install boat washing stations at
area marinas and public boat launches to avoid spread of invasive species. Pollutant/Environmental Stressors Reduced: Invasive Species
Estimated Cost: $10,000/year Timeline: 3 years Priority: High
Potential Project Partners: TWC, LGOV, ERCOL, LA, MDNR Milestone: Install one boat washing station a year.
Task 2: Support Great Lakes United efforts toward reducing spread of invasive species
throughout the watershed. Pollutant/Environmental Stressors Reduced: Nutrients, Pathogens
Estimated Cost: $2,500/year Timeline: Ongoing Priority: High Potential Project Partners: TWC Task 3: Monitor the spread of specific types of invasive species in the watershed (i.e.,
Estimated Cost: $5,500/year Timeline: Ongoing Priority: Medium Potential Project Partners: TWC, CRA, TOMWC, CDs, ERCOL, LA Task 4: Work with local service organizations and governments to clean up zebra mussels
on beaches. Pollutant/Environmental Stressors Reduced: Nutrients, Pathogens
Estimated Cost: $2,500/year Timeline: Ongoing Priority: Low Potential Project Partners: TWC, LGOV, ERCOL, LA Task 5: Develop purple loosestrife eradication program as done in the Grass River Natural
Estimated Cost: $100,000 Timeline: 10 years Priority: Low Potential Project Partners: TWC, ERCOL, LA, LGOV Milestone: Program in place by 2008
183
Land Protection and Management
Goal(s) Accomplished:
1) Aquatic and terrestrial ecosystems 2) Quality of water resources
3) Land and water management Task 1: Work with local units of government to develop and promote local initiatives that
preserve open space and sensitive/important natural areas. Pollutant/Environmental Stressors Reduced: All
Estimate Cost: $120,000/initiative (one per county) Timeline: 10 years Priority: High Potential Project Partners: GTRLC, LC, LGOV Task 2: Assist local land conservancies with protection of lands that maintain or expand
wildlife corridors, protect sensitive wildlife and fisheries habitats such as wetlands, riparian corridors, etc., and protect habitat for threatened and endangered species. Pollutant/Environmental Stressors Reduced: All
Estimated Cost: $5,500/year Timeline: Ongoing Priority: High
Potential Project Partners: TWC, TOMWC, CRA, CDs, LGOV Task 3: Continue to implement the Conservation Resource Alliance’s Wild-Link program
in the Grand Traverse Bay watershed to protect and enhance fish and wildlife habitat on private property within ecological corridors throughout the watershed.
See Habitat, Fish, and Wildlife Tasks
Task 4: Create an endowment fund to assist the local land conservancies in purchasing conservation easements on key priority parcels within the Grand Traverse Bay watershed. Parcels targeted for protection would contain sensitive physical and hydrologic features that are essential to preserving water quality (e.g. wetlands, water frontage, groundwater recharge, steep slopes, etc.). Pollutant/Environmental Stressors Reduced: All Estimated Cost: $1,500,000 (to start) Timeline: 10 years Priority: High Potential Project Partners: GTRLC, LC
184
Task 5: Develop a Revolving Conservation Land Acquisition Fund for conservancies to purchase lands for conservation easement implementation and resale. This would be for critical properties that are on the market or in cases where landowners are unwilling to sell the conservation easement, but would rather sell the land outright. This would provide a mechanism to allow local land conservancies to purchase the land, restrict the land with a conservation easement prohibiting or severely limiting building/development, and then resell the land to “conservation buyers” at its restricted value. This would require funds to cover the cost of the conservation easement. (i.e. difference in value). Pollutant/Environmental Stressors Reduced: All
Estimated Cost: $1,500,000 (to start) Timeline: 3 years Priority: High
Potential Project Partners: GTRLC, LC, LGOV Task 6: Assist local units of government and the State of Michigan in acquiring land for
preservation of water quality and sensitive ecological features. Pollutant/Environmental Stressors Reduced: All
Estimated Cost: $70,000/year Timeline: Ongoing Priority: Medium
Potential Project Partners: GTRLC, LC, LGOV Task 7: Work with local units of government to explore feasibility of a locally funded
purchase of development rights/conservation easement acquisition program focused on preserving lands critical to water quality and wildlife habitat preservation where public support exists. Use Peninsula Township as an example. This task should include a public opinion poll to determine the likelihood of voters to accept the program. Pollutant/Environmental Stressors Reduced: All
Estimate Cost: $120,000 per initiative Timeline: 10 years Priority: Low Potential Project Partners: GTRLC, LC, LGOV Task 8: Develop additional Designated Natural Areas throughout the watershed for
recreation and education. Estimated Cost: $100,000 Timeline: 10 years Priority: Low
1) Aquatic and terrestrial ecosystems 2) Quality of water resources
3) Land and water management Task 1: Work with homebuilders associations, contractors, developers, real estate
agencies, local government entities, and other appropriate organizations to 1) encourage ‘watershed friendly’ design, construction and maintenance of new and existing developments in the watershed and 2) to stress the importance of avoiding shoreline hardening where possible. Where shoreline hardening is necessary, make sure the structures are sited, designed, and installed properly to minimize the impact on beaches and nearshore sand drift.
Pollutant/Environmental Stressors Reduced: Changes to Hydrology, Nutrients, Thermal Pollution, Sediment
Estimate Cost: $50,000/yr Timeline: Ongoing Priority: High Potential Project Partners: TWC, LGOV, CDs, ERCOL, LA, Local Businesses Task 2: Work with appropriate local government agencies (i.e., County Drain
Commission) to recommend BMP’s for developers on construction sites and to ensure compliance with those BMP’s. Potential systems of BMPs to require include: access roads, construction barriers, grading, staging, and proper scheduling for other BMPs. Pollutant/Environmental Stressors Reduced: Changes to Hydrology, Nutrients, Thermal Pollution, Sediment
Estimate Cost: $50,000/yr Timeline: Ongoing Priority: High Potential Project Partners: TWC, LGOV, CDs, Local Businesses Task 3: Work with counties and other appropriate local government entities to implement
proper soil erosion control measures at construction sites. Pollutant/Environmental Stressors Reduced: Changes to Hydrology, Nutrients, Thermal Pollution, Sediment
Estimate Cost: $50,000/yr Timeline: 10 years Priority: High
Potential Project Partners: TWC, LGOV, CDs, ERCOL, LA, Local Businesses
186
Task 4: Monitor Soil Erosion and Sedimentation construction permits to determine the amount and location of new developments throughout the watershed.
Estimate Cost: $5,000/yr Timeline: 10 years Priority: Medium Potential Project Partners: TWC, CGOV, ERCOL, LA Milestone: Establish tracking system by 2007
187
Zoning and Land Use
Goal(s) Accomplished:
3) Land and water management Task 1: Inventory current Master Plans and Zoning Ordinances for counties, townships,
and municipalities to determine the types of protection given to water quality and natural resources.
Estimated Cost: $17,000 Timeline: Completed 2005 Priority: High Potential Project Partners: TWC, LGOV, NWMCOG, ERCOL Task 2: Assist townships with zoning and master plans to develop ordinances that protect
water quality and natural resources. Examples of topics to cover in the model ordinances include: mandatory building setbacks from bodies of water, minimizing development clearings by landowners, stormwater management, establishing riparian buffers along waterways, and protecting wetlands. Pollutant/Environmental Stressors Reduced: All
See also – Shoreline Protection and Restoration Task #10, Stormwater Task #9 Estimated Cost: $70,000/yr Timeline: Ongoing Priority: High Potential Project Partners: TWC, LGOV, ERCOL, LA, CDs Milestone 1: Update local ordinances in townships around Torch Lake by 2007 (A-CD). Milestone 2: Update local ordinances in City of Traverse City and Garfield Township by 2010. Milestone 3: Adopt appropriate ordinance upgrades for other townships and municipalities along Grand Traverse Bay by 2015. Task 3: Provide financial assistance to local units of government to amend or revise
master plans and adopt zoning ordinances designed to protect water quality (i.e. cluster zoning, vegetation buffers, etc.) and provide public recognition for those that do. Pollutant/Environmental Stressors Reduced: All
Estimated Cost: $189,000 (estimate 50% of local units [27] at $7,000 each) Timeline: 10 years Priority: High Potential Project Partners: TWC, LGOV, New Designs for Growth
188
Task 4: Develop workable and practical strategies to strengthen enforcement of existing land use regulations, soil erosion programs, and ordinances by appropriate local government bodies. Pollutant/Environmental Stressors Reduced: All
Estimated Cost: $50,000 Timeline: Ongoing Priority: Medium Potential Project Partners: TWC, LGOV, ERCOL, LA Task 5: Evaluate local zoning ordinances to determine the extent of use of the New
Designs for Growth Guidebook for all development projects (including re-development) and provide financial incentives and public recognition of those that comply with the guidelines. Pollutant/Environmental Stressors Reduced: All
Estimated Cost: $17,000 (can be combined with Task 1) Timeline: Ongoing Priority: Low Potential Project Partners: TWC, LGOV, ERCOL, LA, New Designs for Growth Task 6: Work with local units of government to explore feasibility of a locally funded
purchase of development rights/conservation easement acquisition program focused on preserving lands critical to water quality and wildlife habitat preservation. Use Peninsula Township as an example.
See Land Protection and Management Tasks Task 7: Upgrade or update applicable ordinances for Garfield Township and the City of
Traverse City to accommodate and encourage more innovative forms of stormwater management. See Stormwater Tasks
189
Groundwater
Goal(s) Accomplished:
2) Quality of water resources 3) Land and water management
See also: Wetlands Task 1: Identify priority groundwater discharge and recharge areas and distribute maps to
local governments and other organizations in the watershed. Estimated Cost: $100,000 Timeline: 10 years, map distribution ongoing Priority: High Potential Project Partners: TWC, LC, GTRLC, LGOV, MDEQ, USGS, Universities Task 2: Map groundwater flow and major aquifers in the watershed. See Hydrology Tasks Task 3: Inventory and summarize the status of wellhead protection plans. Support
groundwater/wellhead protection programs for municipal drinking water supplies. Pollutant/Environmental Stressors Reduced: Changes to Hydrology, Nutrients, Thermal Pollution
Task 4: Eliminate improperly capped abandoned wells to prevent contaminants from moving into and among groundwater aquifers via this route. Tasks will be to 1) inventory existing abandoned wells through surveys, well logs, and landowner interviews and 2) properly plug the abandoned wells. Pollutant/Environmental Stressors Reduced: Nutrients, Pathogens, Toxins
Estimated Cost: $25,000 (well inventory only) $250K/county/yr (plugging wells) Timeline: Ongoing Priority: Medium Potential Project Partners: MSU-E Groundwater Stewardship, LGOV, Health Depts. Task 5: Abandon wells properly to prevent contaminants from moving into and among
groundwater aquifers via this route. Pollutant/Environmental Stressors Reduced: Nutrients, Pathogens, Toxins
All Task 1: Continually update The Watershed Center’s interactive water quality database
(for the Grand Traverse Bay watershed) as new studies are completed each year. Estimated Cost: $7,000/yr Timeline: Ongoing Priority: High Potential Project Partners: TWC Task 2: Continue Stream Search program twice a year and expand to other areas of the
watershed (currently in Traverse City region). Estimated Cost: $15,000/year Timeline: Ongoing Priority: High
Potential Project Partners: TWC, LA, Schools Task 3: Continue annual beach E. coli monitoring program for public beaches in the
Grand Traverse Region. Estimated Cost: $40,000/year Timeline: Ongoing Priority: High
Potential Project Partners: TWC, Health Depts., LA, LGOV Task 3: Update shoreline inventory of Grand Traverse Bay every 5 years. Estimated Cost: $35,000/inventory Timeline: 10 years Priority: High
Potential Project Partners: TWC, LGOV Milestone: Conduct update by 2008
Task 4: Conduct initial inventory of near- and offshore areas along Grand Traverse Bay
by boat and reassess every 5 years. Include sediment analysis of nearshore areas. Revisit aquatic weed (macrophyte) beds previously identified in 1991 and 1998 macrophyte surveys, as well as identify newly formed weed beds.
Estimated Cost: $35,000/inventory (salary cost only) Timeline: 10 years Priority: High
Potential Project Partners: TWC Milestone: Complete inventory by 2009
191
Task 5: Annually inventory creeks (by walking/visual assessment) threatened by development to document ongoing land use and water quality changes due to increasing development in the greater Traverse City region. Creeks that should be inventoried include: Spencer Creek, Rapid River, Baker Creek, Mitchell Creek, Kid’s Creek, Acme Creek, Boardman River in Traverse City and Garfield Township.
Estimated Cost: $2,500/year Timeline: Ongoing Priority: High Potential Project Partners: TWC, LA, ERCOL Task 6: Monitor and track the changes to habitat and hydrology on area beaches due to the
newly passed Beach Grooming laws (in Summer 2003). Estimated Cost: $2,500/yr Timeline: Ongoing Priority: High
Potential Project Partners: TWC, LGOV Task 7: Annually evaluate monitoring results gathered from other groups conducting
work in the watershed and assist with efforts when needed. (Update results in TWC water quality database – See Task #1).
Estimated Cost: $2,500/yr Timeline: Ongoing Priority: High
Potential Project Partners: TWC, LA, ISEA, GTBOCI, USGS, MDEQ Task 8: Undertake further evaluation and monitoring of nutrient, bacterial and toxic
pollution sites identified in the Boardman Lake Watershed Management Plan. Estimate Cost: $20,000 Timeline: 3 years Priority: High Potential Project Partners: TWC, City of TC, Garfield Township Milestone: Complete task by 2009 Task 9: Conduct clean-up event(s) on Boardman Lake and downstream in Boardman
River to remove tires, drums, various scrap metal, wooden pallets, bricks, ceramics and other debris.
Pollutant/Environmental Stressors Reduced: Toxics Estimate Cost: $2,000/clean-up Timeline: ongoing Priority: High Potential Project Partners: TWC, City of TC, Garfield Township
192
Task 10: Document the effectiveness of BMP implementation by taking photographs,
completing site data sheets and gathering physical, chemical and/or biological site data. Work with partners to develop a standardized methodology implementation.
Estimated Cost: varies depending on project Timeline: Ongoing Priority: High
Potential Project Partners: TWC, MDEQ, CDs, CRA, LGOV, ERCOL, LA Milestone: Develop standard methodology by 2008
193
Desired Uses
Goal(s) Accomplished:
4) Recreational opportunities and quality, sustainable local economy 6) Character and aesthetic qualities
See also: Shoreline Protection and Restoration; Habitat, Fish, and Wildlife; Wetlands; Land Protection and Management; Development Task 1: The Watershed Center Grand Traverse Bay and local governments will actively
pursue higher (more stringent) nutrient standards for Grand Traverse Bay under Michigan’s Water Quality Standards.
Estimated Cost: $10,000 Timeline: 3 years Priority: High
Potential Project Partners: TWC Task 2: Continue to implement the Conservation Resource Alliance’s Wild-Link program
in the Grand Traverse Bay watershed to protect and enhance fish and wildlife habitat on private property within ecological corridors throughout the watershed.
See Habitat, Fish, and Wildlife Tasks Task 3: Extend planned recreational trail systems in watershed (includes TART and
Kalkaska County trails). Estimated Cost: $2,000,000 Timeline: 10 years Priority: Medium
Potential Project Partners: TWC, TART, Kalkaska CD Task 4: Develop additional Designated Natural Areas throughout the watershed for
recreation and education. See Land Protection and Management Tasks
194
7.4 Information and Education Strategy This Information and Education (IE) Strategy addresses the communication needs associated with implementing the Grand Traverse Bay Watershed Protection Plan. During the planning process, a variety of means were used to not only inform the public and other stakeholders regarding the planning process and outcomes, but to assess stakeholders’ knowledge of watershed issues and concerns (Appendix A). Newsletters, public meetings, presentations to clubs and civic groups, a project website and other tactics were used to keep stakeholders up-to-date with the planning process. At a series of meetings for both the public and governmental officials, a couple of simple assessment tools were used to gather input that was used in developing the plan. In addition, a phone survey was conducted regarding watershed residents’ knowledge, behaviors and attitudes about the watershed and watershed issues. A series of focus groups were conducted with participants from various market segments (industry, small business, agriculture, etc.) to assess the attitudes of the business sector regarding water quality issues, barriers to protecting water quality from a businessperson’s perspective and other relevant topics. Other research, both regional and national, was utilized to develop this plan (Biodiversity Project 2003, Dement 1995, Roper 2001, Wolf HRWC).
Local Research Findings During summer 2002 nearly 400 local residents were interviewed via phone utilizing a survey instrument developed by Northwestern Michigan College’s MTEC Research Services and Watershed Center staff. The most significant finding of the survey was the identification of a major gap in knowledge amongst watershed residents. 60% of the respondents answered “don’t know” when asked which watershed they lived in. This basic fact indicates that watershed partner organizations have a long way to go in informing and engaging the public in watershed issues.
Although many area residents routinely express concern about environmental issues, there is a lack of understanding of the key issues that face the watershed. Residents perceive that business and industry (17%) and sewage treatment plants (16%) are the main causes of water pollution to the bay. In truth, the Grand Traverse Region is dominated by non-smokestack industries and comparatively few discharge permit holders. While there have been problems in the last few years with accidental and deliberate partially treated sewage discharges in both Traverse City and the Village of Suttons Bay; and a looming problem with septic systems and wastewater treatment in the Village of Northport, the primary sources of excess nutrients in the bay are non-point sources. Additionally, when asked what they believe to be the “least cause of water pollution in the Bay, and area lakes, streams and rivers,” respondents indicated the “day to day actions of individuals” as the second least likely pollutant. These two findings would seem to indicate that the general
195
public sees sources outside their individual control to be more responsible for existing and potential water quality problems.
Other key findings relevant to the development of this plan include data regarding where respondents get their information about the environment and water quality. When this question was cross-tabulated with the respondents’ age, more detail was revealed about where specific age demographic groups obtain their information about the environment.
Age Range Preferred Source Education Level Preferred Source
18-25 Schools Graduate Degree Environmental newsletters or friends, neighbors and relatives
26-35 TV News Some post grad Environmental group newsletters, newspapers
36-55 Newspapers College degree Environmental group newsletters, newspapers
56-65 Environmental Newsletters Some college, high school or some high school Television news
66+ Newspapers Additional cross-tabulations were run to determine links between existing “environmentally-friendly” behaviors or education level and the respondents’ perceptions and level of knowledge about water quality issues. The results indicate a correlation between existing environmentally-conscious behaviors and the depth of understanding about regional water quality issues.
• Respondents indicating they do recycle materials, other than cans or bottles, were more likely to indicate they think lawn fertilizers are the main cause of water pollution. Those who do not recycle materials other than cans or bottles were more likely to indicate they think either sewage treatment plants or recreational boating are the main cause of water pollution.
• Respondents that recycle materials other than cans or bottles were also more likely to
indicate they think sewage treatment plants are the least cause of water pollution. Respondents who do not recycle think excavation and construction are the least causes of pollution.
• Respondents reporting some post-graduate study were more likely to indicate they think
sewage treatment plants are the least cause of pollution. Respondents reporting some college were more likely to indicate they think agriculture and the day to day actions of individuals were the least cause of water pollution. Respondents reporting some high
Information Source Percent Newspaper 46.6%TV News 13.7%Environmental organization newsletters
7.3%
Friends, neighbors, coworkers
5.2%
Other organizations (churches, clubs, etc)
2.6
Magazines 2.3Radio 1.6Schools 1.3
196
school were more likely than other educational groups to indicate they think recreational boating, exotic species and lawn fertilizers are the least cause of water pollution.
Other Research Findings
Recent regional and national research surveys regarding the environment confirm the basic findings of the Grand Traverse Bay surveys. A recent Roper study (Roper 2001) indicates that while there is increasing public concern about the environment, the majority of the public still does not know the leading causes of such problems as water pollution, air pollution and solid waste. This finding was also confirmed in work done by The Biodiversity Project as part of their Great Lakes Public Education Initiative. Their research involved both a public opinion poll and a survey of organizations, agencies and institutions engaged in public education efforts on Great Lakes topics. An excerpt follows:
“...organizations are making a concerted effort to provide reliable information to people who can make a difference when it comes to improving the environmental conditions in the Great Lakes Basin. However, the public opinion poll shows that, for the most part, people are just not grasping the importance of the issues facing the Great Lakes in three important ways: the seriousness of the threats, the need for urgency in taking action to address the threats, and ways that individuals can make a difference. This led us to examine the discrepancy between the level and focus of current communications and public education efforts and the gaps in public awareness. Because of this discrepancy, we concluded that the public knowledge gaps are likely to be attributed to other factors besides the content and volume of materials. Likely factors include the following three points.
o Limited use of targeting (tailoring messages and delivery strategies to specific audiences).
o Heavy reliance on printed materials and the Web – reaching already interested knowledge seekers; limited use of television and other communication tools that reach broader audiences.
o Multiple, complex, detailed information as opposed to broad, consistent unifying themes.”
The report goes on to conclude that educators need “to pay attention to a full spectrum of factors that act as barriers to the success and impact of public outreach.” Factors to be considered include:
• Targeting – Avoid the one-size-fits-all approach. • Delivery – As resources allow, use the mediums and venues that best reach the
target audience. Brochures are easy, the web is cheap, but television is the most used source of information about the environment.
• Content – Facts and figures are important to validate a point, but it is important to address the emotional connection needed to address why people should care, why the issue is relevant, effective solutions and what your audience can do about it.
• Context – Many environmental threats are viewed by the public as long term issues. Issues need to be communicated in a way that makes them more tangible. Beach closings, toxic pollution, sewage spills and water exports tend to feel more immediate than loss of habitat, land use planning and other big picture issues that citizens feel more disconnected from.
197
The study identified a list of educational needs and actions that should be incorporated consistently in educational efforts:
• Promote understanding of the system. • Make the connection to individuals. • Be local and specific. • Include a reality check on “real threats.” (For example, industrial pollution was a
hot topic ten years ago but, many organizations have shifted their education focus to other current and emerging threats, such as stormwater runoff, biodiversity, etc, but the public has not caught up with this shift.)
• Emphasis on “why is this important to you” messages. • Make the connection to policy.
Research Summary
Both local and regional research indicates that there are considerable gaps in the public’s knowledge and understanding of current environmental issues. But, this knowledge gap is tempered by keen public interest and concern for the environment. Watershed organizations need to do a better job of making issues of concern relevant to their audiences. There is a need for ongoing, consistent and coordinated education efforts targeted at specific groups, addressing specific threats.
The following IE strategy addresses some of these concerns. Both local and regional opinion research findings will be considered carefully when developing messages and delivery mechanisms for IE strategy implementation.
Goals and Objectives The goal of the IE strategy is to “Establish and promote educational programs that support effective implementation of watershed planning goals, objectives and tasks; and increase stewardship.” Fixing an erosion problem at a road stream crossing does not involve a high degree of public involvement. But, developing and carrying out a regional vision for stewardship of water resources will require the public and community leaders to become more knowledgeable about the issues and solutions, more engaged and active in implementing solutions and committed to both individual and societal behavior changes. The objectives of this plan focus on building awareness, educating target audiences, and inspiring action. Five major objectives have been identified:
• To raise community awareness and knowledge of the bay and the entire watershed, the interconnectedness of the system and the role that an individual’s day-to-day activities play in protecting the resource.
• To develop a set of consistent messages that can be used by partners in a variety of communications.
• To involve citizens, public agencies, user groups and landowners in the implementation of the watershed protection plan.
• To regularly inform stakeholders about the watershed, implementation activities and successes and opportunities to participate.
• Motivate target audiences to adopt behaviors and implement practices that result in water quality improvements.
198
Target Audiences A number of diverse regional audiences have been identified as key targets for IE strategy implementation. The targets are divided into user groups and decision-making groups. User Groups
Households – The general public throughout the watershed. Riparian Landowners – Due to their proximity to a specific waterbody, the education needs of riparian landowners are different. Agriculture Industry – Agriculture represents a significant economic segment within the Grand Traverse Bay watershed. Fruit orchards and vineyards dominate significant portions of the landscape and row crops, like potatoes and corn, are also well represented. Business and Industry – There is a fairly diverse mix of business and industry segments within the watershed, although, luckily, very little traditional “smokestack” type industry is present. Tourism, agriculture, retail and other service industries dominate the mix, with manufacturing and construction following. Tourists – Tourism is the number one industry in the Grand Traverse Region. This area is known for its scenic beauty and recreational opportunities and it is estimated that the Grand Traverse Region plays host to more than hundreds of thousands of visitors in any given year. This influx of people puts a noticeable strain on area infrastructure and often the environment. There is a growing concern that this important economic segment is possibly destroying the very reason why it exists, and that the region’s tourism “carrying capacity” may soon be reached. Steering committee members and attendees at both public and government stakeholder meetings cited the need to “educate tourists about their role in protecting our environment.” Builders/Developers/Real Estate – The Grand Traverse region is one of the fasting growing areas in Michigan in terms of population and land use. The area has enjoyed a boom in both residential and commercial development that has lasted more than a decade and shows no signs of slowing down significantly, despite the economic problems much of the nation is experiencing. Members of the development industry segment play a crucial role in this growth and providing ongoing education opportunities about their role in protecting water quality and environmental health is critical. Education – Area educators and students, primarily K-12. Partner Organizations – The Grand Traverse Bay watershed region boasts an impressive list of watershed partner groups with a broad range of expertise and important ongoing protection, restoration and education programs. Providing ongoing learning opportunities to watershed partner organizations regarding current research, BMPs, emerging issues and trends is important to keep implementation work moving forward.
199
Special Target Audiences: In addition to the above, certain user groups such as recreational boaters, other sports enthusiasts, garden clubs or smaller audience segments may be targeted for specific issues.
Local Government Decision Makers
Elected and Appointed Officials – Township, village, city, and county commissioners; planning commissions; zoning board of appeals; road commissioners; drain commissioners; etc. Governmental Staff – Planners, managers, township supervisors, zoning administrators, etc.
Message Development
General message outlines have been established for each target audience. These messages will be refined as implementation moves forward. They may also be modified or customized depending on the message vehicle. Target Audience Messages
Households
• Watershed awareness, the water cycle, key pollutant sources, how individual behaviors impact the watershed
• Water quality-friendly lawn and garden practices • Housekeeping practices and the disposal of toxic substances • Septic maintenance • Managing stormwater on your property
Riparian Landowners
• Watershed awareness, the water cycle, key pollutant sources, how individual behaviors impact the watershed
• Riparian land management including the importance of riparian buffers • Water quality-friendly lawn and garden practices • Septic system maintenance • Housekeeping practices and the disposal of toxic substances
Agriculture Industry
• The importance of establishing sound agricultural BMPs • Advantages of and opportunities for buffer and filter strips • Impacts of fertilizer/pesticide use and mitigation options • Impacts of livestock waste and mitigation options • Farmland conservation opportunities
Business and Industry
• Watershed awareness, the water cycle, key pollutant sources, how individual behaviors impact the watershed
• Proper toxic chemical use, storage and disposal • Advantages of and opportunities for innovative stormwater management • The leadership role area businesses can play in protecting the watershed
200
Target Audience Messages
Tourists
• Watershed awareness, the water cycle, key pollutant sources, how individual behaviors impact the watershed
• Help us protect the beauty that you enjoy when you are a guest • Clean boating practices • Their role in controlling the spread of aquatic invasive species
Builders, Developers, Real Estate
• Advantages of and opportunities for Low Impact Development • Identification and protection of key habitats and natural features: aquatic
buffers, woodlands, wetlands, steep slopes, etc. • Advantages of and opportunities for open space protection and financial
incentives for conservation • Impact of earthmoving activities, importance of soil erosion and sedimentation
control practices, construction BMPs • Watershed awareness, the water cycle, key pollutant sources, how individual
behaviors impact the watershed
Education
• Adoption and promotion of a state-approved watershed curriculum in K-12 schools.
• Watershed awareness, the water cycle, key pollutant sources, how individual behaviors impact the watershed
• The connection between watershed organization’s programs and school activities
• Active participation in watershed protection activities and stewardship
Partner Organizations
• Consistent communication about key watershed issues to members and residents
• Active participation in watershed activities and stewardship projects • Sharing data and developing comprehensive assessments of the health of the
watershed
Local Government Decision Makers
• Watershed awareness, the water cycle, key pollutant sources, how individual behaviors impact the watershed
• The leadership role that local governments can play in protecting the watershed • The importance of establishing sound, enforceable natural resource protection
ordinances • Economic impact and advantages of environmental protection
Communication Strategies and Tasks
A complete list of tasks by category follows this narrative; the categories are the same as those used to outline the implementation tasks in Section 7.3. Over the next year, these tasks will be further organized by target audience.
Action Plan to Implement Strategies Several priority areas for the Grand Traverse Bay watershed have been identified and the plan for rolling out the IE Strategy will correspond to these priority areas (Table 25, Figure 17). Additionally, the IE Strategy will support other implementation efforts to control nutrient loading, sedimentation, the impacts of stormwater throughout the watershed and other pollutants outlined in Section 7.3.
201
In the first year or two of implementation, considerable time and effort will be put toward introducing stakeholders to the watershed protection plan and its various findings and conclusions. Work to build awareness of basic watershed issues, pollutant sources and how individual behaviors impact the health of the watershed will also be completed. The IE Strategy tasks use a diverse set of methods and delivery mechanisms. Workshops, presentations, demonstration projects, brochures, public and media relations, web sites and other communications tools will be used for the different tasks and target audiences. Broadcast media, most importantly television, is beyond the reach of most area partner organizations – at least at a level of reach, frequency and timing that can be expected to have any impact on awareness and behavior. This is a barrier to utilizing this effective medium, but effort will be placed on building coalitions that can pool resources to address larger picture issues through broader-based, more long-term communications efforts. It is hoped that this plan may be used to stimulate more and better collaboration in the area of public education.
202
INFORMATION AND EDUCATION STRATEGY IMPLEMENTATION TASKS
GOAL 6: Promote and establish educational programs that support watershed planning
goals, objectives and tasks, and increase stewardship. Pollutants Addressed: All Categories:
1. General 2. Shoreline Protection and Restoration 3. Road Stream Crossings 4. Agriculture 5. Hydrology 6. Habitat, Fish and Wildlife 7. Stormwater 8. Wastewater
9. Human Health 10. Wetlands 11. Invasive Species 12. Land Protection and Management 13. Development 14. Zoning and Land Use 15. Groundwater 16. Monitoring
Organization Acronyms: All – Any Partner Group CDs – All Conservation Districts Chambers – Chambers of Commerce City of TC – City of Traverse City CGOV – County Governments CRA – Conservation Resource Alliance ERCOL – Elk River Chain of Lakes Steering Committee GRNA – Grass River Natural Area GTBOCI – Grand Traverse Band of Ottawa and Chippewa Indians GTRLC – Grand Traverse Regional Land
Conservancy Health Depts. – Local Health Departments ISEA – Inland Seas Education Association LA – Lake Associations LC – Leelanau Conservancy LIAA – Land Information Access Association LGOV – Local Governments Local Papers – Area Newspapers (i.e., Record Eagle,
Antrim County News) MDEQ – Michigan Department of Environmental Quality MDNR – Michigan Department of Natural Resources NMC – Northwestern Michigan College NWMCOG – Northwest Michigan Council of
Governments MLUI – Michigan Land Use Institute
MSU-E – Michigan State University Extension NRCS – USDA Natural Resources Conservation
Service RCs – Road Commissions Sea Grant – Michigan State University Sea Grant
Program OWTTF – Onsite Wastewater Treatment Task Force TCCVB – Traverse City Convention and Visitors
Bureau TOMWC – Tip of the Mitt Watershed Council TWC – The Watershed Center Grand Traverse Bay USCG – United States Coast Guard
Other Organizations:
Area Libraries Boat/Marine Retailers County Park Departments Garden Centers Home Builders Association Landscaping Companies Local Businesses Marine Patrol MSU-E Groundwater Stewardship Newcomer’s Club New Designs for Growth Neighborhood Associations Road Commissions Realtors, Board of Realtors
203
Target Audiences Include: Agriculture Builder/Developer/Realtor Business and Industry Education Households Local Governments Partner Organizations Riparian Landowners Tourists General Estimated Costs and Timeframe: For costs associated with salaries, an average watershed technician rate of $35/hour was applied. For tasks to be completed by a specialized consultant, a rate of $50/hour was used. Tasks that will be done on a yearly or site by site basis are noted as such ($X/yr or $X/site). Further details are noted where applicable. Tasks that should be completed in the short-term were given a timeframe of 3 years; long-term tasks were given a timeframe of 10 years; tasks that should be undertaken annually or continuously were given a timeframe of “ongoing.” Task Milestones: Project milestones for specific tasks in the IE Strategy were established where feasible. The milestones identify when the noted task should be completed. They are meant to guide implementation priorities and measure progress of the IE Strategy. Similar milestones were defined for the implementation tasks outlined in Section 7.4. Milestones for the IE Strategy were harder to define because many of the tasks are ongoing. Additionally, the best way to conduct outreach activities is continually evolving and depends on the audience one is trying to reach. This is why many of the IE tasks are general and only outline the audience to reach and the message to convey, but don’t include specifically how to convey that message. Key milestones for the IE Strategy include publishing the annual Freshwater Focus, conducting workshops for landowners on proper lawn care and the benefits of riparian buffers, establishing an educational program for stormwater, and providing information in the protection plan to local government officials (Table 39).
204
TABLE 39: SUMMARY OF PROJECT MILESTONES FOR IMPLEMENTATION TASKS IN THE INFORMATION AND EDUCATION STRATEGY
Task 1, Subtask B: Annual Freshwater Focus One issue/yr
Task 6: Operate Baykeeper hotline Hotline established by 2007
IE: Shoreline Protection and Restoration
Task 1, Subtask A: Provide education materials and conduct landowner workshops re lawn care, soil testing, and fertilizers
Host at least one workshop each year
Task 1, Subtask D: Promotions with landscaping and garden centers to provide relevant information
Make initial contact with businesses by 2006; promotional program in place by 2007
Task 2: Shoreline and riparian landowner workshops about riparian buffers Host at least one workshop each year
Task 3: Develop native landscaping education program Program developed and in place by 2007
Task 6: Establish or identify already existing shoreline buffers for demonstration projects and invite the public for tours; produce accompanying brochure
Produce accompanying brochure for buffer demonstration sites by 2008
IE: Road Stream Crossings
None
IE: Agriculture
Task 1: Identify existing farms with conservation practices to serve as a demonstration site; Invite the public for tours and workshops.
Establish 1-2 demonstration farms by 2010; Host annual tour for public at each farm
IE: Hydrology None IE: Habitat, Fish, and Wildlife None IE: Stormwater Task 1: Public education program regarding the
control of stormwater Public education program in place by 2007
Task 3: Storm drain stenciling One stormdrain stenciling event/yr
IE: Wastewater and Septics
None
205
TABLE 39: SUMMARY OF PROJECT MILESTONES FOR IMPLEMENTATION TASKS IN THE INFORMATION AND EDUCATION STRATEGY CONT’D
Task Milestone and Timeline IE: Human Health Issues Task 3: Print and distribute brochures regarding
beach monitoring and factors affecting public health at swimming beaches.
Brochure developed by 2006
IE: Wetlands None IE: Invasive Species None IE: Land Protection and Management None IE: Development Task 1: Educate developers and contractors on
proper stormwater and sediment management at construction sites.
One-two workshop/seminar/site tour each year
Task 3: Develop watershed information packet for realtors, developers, and other businesses to hand out to customers, new homeowners, and others on activities the can do to improve/protect water quality on their property.
Information packet developed and ready for distribution by 2007
IE: Zoning and Land Use
Task 1: Provide key public officials with summary version of GT Bay Watershed Protection Plan and basic recommendations
Plan summary provided by 2006
Task 2: Educate and inform local planning and zoning officials regarding up-to-date information on planning, zoning, and design innovations relating to the protection of water quality.
Host one-two educational workshops for local officials each year (in addition to face-to-face meetings and phone calls)
IE: Groundwater
None
IE: Monitoring
Task 1: Expand marketing and promotion efforts for Stream Search program
Expand Stream Search program into Leelanau County by 2007
Task 4: Develop public attitude survey (as well as follow up surveys) to determine and monitor the public’s awareness regarding watershed and water quality issues.
Develop and conduct first public attitude survey by 2008
206
Information and Education Strategy: General
Task 1: Regularly inform the public about activities, study findings, successful example
projects, and opportunities for contribution in the Grand Traverse Bay watershed. Subtask A: Publish quarterly newsletter.
Estimated Cost: $3,500 each Timeline: Ongoing Priority: High Potential Project Partners: TWC
Target Audience: General Milestone: Publish 3-4 newsletters/yr
Subtask B: Publish annual Freshwater Focus (State of the Watershed) tabloid
summarizing the overall condition of the region’s water resources and highlighting current research, implementation accomplish-ments, monitoring programs and other topics relevant to the water quality of the bay.
Subtask C: Provide watershed information and news to the local and regional media on a regular basis in the form of press releases, PSAs, feature stories, story ideas, editorials, etc.
Estimated Cost: $25,000/year Timeline: Ongoing Priority: High Potential Project Partners: All
Target Audience: General
Subtask E: Develop TV and radio ads, public service announcements, print ads, etc., focusing on relevant water quality issues and basic watershed messages.
Estimated Cost: $25,000 development/$100,000-200,000 per year in media placement costs
Timeline: 3 years Priority: High Potential Project Partners: TWC, TOMWC, GTCD, CRA, ISEA
Target Audience: General
207
Task 2: Maintain and promote a comprehensive website containing information about the watershed along with activities, events, ways to get involved, plan documents, links to relevant organizations and resources, etc.
Estimated Cost: $7,500/year Timeline: Ongoing Priority: High
Potential Project Partners: TWC, LIAA Target Audience: All
Task 3: Host periodic, regional “Water Summit” for regional stakeholders to address priority issues impacting water quality, review implementation efforts and accomplishments, share resources, etc.
Task 6: Operate 1-800-BAYKEEPER hotline to provide concerned citizens with a means to report known or suspected environmental regulation violations, seek help or guidance, get questions answered, etc.
Estimated Cost: $2,500/year Timeline: 3 years Priority: High
Potential Project Partners: TWC, Local Businesses (for sponsors) Target Audience: General Milestone: Hotline established by 2007
208
Task 7: Develop comprehensive set of watershed maps and make available to landowners,
local governments and others. Estimated Cost: $5,000 Timeline: 3 years Priority: Medium
Potential Project Partners: TWC, LIAA, LGOV Target Audience: Local Governments, General Public, Partner Organizations
Task 8: Create a set of resources such as publications, maps, and other references re
watershed issues to be housed at area libraries for public use. Examples include Clean Water Act references, watershed plans, maps, land use planning and land protection information, limnology, relevant periodicals, research, government reports, etc.
Estimated Cost: $7,500 first year, $1,000 year after Timeline: 3 years Priority: Medium
Potential Project Partners: TWC, Area Libraries Target Audience: General
Task 9: Create small displays that would include a watershed brochure and a
suggestion/concern box that could be placed in high tourist traffic areas. Estimated Cost: $2,500 Timeline: 3 years Priority: Medium Potential Project Partners: TWC, TCCVB, Chambers Target Audience: Tourists, Households Task 10: Provide training to local citizens regarding environmental advocacy and the Clean
Water Act. Estimated Cost: $7,500 Timeline: 3 years Priority: Medium
Task 11: Publish watershed or region-wide “Environmental Resource Directory” on a
regular basis including mix of resources lists, simple tips, and advertising to support. (TWC/Record Eagle)
Pollutant/Environmental Stressors Reduced: Toxics Estimated Cost: $10,000 Timeline: 3 years Priority: Medium
Potential Project Partners: TWC, Local Papers, MSU-E Target Audience: General
209
Task 12: In partnership with area tourism industry reactivate hotel program encouraging guests to re-use towels and sheets to conserve water resources using brochures, tent cards, etc,
Estimated Cost: $10,000 first year, $5,000 annually Timeline: 3 years Priority: Medium
Task 14: Develop a watershed-wide speaker’s bureau as a resource for civic clubs and organizations, workshops, conferences, etc.
Estimated Cost: $2,500 Timeline: 10 years Priority: Low
Potential Project Partners: TWC Target Audience: General
Task 15: Develop educational 10-12 minute video about priority watershed issues for use
in presentations. Estimated Cost: $15,000 Timeline: 3 years Priority: Low Potential Project Partners: TWC Target Audience: All
210
Information and Education Strategy: Shoreline Protection and Restoration
Task 1: Educate the public about environment-friendly lawn care, maintenance, and the
application and use of fertilizers and pesticides. Subtask A: Provide education materials (brochures, door hangers, pamphlets,
etc.) and conduct landowner workshops regarding 1) the need for soil testing prior to fertilizer application, 2) the proper use of residential and commercial fertilizers with respect to the application amount, timing, frequency, location, method, and phosphorus content, and 3) the appropriate use of pesticides, etc.
Estimated Cost: $25,000/year Timeline: 3 years Priority: High Potential Project Partners: TWC, CDs, TOMWC, MSU-E, ERCOL, LA, GRNA
Target Audience: Household, Riparians Milestone: Host at least one workshop each year
Subtask B: Increase public knowledge of the consequences of improper disposal of lawn and garden chemicals through news articles, workshops, and other media sources.
Estimated Cost: $10,000 Timeline: 3 years Priority: High Potential Project Partners: TWC, CDs, TOMWC, MSU-E, ERCOL, LA, GRNA
Target Audience: Households, Riparians
Subtask C: Provide information to the public regarding environment-friendly lawn care contractors, where to buy low-phosphorous fertilizers, alternatives pest management practices and products, etc.
Estimated Cost: $10,000 Timeline: 3 years Priority: Medium Potential Project Partners: TWC, CDs, TOMWC, MSU-E, ERCOL, LA, GRNA
Target Audience: Households, Riparians
211
Subtask D: Develop promotions with landscaping and garden centers to provide educational brochures and workshops regarding native planting, “green landscaping,” etc.
Estimated Cost: $10,000 Timeline: 3 years Priority: Medium
Target Audience: Households, Riparians Milestone: Make initial contact with businesses by
2006; promotional program in place by 2007
Subtask E. Develop a certification or recognition program for “earth-friendly” landscapers and related businesses.
Estimated Cost: $10,000 Timeline: 3 years Priority: Medium Potential Project Partners: TWC, CDs, TOMWC, MSU-E, ERCOL, LA Target Audience: Households, Riparians Task 2: Conduct shoreline and riparian landowner workshops to stress the benefits and
importance of riparian buffers to protect water quality. Estimated Cost: $10,000 Timeline: 3 years Priority: High
Target Audience: Riparians Milestone: Host at least one landowner workshop each year
Task 3: Develop native landscaping education program including workshops,
demonstrations, and brochures. Estimated Cost: $50,000 Timeline: 3 years Priority: High Potential Project Partners: TWC, CDs, TOMWC, MSU-E, ERCOL, LA Landscaping Companies, GRNA Target Audience: Households, Riparians Milestone: Program developed and in place by 2007
212
Task 4: Initiate education efforts in Boardman Lake watershed that promote the essential link between land use and water quality protection and improvement. This includes promoting the retention or establishment of shoreline vegetative buffers, the minimizing of vegetation removal and mowing to the water’s edge, and discouraging the dumping of grass clippings and other yard/solid wastes into the water.
Pollutant/Environmental Stressors Reduced: Changes to Hydrology, Loss of Habitat, Nutrients, Thermal Pollution, Toxics, Sediment, Pathogens
Estimate Cost: $15,000 Timeline: 3 years Priority: High Potential Project Partners: TWC, LGOV
Task 5: Produce or distribute existing riparian and/or shoreline landowners’ guidebooks. Estimated Cost: $10,000 Timeline: 3 years Priority: Medium
Task 6: Establish or identify already existing shoreline buffers for demonstration projects
and invite the public for tours; produce accompanying brochure. Related Task: See Section 7.3 – Shoreline Protection and Restoration Task 4 Estimated Cost: $10,000 Timeline: 3 years Priority: Medium Potential Project Partners: TWC, CDs, TOMWC, MSU-E, LA, GRNA Target Audience: Riparians Milestone: Produce accompanying brochure for buffer demonstration
sites by 2008
Task 7: Develop comprehensive composting education program including workshops and demonstrations. Estimated Cost: $25,000
Timeline: 3 years Priority: Medium Potential Project Partners: TWC, CDs, TOMWC, MSU-E, GTBOCI, LA, GRNA Target Audience: Households, Riparians
213
Task 8: Educate boaters and marina operators regarding environmentally-friendly boating and fueling practices including: avoiding illegal sewage and graywater discharges, fuel spills, engine maintenance, etc.
Estimated Cost: $25,000 Timeline: 3 years Priority: High
Target Audience: Recreational Boaters, Marinas (special target audience) Task 9: Develop a realtor and developer educational program aimed at providing new
homeowners with information regarding water quality and watershed issues at the point-of-sale.
Estimated Cost: $10,000 Timeline: 3 years Priority: Medium
Potential Project Partners: TWC, TOMWC, Board of Realtors, ERCOL, LA Target Audience: Builder/Developer/Realtor, Households
214
Information and Education Strategy: Road Stream Crossings
Task 1: Host workshops for County Road and Drain Commissions to provide education
regarding possible BMPs to establish at road crossings to reduce the harmful effects of sedimentation and stormwater runoff.
Estimated Cost: $5,000 Timeline: 10 years Priority: Medium
tour for public at each farm Task 2: Educate farmers using manure about proper manure management for their fields.
Stress the use of 1) properly designed, constructed, and sited (including consideration of the proximity to surface waters) manure storage facilities, 2) properly maintained and operated manure storage facilities to prevent leaks, overflows, and the need for untimely emptying, and 3) applying manure to properly designated fields at appropriate times
Estimated Cost: $15,000 Timeline: 10 years Priority: High
Information and Education Strategy: Habitat, Fish, and Wildlife
Task 1: Provide education to the general public on the importance of maintaining diverse
wildlife habitats and developing wildlife corridors on their property. Estimated Cost: $25,000 Timeline: 3 years Priority: High
Potential Project Partners: CRA, CDs, NRCS, GRNA, ERCOL, LA Target Audience: Households, Agriculture, Local Government
Task 2: Educate the public regarding CRA’s Wild-Link program through 1) conducting
tours to existing lands enrolled in Wild-Link program and 2) mailed packets of information to potential landowners.
Estimated Cost: $10,000 Timeline: 3 years Priority: High
Potential Project Partners: CRA, CDs Target Audience: Households, Agriculture, Local Government
Task 3: Educate public officials through workshops, demonstration tours, and information
packets regarding the impacts of increased land fragmentation on wildlife habitat and corridors.
Estimated Cost: $10,000 Timeline: 3 years Priority: High
Potential Project Partners: CRA, CDs, NRCS, GRNA, ERCOL, LA Target Audience: Local Government
218
Information and Education Strategy: Stormwater
Task 1: Develop comprehensive public education program regarding the control of
stormwater including the following components: door hangtags, utility bill inserts, workshops, brochures, newspaper articles, PSAs, radio and TV advertisement campaigns, radio talk shows, and print advertising.
Estimated Cost: $100,000/year Timeline: Ongoing Priority: High
Potential Project Partners: TWC, TOMWC, CDs, LGOV, GRNA, ERCOL, LA Target Audience: Households, Riparians Milestone: Public education program in place by 2007
Task 2: Provide general stormwater education for local units of government that stresses the benefits of 1) managing the amount of impervious surfaces in the watershed, 2) reducing the filling and development of wetlands, which provide temporary holding of stormwater, and 3) implementing stormwater BMPs and low-impact design practices to minimize stormwater flows. Examples of BMPs and low-impact design practices include:
• Infiltration Practices: Infiltration Trench or Basin, Porous Pavement • Retention and Detention Ponds • Other Low Impact Design Elements: Rain/Roof Gardens, Native Plantings, Riparian
Buffers (From the Center for Watershed Protection’s Approaches to Stormwater Treatment and
Stormwater Practice and Design CDs, Watershed Leadership Kit Volumes 4 and 5.) Estimated Cost: $25,000 Timeline: 3 years Priority: High
Potential Project Partners: TWC, MDEQ, TOMWC, NWMCOG, GRNA, ERCOL, LA
Target Audience: Local Governments Task 3: Implement an annual watershed-wide storm drain stenciling event involving
municipalities, neighborhood associations, and other volunteer groups. Estimated Cost: $3,500/year Timeline: 3 years Priority: High
Potential Project Partners: TWC, LGOV, Neighborhood Associations, GRNA, ERCOL, LA
Target Audience: Households, Riparians Milestone: One stormdrain stenciling event/yr
219
Task 4: Partner with neighborhood associations to host presentations and workshops on
controlling stormwater on their properties, etc. Estimated Cost: $5,000 Timeline: 10 years Priority: Medium Potential Project Partners: TWC, Neighborhood Associations, GRNA, ERCOL,
LA Target Audiences: Households, Riparians
220
Information and Education Strategy: Wastewater
Task 1: Develop comprehensive public education program regarding septic systems
including: • Using proper septic system design for the site conditions and considering the
proximity to bodies of water when siting them, • Properly maintain existing septic systems, and • Providing education regarding the development of alternative onsite
wastewater treatment systems. The following components will be used: door hangtags, utility bill inserts, workshops, brochures, newspaper articles, PSAs, radio and TV advertisement campaigns, radio talk shows, and print advertising.
Estimated Cost: $75,000/year Timeline: 3 years Priority: High
Potential Project Partners: TWC, TOMWC, Health Depts., OWTTF, GRNA, ERCOL, LA
Target Audience: Households, Riparians
221
Information and Education Strategy: Human Health
Task 1: Implement a ‘Do Not Feed the Waterfowl or Seagulls’ campaign in watershed
including PSAs, signage, articles, brochures, etc. Estimated Cost: $100,000 Timeline: 10 years Priority: High
Task 5: Provide education regarding health risks to individuals and communities from improper disposal of hazardous wastes. Provide information regarding proper disposal of household hazardous waste and pharmaceuticals. Provide information on alternative products and methods and promote participation in household hazardous waste collection events.
Estimated Cost: $25,000 Timeline: 3 years Priority: High
Potential Project Partners: GTBOCI, TWC, Health Depts., ERCOL, LA, GRNA, CDs, LGOV, County Resource Recovery Departments
Target Audience: Households, Riparians Task 6: Encourage and promote the proper disposal of used electronic devices; provide
information regarding disposal options and promote periodic drop off events. Estimated Cost: $5,000 Timeline: Ongoing Priority: High
Target Audience: Households, Riparians, Business and Industry
223
Information and Education Strategy: Wetlands
Task 1: Educate local governments, developers, contractors, and others through
workshops and presentations, press releases, brochures, etc, regarding the ecological consequences of developing unregulated wetland areas, especially in headwater/recharge areas and along the Grand Traverse Bay shoreline.
Estimated Cost: $10,000 Timeline: 3 years Priority: High
Potential Project Partners: TWC, TOMWC, GRNA, ERCOL, LA Target Audience: Local Governments, Builder/Developer/Realtor
Task 2: Educate the public and public officials regarding the benefits of wetlands through
workshops, demonstrative site tours, newspaper articles, PSAs, radio and TV advertisement campaigns, radio talk shows, print advertising, etc.
Estimated Cost: $100,000 Timeline: 3 years Priority: High
Potential Project Partners: TWC, TOMWC, GRNA, ERCOL, LA Target Audience: Households, Riparians, Local Governments,
Builder/Developer/Realtor Task 3: Educate and communicate to Great Lakes shoreline owners the current beach
maintenance regulations, the value and proper care of emergent coastal wetlands, and the benefit of keeping these wetlands in a natural state. Disseminate existing brochures, mail letters, host ‘town meetings’, etc.
Estimated Cost: $10,000 Timeline: 3 years Priority: High
Task 4: Host a series of workshops and seminars throughout the watershed to educate
public officials regarding appropriate and successful methods for restoring wetlands.
Estimated Cost: $10,000 Timeline: 3 years Priority: Medium
Potential Project Partners: TWC, TOMWC Target Audience: Local Governments
224
Information and Education Strategy: Invasive Species
Task 1: Educate local residents and visitors regarding the negative impacts of and
appropriate control and eradication measures for both aquatic and terrestrial invasive species (including Eurasian water milfoil, purple loosestrife, zebra mussels, etc).
Estimated Cost: $25,000 Timeline: 3 years Priority: High
Target Audience: Households, Riparians Task 4: Create and distribute a resource list for native plant species. See related tasks under Shoreline Protection and Restoration category. Estimated Cost: $5,000 Timeline: 3 years Priority: Medium
Information and Education Strategy: Land Protection and Management
Task 1: Provide landowner education regarding voluntary conservation easements and
other available land protection measures utilizing direct mail, publications, etc. Schedule bus tours of areas already in conservation easements to provide examples of successful efforts.
Estimated Cost: $50,000 Timeline: 10 years Priority: High
Task 2: Develop a public awareness program to inform the public of ecologically sound
riparian and coastal wetland land management practices. See related tasks under Shoreline Protection and Restoration category. Estimated Cost: $50,000 Timeline: 3 years Priority: High
Task 1: Host workshops, seminars, and site tours to educate developers and contractors on
proper stormwater and sediment management at construction sites. Estimated Cost: $10,000 Timeline: 3 years Priority: High
Potential Project Partners: TWC, ERCOL, LA, Home Builders Association, Realtors
Target Audience: Builder/Developer/Realtor Milestone: One-two workshop/seminar/site tour each year
Task 2: Compile information packet and host workshops, luncheons, or small seminars for
area realtors providing them with basic information regarding environmental laws (wetlands, beach maintenance, onsite wastewater treatment, etc.) that might impact new homeowners.
Estimated Cost: $10,000 Timeline: 3 years Priority: High
Target Audience: Households, Riparians, Builder/Developer/Realtor Milestone: Information packet developed and ready for distribution
by 2007 Task 4: Encourage design, construction and maintenance of new and existing
development in the watershed that utilizes Best Management Practices to protect water quality.
Estimated Cost: $10,000 Timeline: 3 years Priority: High
Potential Project Partners: TWC, ERCOL, LA, Home Builders Association, TOMWC, New Designs for Growth
Target Audience: Builder/Developer/Realtor, Local Government
227
Information and Education Strategy: Zoning and Land Use
Task 1: Provide key elected/appointed public officials (planning commissioners, etc.) with
summary version of Grand Traverse Bay Watershed Protection Plan and basic recommendations relevant to local units of government.
Estimated Cost: $2,500 Timeline: 3 years Priority: High
Potential Project Partners: TWC, LA, GRNA Target Audience: Local Governments Milestone: Plan summary provided by 2006
Task 2: Educate and inform local planning and zoning officials regarding up-to-date
information on planning, zoning, and design innovations relating to the protection of water quality. Utilize MDEQ book titled “Filling the Gaps: Environmental Protection Options for Local Governments”.
Estimated Cost: $10,000 Timeline: 3 years Priority: High
Potential Project Partners: TWC, LGOV, NWMCOG, GRNA, LA Target Audience: Local Governments Milestone: Host one-two educational workshops for local officials
each year (in addition to face-to-face meetings and phone calls)
Task 3: Develop an information packet for Zoning Boards of Appeals and Planning
Commissions to assist them in developing reasonable conditions to place on requests for variances (i.e., installing or providing riparian buffers and/or other BMPs on site).
Estimated Cost: $10,000 initial year; $2,500/yr after packet is completed Timeline: 3 years Priority: High Potential Project Partners: TWC, LGOV, NWMCOG, GRNA, LA
Target Audience: Local Government
Task 5: Facilitate meetings between townships regarding the sharing of model ordinances that protect water quality and natural resources.
Estimated Cost: $5,000 Timeline: 3 years Priority: High Potential Project Partners: TWC, TOMWC, LGOV, NWMCOG, LA
Target Audience: Local government
228
Information and Education Strategy: Groundwater
Task 1: Educate local governments, developers, contractors, and others regarding
headwater and groundwater recharge areas (how they work, soils, vegetation, etc.) and why it is important to protect them and avoid overdeveloping them.
Estimated Cost: $25,000 Timeline: 3 years Priority: High
Potential Project Partners: TWC, MSU-E Groundwater Stewardship, CDs, ERCOL, LA
Target Audience: Local Government, Builder/Developer/Realtor
229
Information and Education Strategy: Monitoring
Task 1: Expand marketing and promotion efforts for TWC’s Stream Search program
utilizing public relations, giveaways for participants, sponsorships, etc. Estimated Cost: $10,000 Timeline: 3 years Priority: High
Potential Project Partners: TWC Target Audience: General
Milestone: Expand Stream Search program into Leelanau County by 2007
Task 2: Provide ongoing information to stakeholders regarding research and monitoring
efforts conducted by the TWC and various partner organizations in the watershed and what it means to various target audiences (through documents such as the annual Freshwater Focus newspaper insert, TWC website, press releases, etc).
Estimated Cost: $5,000 Timeline: 3 years Priority: High
Target Audience: All Task 3: Enter results of WQ testing into TWC’s online, interactive water quality database. Estimated Cost: $5,000/year Timeline: ongoing Priority: High
Potential Project Partners: TWC Target Audience: All
Task 4: Develop public attitude survey (as well as follow up surveys) to determine and
monitor the public’s awareness regarding watershed and water quality issues. Estimated Cost: $15,000/survey Timeline: ongoing Priority: High
Potential Project Partners: TWC Target Audience: All Milestone: Develop and conduct first public attitude survey by 2008
230
Task 5: Maintain a list of ongoing and completed environmental projects in the watershed, along with their accomplishments and what organizations are working on them.
Estimated Cost: $500/yr Timeline: ongoing Priority: High
7.5 Evaluation Procedures An evaluation strategy will be utilized to measure progress during the Grand Traverse Bay Watershed Protection Plan’s implementation phase and to determine whether or not water quality is improving. The timeline for the evaluation is approximately every 5 years, with ongoing evaluation efforts completed as necessary. The first aspect of the evaluation strategy measures how well we are doing at actually implementing the watershed protection plan and assesses if project milestones are being met. The second aspect is to evaluate how well we are doing at improving water quality in the watershed. The following sections address each of these issues. Evaluation Strategy for Plan Implementation This aspect of the evaluation strategy was developed to measure progress during the implementation phase of the watershed protection plan and to provide feedback during implementation. The evaluation will be ongoing and will be conducted through the existing Steering Committee. The Steering Committee will meet once a year to assess progress on plan implementation and to learn and share information about existing projects throughout the watershed. In addition, plan tasks, priorities, and milestones will be assessed every 5 years to ensure that the plan remains current and relevant to the region and that implementation is proceeding as scheduled and is moving in the right direction. The evaluation will be conducted by analyzing the existing watershed management plan goals and objectives, as well as the implementation tasks and ‘milestones’ in Sections 7.3 and 7.4 to determine progress. Key milestones include completing streambank erosion restoration projects, repairing road stream crossings, developing stormwater management plans and starting stormwater remediation efforts in urban areas, and updating zoning ordinances. The proposed timeline for each task (i.e. 3 years, 10 years, ongoing) will also be reviewed to determine if it is on schedule. Other anecdotal evidence (not attached to specific plan milestones) also will be noted that indicates the protection plan is being successfully implemented, such as an increase in the amount of updated or new zoning ordinances that deal with water quality and natural resource protections in watershed townships and municipalities. Additionally, a number of other evaluation tasks will be completed due to the variety of tasks involved in the watershed plan. They will include but are not limited to the following:
• Document the effectiveness of BMP implementation by taking photographs, completing site data sheets and gathering physical, chemical and/or biological site data. Work with partners to develop a standardized methodology implementation (see Monitoring in Section 7.3).
• Utilize focus groups to evaluate specific projects throughout plan implementation as needed.
• Conduct targeted surveys of project partners by direct mail, phone or by website to assist in information gathering.
• Maintain a current list of future target projects, the status of ongoing projects, and completed projects, along with their accomplishments. Keep track of the number of grants received and the dollars committed in the watershed region to implement aspects of the plan.
232
The purpose of the evaluation strategy is to provide a mechanism to the Steering Committee to learn track how well the plan is being implemented and what can be done to improve the implementation process. Additional development of the strategy will occur as the implementation phase unwinds. Measuring and Evaluating Social Milestones Section 7.4 outlines an Information and Education Strategy that addresses the communication needs associated with implementing the Protection Plan. The strategy is important because developing and carrying out a regional vision for stewardship of the region’s water resources will require the public and community leaders to become more knowledgeable about the issues and solutions, more engaged and active in implementing solutions and committed to both individual and societal behavior changes. Residents, local officials, homeowners, and the like must be educated and motivated to adopt behaviors and implement practices that result in water quality improvements. In this respect, it is important to measure and keep track of the social impacts of the Grand Traverse Bay Protection Plan. Project managers must find out what types of outreach are working in their communities and what types aren’t, along with how people’s attitudes and behaviors are impacted. Just how much is social behavior changing because of the plan implementation? To answer this question, social impacts must be included when evaluating the progress of plan implementation. Key social evaluation techniques that will be used to assess the implementation of the IE Strategy, as well as other watershed BMPs, include:
• Continued cooperation between area organizations submitting proposals to implement aspects of protection plan
• Social surveys (and follow up surveys) for homeowners, local officials, students, farmers, etc. to determine watershed and water quality awareness
• Determining any increases in ‘watershed friendly’ design and construction (anecdotal evidence will be used)
• Increased awareness (from both the general public and local government officials) regarding the necessity of stormwater improvement
• Increase in the number of communities implementing stormwater ordinances • Continued requests to do Freshwater Focus (increases in positive feedback after printing) • Incorporating feedback forms into educational and public events and posting them on The
Watershed Center website www.gtbay.org. • Determine number of environmental efforts/projects in the watershed and how many
organizations are currently working to protect water quality in the area. Maintain a list of ongoing projects and completed projects, along with their accomplishments. (This task is also found in next section relating to evaluating the water quality improvements.)
In a social survey conducted in summer 2002, the most significant finding was the identification of a major gap in knowledge amongst watershed residents in that 60% of the respondents answered “don’t know” when asked which watershed they lived in. This basic fact indicates that watershed partner organizations have a long way to go in informing and engaging the public in watershed issues. A major social milestone to achieve by 2010 is to increase awareness of Grand
Traverse Bay watershed residents knowing which watershed they live in from 40% up to 75%. (We feel this is a realistic goal, considering the average American moves once every 5 years; so in any given year approximately 20% of the residents are new to the area.)
Evaluation Strategy for Determining Water Quality Improvement The EPA dictates that watershed management plans must outline a set of criteria to determine whether proposed load reductions in the watershed are being achieved over time and that substantial progress is being made towards attaining water quality standards. In the case of the Grand Traverse Bay watershed, overall water quality is good (Section 3.11) with some pollutant threats; therefore no specific watershed goals were made regarding load reductions. Instead, the project Steering Committee made a broad goal to maintain current levels of phosphorus and nitrogen in Grand Traverse Bay (Chapter 6: Goal #2, Objective #2). However, since the Grand Traverse Bay watershed is threatened and has problem areas, it is stressed that improvements must be made now in order to maintain the current water quality and protect it into the future. Most watershed goals outlined in Chapter 6 seek to maintain or improve the current state of water quality and habitat, as well as increase awareness of this valuable resource. In addition to conducting an evaluation every 5 years regarding protection plan implementation, the Steering Committee will evaluate whether or not water quality in Grand Traverse Bay and its watershed is declining, improving, or staying the same. Criteria or milestones to be used to evaluate changes in water quality will include:
• No statistically significant increases in bay-wide averages of Phosphorus or Nitrogen concentrations in Grand Traverse Bay.
• Monitoring results that indicate no harmful changes to water quality or biological indicators measured throughout the watershed.
• Documented decrease (or no statistically significant change) in the areal extent or number of macrophyte weed beds in Grand Traverse Bay. (See Monitoring Task #4 in Section 7.3)
• No E.Coli levels exceeding Michigan and USEPA water quality standards for both single day measurement (>300 E. coli per 100mL of water) and 30-day geometric mean measurement (> 130 E. coli per 100mL of water in 5 samples over 30 days). (See Monitoring Task #3 in Section 7.3)
• Stream macroinvertebrates surveys throughout the watershed indicating excellent water quality. (See Monitoring Task #2 and #7 in Section 7.3)
• Determine number of environmental efforts/projects in the watershed and how many organizations are currently working to protect water quality in the area. Maintain a list of ongoing projects and completed projects, along with their accomplishments. (This task is also found in previous section relating to evaluating the plan implementation.)
234
CHAPTER 8 FUTURE EFFORTS 8.1 What Comes Next? The Watershed Center and other project partners will continue to build partnerships with various groups throughout the watershed for future projects involving the implementation of recommendations made in this protection plan. Funding sources for these projects will be pursued aggressively over the next 1– 5 years. Government, foundation, and corporate grants will be researched as possible funding sources. Additionally, potential new mechanisms for funding by local communities will be investigated. It is expected that the implementation phase will last more than 10 years, with some efforts expected to be conducted on a yearly basis indefinitely. Grant funds and other financial sources will be used to implement tasks outlined in Chapter 7, including the continuation of water quality assessment and monitoring, installation and adoption of various Best Management Practices (Section 7.3), and educational tasks outlined in the IE Strategy (Section 7.4). The Grand Traverse Bay Watershed Project Steering Committee should continue to meet yearly during the implementation period. As stated in Chapter 7, the project Steering Committee looked at the major sources of pollution in the watershed and decided that focusing on reducing and/or eliminating pollution stemming from stormwater runoff, streambank erosion, road stream crossings, fertilizer use, lack of riparian buffers, and the reduction of wetlands will address the bulk of pollution entering the Grand Traverse Bay and its surrounding watershed. Priority should be given to implementation tasks (both BMPs and educational initiatives) that work to reduce the effects from these sources. Priority tasks that should be conducted over the next 1 – 3 years are as follows, with the most important tasks listed first:
• Begin initial outreach and education efforts outlined in the IE strategy • Establish stormwater BMPs and ordinances beginning in urban and urbanizing areas • Stormdrain mapping in urban and urbanizing areas without existing maps • Streambank and shoreline erosion stabilization projects • Establish riparian buffers in priority areas • Assist with developing or revising Master Plans and Zoning Ordinances to include more
water quality protection • Road crossing improvements using BMPs • Wetland assessment, restoration, and protection • Initiatives to preserve open space and wildlife corridors • Continue monitoring programs • Develop Conservation Plans for farms.
Environmental awareness, education, and action from the public will grow as the IE Strategy is implemented and resident awareness of the watershed is increased. Implementing the IE Strategy is perhaps the most critical and important long-term task to accomplish. The strategy is designed to be used by a wide variety of organizations, not just by The Watershed Center.
235
Initial IE efforts began during the development of the original protection plan (2001-2003) and have continued throughout the development of the revised protection plan (2003-2005). During these initial efforts, considerable time and effort was put toward introducing stakeholders to the watershed protection plan and its various findings and conclusions, as well as providing general information about the Grand Traverse Bay watershed. During the implementation phase of the IE Strategy, the critical first steps to take will be to build awareness of basic watershed issues and sources of pollution, as well as how individual behaviors may impact the health of the watershed. It will also be necessary to continue to introduce stakeholders to results and information provided in the revised protection plan and show them how they can use the plan to protect water quality in the region.
236
Inland Seas Education Association’s Schooner Inland Seas
8.2 Current Work and Projects There is a lot of work going on throughout the Grand Traverse Bay watershed and the current list of projects is constantly changing as various projects finish and new ones are added each year. As of 2005, The Watershed Center Grand Traverse Bay and its partners have recently completed a number of projects including: a local E.Coli monitoring project; completion of an interactive water quality database (www.gtbay.org/wqquery.asp); installation of educational watershed signs; and a streambank stabilization project. Currently TWC and its partners (i.e. local Conservation Districts, the City of Traverse City, Three Lakes Association, and others) are working on three monitoring projects and six projects to implement BMPs in priority areas including streambank stabilizations, road stream crossing improvements, riparian buffers installation, and stormwater improvements. There are a number of other area organizations that have both current and ongoing programs in the Grand Traverse Bay watershed that deal with water quality and natural resources. The Conservation Resource Alliance’s Wild-Link program works to establish wildlife corridors to preserve the rural character of northwestern Michigan for outdoor recreation, hunting and wildlife watching in natural surroundings. The Inland Seas Education Association (ISEA), located on the shores of West Grand Traverse Bay, educates both students and adults on Great Lakes issues and provides first-hand training and experience in the Great Lakes ecosystem. They provide a unique experience by conducting educational sessions on Grand Traverse Bay aboard tall sailing ships. To date, more than 66,000 students have participated in ISEA's shipboard programs. Additionally, area Conservation Districts (Grand Traverse, Kalkaska, and Antrim) have ongoing projects to improve road stream crossings and stabilize eroding streambanks. Most of these Conservation Districts also work with local residents regarding other natural resource issues as well. TWC’s annual Freshwater Focus publication provides a summary of these and other ongoing projects throughout the Grand Traverse Bay watershed. This publication is printed each fall as an insert in the Traverse City Record Eagle newspaper; extra copies are available at the TWC office. Additionally, the TWC website has information about their current and past projects as well as links to websites of other area organizations.
CHAPTER 9 CONCLUSIONS The Grand Traverse Bay Watershed Protection Plan was developed to help guide efforts to protect water quality of area lakes, streams, and Grand Traverse Bay. The two-year planning phase (December 2001-2003) allowed some of the key decision-makers, organizations, agencies, and the public to learn about the watershed in which they live. The plan was revised and updated in 2005 to include additional information on pollutant sources and concentrations, load reduction estimates of various BMPs, measurable milestones to guide implementation progress, and a set of criteria to evaluate the effectiveness of implementation efforts. The recommendations outlined in Chapter 7 of the Grand Traverse Bay Watershed Protection Plan will provide guidelines to all types of organizations for taking action during the implementation phase of the project and will be a useful tool in addressing current and future water quality threats to the watershed. The five threatened designated uses identified in this protection plan are the cold water fishery, other indigenous aquatic life, total body contact, navigation, and public water supply at point of intake (Table 17). Excessive nutrient loading and sedimentation are two of the known pollutants that are threatening these designated uses in the Grand Traverse Bay watershed. Other issues that threaten these designated uses include loss of habitat, changes to hydrologic flow, invasive species, toxic substances, pathogens, and thermal pollution. All of these factors degrade water quality, destroy aquatic habitat, and reduce the number and diversity of aquatic organisms. A list of watershed pollutants was developed in a Comprehensive Watershed Management Table (Table 20 and 21) to identify water quality problems and provide guidance for future implementation projects to protect the quality of the watershed. The Grand Traverse Bay Watershed Protection Plan is meant to assist decision-makers, landowners, residents, and others in the watershed in making sound decisions to help improve and protect water quality in their area. Chapter 7 lists recommendations (structural, managerial, and educational) on how to reduce the negative impact that pollutants and environmental stressors have on the threatened designated uses in the Grand Traverse Bay watershed. Priority areas in the watershed were delineated to identify specific areas in the watershed that are most sensitive to environmental impacts and have the greatest likelihood to affect water quality and aquatic habitat. It is in these areas that the bulk of implementation efforts should be focused. Additionally, by focusing on reducing and/or eliminating pollution stemming from stormwater runoff, streambank erosion, road stream crossings, fertilizer use, lack of riparian buffers, and the reduction of wetlands, the bulk of pollution entering the Grand Traverse Bay and its surrounding
238
watershed will be addressed. Priority should also be given to implementation tasks (both BMPs and educational initiatives) that work to reduce the effects from these sources. The Grand Traverse Bay Watershed Information and Education Strategy highlights the actions needed to successfully maintain and improve watershed education, awareness, and stewardship for the Grand Traverse Bay watershed. It lays the foundation for the collaborative development of natural resource programs and educational activities for target audiences, community members, and residents. Future efforts for the Grand Traverse Bay Watershed Project include:
• Land use… how land used, promote water friendly land use practices (BMPs, ordinances, zoning,…)
• Building partnerships and seeking funding for implementation activities.
• Ongoing monitoring to assess environmental conditions.
• Implementing information and education initiatives.
• Compiling results from ongoing research initiatives.
• Evaluating progress of plan implementation and water quality improvements.
A project evaluation for the initial version of the plan (December 2003), completed by the Conservation Resource Alliance is included as Appendix B.
239
REFERENCES CITED Alexander, G.R., and E.A. Hansen. 1988. Decline and recovery of a brook trout stream following an experimental addition of sand sediment. State of Michigan Department of Natural Resources. Fisheries Division Research Report No. 1943. Ann Arbor, Michigan. Allan, J. David. 1995. Stream Ecology. Chapman & Hall: London. Ardizone, Katherine A. and Mark A. Wyckoff, FAICP. 2003. Filling the Gaps: Environmental
Protection Options for Local Governments. Michigan Department of Environmental Quality Coastal Management Program with financial assistance from National Oceanic and Atmospheric Administration, authorized by the Coastal Zone Management Act of 1972. June 2003.
Auer, M.T., R.P. Canale, and P. Freedman. 1975. The Limnology of Grand Traverse Bay, Lake
Michigan. Technical Report No. 47. MICHU-SG_76-200. Michigan Sea Grant Program.
Bednarz, Ralph. 1993. Elk River Chain of Lakes Clean Lakes Phase I: Diagnostic/Feasibility
Study. Michigan Department of Natural Resources – Land and Water Management Division (in conjunction with the United States Environmental Protection Agency).
Beyer, Amy S., Cheryl K. Contant, Michael J. Donahue. 2001. Seeking Signs of Success: A
guided approach to more effective watershed programs. Harbor House Publishers: Boyne City, MI.
Biodiversity Project. October 2003. Great Lakes Basin Communications and Public Education
Survey, Final Report. Boutt, D.F., D.W. Hyndman, B.C. Pijanowski, and D.T. Long. 2001. Identifying Potential Land
Use-derived Solute Sources to Stream Baseflow Using Ground Water Models and GIS. Ground Water 39 (1): 24-34.
Cave, K., T. Quasebarth, and E. Harold. 1994. Selection of Stormwater Pollutant Loading
Factors. Rouge River National Wet Weather Demonstration Project. Center for Watershed Protection (CWP). 1994. The Importance of Imperviousness. Watershed
Protection Techniques. 1,3:100-107.
Center for Watershed Protection (CWP). 1998. (Reprint 2001.) Rapid Watershed Planning Handbook: A Comprehensive Guide for Managing Urbanizing Watersheds. Center for Watershed Protection: Ellicott City, MD.
240
Conservation Resource Alliance (CRA). July 2001. Elk River Chain of Lakes Watershed Management Plan: Revision.
Day, R. 1997. Michigan Fish Contaminant Monitoring Program 1997 Annual Report. Michigan Department of Environmental Quality Surface Water Quality Division. Report #MI/DEQ/SWQ-95/087. Dement, Polly. December 1995. River Talk! Communicating a Watershed Message. River
Network. De Walle, F.B. 1981. “Failure Analysis of Large Septic Tank Systems.” Journal of
Environmental Engineering. American Society of Civil Engineers. Diana, James. 1995. Biology and Ecology of Fishes. Cooper Publishing Group LLC: Carmel. Evans, E., M. Wilson, and W. Creal. 1991. Assessment of Mercury Contamination in Selected Michigan Lakes, 1987-90: Historical Trends, Environmental Correlates, and Potential Sources. Michigan Department of Natural Resources, Surface Water Quality Division. Fuller, Doug. 2001. Fish of the Elk River Chain of Lakes: A Watershed Perspective. Tip of the
Mitt Watershed Council: Petoskey, MI. Garn, H. 2002. Effects of lawn fertilizer on nutrient concentration in runoff from lakeshore
Grand Traverse County Drain Commissioner’s Office (GTCDC). June 1995. Acme Creek
Watershed Planning Project – Final Report. Prepared for Michigan Department of Natural Resources Nonpoint Source Program (now the Michigan Department of Environmental Quality’s Water Division).
Grand Traverse County Drain Commissioner’s Office (GTCDC). August 1995. Mitchell Creek
Watershed Implementation Project: Final Report. Prepared for Michigan Department of Natural Resources Nonpoint Source Program (now the Michigan Department of Environmental Quality’s Water Division).
Grand Traverse County Drain Commissioner’s Office (GTCDC). February 1995. Mitchell
Creek Watershed Protection Strategy. Prepared as part of the Mitchell Creek Watershed Implementation Strategy.
Grand Traverse County Drain Commissioner’s Office (GTCDC). April 2000. Acme and Yuba
Creek Watersheds Nonpoint Source Implementation Project – Final Report.
241
Great Lakes Environmental Center (GLEC). 1996. The Acme Creek Ecological Project: Natural Features Inventory and Land Management Plan. Prepared for the Grand Traverse Regional Land Conservancy, Traverse City, MI.
Great Lakes Environmental Center (GLEC). 1998. Peshawbestown and Omena Bay Baseline
Water and Sediment Quality Study. Prepared for the Grand Traverse Band of Ottawa and Chippewa Indians. Suttons Bay, MI
Great Lakes Environmental Center (GLEC). 2000. Integrated Habitat and Water Quality
Inventory of Grand Traverse Bay. Prepared for The Watershed Center Grand Traverse Bay funded through The Michigan Great Lakes Protection Fund.
Great Lakes Environmental Center (GLEC). 2001. Stormwater Source Identification, Sampling,
and Analysis at Select Storm Drains and Tributaries to Grand Traverse Bay (Lake Michigan). Prepared for The Watershed Center Grand Traverse Bay as part of an DEQ, Coastal Zone Management Study. (Principal Contact at GLEC: Dennis McCauley)
Great Lakes Environmental Center (GLEC). 2005. Water Quality Monitoring of Saginaw and
Grand Traverse Bays. Prepared for the Michigan Department of Environmental Quality Water Bureau. Report #: MI/DEQ/WB-05/042.
Great Lakes Information Network (GLIN). 2001. Website: http://www.great-lakes.net/envt/flora-fauna/invasive/invasive.html and http://www.great-lakes.net/teach/pollution/ans/ans_1.html. (Some information from: A Field Guide to Aquatic Exotic Plants and Animals, University of Minnesota Sea Grant Program). Gosling Czubak Associates (GCA) and Battelle Great Lakes Environmental Center (GLEC).
November 1991. Final Report: Mitchell Creek Watershed Non-Point Source Pollution Study. Commissioned by Grand Traverse County Drain Commissioner’s Office under a grant from the Michigan Department of Natural Resources.
Harrison, Ron and Jeremy Dunlap. 1998. Mapping Impervious Surface Coverage for Watershed
Monitoring and Land Use Planning. Project for: Grand Traverse County Drain Commissioner’s Office (GTCDC) and GIS Department.
Holtschlag, D.J. 1997. A generalized estimate of groundwater recharge rates in the Lower
Peninsula of Michigan. USGS: Water Supply Paper 2437. Houghton, J.T., Y. Ding, D.J. Griggs, P.J. van der Linnen and V. Xiasou, eds. 2001. Climate Change 2001: The Scientific Basis Intergovernmental Panel on Climate Change: Working Group. Cambridge University Press, Cambridge, U.K. Huron River Watershed Council (HRWC). 2003. Mill Creek Subwatershed Management Plan.
Huron River Watershed Council, Ann Arbor, Michigan.
Johnson, R.G. 1975. Exchange between Adjacent Natural Water Basins Via Cross-Sill Current
Meter Measurements. Dissertation, University of Michigan. 97 pp. Kauffman, J.B., W.C. Krueger, M.Vaura. 1983. Impacts of cattle grazing streambanks in northeastern Oregon. Journal of Range Management. 36:683-685 Kelly, R.W., and W.R. Farrand. 1967. The Glacial Lakes Around Michigan: Michigan
Geological Survey Bulletin, 23 p. Largent, Steve. 1991. Boardman River Watershed Report. Grand Traverse Conservation
District. Lauff, G.H. 1957. Some Aspects of the Physical Limnology of Grand Traverse Bay. Great
Lakes Research Institute, The University of Michigan, Ann Arbor, MI. Mehan, G. 1996. Mercury Pollution Prevention in Michigan: Summary of Current Efforts and Recommendations for Future Activities. University of Michigan Press, Ann Arbor. Michigan Department of Environmental Quality (DEQ). 1998. (Reprint 2001) Guidebook of
Best Management Practices for Michigan Watersheds. Lansing, Michigan. Michigan Department of Environmental Quality (DEQ). 1999. Pollutants Controlled
Calculation and Documentation for Section 319 Watersheds – Training Manual. Lansing, MI.
Michigan Department of Environmental Quality (DEQ). 1998. Water Quality and Pollution
Control in Michigan. 1998 Section 305(b) Report. Report# MI/DEQ/SWQ-98/030. Michigan Department of Environmental Quality (DEQ). 2002. Clean Water Act Section 303(d) List. Report # MI/DEQ/SWQ-02/013. Michigan Department of Natural Resources (MDNR). 1997. Michigan Fishing Guide. Michigan Department of Natural Resources, Fisheries Division. National Small Flows Clearinghouse (NSFC). 1995. Pipeline. 6(3). Northwest Michigan Council of Governments (NWMCOG). July 1989. Elk River Chain of
Lakes: Watershed Master Plan. O’Neal, Richard P. 1997. Muskegon River Watershed Assesssment. State of Michigan
Department of Natural Resources. Fisheries Division Special Report No. 19.
243
Pijanowski, B.C., D. Brown, B. Shellito and G. Manik. In press. Using neural networks and GIS to forecast land use changes: A Land Transformation Model. Computers, Environment and Urban Systems.
Pijanowski, B.C., S.H. Gage, D.T. Long & W. C. Cooper. 2000. A Land Transformation Model:
Integrating Policy, Socioeconomics and Environmental Drivers using a Geographic Information System; In Landscape Ecology: A Top Down Approach, Larry Harris and James Sanderson eds.
Pijanowski, B.C., T. Machemer, S.H. Gage, D. T. Long, W. E. Cooper and T. Edens. 1996. The
GIS syntax of a spatial-temporal land use change model. In Proceedings of the Third Conference on GIS and Environmental Modeling. GIS World Publishers - CD-ROM.
Pijanowski, Bryan, David Hyndman, and Bradley Shellito. 2001. The Application of the Land
Transformation, Groundwater Flow and Solute Transport Models for Michigan’s Grand Traverse Bay Watershed. Presented at the National American Planning Association Meeting. New Orleans, Louisiana, March 14, 2001.
Poff, N.L., M.M. Brinson, and J.W. Doy, Jr. 2002. Aquatic ecosystems and global climate change: Potential impacts on inland freshwater and coastal wetland ecosystems in the United States. Pew Center on Global Climate Change. 45pp. Roper Report. May 2001. Roper Report 2000: Lessons from the Environment. National
Environmental Education Task Force. Schueler, Thomas R., Heather K. Holland. 2000. (Reprint 2002.) The Practice of Watershed
Protection. Center for Watershed Protection: Ellicott City, MD. Sheffield, R.E., S. Mostaghimi, D.H. Vaughon, E.R. Collins, V.G. Allen. 1997. Off- stream water sources for grazing cattle as a stream bank stabilization and water quality BMP. American Society of Agricultural Engineers. 40: 595-604. Sills, R. ed. 1992. Mercury in Michigan’s Environment: Causes and Extent of the Problem. Michigan Department of Natural Resources, Surface Water Quality Division. Skillings, D.M. 1982. Report on groundwater contamination in Mancelona and Cold Springs
Shuey, J.A., C.A. Harris, and G.M. DeGraeve. 1992. Final Report for the Grand Traverse Bay
Watershed Initiative: Part II, Water Quality of the Bay and Tributaries. Great Lakes Environmental Center, Traverse City, MI. (Note: The Grand Traverse Bay Watershed Initiative is now known as The Watershed Center Grand Traverse Bay.)
State of the Bay 1998. Published by: The Watershed Center Grand Traverse Bay
244
State of the Bay 2000. Published by: The Watershed Center Grand Traverse Bay. State of the Bay 2000 CD Resource Guide. Published by: The Watershed Center Grand Traverse
Bay. Suvedi, Murari, Phillip Davis, Gary Taylor, Erin Hogarth. November 2002. Growth Pressures
Emphasize Need for Better Information and Access to Planning Tools for Local Officials. Newsletter from the Victor Institute for Responsible Land Development and Use. Michigan State University Extension.
Suvedi, Murari, Phillip Davis, Gary Taylor, Erin Hogarth. December 2002. Township Officials
Recognize Need for Better Information and Access to Planning Tools. Newsletter from the Victor Institute for Responsible Land Development and Use. Michigan State University Extension.
The Watershed Center. 2003. The Boardman Lake Watershed Study. By: The Watershed
Center Grand Traverse Bay, Ball Environmental Associates, and Great Lakes Environmental Center. Funded by Coastal Zone Management Act (National Oceanic and Atmospheric Administration), Michigan Coastal Management Program (Michigan Department of Environmental Quality), and Cone Drive Operations, Inc.
United States Environmental Protection Agency (USEPA). 1993. Guidance Specifying
Management Measures for Sources of Nonpoint Pollution in Coastal Waters. USEPA, Office of Water, Washington, D.C.
United States Geological Survey. 2005. Gauging Station Data: 04126970, Boardman River
Above Brown Bridge Road near Mayfield, MI. February 2004-2005 data used. Waschbusch, R., W. Selbig, and R. Bannerman. 1999. Sources of phosphorus in stormwater and
street dirt from two urban residential basins in Madison, Wisconsin, 1994-95. USGS Water-Resources Investigations Report 99-4021.
Waters. 1995. Sediment in Streams: Sources, Biological Effects, and Control. American Fisheries Society. Wolf, Jennifer. Marketing Your Message: Implementing Effective Information & Education.
Huron River Watershed Council (HRWC).
APPENDICES
Grand Traverse Bay Watershed Protection Plan
APPENDIX A: PLAN DEVELOPMENT PROCESS This Appendix includes information regarding the project steering committee; the initial project’s planning process; use of a website to disseminate information; and the public information and education strategy used during project. In addition, a summary of the second project to update the protection plan is provided at the end.
INITIAL PLANNING PROJECT (DECEMBER 2001-2003)
Many tasks were conducted to develop the Grand Traverse Bay Watershed Protection Plan. Developing a protection plan for the 976-mi2 watershed required a large amount of planning and cooperation among organizations, as well as compiling a large amount information into a single document. The following bulleted list highlights some of the key components of the plan development process.
• Steering Committee o A steering committee, comprised of local and statewide experts and interested
citizens, was formed at the beginning of the project. This committee guided the project to completion and made key decision regarding findings and reporting information.
o The committee met approximately every other month. o List of steering committee members (project vendors in bold):
Sarah U’Ren, Anne Brasie, John Nelson, and Anne Hansen: The Watershed Center Grand Traverse Bay
Greg Goudy: Michigan Department of Environmental Quality Jim Muratzki: Land Information Access Association Matt Heiman: Leelanau Conservancy Jim Haveman, Laura Keuhn: Conservation Resource Alliance Megan Olds, Viet Doan: Northwest Michigan Council of Governments Tom Wessels: Grand Traverse Regional Math, Science, and Technology Center Matt McDonough: Grand Traverse Regional Land Conservancy Gordon Hayward: Peninsula Twp. Planner Russ Adams: Silver Lake Association Mary Wilson, Patty O’Donnell: Grand Traverse Band of Ottawa and Chippewa Indians Steve Largent, Lew Coulter: Grand Traverse Conservation District Maureen Templeton: Grand Traverse County Drain Commissioner Tom Buss: Grand Traverse County Health Department Russ LaRowe: Kalkaska Conservation District Natasha Lapinski, Chris Grobbel: Ball Environmental Associates Tom Emling: MSU-North Barbara Nelson-Jameson: National Park Service Bob Cole: City of Traverse City, Department of Public Works Tom Kelly: Inland Seas Education Association Gerry Harsch: Garfield Township Planner John McKinney: MSU Sea Grant Bruce Knapp, Tom Adams, Buzz Long, Pepper Bromelmeier: Natural Resources
Conservation Service Bryan Pijanowski: Purdue University (formerly of MSU)
• Project Website o As part of this project, the Watershed Center’s website (www.gtbay.org) was
extensively revamped in January 2003. It contains updated general information
on The Watershed Center, as well as detailed information and data on the watershed as it was gathered and compiled for the project.
o The website also serves as a data repository for steering committee members; meeting notes and agendas, and project documents were posted for review by steering committee members.
o A calendar of events was also available for visitors to the website.
• Public Information and Education (I/E) Strategy To get the word out about the project and to generate public awareness regarding the Grand Traverse Bay watershed, an extensive information and education strategy was implemented throughout the project. The following items were used as either educational tools or as ways to gather information regarding stakeholders’ opinions of threats to water quality, watershed goals, and desired uses.
o Newsletters – a quarterly newsletter was printed and distributed to approximately 1,200 individuals outlining progress and projects pertaining to the plan.
o Press Kit – A press kit containing general project and watershed information fact sheets was created.
o Project Brochure – A simple brochure about The Watershed Center and the project was created. In addition, a simple flyer was created as a take-home piece for use at stakeholder meetings.
o Bay Day – We hosted Bay Day in both June 2002 and June 2003, providing attendees with fun, interesting opportunities to learn about the watershed and the protection plan.
o Regional Watershed Conference – We co-hosted a two-day conference in August 2003 to help educate regional government officials and others about watershed protection planning and other related issues, such as, water quality monitoring.
o “Freshwater Focus: The State of the Watershed” – We produced a 16-page insert to the Record Eagle (c. 42,000) to educate area citizens about the plan and key issues that the plan will address including nutrients, sedimentation, land use and growth, etc. An additional 5,000 copies were printed for further distribution.
o Household Survey – A survey was conducted by M-TEC Business Research Services, a division of Northwestern Michigan College, to determine what water quality issues area residents were concerned about, their level of knowledge on watershed issues and basic demographics.
o Focus Groups – Conducted series of six business focus groups: agriculture, manufacturing, Grand Traverse County, Leelanau County, Antrim County, and Kalkaska County. Objective was to explore area business people/owners water quality concerns and ideas for protection, as well as perceived obstacles to natural resource protection. Report compiled by M-TEC Business Research Services of Northwestern Michigan College.
o Friday Night Live – Had booth with project information at 3 downtown Traverse City “Friday Night Live” events (7/25, 8/1, 8/29)
o Stakeholder meetings
What Where When
Antrim County Gov: 2/25/03 Pub: 4/10/03
Grand Traverse County Gov: 2/27/03 Pub: 4/28/03
Kalkaska County Gov: 3/4/03 Pub: 4/8/03
Governmental and Public Stakeholder Meetings
Meetings included: • presentation about the 319 Project • time for participants to share their
water quality and pollutant concerns
• handouts for participants to take back regarding general project information.
A partial summary of results of these meetings is in the Spring 2003 newsletter.
Leelanau County Gov: 3/6/03 Pub: 4/22/03
TC Rotary Club 1/7/03
TC Sunshine Rotary Club 1/8/03
Three Lakes Association 5/12/03
Elk Rapids Historical Society 4/24/03
Other Stakeholder Meetings Meetings included a presentation explaining The Watershed Center and the Planning Project. Since the presentations were made at regular meetings of these organizations they were under time constraints and kept short. Northport Lions 6/11/03
TRANSITION GRANT – PLAN UPDATE PROJECT (JULY 2003 - DECEMBER 2005) The initial Grand Traverse Bay watershed plan was completed in December 2003 and approved by the DEQ under the Clean Michigan Initiative bond criteria. The following year, the plan needed to be updated to meet new EPA criteria for the Section 319 funding program. The Watershed Center Grand Traverse Bay was awarded an additional Section 319 grant (called the ‘Transition Grant’) to complete the plan update. The 2005 revisions include additional information on pollutant sources and concentrations, load reduction estimates of various BMPs, measurable milestones to guide implementation progress, and a set of criteria to evaluate the effectiveness of implementation efforts. The Steering Committee met twice during the 18 month project and helped to guide the plan update. During the transition grant period a number of outreach activities were conducted to get the word out about results from the protection plan and to generate public awareness regarding the Grand Traverse Bay watershed. The activities included: an updated project display, a stormdrain stenciling event, newsletters, two editions of Freshwater Focus, updated project website, and a reprinting of The Watershed Center’s Great Lakes Shoreline Property Owners Guide.
Note: This is an evaluation of the initial planning project conducted by the Conservation Resource Alliance. It does not include an evaluation of the additional project (Transition Grant) from July 2004-December 2005 to update the protection plan to meet the newly implemented EPA criteria. An evaluation of the watershed protection planning process was completed by the Conservation Resource Alliance (CRA) during the mid- and final-project phases. CRA was subcontracted by The Watershed Center to conduct the evaluation using the “Seeking Signs of Success: A guided approach to more effective watershed programs” guidebook (Beyer et al. 2001). The evaluation process involved tracking the progress and success of each of the project tasks outlined in the project work plan. CRA worked with the project steering committee to establish a task force to aid in the development of the evaluation process for the project. It was determined that goals and activities that needed to be completed to accomplish those goals should be developed for each task. The party accountable for each task was responsible for working with CRA to develop the goals and activities. CRA developed forms for evaluating progress towards reaching the goals and for retrieving general feedback (i.e.: project success and frustrations) from subcontractors and the steering committee at large. CRA worked with the steering committee to conduct an evaluation of the planning process at the mid-project point in November of 2002 and near project completion in November of 2003. The feedback was summarized, compiled into a report and presented to the steering committee by CRA. The mid-project and final project evaluation reports and evaluation feedback questionnaire responses are available for review at The Watershed Center. The general findings from the mid-project evaluation indicated that progress was being made on all tasks, however complications with staff transition and the project contract at the start of the project resulted in some deviations from the project schedule. The Watershed Center worked closely with MDEQ to revise the project work plan and timetable to include an extension of one quarter. Participants felt that future proposals would benefit from inclusion of an advanced communications task to allow for set up prior to the first quarter of project activity. It was also decided that an evaluation strategy for the upcoming implementation phase of the watershed protection plan would be beneficial. The final project evaluation indicated that all project tasks would be successfully completed and within schedule. A couple of project activities were dropped or revised due to change in the scope of a task. The biggest struggle in the final phase of the project was obtaining participation from the full steering committee for reviewing the draft portions of the watershed plan. During the second year of the project, CRA worked with the steering committee to draft an evaluation strategy for the implementation phase of the watershed protection plan. The strategy discussed methods for tracking and evaluating the success of plan implementation. That plan has been revised and updated to include newly implemented EPA criteria for watershed protection plans and is found in Section 7.5.
APPENDIX C
FIELD ASSESSMENT OF THE GRAND TRAVERSE BAY SHORELINE
muratzki
Click Here to View the Grand Traverse Bay Shoreline Report
APPENDIX D
SUMMARY OF EXISTING WATERSHED PLANS AND OTHER RESEARCH STUDIES
1
Grand Traverse Bay Watershed 319 Project Last Updated: December 12, 2003
Summary of Existing Watershed Plans and Other Research Studies
Subwatershed Existing Studies General Findings Environmental
Stressors/ Pollutants
Sources
Elk River – Chain of
Lakes
1. Watershed Master Plan July 1989 – NWMCOG
2. Watershed Management
Plan July 2001 – CRA
1. WQ threats and concerns = planning/zoning for development, septic tanks, loss of wetlands/natural areas/open space, use conflicts, stormwater runoff, erosion/sedimentation, industrial pollution, oil/gas/brine wells and LUSTs, low and fluctuating water levels in upper Chain of Lakes area Conclusions: *headwaters just as impt. as more visible lakes/streams *economics based on maintaining high quality resources for recreation and quality of life *maintaining natural vegetation and wetlands is key *reduce man-made inputs from septic/stormwater/chemicals/other 2. Lists 5 specific watershed Goals with corresponding Objectives, and Strategies: *protect/improve quality of water resources *protect integrity of system *preserve the distinctive character and aesthetic qualities *establish land management practices which conserve natural res. *establish and support educational programs *utilize steering committee as coordinating body General facts: 491 mi2, 23% water, 200+streams, 138 miles of Desig Trout Stream
Rd. Str. Cross Bank erosion Construction Wells Indus.Poll Stormh20 LUSTs Septics Stormh2o H2O levels Dams Stormh2o Lack canopy
2
Subwatershed Existing Studies General Findings Environmental
Stressors/ Pollutants
Sources
Acme Creek (including a study with
Yuba Creek)
1. Acme Creek Watershed Planning Project
June 1995 – GT County Drain Commission
2. Acme/Yuba Creek NPS
Implementation Project April 2000 – GT County Drain
Commission
1. WQ concerns: sedimentation, nutrient loading (golf courses), res. and ag. lands, and stormwater runoff (from inc. imperv surfaces) *Developed watershed database (wetlands, parcel lines, slopes, land cover, twnp zoning, potentially sensitive areas) *Existing ordinances weak and not targeted to protect creek/fish hab *Specific streambank erosion sites/inadequate culverts noted *Public concerns: golf course practices, road construction, and protection of headwater areas *DEQ bio 1994 bio survey: macros slightly impaired General facts: 12.6 mi2, drains to East Bay; Acme, East Bay, Whitewater Twp., 62%forest, 12%urban, 10%open, 9%wetlands 2. Land Protection: Deepwater Point Natural Preserve, Frost property, Spindrift property I/E: watershed landowner’s handbook, road signage BMPs: corrected all severe runoff erosion sites (prevented 73 and 70 tons of sed/year from entering Acme and Yuba Creeks)
Sediment Nutrients Toxins? Thermal Poll?
Rd St Cross Bank erosion Construction? Stormh2o Golf Course Ag. Runoff Stormh2o Stormh2o Lack canopy
Acme/Yuba/Mitchell Creeks
Mapping Impervious Surface Coverage for Watershed
Monitoring and Land Use Planning
GT Co. Drain Commissioner’s Office and GIS Dept – ####
Defined as any surface in urban landscape that can’t effectively absorb or infiltrate rainfall (road, sidewalk, parking lot, roof) Impervious surface important WQ indicator; stream degradation occurs at % impervious levels bt/n 10% - 20% Mitchell Creek: 8.9% impervious; 7 of 29 subbasins > 10% Acme Creek: 4.2% impervious; 2 of 11 subbasins > 10% Yuba Creek: 2.4% impervious Efforts to control impervious areas could be an effective approach for protecting WQ and quantity; Land use planning; impacts of zoning buildout…
Subwatershed Existing Studies General Findings Environmental
Stressors/ Pollutants
Sources
Mitchell Creek
1. NPS Pollution Study 1991 – Gosling Czubak
Associates and Battelle Gr. Lks. Env. Center
2. Implementation Project Final Report
1995 – GT Co. Drain Comm.
3. Watershed Protection Strategy
1995 – GT Co. Drain Comm.
1. Critical areas = wetlands & gh2o recharge areas General recommendations: GT County Soil Erosion and Stormwater Runoff Control Ordinance, preserve wetlands, install riparian buffer zones, create/preserve forest cover, protect gh2o recharge Specific recommendation: install agricultural, golf course, and urban stormwater BMPs 2. Outputs: * Watershed protection plan; * BMPs (246 acres in ag. management program & 1200 ft. streambank stabilized); * Land Protection: land owner database, land owner’s handbook, 158 acres protected; * Organizational structure/ intergovernmental support; *GIS database; * I/E: cleanups, tree plantings, signage, video “Beyond Boundaries, A Community Approach” 3. Contains recommendations relating to the amt, type, and location of development, size of stream setbacks and wildlife corridors, viewshed opportunities, and other components Assessment of Natural Systems: Aquatic Resources: fisheries quality fair-excellent, numerous stream segments have excessive sediment deposits Wildlife Resources: lower portion has good diversity Wetlands: 4 critical wetland areas, development pressure Aquifer Recharge Area: located in headwaters, higher elevations WQ Problems: excessive sediment, elevated nutrients, urbanization threatening gh2o recharge, drinking h2o threats WQ and aquatic diversity are good in spite of obvious degradation – recommended to control erosion/sedimentation and thermal poll General facts: 14.7 mi2; drains to East Bay; Blair, East Bay, Garfield Twp and City of Traverse City; headwater area = steep slopes, middle/lower = flatter w/ wetlands; 16 miles of high quality trout stream; significant gh2o contrib. (gaining stream); land use shifting from agriculture and forest to urban (13%)
Stormh2o Rd St Cross Bank erosion Construction Stormh2o Reduc. of Wetlands Reduction of gh2o recharge Lack canopy Stormh2o
4
Subwatershed Existing Studies General Findings Environmental
Stressors/ Pollutants
Sources
Boardman River
BoardmanRiver
(entire)
1. Section 319 Success Stories
1997 – EPA
2. Restoration and Protection Project
1999 – GTCD
1. Stabilized 96 sites on River, Prevented 1200 tons sed/yr, Used bioengineering practices (native plants, whole tree revetments, log cribbing, vegetation to water’s edge, veg. w/ rock rip rap, fish lunkers, composted leaves), Installed 4 sand traps, Educational materials (brochures, display, t-shirts, video-“Currents of the Boardman”, three 30-second PSAs), GT Reg.Land Conservancy protected 600+ acres and established endowment fund 2. No impaired designated uses: ch2o fishery and total body contact threatened, has list of pollutants and sources with paragraphs detailing information DNR P51(’93-’96) = 54% index stations good, 46% fair; occasional health advisories (sewage); 600+ erosion sites neg. impacting aq. habitat; DNR (’86) lack of adequate trout cover and spawning gravel, (’94) improving, need for continuous erosion control work and sand trap maintenance Steering committee prioritizations: road/stream crossings, streambank erosion, recreational activity, urban stormwater runoff, and land fragmentation Six project goals: Implement BMPs to reduce sedimentation… Permanently protect critical riparian areas thru conserv. easements Evaluation effectiveness thru WQ/bio monitoring & public comment Monitor & maintain all past and future restoration activities Education Involve citizens, public agencies, user groups and landowners W/in 5 years, develop Boardman R. Restoration & Protection Fund General facts: 295 mi2, GT and Kalkaska Counties, Blue Ribbon Trout Stream and Natural River, 50+% forested-12% urban
Sedimentation Thermal Poll. Nutrients Pathogens
Rd St Cross Bank Erosion Rec activities Stormh20 High flow Velocity Ag activities Impv surface Hydro prod Timber harv Animal waste Stormh2o Septic Riparian graz Sewage Trt. Stormh2o Riparian graz Animal waste
5
Kid’s Creek
Stormwater Management Plan 1991 – FTC&H
(for Garfield Twnshp and TC)
Project Goals: protect nat. resources, existing residential units adjacent to stream, and to control potential detrimental impacts resulting from stormh2o runoff Specific Problems in Kid’s Creek: Flooding – due to inc. stormwater runoff, Soil Erosion and Sedimentation, Streambank Erosion, and Water Quality – potential thermal pollution included Contains both structural and non-structural recommendations General facts: 4.3 miles long, trib to Boardman, designated trout stream, heavy and rapid urbanization
Sedimentation Thermal Poll Hydrologic Flow
Rd St Cross Stormh2o Bank erosion Stormh2o Lack canopy Flooding (stormh2o)
Miller &
Jack’s Creeks
NPS Pollution & Stream Habitat
Report March 1998 – GT
Conservation District
Major Resource Concerns: 1. Perched Culverts – 4 of concern (2 in each), greatest threat to
biological health 2. Sediment – Miller = 22 sites, Jack’s = 8 sites 3. Nutrient Loading – buffalo farms in hw of both 4. Trash – esp. Miller behind GT Crossings u/s to US 31 5. Stream Habitat – Miller u/s Cass Rd = sandy, d/s = good hab;
Jack’s u/s Cass Rd = lacks wdy debris and cover, d/s = good 6. Riparian Land Use – steep slopes and gh2o seeps impt.
(developers must strictly adhere to soil erosion and sed. control ordinances)
General facts: 14.7 mi2; subwatersheds/tribs to Boardman, located entirely w/in Garfield Twnshp
Sedimentation Nutrients
Rd St Cross Bank Erosion Ag farms Stormh2o
Boardman Lake/ River
The Collection and Analysis of Sediment
Samples from the Boardman LakeRiver
GLEC – 2002
Report done for DEQ: *July 1997 – sediment core sampling to det if lake sediments had been impacted by the Q of contam from pt and nonpt sources – current report reanalyzes toxicity of sediments from 3 spots *Results indicate that there are elevated conc of contam in the sediments in B Lake and River at sampled locations, in some areas are toxic and have potential to neg affect benthic organisms (measured = PAH’s, metals, toxicity to zooplankton)
6
Silver Lake
1. Silver Lake Summary & Issues 2002 – S.L.Assoc.
2. Fish Collect. Data
1994 – MDNR
3. Silver Lake WQ Trend Analysis 2000 – GLEC
1. Runoff and spring fed; Land use from ag to residential, GT County pop increased 272% from 1950-2000; 300 properties year round residences w/ approx 100ft of shoreline; ¼ mile of 8mi perimeter is undeveloped; Overflow drain completed in 1987, max of 862 ft above sea level (to Beitner Crk, trib to Boardman), sporadic flow, turned off when temp is 68oF+; Development has eliminated small wetland pockets; 53 erosion sites identified; WQ testing spring and fall since 1993 – TP/secchi disk/chlorophyll a/temp/DO Designated uses threatened: Navigation, other indigenous aquatic life, warmwater fishery, total/partial body contact 2. Lack of bluegill and yellow perch special concern, which were abundant in 1982; walleye/smallmouth bass/ largemouth bass growing below state average 3. Water quality data collected from 1993-99 P is primary algal growth limiting nutrient; Bottom-water has low DO in north end, demonstrates potential for WQ degradation; Elevated near bottom phosphorus levels- WQ has been compromised; further deterioration of WQ will likely result if P and sediment loading are increased General facts: 10 mi2, 600 acre surface area, 2-4 mi SW of TC, Garfield and Blair Twp,
Sediment Nutrients Invasive aq. species
Bank erosion Stormh2o High P Eurasian Milfoil
7
Summaries of Studies Done on the Grand Traverse Bay and Watershed Name of Study/ Subwatershed General Findings
Assessment of the Lake Michigan Monitoring Inventory: A report of the Lake MI tributary monitoring
project
Great Lakes Commission – August 2000
Full Report at: www.glc.org/monitoring
Part of the GLC and EPA’s Lake Michigan Lakewide Management Plan. Purpose: assess existing monitoring efforts in LMI basin and subwatersheds; comprehensive review of monitoring programs at the federal, state, and local levels; analysis of gaps, inconsistencies and unmet needs; assessment of the adequacy of existing efforts to support critical ecosystem indicators, and recommendations for addressing major monitoring needs. Done by: surveying potential local monitoring organizations and follow-up interviews; survey of state and federal monitoring; all compiled into database Summary of Grand Traverse Bay Watershed: Watershed protection plans for five sub-basins: Mitchell, Acme, Yuba, Elk River/Chain of Lakes, Boardman – includes short summary of pollutants and sources for each subbasin. Pollutants of Concern and Synopsis of monitoring efforts for each of the following: Aquatic, Pollutant Release, Nutrients and Bacteria, Meteorological and Flow Monitoring, Sediments, Fish Contaminants/Fish Health/Aquatic Nuisance Spp, Benthos, Air, Wildlife and Land Use
Summary: • Average water clarity increased 20% from 1990-2000 in W. Arm of Bay • Sediment quality very good at nearshore sites – typical substrate is coarse sand with numerous nearshore areas of
cobble and gravel; 100+ft depth, bottom is silt/clay • Total Phosphorus:
- Sig. differences in TP bt/n offshore surface and bottom samples for Omena Bay - TP higher at nearshore than offshore - TP continued to decline since 1970 - Sig. higher levels of TP at mouth of Boardman River and Acme Creek
• Urban tribs and stormwater drains are a sig source of nutrients to the Bay; elevated levels of bacteria may pose health risk after large rain events
• Weed bed numbers have nearly doubled from 64 (1991) to 124 (1998) • Seiche events (large scale periodic movements of water) can resuspend sediments in deeper portions of the Bay. If
carried into the water column, they can release contaminants deposited decades ago. • Sig changes in dates of freeze-up and break-up bt/n 1851-1993 in Bay
- Av. freeze-up date is 12 days later - Av. break-up date is 19 days earlier - Did not freeze over in 2001, marking the 5th consecutive year of not freezing over in past hundred years of record
• Five federally listed endangered or threatened species (+1 candidate): Bald Eagle, Kirtland’s Warbler, Piping Plover, Pitcher’s Thistle, MI Monkey Flower, Eastern Massasauga Rattlesnake
• Two new exotic species found in Bay since 1999: Fishhook Water Flea and Rusty Crayfish (since 2000, the Spiney Water Flea has been discovered)
Additional Info: EPA recommends measuring recreational WQ by the abundance of Escherichia Coli: Water is unsafe for swimming if – 130+colonies/100mL in 5 samples over 30-day period or 300+colonies/100mL in any 1 sample
• E.Coli is common intestinal organism – presence indicates Fecal Pollution, the kinds measured in water don’t generally cause disease; those that cause disease are pathogens (i.e., other bacteria, viruses, protozoa, small worms)
• EPA studies indicate when E.Coli exceeds set standards, increased risk of gastroenteritis from pathogens in Fecal Pollution
Sources: urban runoff, inadequately treated wastewater, ag runoff, illegal sewage discharge from boats, animals, etc.
9
Cont’d…
State of the Bay 2000
The Watershed Center
Parameters summarized in State of the Bay and not GLEC Habitat Study: Water and Habitat Quality – Most common nearshore bottom feature is sand or combo of sand, gravel, and cobble Increase in silt and organic detritus along nearshore bottom 39 spp. of native and non-native fish live in Bay; diverse assortment of other insect and inverts Minerals – Levels of Ca, Mg, Sulfates, and Chlorides are all consistent among sample sites and years Concentrations are typical of high quality freshwater lakes, no suggestion of WQ degradation Toxic Metals Data – Cd, Cr, Pb, Zn, Ni: all relatively low, consistent with other lakes Cu decreased by 60% => 1ug/L (1975), 0.4ug/L (1998) Hg levels low => 0.26ng/L, slightly higher at South end of W.Arm and North end of E.Arm; b/c of loadings from Boardman and Elk River Report comes with informational CD containing the following sections:
• History of Land Use • Bay Ecology and Natural Processes • Impacts on the Bay • Efforts to Protect the Bay • Regional Maps • Virtual Flight over the Bay
10
Integrated Habitat and Water Quality Inventory for the Grand
Traverse Bay GLEC – April 2000
With historical references to: 1. The Limnology of Grand
Traverse Bay, Lake Michigan, Auer et al., 1975
2. Some Aspects of the physical Limnology of Grand Traverse Bay, Lauff, 1957
3. Final Report for the GTBWI: PartII, Water Quality of the Bay and Tributaries, Shuey et al., 1992
4. The Acme Creek Ecological Project: Natural Features Inventory and Land Management Plan, GLEC, 1994
5. Peshawbestown and Omena Bay Baseline Water and Sediment Quality Study, GLEC, 1998
Study designed to compliment past and ongoing studies – make it comparable Purpose: Characterize the state of the GTBay regarding chemical and bio indicators, by conducting habitat and WQ inventories of near-shore waters. *Links near/off-shore WQ to nearshore habitat Findings: Typical of other oligotrophic embayments in Gr.Lakes; deep, clear, cold, DO/temp indicate little stratification, DO at or near saturation most of year, h2o transparency exceeded 7-8m, nutrients and chlorophyll a were relatively low (continually declined), overall productivity low Sediment – Quality is good, typically coarse sand w/ numerous areas of cobble and gravel Isolated areas relatively rich in inorganic matter (Omena Bay); does not contribute significant concentrations of nutrients to water column; few rooted macrophyte beds (b/c of lack of suitable substrate?); most of sediment Phosphorus is organically bound Macrophyte Beds – Weed bed numbers have nearly doubled from 64 growth areas (in 1991) to 124 areas (in 1998) Most concentrated at S end of W.Bay (where higher amts of P enter) highly influenced by rapid development Nutrient inputs and the amount of water flushing an area were most important determinants for locations of beds Total Phosphorus – Growth limiting nutrient for the GT Bay *Sig differences bt/n offshore surface and bottom samples in Omena Bay (sediment quality, incomplete mixing of Omena Bay w/ GTBay): Spring’99- 2ug/L at surface; 64ug/L at 80ft *Nearshore TP concentrations higher than offshore: near av = 4.6ug/L, off av = 2.8ug/L * Continued decline since early ‘70’s: 1975 - 7.8ug/L, 1992 – 5.4ug/L, 1994 – 4.9ug/L, 1998 – 3.8ug/L, 1999 – 3.0ug/L Nitrate – Not a growth limiting nutrient for the GT Bay, sufficient quantities for growth Generally higher in offshore near bottom than surface samples (except Omena Bay) 1998 – 0.2mg/L (0.25mg/L in Wbay), measurements similar to historical (Auer, Shuey, GlEC) Silica – Found in colloidal/suspended matter or in biomass (diatoms) Declined dramatically in past 40yrs: 1957 - 3.6mg/L, 1976 - 0.423mg/L, 1992 - 0.410mg/L, 1998/9 - 1.06mg/L
11
Cont’d…
Integrated Habitat and Water Quality Inventory for the Grand
Traverse Bay GLEC – April 2000
With historical references to: 1. The Limnology of Grand
Traverse Bay, Lake Michigan, Auer et al., 1975
2. Some Aspects of the physical Limnology of Grand Traverse Bay, Lauff, 1957
3. Final Report for the GTBWI: PartII, Water Quality of the Bay and Tributaries, Shuey et al., 1992
4. The Acme Creek Ecological Project: Natural Features Inventory and Land Management Plan, GLEC, 1994
5. Peshawbestown and Omena Bay Baseline Water and Sediment Quality Study, GLEC, 1998
Chlorophyll a – Pigment found in plants, necessary for photosynthesis – indicates amt of suspended algae Varies w/ seasons; No significant change since 1975 Overall Bay chlorophyll a average = 1.04ug/L, even though slight increases have been shown for chlorophyll a, the Bay is still oligotrophic w/ overall low productivity Secchi Disk, Transparency – Measure of h20 trans. – directly linked to inorganic suspended solids and plankton abundance Varies throughout year, generally greater in Spring: 1957-10.5m, 1975-7.0m, 1992-5.7m, 1999-8.5m; Spring 2000 Inland Seas – 32ft lower W.Arm, 38ft Suttons Bay Increase in water clarity correlated to decrease in TP since 1991, suggested that this is strongly linked to proliferation of increased zebra mussels in bay since that time Phytoplankton – Greatest abundance in Spring, 21 total spp; dominant ones typical of oligotrophic systems Historically: Auer 1957 stated W.Arm transitioning towards eutrophication Current: W.Arm more organisms/L than E.Arm in late summer, suggests more nutrients available in W.Arm and higher level of eutrophication Overall though, typical of oligotrophic and no suggestion of eutrophication Zooplankton – Assemblages are similar to those typically found in L. MI and Great Lakes Benthic Macroinvertebrates – Spiny water flea observed in Omena Bay Greilickville abundance of zebra mussels, 58% of population Fish – Total of 19 spp. (9 families, 2 invasive: alewife, 3-spined stickleback) Substrate, Plant Life, and Functional Wetland Assessment – 13 specific substrate/habitat types identified; GIS mapped
12
Stormwater Source Identification, Sampling and Analysis at Select Storm Drains and Tributaries to
GTBay (L.MI)
GLEC – 2001
This report is also summarized in State of the Bay 2000: Objectives/Purpose: Map the locations of stormdrains that discharge to Bay Quantify the mass loading of nutrients (TP, Nitrates, Fecal Contaminants) via urbanized tribs and direct discharges to Bay *used 1 normal low flow (August) and 1 normal high flow (Nov) *Boardman River, Elk River, Stormdrains: E. 8th St., E. Bay Park, Maple St., Hope St., Bryant Park, Suttons Bay, Northport Historically: Shuey et al 1991 – nutrient loadings for 20 tribs and 6 storm sewers; concluded that stormwater outfalls carried the greatest single concentration of nutrients to Bay (Storage capacity in Elk River is much greater than Boardman River; Elk has lakes to store and buffer water, Boardman has more imperviousness and quicker flow through system) Total Phosphorus: * TP concentrations mush higher in wet weather samples than for dry weather *Highest concentration of TP are found at stormwater outfalls; however flow is much less, so loading may be less than in Elk or Boardman Rivers; also numerous stormwater outfalls drain directly to Boardman and Elk Rivers… See Table 2 in State of the Bay 2000 Bacteriological: Combined sewer overflows and Stormwater outfalls are activated during high rainfall events, may result in direct discharge of untreated sewage with Stormwater into waterbody; Sources also include: improp functioning septic tanks, illegal snitary sewer connections, food process plants, animal feeding operations, outdoor pets, and feral animals *Sig potential for fecal contamination following storm events; Extremely high conc of E.Coli and enterococci were noted during wet weather sample… See Table 2 in State of the Bay 2000 *Summer storm even has potential for sig public health risk at local beaches b/c of Stormwater outfalls: At risk= West End, Clinch Park, and Bryant Park Beaches, East Bay Park, Elk Rapids City Park, Northport Beach, Southshore Park Beach (Suttons Bay), and waterfront homes Conclusions: • Implementation of Stormwater retention programs is critical: urban and high imperv areas • Stormwater management plans integrated into local land use zoning ordinances
APPENDIX E
AVERAGE RATES FOR COSTS OF INSTALLING STANDARD BMPS (COMPILED BY: FISHBECK, THOMPSON, CARR & HUBER, INC.)
Page 1 of 2
Information and Education Cost Estimates
Task Costs Units Notes Source
Promotional
Flyer 0.28$ each black and white Grand Valley Community Survey
T-shirts 12.50$ each Three color m,l, and XL Grand Valley Community Survey
Video Production 6,000.00$ each Grand Valley Community Survey
Telephone book inserts standard 0.07$ each min order of $2500 Verizon Super Pages
Telephone book inserts new resident 0.20$ each min order of $2500 Verizon Super Pages
Bathroom Advertising 75.00$ each/month monthly rate for 11"x 17" plus $95 design and $2 reproduction Johnny Avertising
Bathroom Advertising 35.00$ each/month monthly rate for 8.5" x 11" plus $95 design and $2 reproduction
Newspaper Ad 32.00$ square inch Sunday paper full page ad about $4000 Muskegon Chronicle
Newspaper insert 0.05$ each Cost of service only, reproduction is not included (1 sheet max) Berrien County Drain Commission
Utility bill inserts 0.50$ each Reproduction and distribution Grand Valley Community Survey
Yellow Pages Ad 5,000.00$ each/year Half Page Add in Yellow Pages Verizon Super Pages
Watershed Logo Signs 90.00$ each 11x17" sign Grand Valley Community Survey
Operational
Project Manager/year 29,120.00$ $15/hour Bear Creek Watershed Project
Intern/year 20,800.00$ $10/hour Bear Creek Watershed Project
Vehicle/year 15,000.00$ each does not include maintenance or insurance Bear Creek Watershed Project
Mileage 3,840.00$ $0.32/mile MDEQ
Fringes (20%) 13,752.00$ 20 percent of total MDEQ
Community Development
Oridinance Development 8,000.00$ lawyer fees and meetings Grand Valley Community Survey
Education
School Presentation 250.00$ each plus 20 hours preparation Grand Valley Community Survey
4H Program 39,000.00$ annually Management, Staff, and programs Bear Creek Watershed Project
Demonstration Sites
Agriculture 1,350.00$ each Grand Valley Community Survey
demonstration booth 200.00$ each Grand Valley Community Survey
Outreach
Riparian Club 8,000.00$ annually Grand Valley Community Survey
field trips 16.00$ each student Grand Valley Community Survey
phone hotline 1,142.00$ first year startup Bell South
Page 2 of 2
Oil recycling container 2.79$ each min order of 300 and $750 delivery GEOPlastics
Adopt-a-Stream Program 3,200.00$ annually Grand Valley Community Survey
Evaluation
Water Quality Monitoring 180,000.00$ annually Bear Creek Watershed Project
Stream Monitoring 25,000.00$ annually Bear Creek Watershed Project
Fieldwork
Canoe trip 250.00$ each Grand Valley Community Survey
Watershed tours 200.00$ each Grand Valley Community Survey
Public Relations
Public Meetings 250.00$ each Grand Valley Community Survey
Workshop 500.00$ each plus 40 hours preparation Grand Valley Community Survey
Committee Meeting 25.00$ each Grand Valley Community Survey
Newsletters
Mailing 0.30$ each bulk non-sorted USPS
0.12$ each presorted bulk mail rate USPS
600.00$ year application and accounting fees for bulk mailing USPS
Color glossy 2.30$ each Allegan Conservation District
Inserts 0.12$ each black and white Berrien County Drain Commission
Envelopes 0.03$ each business envelopes box of 500 Staples.com
Letter 0.27$ each envelop, postage, and form letter
Page 1 of 5
Best Management Practices Cost Estimates*
Task Costs Units Output Notes Source
Agriculture
Conservation Tillage 10.00$ acre NRCS
Fertility Testing 2.75$ acre Lab testing done to MSU standards MDA Conservation Service 1992 adjusted for inflation
IPM 5.75$ acre MDA Conservation Service 1992 adjusted for inflation
Windbreaks 2.00$ foot4200 feet needed for a square 40 acre field. Protects ten times as trees are high NRCS
Cover Crop 14.00$ acresweet clover if using forage for harvest results in gain of $125/acre NRCS
Critical Area Planting 1,300.00$ acreIncludes: grading, planting, herbicides, mulch, and labor. NRCS