Date post: | 21-Nov-2023 |
Category: |
Documents |
Upload: | independent |
View: | 0 times |
Download: | 0 times |
Water Center, The
Faculty Publications from The Water Center
University of Nebraska - Lincoln Year
Field-Scale Cleanup of Atrazine and
Cyanazine Contaminated Soil with a
Combined Chemical-Biological Approach
Manmeet Waria∗ Steven Comfort† Sathaporn Onanong‡
T. Satapanajaru∗∗ Hardiljeet Boparai†† C. Harris‡‡
Daniel D. Snow§ David A. Cassada¶
∗University of Nebraska - Lincoln†University of Nebraska - Lincoln, [email protected]‡University of Nebraska - Lincoln, [email protected]∗∗Kasetsart University††University of Nebraska - Lincoln‡‡Albion College§University of Nebraska at Lincoln, [email protected]¶University of Nebraska at Lincoln, [email protected]
This paper is posted at DigitalCommons@University of Nebraska - Lincoln.
http://digitalcommons.unl.edu/watercenterpubs/15
1803
A former agrichemical dealership in western Nebraska was suspected of having contaminated soil. Our objective was to characterize and remediate the contaminated site by a combined chemical-biological approach. Th is was accomplished by creating contour maps of the on-site contamination, placing the top 60 cm of contaminated soil in windrows and mixing with a mechanical high-speed mixer. Homogenized soil containing both atrazine [6-chloro-N-ethyl-N´-isopropyl-1,3,5-triazine-2,4-diamine] and cyanazine {2-[[4-chloro-6-(ethylamino)-1,3,5-triazin-2-yl] amino]-2-methylpropanenitrile} was then used in laboratory investigations to determine optimum treatments for pesticide destruction. Iron suspension experiments verifi ed that zerovalent iron (Fe0) plus ferrous sulfate (FeSO
4·7H
2O)
removed more than 90% of both atrazine and cyanazine within 14 d. Liquid chromatography/mass spectrometry (LC/MS) analysis of the atrazine solution after treating with Fe0 and ferrous sulfate identifi ed several degradation products commonly associated with biodegradation (i.e., deethlyatrazine (DEA), deisopropylatrazine (DIA), hydroxyatrazine (HA), and ammelines). Biological treatment evaluated emulsifi ed soybean [Glycine max (L.) Merr.] oil (EOS) as a carbon source to stimulate biodegradation in static soil microcosms. Combining emulsifi ed soybean oil with the chemical amendments resulted in higher destruction effi ciencies (80–85%) and reduced the percentage of FeSO
4 needed. Th is chemical-biological treatment (Fe0 + FeSO
4
+ EOS, EOS Remediation, Raleigh, NC) was then applied with water to 275 m3 of contaminated soil in the fi eld. Windrows were tightly covered with clear plastic to increase soil temperature and maintain soil water content. Temporal sampling (0–342 d) revealed atrazine and cyanazine concentrations decreased by 79 to 91%. Th ese results provide evidence that a combined chemical-biological approach can be used for on-site, fi eld-scale treatment of pesticide-contaminated soil.
Field-Scale Cleanup of Atrazine and Cyanazine Contaminated Soil with a Combined
Chemical-Biological Approach
M. Waria, S. D. Comfort,* and S. Onanong University of Nebraska–Lincoln
T. Satapanajaru Kasetsart University
H. Boparai University of Nebraska–Lincoln
C. Harris Albion College
D. D. Snow and D. A. Cassada University of Nebraska–Lincoln
The Environmental Protection Agency (EPA) estimated
that in 1999, the United States had approximately 20,000
agrichemical fi rms that distributed roughly 5 billion pounds of
fertilizers and pesticides (USEPA, 1999, p. 8–20). Given that most
U.S. agriculture is heavily dependent on the use of pesticides and
fertilizers, it is likely that chemical spills and inadvertent discharges
of agrichemicals will continue to occur around farmsteads and
dealerships. Although numerous improvements have been made
in construction of pesticide containment facilities, surveys of
pesticide distributors indicate prevalent soil contamination
(Minnesota Department of Agriculture, 1997). Th ese accidental
releases have the potential to create soil concentrations that are
several orders of magnitude greater than soils receiving agronomic
rates (i.e., labeled rates). High concentrations are problematic
because pesticides that may readily biodegrade at labeled-rate
concentrations may persist at high concentrations due to the
inhibition of microbial activity and low degradation rates (Grant
and Williams, 1982; Gan and Koskinen, 1998). Furthermore, if
soil adsorption sites become saturated (i.e., nonlinear adsorption),
high concentrations can result in lower soil adsorption coeffi cients
and increased transport (i.e, chemical nonequilibrium transport).
Although individual State regulations may vary, pesticide spills are
usually handled in one of the two ways. Th e contaminated soil is ex-
cavated and shipped to a certifi ed landfi ll or the contaminated soil is
reapplied to farmland at labeled rates. When contaminated soils also
contain banned or toxic chemicals, a third option of incineration may
also be considered. None of these approaches treat the contaminated
soil on-site and all are costly and often labor intensive.
Identifying and remediating point-sources of pesticide contami-
nation is a major undertaking. Th e Nebraska Department of Agri-
culture has begun to identify several pesticide-contaminated sites
across Nebraska and is seeking aid in developing remedial protocols
and treatments. In 2005, soil samples obtained from an abandoned
Abbreviations: Fe0, zerovalent iron; HPLC, high performance liquid chromatography;
LC/MS, liquid chromatography/mass spectrometry; MDA, Minnesota Department
of Agriculture.
M. Waria, S.D. Comfort, and H. Boparai, School of Natural Resources, Univ. of Nebraska,
Lincoln, NE 68583-0915; S. Onanong, D.D. Snow, and D.A. Cassada, Water Sciences Lab.,
Univ. of Nebraska, Lincoln, NE 68583-0844; T. Satapanajaru, Dep. of Environmental
Science, Kasetsart Univ., Bangkok, Thailand 10900; C. Harris, Dep. of Chemistry, Albion
College, Albion, MI 49224.
Copyright © 2009 by the American Society of Agronomy, Crop Science
Society of America, and Soil Science Society of America. All rights
reserved. No part of this periodical may be reproduced or transmitted
in any form or by any means, electronic or mechanical, including pho-
tocopying, recording, or any information storage and retrieval system,
without permission in writing from the publisher.
Published in J. Environ. Qual. 38:1803–1811 (2009).
doi:10.2134/jeq2008.0361
Received 12 Aug. 2008.
*Corresponding author ([email protected]).
© ASA, CSSA, SSSA
677 S. Segoe Rd., Madison, WI 53711 USA
TECHNICAL REPORTS: BIOREMEDIATION AND BIODEGRADATION
Copyright © 2009 M. Waria, S. D. Comfort, S. Onanong, T. Satapanajaru, H. Boparai, C. Harris, D. D. Snow, and D. A. Cassada.
1804 Journal of Environmental Quality • Volume 38 • September–October 2009
fertilizer dealership in western NE revealed high concentra-
tions of the herbicides atrazine (~500 mg kg–1) and cyanazine
(~900 mg kg–1). Th e research presented within provides a series
of procedures and experiments undertaken with the goal of re-
mediating the pesticide-contaminated site. Specifi cally, we grid
sampled the contaminated site to spatially delineate the extent
of contamination; conducted laboratory treatability studies to
determine optimum treatments for pesticide destruction using
chemical, biological, and combined approaches; and fi nally, per-
formed a fi eld-scale cleanup of the contaminated site.
Materials and Methods
Pesticide Spill SiteTh e pesticide spill site was a former agrichemical dealership
in western Nebraska. Th is site had been abandoned for several
years with most of the original buildings and storage containers
removed. Historical maps of the agrichemical dealership provided
guidance on where past chemical handling activities occurred and
likely locations for soil contamination. Th e abandoned site was
grid sampled by spacing coordinates 4.57 m apart and covering a
20 by 40 m area. Soil samples were taken at coordinate intersec-
tions except where physical structures (e.g., buildings, pavement,
or foundations) prevented sampling. Two soil samples were taken
per coordinate (one from 0–30 cm and one from 30–60 cm).
Each soil sample was placed in a Whirl-Pak plastic bag (Nasco,
Modesto, CA) and stored in coolers until transported back to the
laboratory where they were held at 4°C until analysis (24–72 h).
Soil samples were passed through a 2-mm screen and a sub-
set sent to Midwest Laboratories (Omaha, NE) for pesticide
screening. In brief, the pesticide screening analysis followed
the Minnesota Department of Agriculture’s standard operat-
ing procedures (SOP) 26c (Extraction of Neutral Extractable
Pesticides from Soil) where soil extracts were concentrated to 5
mL in 60/40 (v/v) isooctane/toluene and quantitative analysis
of pesticides done by gas chromatography following SOP 27d
(Chromatography and Quality Control for Neutral Extractable
Pesticides in Water; Minnesota Department of Agriculture,
1997), referred to USEPA Method 507. Results from the pes-
ticide screening showed that the two major pesticides present
in the contaminated soil were atrazine and cyanazine. All soil
samples obtained by grid sampling were subsequently analyzed
for atrazine and cyanazine by high-performance liquid chro-
matography (HPLC) (methodologies given below).
Atrazine and cyanazine concentrations along with grid co-
ordinates were entered into graphical software (SigmaPlot, Sys-
tat Software, San Jose, CA) to generate contour plots of soil
contamination. A front-end loader was then used to remove
and place the contaminated soil into two windrows (North and
South) on top of a 15 cm bed of sand. Th e area from which
the soil was removed was resampled to verify the removal of
contamination. Additional soil removal was required in some
areas and resulted in the total soil volume of 275 m3 (360 yd3).
Both windrows were triangular in shape and approximately 3
m wide by 1.5 m high. Lengths of the windrows were 67 m for
the North and 50 m for the South.
Soil in both windrows (North and South) was mixed three
times within 24 h by using a tractor-pulled high speed mix-
ing and fractionation implement (Frontier Industrial Corp.,
Salem, OR), sold under the trade name Microenfractionator
(H&H Ecosystems, North Bonneville, WA). Th is implement
is similar in appearance to a conventional composter but diff ers
in that its components have been augmented and redesigned
to handle windrows containing 100% soil. Soil mixing is fa-
cilitated by a John Deere (Moline, IL) 6068T 170-horsepower
diesel engine that propels a large 32-cm (diam.) stainless steel
rotating drum with 50 fan-knife blades (30.8-cm length). Th is
implement also allows simultaneous injection of liquids into
the mixing tunnel via pressurized lines connected to a mobile
holding tank, which is pulled behind the Microenfractionator.
Once the soil was mixed, a sample of the contaminated soil was
taken back to the laboratory and used in treatability studies.
Pesticide Solution- Iron Suspension ExperimentsAqueous solutions of atrazine and cyanazine were prepared in
deionized water using commercial standards with the following
purities: atrazine, 98%; cyanazine, 99.5% (Chem Service, West
Chester, PA). Batch experiments were conducted in 125-mL Er-
lenmeyer fl asks fi lled with 100 mL of either atrazine (20 mg L–1)
and cyanazine (20 mg L–1) solutions. All fl asks were covered with
Parafi lm M (Pechiney Plastic Packaging, Chicago, IL) and agi-
tated on a reciprocating shaker at ambient temperature (23°C).
We fi rst quantifi ed the ability of three commercial zerova-
lent iron sources to degrade atrazine and cyanazine in aqueous
solutions. Th e three iron sources were obtained from Peerless
Metal Powders (Detroit, MI) and designated as (i) unannealed
iron; (ii) iron aggregate 60D; and (iii) SP4. Each iron source
was evaluated (n = 3) by adding 2.5 g to 100 mL of pesticide
solutions (atrazine and cyanazine, 20 mg L–1). At 0, 6, 12, 24,
48, 96, 120, and 144 h, 1.5-mL aliquots were removed and
transferred to 1.7-mL polypropylene microcentrifuge tubes,
centrifuged at 13,000 × g for 10 min, and analyzed by HPLC
for atrazine and cyanazine.
Additional experiments further evaluated Iron Aggregate
60D (2.5 g) to degrade atrazine and cyanazine (100 mL,
20 mg L–1) with and without 1 g of commercial-grade
FeSO4·7H
2O. Each treatment (including control) was repli-
cated three times. At 0, 2, 4, 6, 10, 24, 48, 72, 120, and 144 h,
1.5-mL aliquots were removed and transferred to 1.7-mL poly-
propylene microcentrifuge tubes, centrifuged at 13,000 × g for
10 min, and analyzed by HPLC for atrazine and cyanazine.
Liquid Chromatography/Mass Spectrometry of
Degradation ProductsSelected aliquots from the atrazine solution experiment (Fe0
+ FeSO4) were analyzed by LC/MS to identify possible degrada-
tion products. Transformation products were confi rmed by LC/
MS using standards under the same conditions but we did not
quantify changes in concentrations of the degradation products.
Atrazine products were characterized on a Finnigan LCQ ion
trap mass spectrometer (Th ermo Sci., Waltham, MA) with chro-
Waria et al.: Cleanup of Atrazine and Cyanazine Contaminated Soil 1805
matographic separation on a Waters 2695 HPLC (Waters Corp.,
Milford, MA) and a Phenomenex Luna 5μ C8(2) 2.1 × 200 mm
column held at 31°C. Mobile phase was a 90:10 ratio of 0.1%
(v/v) ammonium formate in water and 10% (v/v) methanol for
the fi rst 2 min, followed by a 16 min gradient to a 20:80 mobile
phase ratio, held for 2 min, then returned to a 90:10 ratio for the
remainder of the run (8 min). Th e fl ow rate was 0.2 mL min–1
and sample injection volume was 25 μL. Data was collected in
full scan positive ion mode from a mass range of 80 to 400 amu.
Electrospray ionization source tuning was optimized using hy-
droxyatrazine. Ion source parameters were: sheath gas fl ow, 75
(arbitrary units); auxiliary gas fl ow, 15 (arbitrary units); spray
voltage, 4.5 kV; heated capillary temperature, 150°C; capillary
voltage, 25 V and tube lens voltage, 7.0 V.
Soil Microcosm ExperimentsSolution experiments confi rmed that atrazine and cyanazine
were degraded by Fe0 + FeSO4. Soil incubation studies involved
using the same chemical treatment as the solution experiment
(Fe0 + FeSO4), a biological treatment, and a combined ap-
proach. Biological treatment involved adding emulsifi ed soy-
bean oil (EOS, Raleigh, NC) as a C source to promote come-
tabolism of the pesticide.
Soil incubations were performed with 20 g soil (air-dry
soil) in 40-mL Tefl on tubes. Soils used in all treatability stud-
ies came from the contaminated site. Given that for fi eld-scale
treatment, this soil would be excavated and mixed with lower
subsoil, we also mixed the surface samples with subsoil to get
lower and more uniform concentrations (~20 to 30 mg kg–1 for
both atrazine and cyanazine).
For the biological treatment, we used EOS 598B42, which
also contained a vitamin B12
supplement. To determine what
concentration of soybean oil to add to the soil, screening exper-
iments were performed that varied soybean oil concentration.
Results led us to dilute the EOS product 100-fold with water
(1%, v/v) and shake overnight. We then added 6 mL of the
oil-water suspension to 20 g of soil and incubated at 30°C. Soil
water content was maintained between 0.30 to 0.35 kg kg–1
during the 21 d experiment. Temporal sampling of atrazine
concentration occurred by sacrifi cial sampling of the micro-
cosms by extracting with CH3CN.
To evaluate the combined chemical and biological treatment,
treatments included (i) Fe0 (ii) Fe0 + FeSO4 (iii) Fe0 + FeSO
4 +
EOS Oil (598B42). When included as a treatment component,
the amount of amendments added to the 20 g of soil included:
(i) 0.5 g Fe0; (ii) 0.2 g FeSO4·7H
2O; and (iii) 6 mL EOS 598B42
oil (1%, v/v). Microcosms were incubated at 30°C and soil water
content maintained between 0.30 and 0.35 kg kg–1 for 60 d.
Temporal samplings occurred by extracting the microcosms with
20 mL of CH3CN for analysis of extractable atrazine and cy-
anazine by HPLC (procedure described in soil analysis below).
Field ExperimentBefore and after treatment, fi ve to six soil samples were
taken from the east side of the windrows every 3 m, mixed
in a bucket and transferred to a Whirl-Pak bag. Samples were
placed in an insulated cooler, transported back to laboratory
and stored at 4°C until analysis. Each sample was then analyzed
for atrazine and cyanazine and average pesticide concentrations
per windrow were calculated.
After the fi rst sampling (T = 0 d), the combined chemical-
biological treatment (Fe0 + FeSO4·7H
2O + EOS 598B42) was
applied to both the North and South windrows. Th e logistics
of treating the contaminated soil at this particular site did not
allow us to leave one windrow as an untreated control. Th us,
the role of natural attenuation vs. abiotic degradation (from
the chemical treatment) cannot be diff erentiated from the fi eld
data. In a previous study, where a control was used (Comfort et
al., 2001), signifi cant diff erences between the abiotic treatment
and the control were observed.
Iron (Fe0) and FeSO4 were added as percentage of the oven-
dry soil mass, which was estimated by multiplying the volume of
each windrow times a soil bulk density of 1.4 g cm–3. Th e iron
was added at 2.5% (w/w) and FeSO4·7H
2O at 1% (w/w). Th e
emulsifi ed oil was applied by mixing the concentrated product
with water and spraying the liquid into the mixing chamber dur-
ing soil mixing. Expressing the chemical amendments in units of
mass of chemical added per cubic yard (1 yard = 0.765 m3) of
soil (1070 kg or 2360 lb, assuming 1.4 g cm–3 bulk density), our
treatment rates were equivalent to 24.99 kg (55.55 lb) of Fe0,
9.99 kg (22.22 lb) of FeSO4·7H
2O and 2.87 L (0.76 gal) of EOS
598B42 per 0.765 m3 (1.0 yd3) of contaminated soil.
Th e Fe0 and and FeSO4·7H
2O (in 22.6 kg bags) were placed
on the top of the windrows and directly mixed into the con-
taminated soil by the soil mixer a minimum of three times.
Water and EOS 598B42 oil were mixed together in 3790 L
(1000 gallon) tanks and added during the mixing process until
the soil gravimetric water content reached between 0.35 and
0.40 kg kg–1, which was determined on site by weight loss fol-
lowing repeated cycles of heating subsamples of soil from the
windrows in a microwave oven.
Once desired water content was achieved, the windrows
were tightly covered with clear plastic sheeting that was held
in place with sand placed along the periphery of the windrows.
Temporal changes in volumetric soil water content were mea-
sured by ML2 type probes with a handheld HH2 reader (Del-
ta-T Devices, Ltd, Cambridge, UK). Probes were inserted into
the windrows at approximately 60 cm depth and spaced 12 to
18 m apart. Four probes were placed in both the North and
South windrows. Soil temperature was measured with a bimet-
al thermometer that had a stem length of 60.96 cm (Cole Par-
mer, Vernon Hills, IL). Th e tip of the thermometer was placed
at three depths: 15, 30, and 45 cm and temperature readings
taken at six locations on the South windrow and eight locations
on the North windrow approximately every 3 to 9 m.
Windrows were sampled for temporal changes in pesticide
concentrations at 7, 14, 21, 30, 60, 250, 270, 315 d. Soil wind-
rows were sampled approximately every 3 m by cutting a slit
into the plastic covering midway up the side of the windrow,
removing three to fi ve soil cores with a hand-held auger, com-
bining the samples into a bucket and placing the composite
sample into a plastic bag. Plastic sheeting was resealed after
1806 Journal of Environmental Quality • Volume 38 • September–October 2009
sampling to avoid soil water loss. After the 315 d sampling,
all plastic covering was removed from the windrows and soil
remixed with the soil mixer and the soil was again sampled for
pesticide concentration at 342 d.
Soil AnalysisSoil samples obtained from the windrows were inventoried
and stored at 4°C until analysis. For each sample, soil water
content, pH, atrazine, and cyanazine concentrations were de-
termined. Soil water content was determined on ~10-g sub-
samples by quantifying weight loss after drying in a microwave
oven. Soil pH was determined on 20-g soil samples (oven dry
basis) using a 1:2 soil to water ratio.
Atrazine and cyanazine concentrations were determined in
soil microcosm experiments and from the fi eld experiment by
extracting 20 g of soil in a 40-mL Tefl on centrifuge tube with
20 mL CH3CN and shaking overnight (≥8 h) on a reciprocating
shaker at ambient temperature (20–25°C). Th e tubes were then
centrifuged at 5000 × g for 10 min. After centrifuging, 1 mL
of the supernatant was stored in a glass HPLC vial at 4°C until
analysis. Changes in acetonitrile-extractable concentrations were
used to gauge the eff ectiveness of the remedial treatments.
Atrazine, cyanazine, and products were measured by HPLC
by injecting 20 μL of aqueous or CH3CN extract into a Hy-
persil gold column (250 × 4.6 mm) (Th ermo Electron Corpo-
ration, Waltham, MA) connected to Shimadzu (Kyoto, Japan)
photodiode array detector with quantifi cation at 220 nm. Peak
areas were integrated and compared to certifi ed standards. Th e
mobile phase was 50:50 acetonitrile and water at a fl ow rate of
1.0 mL min–1. Under these conditions typical retention time
were 6 min for atrazine and 4 min for cyanazine.
Standard soil nutrient analysis and metal analyses (Table 1)
were conducted by Midwest Analytical Laboratories (Omaha,
NE) on initial (t = 0 d) and fi nal (t = 342 d) samples.
Results and Discussion
Pesticide Solution- Iron Suspension ExperimentsA comparison of atrazine and cyanazine destruction by the
three iron sources showed that Iron Aggregate 60D was superior
in transforming the pesticides. Using only 2.5 g of Fe0 per 100
mL, Iron Aggregate 60D resulted in nearly 50% removal of atra-
zine whereas reaction with the Unannealed and SP4 iron only
removed around 20% (Fig. 1A). Similarily, 40% of cyanazine
was converted with Iron Aggregate 60D as compared to 15%
with Unannealed iron and 15% with SP4 iron (Fig. 1B). When
higher iron loading rates were used (i.e., 5 g per 100 mL) about
80% of the atrazine was removed (data not shown). Subsequent
extraction of the iron with CH3CN showed no residual bound
atrazine. Th e lack of extractable parent compound from the iron
combined with the production of degradation products (see LC/
MS results) indicates that loss of atrazine and cyanazine from
solution were likely due to transformation and not adsorption.
However, adsorption of atrazine or cyanazine transformation
products and co-precipitation are also possible removal mech-
anisms. Co-precipitation has been documented to occur with
heavy metals and natural and dissolved organic matter (Crawford
et al., 1993; Gu et al., 1994; Satoh et al., 2006). Moreover, Singh
et al. (1988b) using 14C-atrazine and a diff erent iron source than
used in these experiments showed that nonextractable residues
of atrazine could form on exposure to iron. From a remediation
standpoint, forming unextractable residue to the iron surface
could also be viewed as an acceptable endpoint.
Previous research has demonstrated iron source (i.e., compo-
sition) and surface area can greatly impact destruction effi cien-
cies. Chromium (VI) reduction (Powell et al., 1995; Blowes et
al., 1997; Alowitz and Scherer, 2002) as well as RDX and TNT
destruction (Singh et al., 1998a; Park et al., 2004) were found
to vary signifi cantly depending on the characteristics of the iron
source. Th e herbicide metolachlor was also found to more ef-
fi ciently transform by annealed rather than unannealed iron,
which was in part explained by diff erences in surface area (Satap-
anajaru et al., 2003a). Th e surface area of the iron sources used in
this study were measured by gas adsorption with the Brunauer,
Emmet, and Teller theory and determined to be 3.85 m2 kg–1 for
Iron Aggregate 60D, 2.89 m2 kg–1 for the Unannealed iron, and
0.15 m2 kg–1 for the SP4 iron (Micromeritics, Norcross, GA).
Although Iron Aggregate 60D had the highest surface area and
was the most effi cient in transforming the pesticides, similar de-
struction effi ciencies between Unannealed iron and SP4 (Fig. 1)
(which diff ered in surface areas), indicate iron composition was
also a factor.
As previously demonstrated with other pesticides such as me-
tolachlor (Satapanajaru et al., 2003a) and dicamba (Gibb et al.,
2004), the addition of a salt to the Fe0–pesticide matrix signifi -
cantly increased atrazine and cyanazine destruction. While Fe0
alone transformed approximately 40% of the atrazine, adding
FeSO4 increased pesticide loss to more than 90% within 6 d
(Fig. 2). A comparison of pesticides (Fig. 2A vs. 2B) showed that
atrazine was slightly more reactive than cyanazine. Our results
are consistent with previous reports of salt amendments mak-
Table 1. Soil chemical-physical properties before and after chemical- biological treatment.
Soil property UnitInitial
(T = 0 d)Final
(T = 342 d)
Phosphorus (weak Bray) mg kg–1 810 (95.9)† 20 (2.0)
Nitrate-N mg kg–1 1836 (93.6) 496 (156)
Ammonium N mg kg–1 772 (113) 361 (54)
Organic matter % 5 (0.3) 4 (0.4)
Cation exchange capacity cmolc kg–1 30 (1.8) 20 (4.8)
Chloride mg kg–1 62 (2.0) 47 (12)
Sulfur mg kg–1 627 (40.1) 999 (0)
Iron (DTPA) mg kg–1 38 (4.6) 143 (11)
Zinc (DTPA) mg kg–1 66 (7.3) 33 (6.5)
Manganese (DTPA) mg kg–1 32 (2.9) 65 (2.0)
Copper (DTPA) mg kg–1 6 (0.8) 15 (0.9)
Boron mg kg–1 2 (0.2) 2 (0.2)
Aluminum mg kg–1 4 (2.0) 1 (0)
pH 5 (0.1) 6 (0.4)
Sand % 75 (3.1) 78 (2.0)
Silt % 15 (4.2) 12 (8.7)
Clay % 9 (1.2) 10 (6.9)
† Parenthetic values represent sample standard deviation (n = 3).
Waria et al.: Cleanup of Atrazine and Cyanazine Contaminated Soil 1807
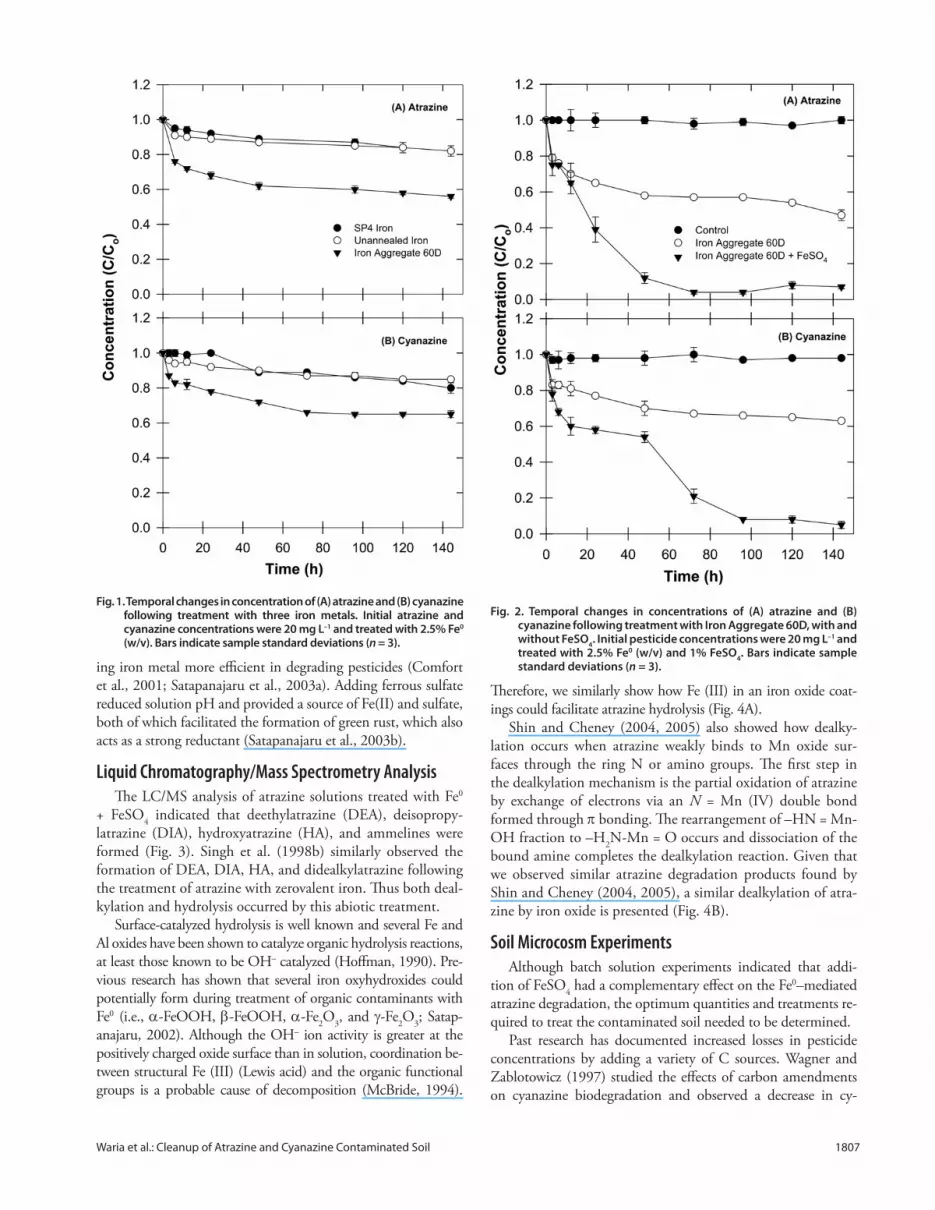
ing iron metal more effi cient in degrading pesticides (Comfort
et al., 2001; Satapanajaru et al., 2003a). Adding ferrous sulfate
reduced solution pH and provided a source of Fe(II) and sulfate,
both of which facilitated the formation of green rust, which also
acts as a strong reductant (Satapanajaru et al., 2003b).
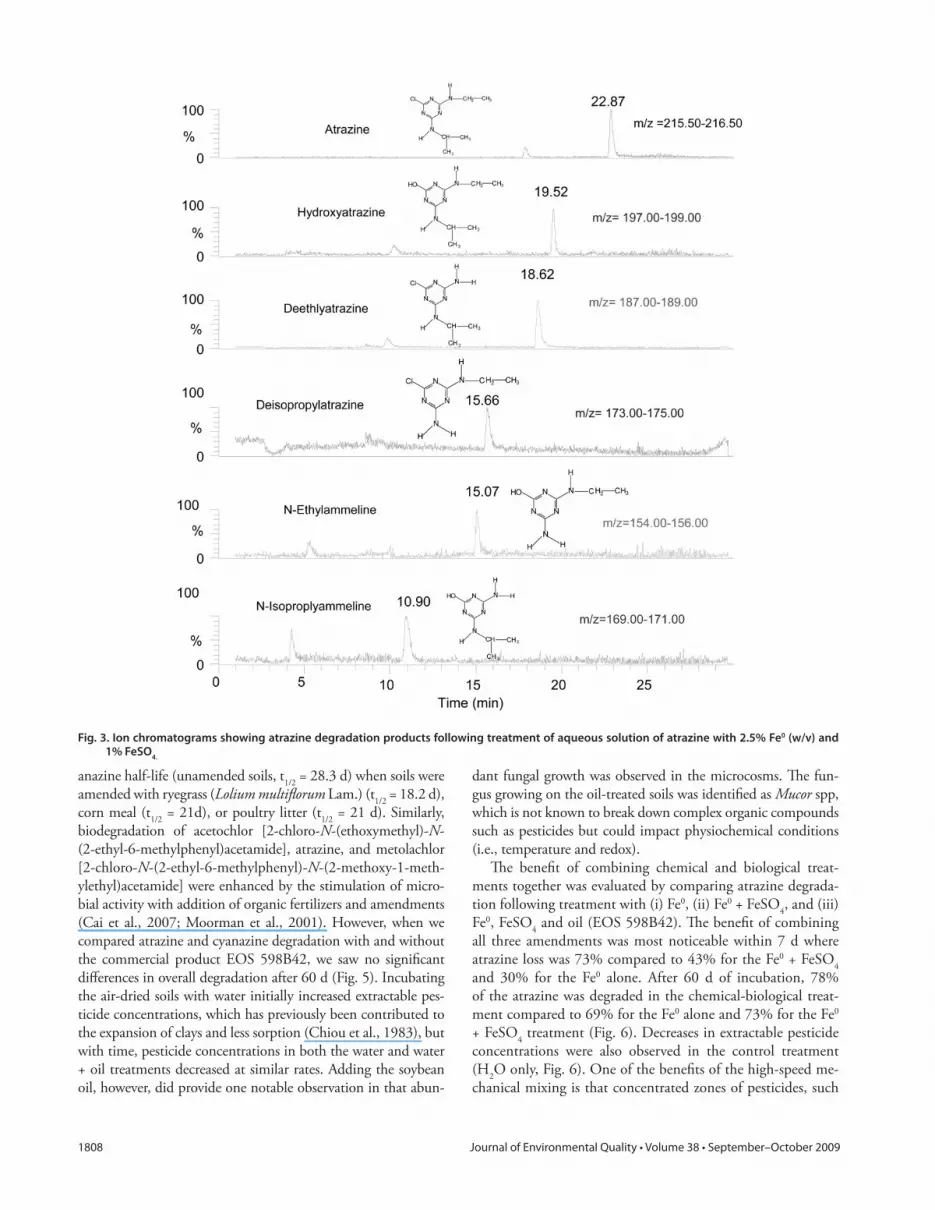
Liquid Chromatography/Mass Spectrometry AnalysisTh e LC/MS analysis of atrazine solutions treated with Fe0
+ FeSO4 indicated that deethylatrazine (DEA), deisopropy-
latrazine (DIA), hydroxyatrazine (HA), and ammelines were
formed (Fig. 3). Singh et al. (1998b) similarly observed the
formation of DEA, DIA, HA, and didealkylatrazine following
the treatment of atrazine with zerovalent iron. Th us both deal-
kylation and hydrolysis occurred by this abiotic treatment.
Surface-catalyzed hydrolysis is well known and several Fe and
Al oxides have been shown to catalyze organic hydrolysis reactions,
at least those known to be OH– catalyzed (Hoff man, 1990). Pre-
vious research has shown that several iron oxyhydroxides could
potentially form during treatment of organic contaminants with
Fe0 (i.e., α-FeOOH, β-FeOOH, α-Fe2O
3, and γ-Fe
2O
3; Satap-
anajaru, 2002). Although the OH– ion activity is greater at the
positively charged oxide surface than in solution, coordination be-
tween structural Fe (III) (Lewis acid) and the organic functional
groups is a probable cause of decomposition (McBride, 1994).
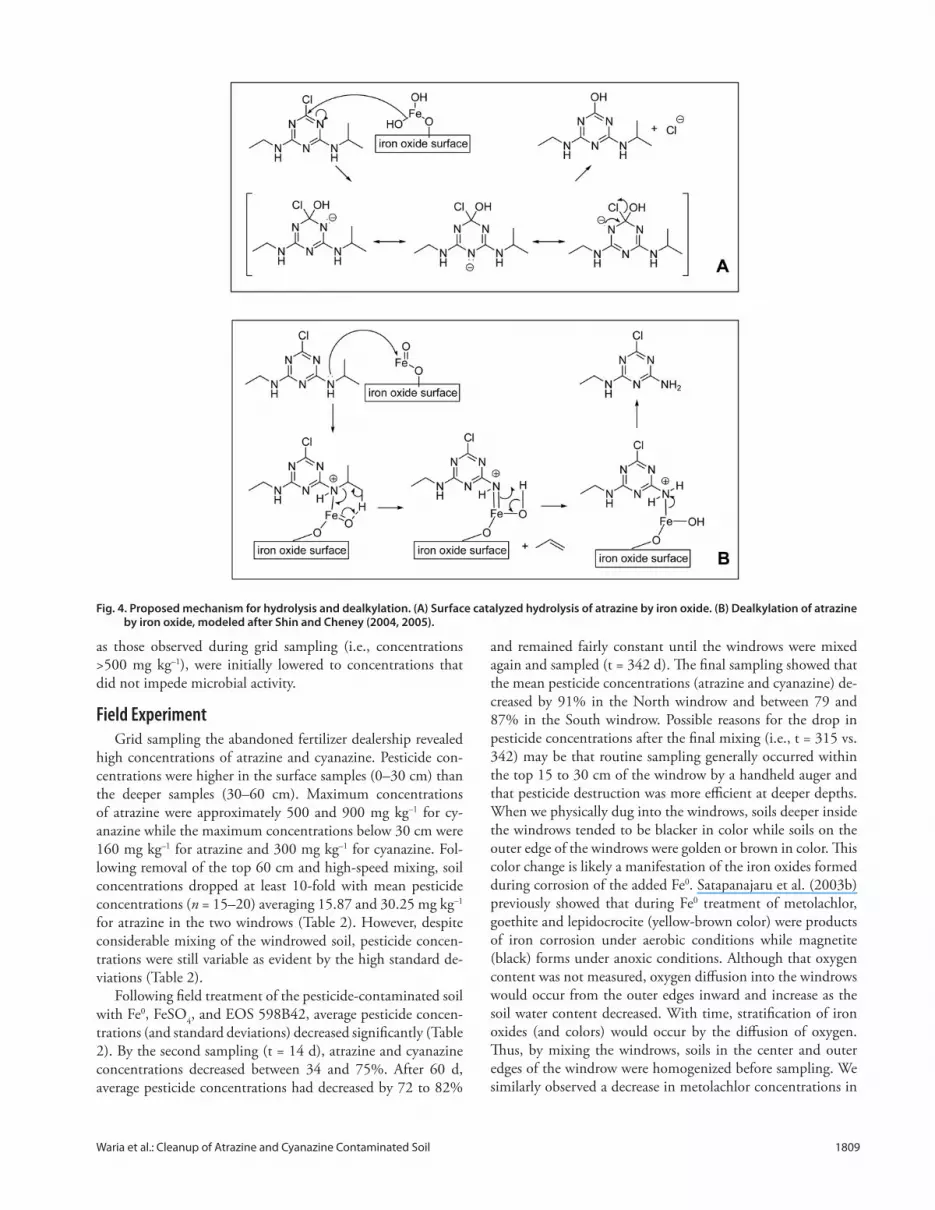
Th erefore, we similarly show how Fe (III) in an iron oxide coat-
ings could facilitate atrazine hydrolysis (Fig. 4A).
Shin and Cheney (2004, 2005) also showed how dealky-
lation occurs when atrazine weakly binds to Mn oxide sur-
faces through the ring N or amino groups. Th e fi rst step in
the dealkylation mechanism is the partial oxidation of atrazine
by exchange of electrons via an N = Mn (IV) double bond
formed through π bonding. Th e rearrangement of –HN = Mn-
OH fraction to –H2N-Mn = O occurs and dissociation of the
bound amine completes the dealkylation reaction. Given that
we observed similar atrazine degradation products found by
Shin and Cheney (2004, 2005), a similar dealkylation of atra-
zine by iron oxide is presented (Fig. 4B).
Soil Microcosm ExperimentsAlthough batch solution experiments indicated that addi-
tion of FeSO4 had a complementary eff ect on the Fe0–mediated
atrazine degradation, the optimum quantities and treatments re-
quired to treat the contaminated soil needed to be determined.
Past research has documented increased losses in pesticide
concentrations by adding a variety of C sources. Wagner and
Zablotowicz (1997) studied the eff ects of carbon amendments
on cyanazine biodegradation and observed a decrease in cy-
Fig. 1. Temporal changes in concentration of (A) atrazine and (B) cyanazine following treatment with three iron metals. Initial atrazine and cyanazine concentrations were 20 mg L–1 and treated with 2.5% Fe0 (w/v). Bars indicate sample standard deviations (n = 3).
Fig. 2. Temporal changes in concentrations of (A) atrazine and (B) cyanazine following treatment with Iron Aggregate 60D, with and without FeSO
4. Initial pesticide concentrations were 20 mg L–1 and
treated with 2.5% Fe0 (w/v) and 1% FeSO4. Bars indicate sample
standard deviations (n = 3).
1808 Journal of Environmental Quality • Volume 38 • September–October 2009
anazine half-life (unamended soils, t1/2
= 28.3 d) when soils were
amended with ryegrass (Lolium multifl orum Lam.) (t1/2
= 18.2 d),
corn meal (t1/2
= 21d), or poultry litter (t1/2
= 21 d). Similarly,
biodegradation of acetochlor [2-chloro-N-(ethoxymethyl)-N-
(2-ethyl-6-methylphenyl)acetamide], atrazine, and metolachlor
[2-chloro-N-(2-ethyl-6-methylphenyl)-N-(2-methoxy-1-meth-
ylethyl)acetamide] were enhanced by the stimulation of micro-
bial activity with addition of organic fertilizers and amendments
(Cai et al., 2007; Moorman et al., 2001). However, when we
compared atrazine and cyanazine degradation with and without
the commercial product EOS 598B42, we saw no signifi cant
diff erences in overall degradation after 60 d (Fig. 5). Incubating
the air-dried soils with water initially increased extractable pes-
ticide concentrations, which has previously been contributed to
the expansion of clays and less sorption (Chiou et al., 1983), but
with time, pesticide concentrations in both the water and water
+ oil treatments decreased at similar rates. Adding the soybean
oil, however, did provide one notable observation in that abun-
dant fungal growth was observed in the microcosms. Th e fun-
gus growing on the oil-treated soils was identifi ed as Mucor spp,
which is not known to break down complex organic compounds
such as pesticides but could impact physiochemical conditions
(i.e., temperature and redox).
Th e benefi t of combining chemical and biological treat-
ments together was evaluated by comparing atrazine degrada-
tion following treatment with (i) Fe0, (ii) Fe0 + FeSO4, and (iii)
Fe0, FeSO4 and oil (EOS 598B42). Th e benefi t of combining
all three amendments was most noticeable within 7 d where
atrazine loss was 73% compared to 43% for the Fe0 + FeSO4
and 30% for the Fe0 alone. After 60 d of incubation, 78%
of the atrazine was degraded in the chemical-biological treat-
ment compared to 69% for the Fe0 alone and 73% for the Fe0
+ FeSO4 treatment (Fig. 6). Decreases in extractable pesticide
concentrations were also observed in the control treatment
(H2O only, Fig. 6). One of the benefi ts of the high-speed me-
chanical mixing is that concentrated zones of pesticides, such
Fig. 3. Ion chromatograms showing atrazine degradation products following treatment of aqueous solution of atrazine with 2.5% Fe0 (w/v) and 1% FeSO
4.
Waria et al.: Cleanup of Atrazine and Cyanazine Contaminated Soil 1809
as those observed during grid sampling (i.e., concentrations
>500 mg kg–1), were initially lowered to concentrations that
did not impede microbial activity.
Field ExperimentGrid sampling the abandoned fertilizer dealership revealed
high concentrations of atrazine and cyanazine. Pesticide con-
centrations were higher in the surface samples (0–30 cm) than
the deeper samples (30–60 cm). Maximum concentrations
of atrazine were approximately 500 and 900 mg kg–1 for cy-
anazine while the maximum concentrations below 30 cm were
160 mg kg–1 for atrazine and 300 mg kg–1 for cyanazine. Fol-
lowing removal of the top 60 cm and high-speed mixing, soil
concentrations dropped at least 10-fold with mean pesticide
concentrations (n = 15–20) averaging 15.87 and 30.25 mg kg–1
for atrazine in the two windrows (Table 2). However, despite
considerable mixing of the windrowed soil, pesticide concen-
trations were still variable as evident by the high standard de-
viations (Table 2).
Following fi eld treatment of the pesticide-contaminated soil
with Fe0, FeSO4, and EOS 598B42, average pesticide concen-
trations (and standard deviations) decreased signifi cantly (Table
2). By the second sampling (t = 14 d), atrazine and cyanazine
concentrations decreased between 34 and 75%. After 60 d,
average pesticide concentrations had decreased by 72 to 82%
and remained fairly constant until the windrows were mixed
again and sampled (t = 342 d). Th e fi nal sampling showed that
the mean pesticide concentrations (atrazine and cyanazine) de-
creased by 91% in the North windrow and between 79 and
87% in the South windrow. Possible reasons for the drop in
pesticide concentrations after the fi nal mixing (i.e., t = 315 vs.
342) may be that routine sampling generally occurred within
the top 15 to 30 cm of the windrow by a handheld auger and
that pesticide destruction was more effi cient at deeper depths.
When we physically dug into the windrows, soils deeper inside
the windrows tended to be blacker in color while soils on the
outer edge of the windrows were golden or brown in color. Th is
color change is likely a manifestation of the iron oxides formed
during corrosion of the added Fe0. Satapanajaru et al. (2003b)
previously showed that during Fe0 treatment of metolachlor,
goethite and lepidocrocite (yellow-brown color) were products
of iron corrosion under aerobic conditions while magnetite
(black) forms under anoxic conditions. Although that oxygen
content was not measured, oxygen diff usion into the windrows
would occur from the outer edges inward and increase as the
soil water content decreased. With time, stratifi cation of iron
oxides (and colors) would occur by the diff usion of oxygen.
Th us, by mixing the windrows, soils in the center and outer
edges of the windrow were homogenized before sampling. We
similarly observed a decrease in metolachlor concentrations in
Fig. 4. Proposed mechanism for hydrolysis and dealkylation. (A) Surface catalyzed hydrolysis of atrazine by iron oxide. (B) Dealkylation of atrazine by iron oxide, modeled after Shin and Cheney (2004, 2005).
1810 Journal of Environmental Quality • Volume 38 • September–October 2009
a previous fi eld remediation study following the fi nal mixing
of the windrows (Comfort et al., 2001). Results from tempo-
ral sampling indicate that our chemical-biological treatment of
the pesticide-contaminated soil was eff ective in reducing the
pesticide concentrations but given that we could not include
an untreated windrow at this particular site, we also acknowl-
edge that natural attenuation may have also contributed to the
reduction in pesticide concentrations.
Changes in Soil Physical and Chemical PropertiesAverage soil water content during the fi rst 60 d was 0.40
cm–3 cm–3 in the North and 0.34 cm–3 cm–3 in the South wind-
row. Even after several months (t = 270 d), the soil water con-
tent was 0.20 cm–3 cm–3 in the North and 0.15 cm–3 cm–3 in
the South. Issa and Wood (2005) observed that atrazine and
isoproturon degraded more rapidly in soils with 90% of fi eld
capacity (optimum) than in samples with higher moisture con-
tents. Diff erences in soil water content between windrows kept
the North windrow slightly cooler throughout the experiment.
Within 5 d after treatment, soil temperatures had reached
34.1°C (45 cm depth) in the North windrow and 38.2°C in
the South windrow. Th ese soil temperatures were consistently
10 to 15°C higher than the daytime air temperature. Moreover,
sampling temperature with depth (15, 30, and 45 cm) revealed
temperatures were consistently higher at the deeper depths
for the fi rst 30 d. Th is indicates that solar radiation through
the clear plastic was not the only source of heat. Rather, the
emulsifi ed oil provided a readily utilizable carbon source that
not only generated heat through heterotrophic respiration but
also likely facilitated reductive transformations by providing an
additional oxygen demand, which was confi rmed by the ob-
served stratifi cation of soil colors (i.e., iron oxides) with depth.
Finally, as observed in the laboratory microcosms experiments,
abundant fungal growth was observed under the clear plastic
throughout the fi eld experiment.
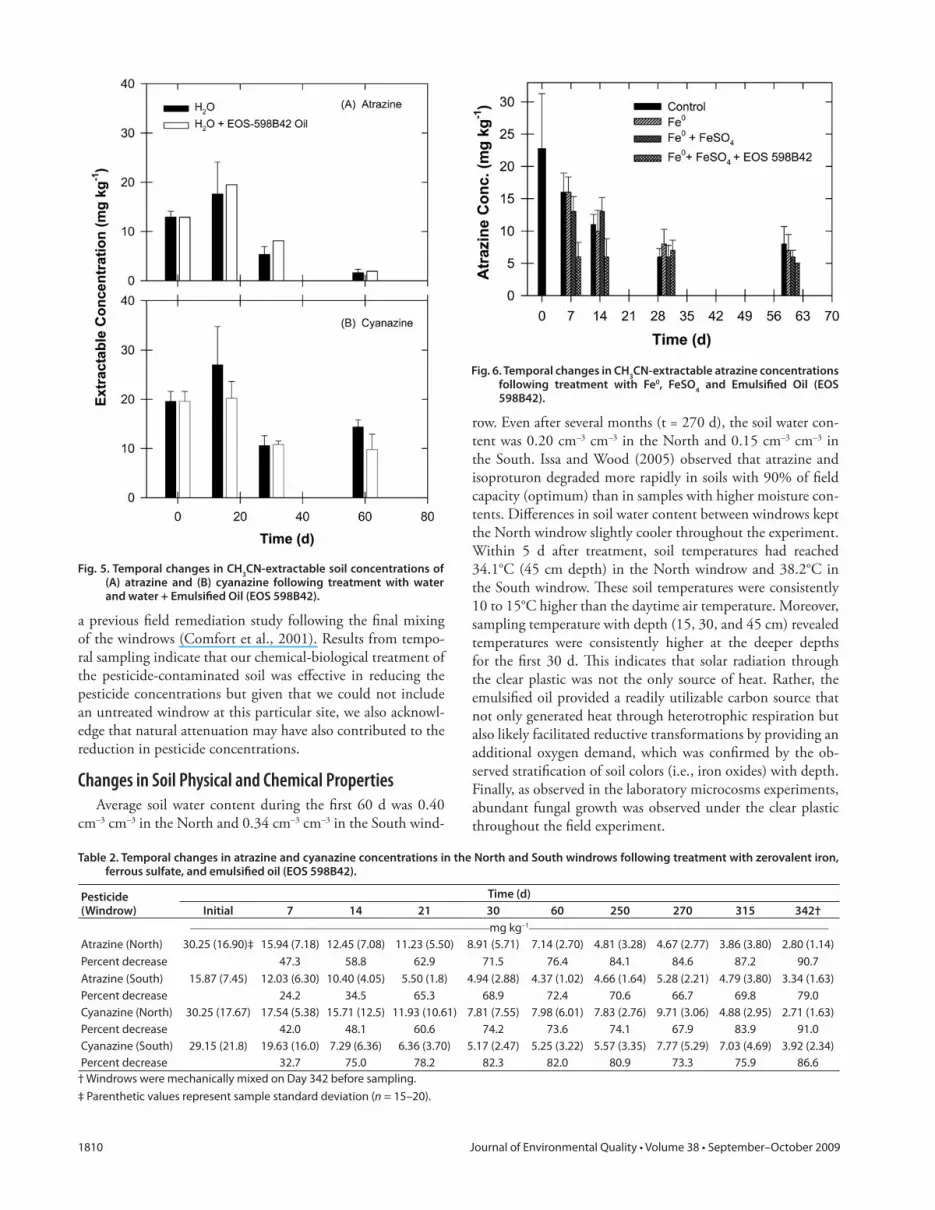
Fig. 5. Temporal changes in CH3CN-extractable soil concentrations of
(A) atrazine and (B) cyanazine following treatment with water and water + Emulsifi ed Oil (EOS 598B42).
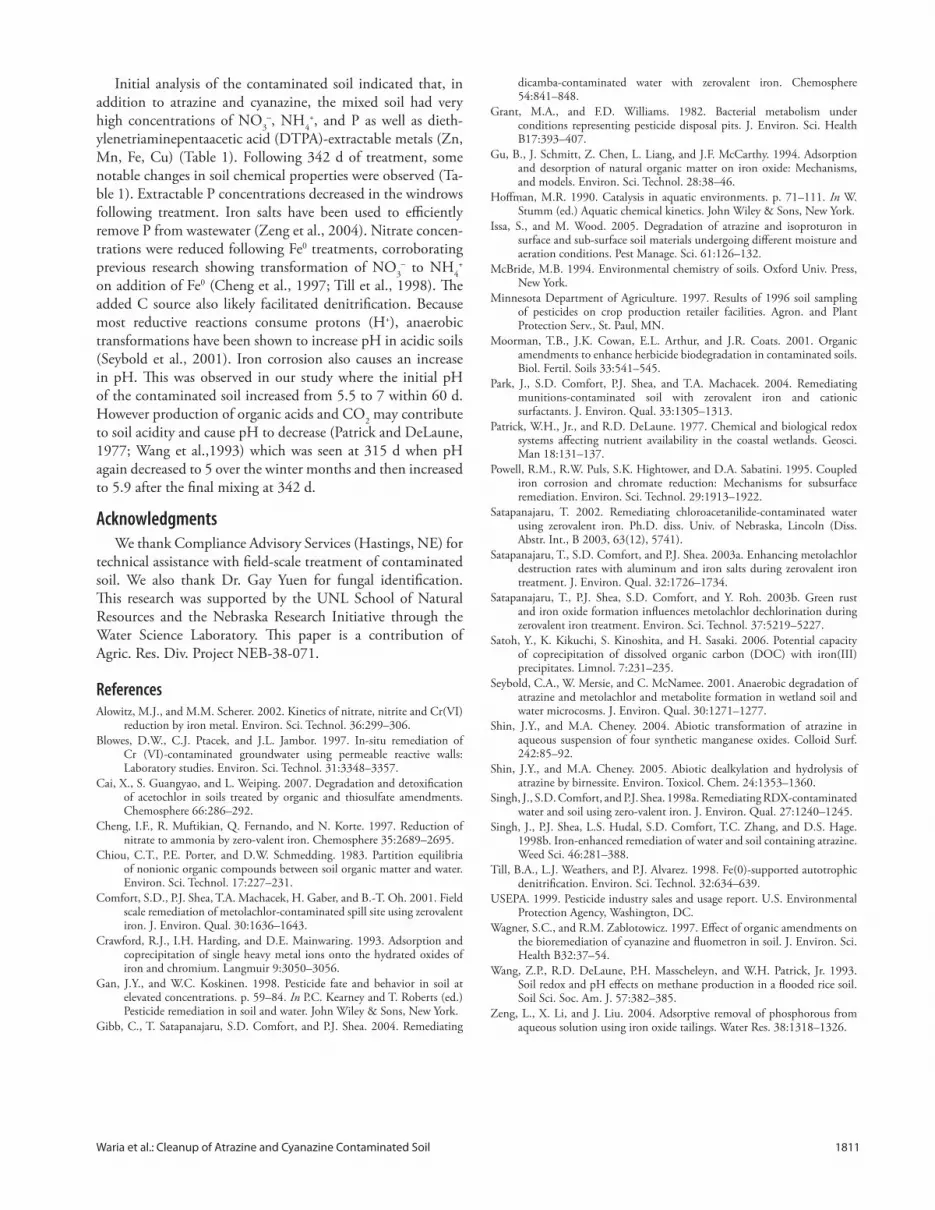
Fig. 6. Temporal changes in CH3CN-extractable atrazine concentrations
following treatment with Fe0, FeSO4 and Emulsifi ed Oil (EOS
598B42).
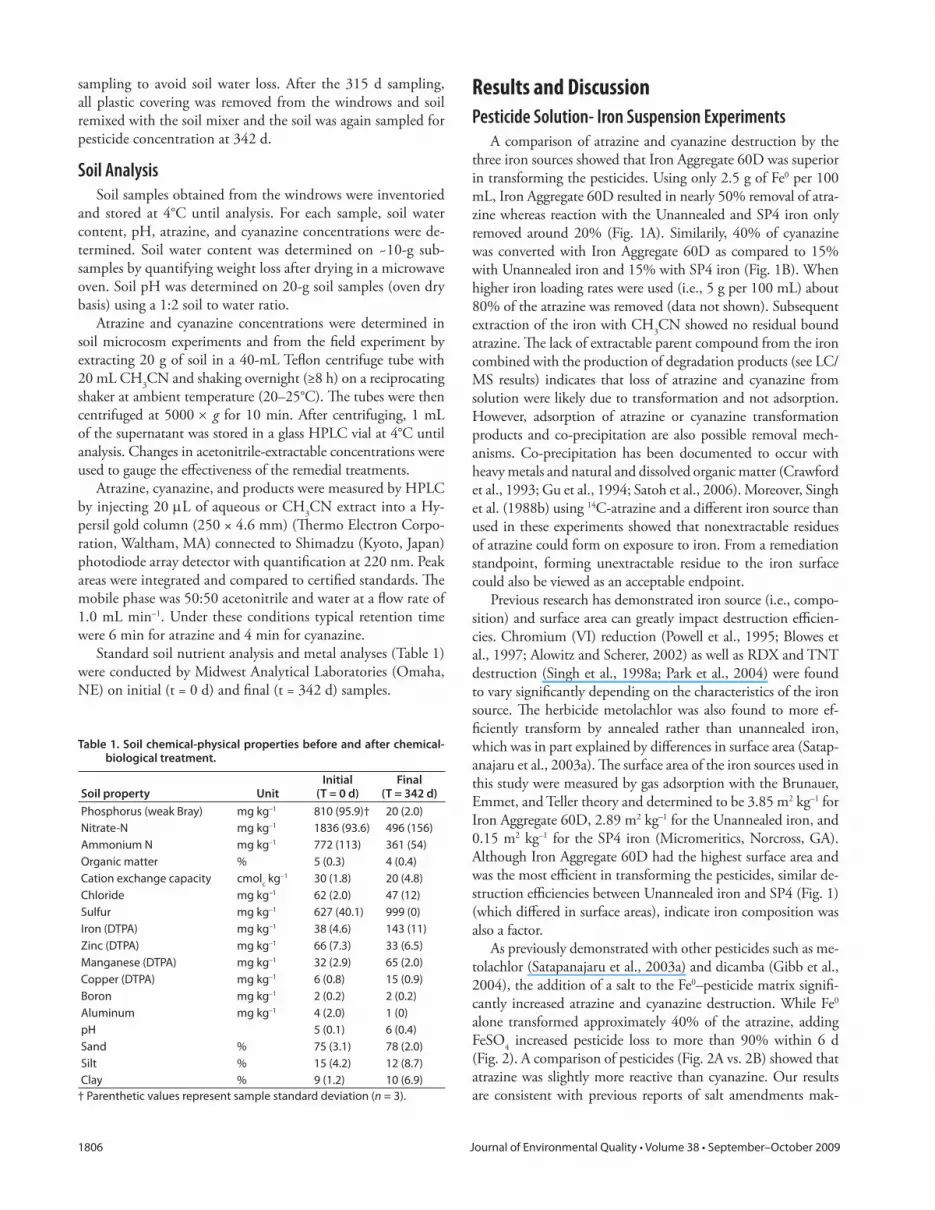
Table 2. Temporal changes in atrazine and cyanazine concentrations in the North and South windrows following treatment with zerovalent iron, ferrous sulfate, and emulsifi ed oil (EOS 598B42).
Pesticide(Windrow)
Time (d)
Initial 7 14 21 30 60 250 270 315 342†
–––––––––––––––––––––––––––––––––––––––––––––––––mg kg–1–––––––––––––––––––––––––––––––––––––––––––––––––Atrazine (North) 30.25 (16.90)‡ 15.94 (7.18) 12.45 (7.08) 11.23 (5.50) 8.91 (5.71) 7.14 (2.70) 4.81 (3.28) 4.67 (2.77) 3.86 (3.80) 2.80 (1.14)
Percent decrease 47.3 58.8 62.9 71.5 76.4 84.1 84.6 87.2 90.7
Atrazine (South) 15.87 (7.45) 12.03 (6.30) 10.40 (4.05) 5.50 (1.8) 4.94 (2.88) 4.37 (1.02) 4.66 (1.64) 5.28 (2.21) 4.79 (3.80) 3.34 (1.63)
Percent decrease 24.2 34.5 65.3 68.9 72.4 70.6 66.7 69.8 79.0
Cyanazine (North) 30.25 (17.67) 17.54 (5.38) 15.71 (12.5) 11.93 (10.61) 7.81 (7.55) 7.98 (6.01) 7.83 (2.76) 9.71 (3.06) 4.88 (2.95) 2.71 (1.63)
Percent decrease 42.0 48.1 60.6 74.2 73.6 74.1 67.9 83.9 91.0
Cyanazine (South) 29.15 (21.8) 19.63 (16.0) 7.29 (6.36) 6.36 (3.70) 5.17 (2.47) 5.25 (3.22) 5.57 (3.35) 7.77 (5.29) 7.03 (4.69) 3.92 (2.34)
Percent decrease 32.7 75.0 78.2 82.3 82.0 80.9 73.3 75.9 86.6
† Windrows were mechanically mixed on Day 342 before sampling.
‡ Parenthetic values represent sample standard deviation (n = 15–20).
Waria et al.: Cleanup of Atrazine and Cyanazine Contaminated Soil 1811
Initial analysis of the contaminated soil indicated that, in
addition to atrazine and cyanazine, the mixed soil had very
high concentrations of NO3–, NH
4+, and P as well as dieth-
ylenetriaminepentaacetic acid (DTPA)-extractable metals (Zn,
Mn, Fe, Cu) (Table 1). Following 342 d of treatment, some
notable changes in soil chemical properties were observed (Ta-
ble 1). Extractable P concentrations decreased in the windrows
following treatment. Iron salts have been used to effi ciently
remove P from wastewater (Zeng et al., 2004). Nitrate concen-
trations were reduced following Fe0 treatments, corroborating
previous research showing transformation of NO3
– to NH4
+
on addition of Fe0 (Cheng et al., 1997; Till et al., 1998). Th e
added C source also likely facilitated denitrifi cation. Because
most reductive reactions consume protons (H+), anaerobic
transformations have been shown to increase pH in acidic soils
(Seybold et al., 2001). Iron corrosion also causes an increase
in pH. Th is was observed in our study where the initial pH
of the contaminated soil increased from 5.5 to 7 within 60 d.
However production of organic acids and CO2 may contribute
to soil acidity and cause pH to decrease (Patrick and DeLaune,
1977; Wang et al.,1993) which was seen at 315 d when pH
again decreased to 5 over the winter months and then increased
to 5.9 after the fi nal mixing at 342 d.
AcknowledgmentsWe thank Compliance Advisory Services (Hastings, NE) for
technical assistance with fi eld-scale treatment of contaminated
soil. We also thank Dr. Gay Yuen for fungal identifi cation.
Th is research was supported by the UNL School of Natural
Resources and the Nebraska Research Initiative through the
Water Science Laboratory. Th is paper is a contribution of
Agric. Res. Div. Project NEB-38-071.
ReferencesAlowitz, M.J., and M.M. Scherer. 2002. Kinetics of nitrate, nitrite and Cr(VI)
reduction by iron metal. Environ. Sci. Technol. 36:299–306.
Blowes, D.W., C.J. Ptacek, and J.L. Jambor. 1997. In-situ remediation of Cr (VI)-contaminated groundwater using permeable reactive walls: Laboratory studies. Environ. Sci. Technol. 31:3348–3357.
Cai, X., S. Guangyao, and L. Weiping. 2007. Degradation and detoxifi cation of acetochlor in soils treated by organic and thiosulfate amendments. Chemosphere 66:286–292.
Cheng, I.F., R. Muftikian, Q. Fernando, and N. Korte. 1997. Reduction of nitrate to ammonia by zero-valent iron. Chemosphere 35:2689–2695.
Chiou, C.T., P.E. Porter, and D.W. Schmedding. 1983. Partition equilibria of nonionic organic compounds between soil organic matter and water. Environ. Sci. Technol. 17:227–231.
Comfort, S.D., P.J. Shea, T.A. Machacek, H. Gaber, and B.-T. Oh. 2001. Field scale remediation of metolachlor-contaminated spill site using zerovalent iron. J. Environ. Qual. 30:1636–1643.
Crawford, R.J., I.H. Harding, and D.E. Mainwaring. 1993. Adsorption and coprecipitation of single heavy metal ions onto the hydrated oxides of iron and chromium. Langmuir 9:3050–3056.
Gan, J.Y., and W.C. Koskinen. 1998. Pesticide fate and behavior in soil at elevated concentrations. p. 59–84. In P.C. Kearney and T. Roberts (ed.) Pesticide remediation in soil and water. John Wiley & Sons, New York.
Gibb, C., T. Satapanajaru, S.D. Comfort, and P.J. Shea. 2004. Remediating
dicamba-contaminated water with zerovalent iron. Chemosphere 54:841–848.
Grant, M.A., and F.D. Williams. 1982. Bacterial metabolism under conditions representing pesticide disposal pits. J. Environ. Sci. Health B17:393–407.
Gu, B., J. Schmitt, Z. Chen, L. Liang, and J.F. McCarthy. 1994. Adsorption and desorption of natural organic matter on iron oxide: Mechanisms, and models. Environ. Sci. Technol. 28:38–46.
Hoff man, M.R. 1990. Catalysis in aquatic environments. p. 71–111. In W. Stumm (ed.) Aquatic chemical kinetics. John Wiley & Sons, New York.
Issa, S., and M. Wood. 2005. Degradation of atrazine and isoproturon in surface and sub-surface soil materials undergoing diff erent moisture and aeration conditions. Pest Manage. Sci. 61:126–132.
McBride, M.B. 1994. Environmental chemistry of soils. Oxford Univ. Press, New York.
Minnesota Department of Agriculture. 1997. Results of 1996 soil sampling of pesticides on crop production retailer facilities. Agron. and Plant Protection Serv., St. Paul, MN.
Moorman, T.B., J.K. Cowan, E.L. Arthur, and J.R. Coats. 2001. Organic amendments to enhance herbicide biodegradation in contaminated soils. Biol. Fertil. Soils 33:541–545.
Park, J., S.D. Comfort, P.J. Shea, and T.A. Machacek. 2004. Remediating munitions-contaminated soil with zerovalent iron and cationic surfactants. J. Environ. Qual. 33:1305–1313.
Patrick, W.H., Jr., and R.D. DeLaune. 1977. Chemical and biological redox systems aff ecting nutrient availability in the coastal wetlands. Geosci. Man 18:131–137.
Powell, R.M., R.W. Puls, S.K. Hightower, and D.A. Sabatini. 1995. Coupled iron corrosion and chromate reduction: Mechanisms for subsurface remediation. Environ. Sci. Technol. 29:1913–1922.
Satapanajaru, T. 2002. Remediating chloroacetanilide-contaminated water using zerovalent iron. Ph.D. diss. Univ. of Nebraska, Lincoln (Diss. Abstr. Int., B 2003, 63(12), 5741).
Satapanajaru, T., S.D. Comfort, and P.J. Shea. 2003a. Enhancing metolachlor destruction rates with aluminum and iron salts during zerovalent iron treatment. J. Environ. Qual. 32:1726–1734.
Satapanajaru, T., P.J. Shea, S.D. Comfort, and Y. Roh. 2003b. Green rust and iron oxide formation infl uences metolachlor dechlorination during zerovalent iron treatment. Environ. Sci. Technol. 37:5219–5227.
Satoh, Y., K. Kikuchi, S. Kinoshita, and H. Sasaki. 2006. Potential capacity of coprecipitation of dissolved organic carbon (DOC) with iron(III) precipitates. Limnol. 7:231–235.
Seybold, C.A., W. Mersie, and C. McNamee. 2001. Anaerobic degradation of atrazine and metolachlor and metabolite formation in wetland soil and water microcosms. J. Environ. Qual. 30:1271–1277.
Shin, J.Y., and M.A. Cheney. 2004. Abiotic transformation of atrazine in aqueous suspension of four synthetic manganese oxides. Colloid Surf. 242:85–92.
Shin, J.Y., and M.A. Cheney. 2005. Abiotic dealkylation and hydrolysis of atrazine by birnessite. Environ. Toxicol. Chem. 24:1353–1360.
Singh, J., S.D. Comfort, and P.J. Shea. 1998a. Remediating RDX-contaminated water and soil using zero-valent iron. J. Environ. Qual. 27:1240–1245.
Singh, J., P.J. Shea, L.S. Hudal, S.D. Comfort, T.C. Zhang, and D.S. Hage. 1998b. Iron-enhanced remediation of water and soil containing atrazine. Weed Sci. 46:281–388.
Till, B.A., L.J. Weathers, and P.J. Alvarez. 1998. Fe(0)-supported autotrophic denitrifi cation. Environ. Sci. Technol. 32:634–639.
USEPA. 1999. Pesticide industry sales and usage report. U.S. Environmental Protection Agency, Washington, DC.
Wagner, S.C., and R.M. Zablotowicz. 1997. Eff ect of organic amendments on the bioremediation of cyanazine and fl uometron in soil. J. Environ. Sci. Health B32:37–54.
Wang, Z.P., R.D. DeLaune, P.H. Masscheleyn, and W.H. Patrick, Jr. 1993. Soil redox and pH eff ects on methane production in a fl ooded rice soil. Soil Sci. Soc. Am. J. 57:382–385.
Zeng, L., X. Li, and J. Liu. 2004. Adsorptive removal of phosphorous from aqueous solution using iron oxide tailings. Water Res. 38:1318–1326.