DOE/MC/26373-3530 (DE94000055) DEVELOPMENT OF CERAMIC NEMBRANE REACTORS FOR HIGH TEMPERATURE GAS CLEANUP Flnal Report By Daryl L. Roberts I.C. Abraham Y. Blum D.E. Gottschllch A. Hlrschon J. Douglas Way John Co,ins June 1993 Work Performed Under Contract No. AC21-89MC26373 t For U.S. Department of Energy Morgantown Energy Technology Center Morgantown, West Virginia By SRI International Menlo Park, California
Transcript
DOE/MC/26373-3530
(DE94000055)
DEVELOPMENT OF CERAMIC NEMBRANE REACTORS FOR HIGHTEMPERATURE GAS CLEANUP
Flnal Report
ByDaryl L. RobertsI.C. AbrahamY. BlumD.E. GottschllchA. Hlrschon
J. Douglas WayJohn Co,ins
June 1993
Work Performed Under Contract No. AC21-89MC26373t
For
U.S. Department of EnergyMorgantown Energy Technology CenterMorgantown, West Virginia
BySRI InternationalMenlo Park, California
DOF_JMC/26373-3530(DE94000055)
DisldbutionCategoriesUC-114 and UC-106
o
, Development of Ceramic Membrane ReactorsFor High Temperature Gas Cleanup
Final Report
Daryl L. RobertsI.C. Abraham
Y. BlumD.E. Gottschlich
A. HirschonJ. Douglas Way
John Collins
Work Performed Under Contract No.: DE-AC21-89MC26373
For
U.S. Department of EnergyOffice of Fossil Energy
Morgantown Energy Technology CenterP.O. Box 880
Morgantown, West Virginia 26507.0880
e.
BySRI International
333 Ravenswood AvenueMenlo Park, California 94025-3493
June 1993
SUMMARY
The U.S. Department of Energy (DOE) is seeking to develop high temperature, high
pressure ceramic membrane technology to perform a variety of gas separation processes to improve
the efficiency and economics of advanced power generation systems such as direct coal-fueled
turbines (DCFT) and the integrated gasification combined cycle (IGCC) process. The temperatures
encountered in these power generation systems are far above the temperature range for organic
membrane materials (typically 150-200°C for polymers such as silicone rubber, polysulfone, and
cellulose esters). Inorganic materials such as ceramics are therefore the most likely membrane
materials for use at high temperatures.
The focus of this project was control of H2S and NH3 in IGCC systems. The IGCC
process consists basically of a gasifier to produce synthetic gas, followed by a gas turbine
generator. The temperature and pressure ranges encountered in the IGCC process are 1,000 to
2,000°F and 200 to 1,000 psia. There are several potential applications for a high temperature
membrane reactor process in the IGCC process. Downstream of the hot particle removal device,
for example, both H2S and NH3 could be removed and catalytically decomposed, leaving the fuel
value of the gasifier stream intact. Alternatively, H2S and NH3 could be decomposed directly in
the gasifier. In either case, a membrane reactor has the potential to efficiently effect both H2S and
NH3 decomposition. The primary advantages of using a membrane reactor over a conventional
reactor are that the fraction of the contaminant decomposed is higher and the reaction rate faster.
Overall, the technology of membrane reactors is likely :o impact several DOE program areas.
The objective of this project was to develop high temperature, high pressure catalytic
ceramic membrane reactors and to demonstrate the feasibility of using these membrane reactors to
control gaseous contaminants (hydrogen sulfide and ammonia) in IGCC systems. Our strategy
was to first develop catalysts and membranes suitable for the IGCC application and then combine
these two components as a complete membrane reactor system. We also developed a computer
model of the membrane reactor and used it, along with experimental data, to perform an economic
analysis of the IGCC application.
A survey of the literature identified two promising catalysts for use in a membrane reactor:
MoS2 for H2S decomposition, and Ni for NH3 decomposition (both on an alumina substrate). We
prepared these catalysts and experimentally determined their catalytic activity for H2S and NH3
decomposition. Both catalysts significantly increased the decomposition rates. To make a suitable
membrane, we used four substrates (alumina microfilter monolith, alumina microfilter disks,
alumina ultrafilter tubes, and Vycor glass) and five coating materials (poly-N-methyl silazane,
polycyclohidridomethyl silazane, alumina-based glaze, aluminum phosphorus oxides, and
palladium). Only the palladium films on an alumina ultrafilter were successful. The other
_. membranes were plagued with cracks and poor reproducibility. The palladium membrane showed
a high selectivity for H2 over N2, approaching 200 under some conditions.
A membrane reactor we successfully demonstrated for decomposition of NH3 used the
alumina supported Ni catalyst with the palladium membrane under conditions similar to that in an
IGCC process. The membrane reactor resulted in significantly higher NH3 decomposition than did
a conventional reactor (by at least a factor of 2) and achieved almost complete NH3 removal (95%)
at 600°C.
A computer model was developed starting from the fundamental equations describing mass
transfer and chemical reaction. The model was solved using the Gears numerical method on a
personal computer. The model was used to perform an economic analysis of a membrane reactor
system for H2S and NH3 removal from an IGCC process. The results indicated that achieving the
desired fraction of H2S is very difficult even with a membrane reactor, because of the low value of
the H2S decomposition equilibrium constant and the high ratio of H2 to H2S in the feed stream.
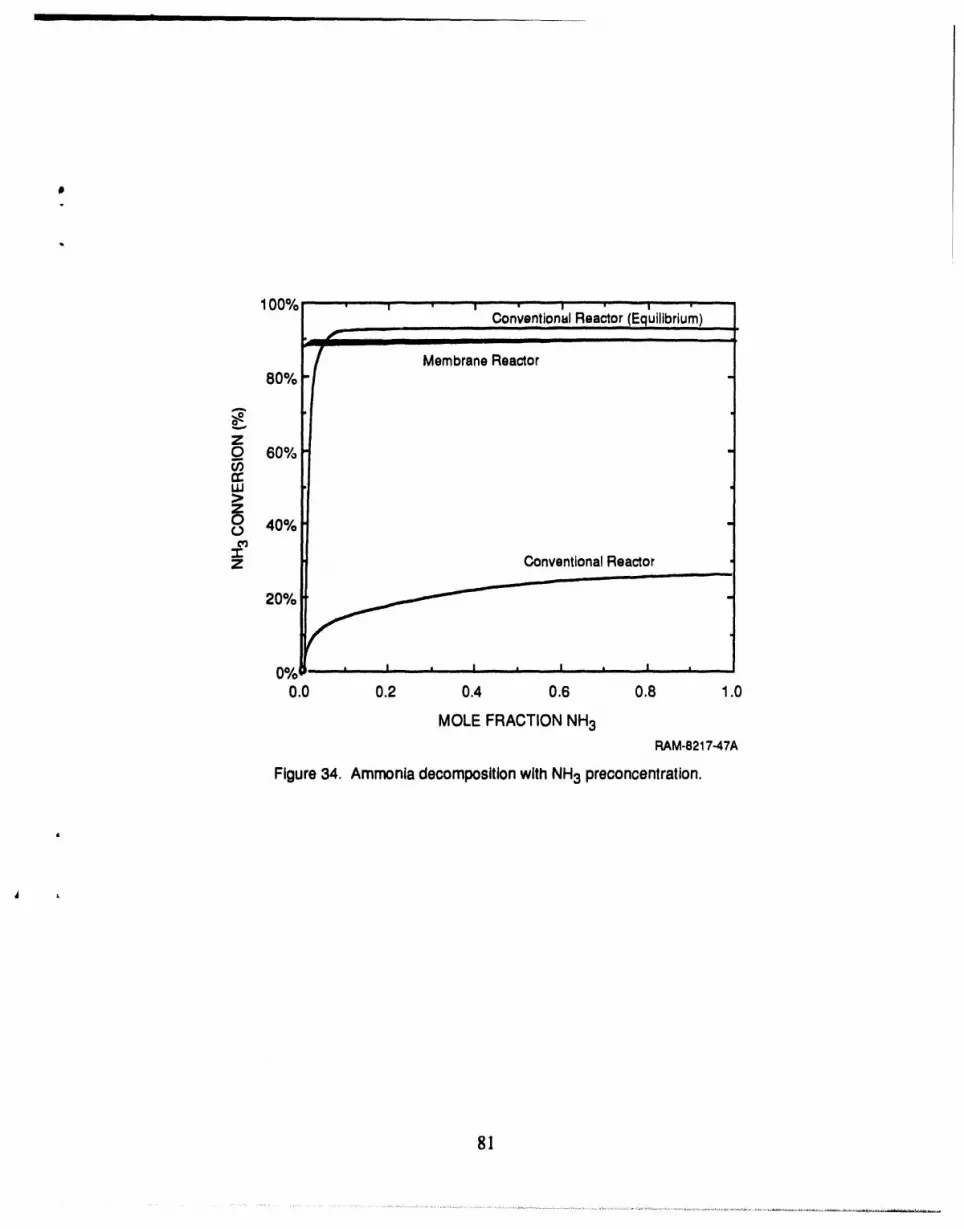
For NH3, our results were promisingmthe maximum conversion that could be achieved was 89%.
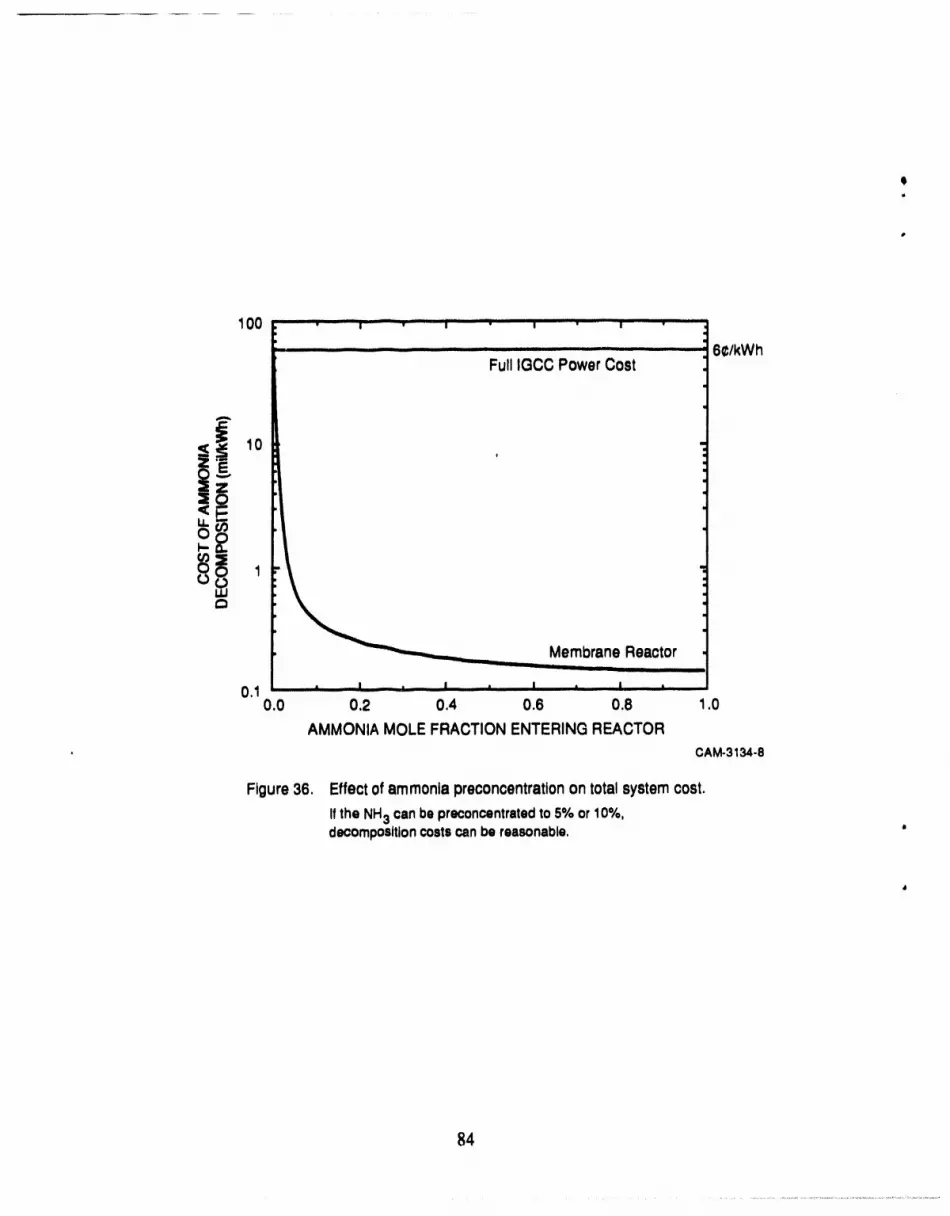
To achieve 90% NH3 decomposition, the NH3 should be preconcentrated in the feed before the
feed enters the membrane reactor. If the feed NH3 concentration can be increased to 5%, the
ammonia decomposition costs will increase the total cost of producing electricity by only 1%.
These calculations were performed using early experimental results. Later experiments showed
improved membrane properties; if these data were used in the economic analysis, higherconversions and lower costs would have resulted.
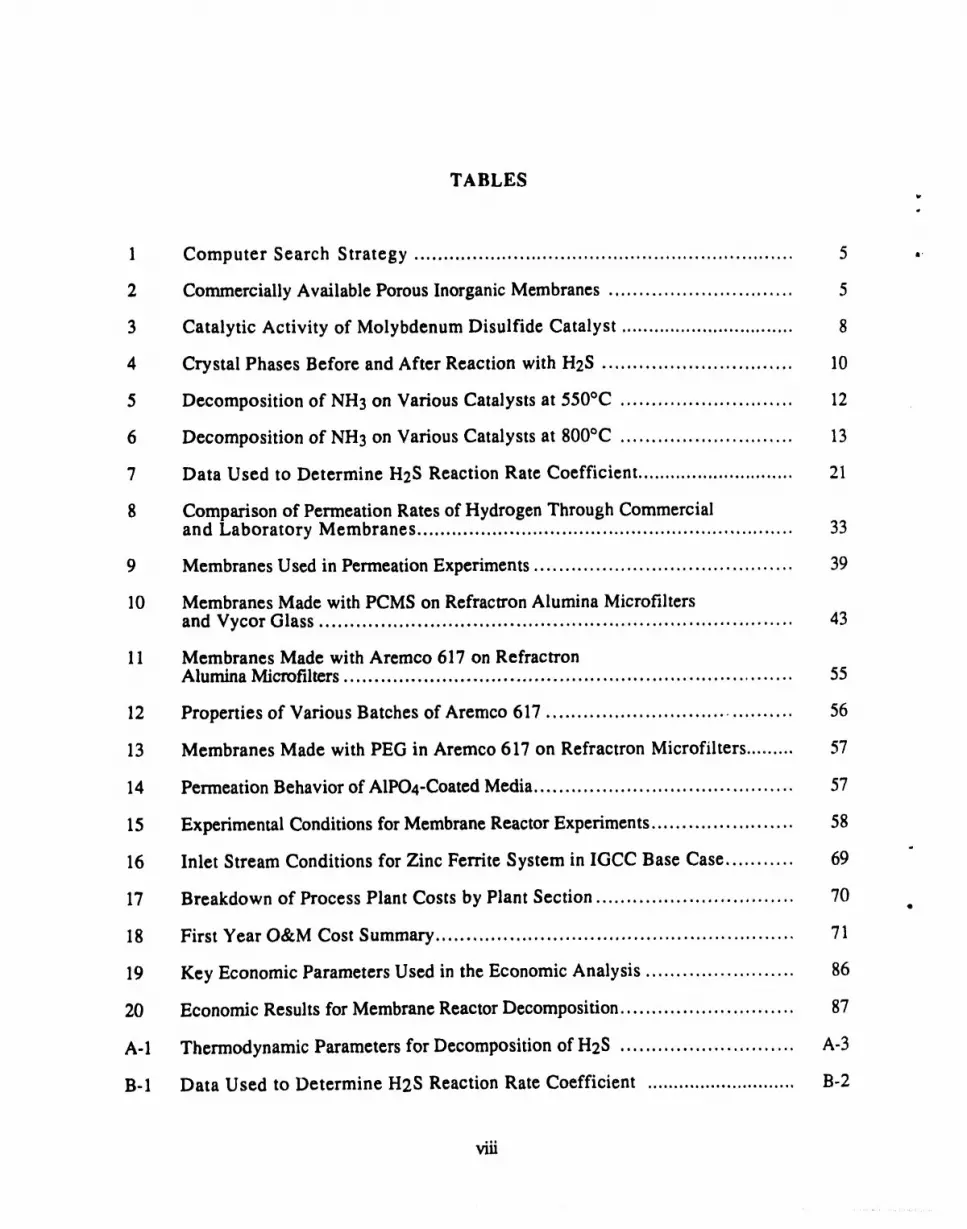
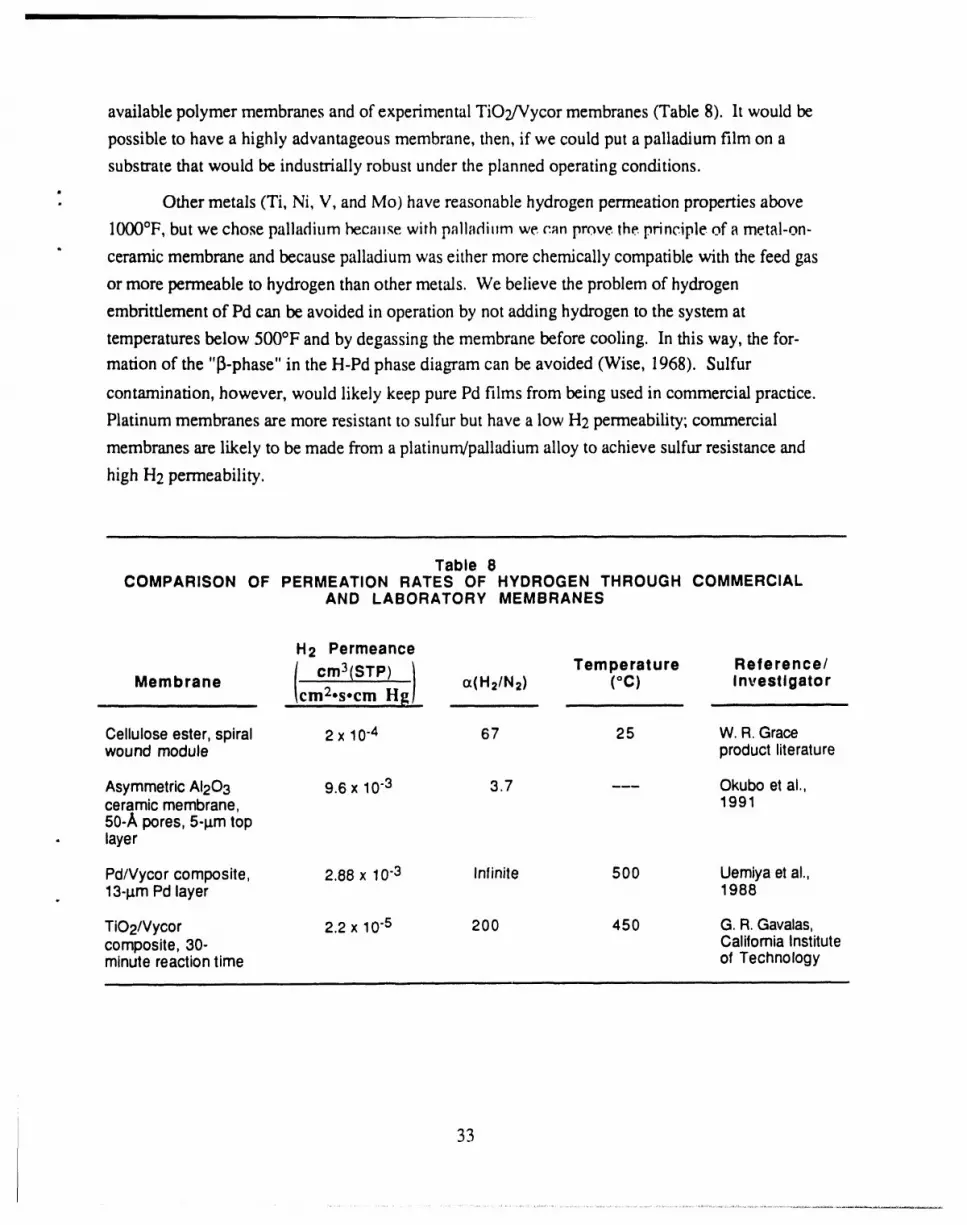
MEMBRANE DEVELOPMENT ................................................................... 32
Palladium Films on Alumina Ultrafiltcrs ........................................................ 32
Preparation of Palladium Films by Electrolcss Plating .............................. 34Bath/Solution Preparation ................................................................... 34
APPENDIX A: THERMODYNAMICS OF THE DECOMPOSITION OFHYDROGEN SULFIDE ..................................................... A- 1
APPENDIX B: REACTION RATE FOR DECOMPOSITION OF HYDROGENSULFIDE ......................................................................... B- 1
i
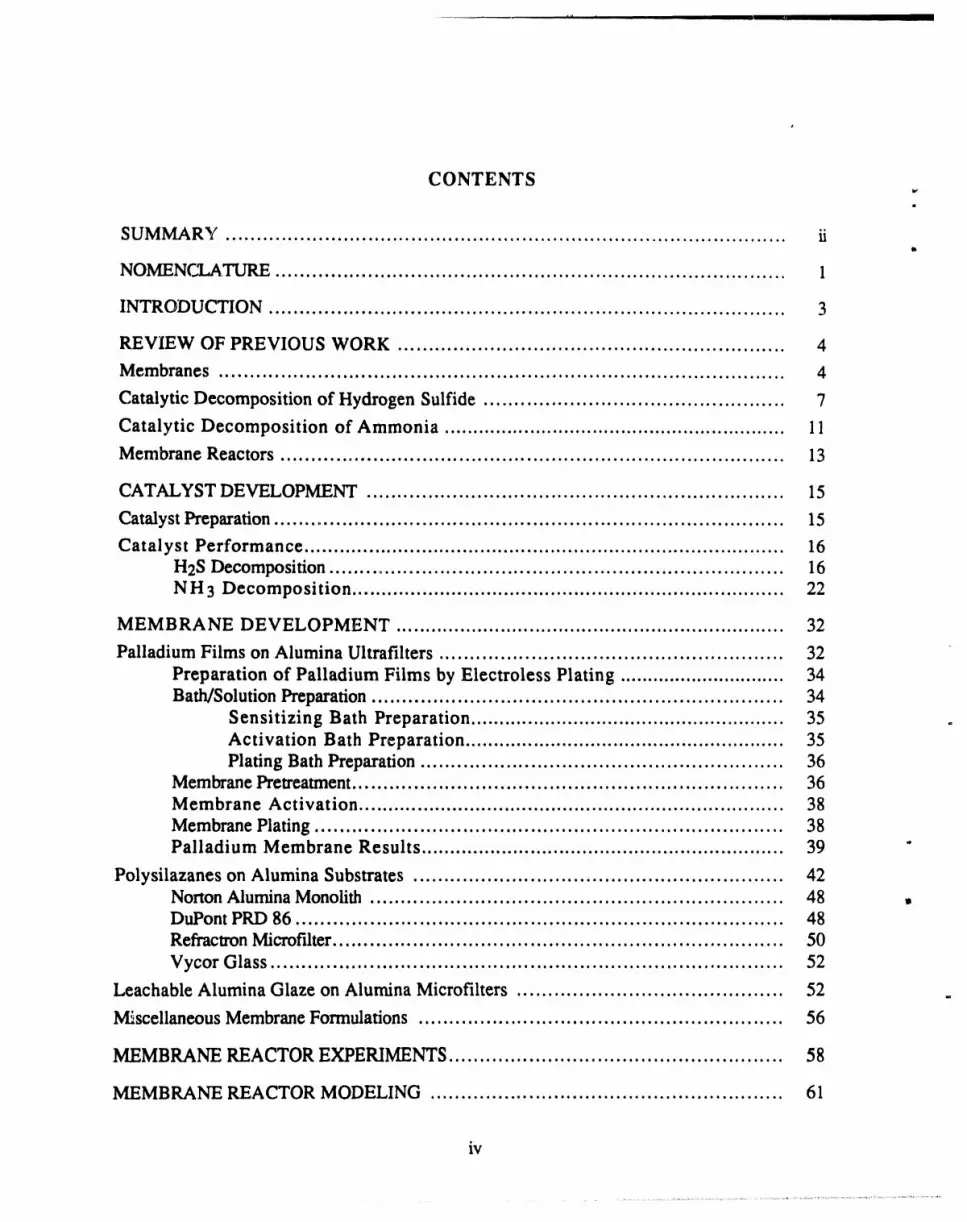
FIGURESw
1 Postulated mechanism for catalysis of hydrogen sulfide "decomposition by molybdenum disulfide ................................................ 9
2 Test system for catalyst activity measurement .......................................... I7
3 Reactor residence time at feed pressure of 200 psia, various flow rates ........ 18
4 Decomposition of H2S on MoS2 catalyst ............................................... 19
5 Analysis of catalytic activity of MoS2 ................................................... 20
6 Extent of NH3 decomposition for alumina tube reactor with aluminaparticles and with catalyst particles ....................................................... 23
7 Catalytic reaction system for kinetic experiments ...................................... 24
8 Effect of flow rate on NH3 decomposition rate ....................................... 26
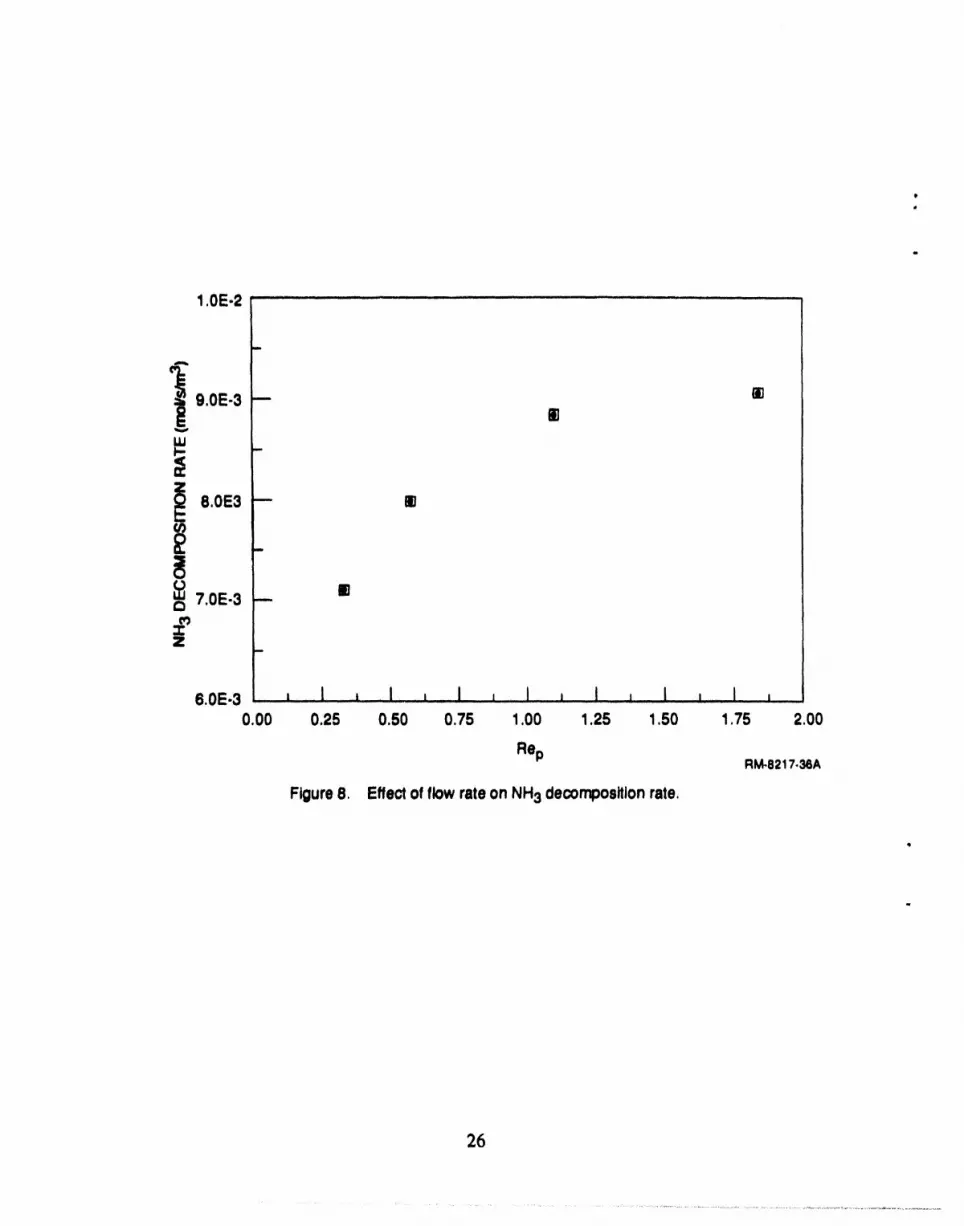
9 Ammonia decomposition rate data (400°C) .............................................. 27
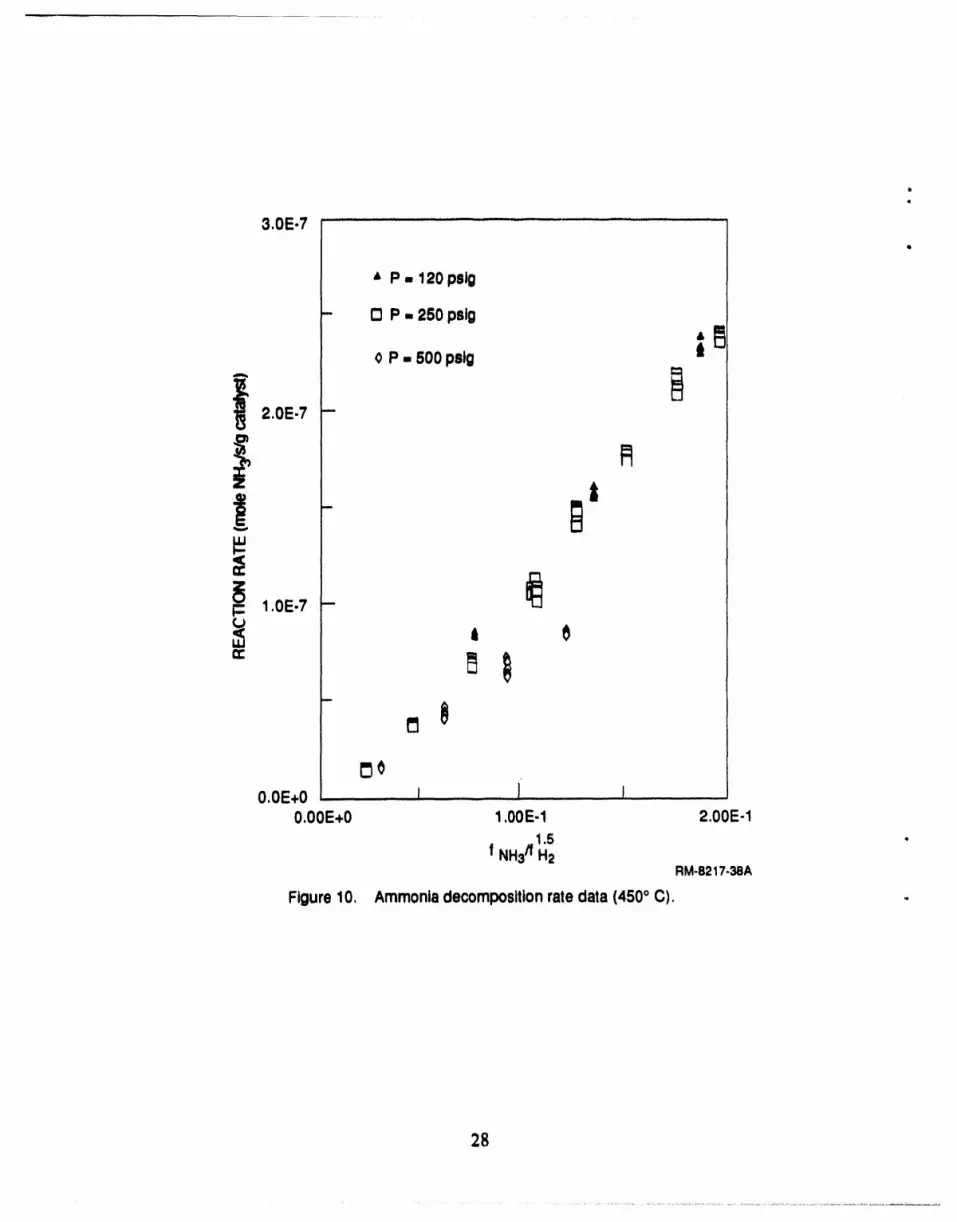
10 Ammonia decomposition rate data (450°C) .............................................. 28
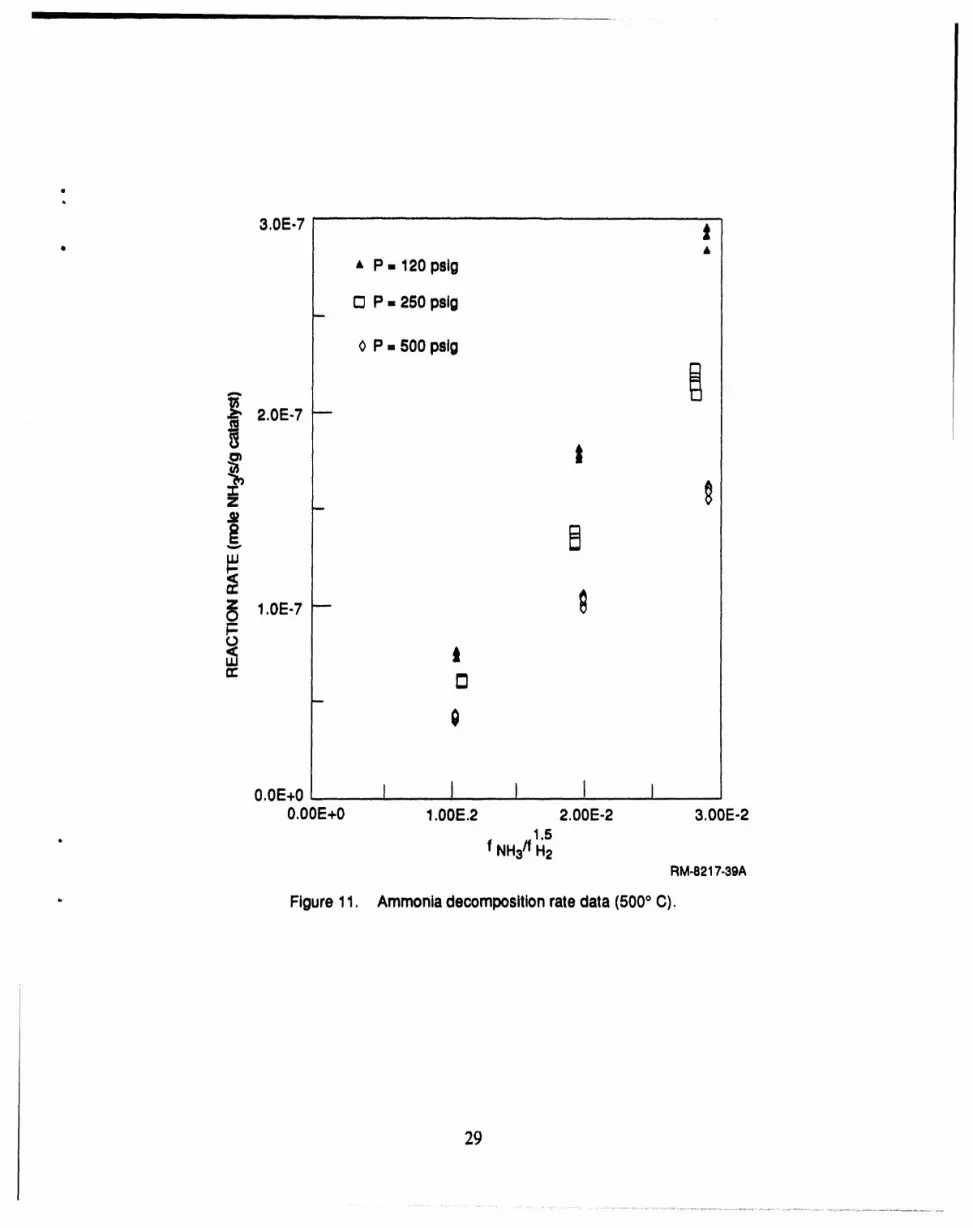
11 Ammonia decomposition rate data (500°C) .............................................. 29
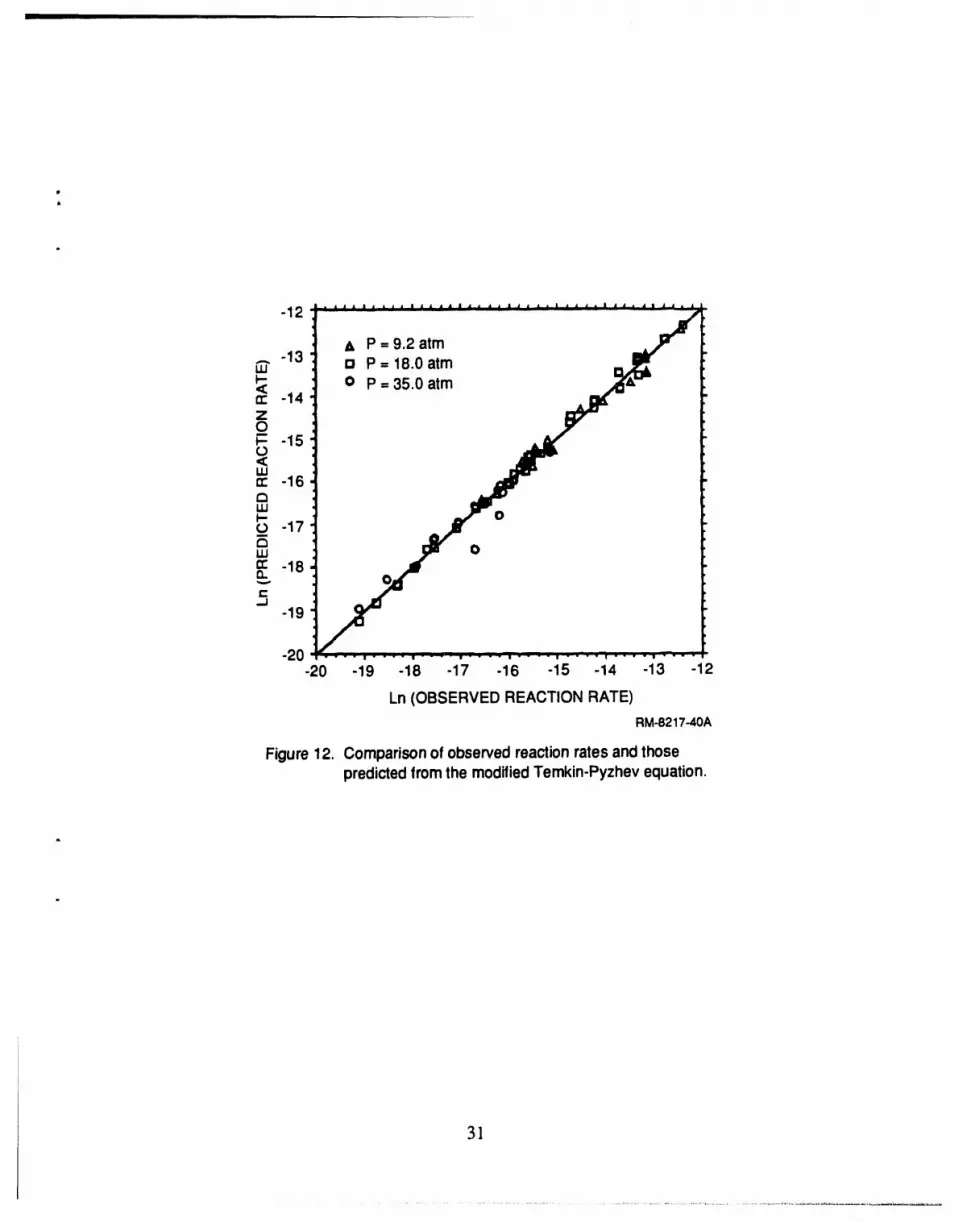
12 Predicted versus observed reaction rates for modifiedTemkin-Pyzhev equation ..................................................................... 31
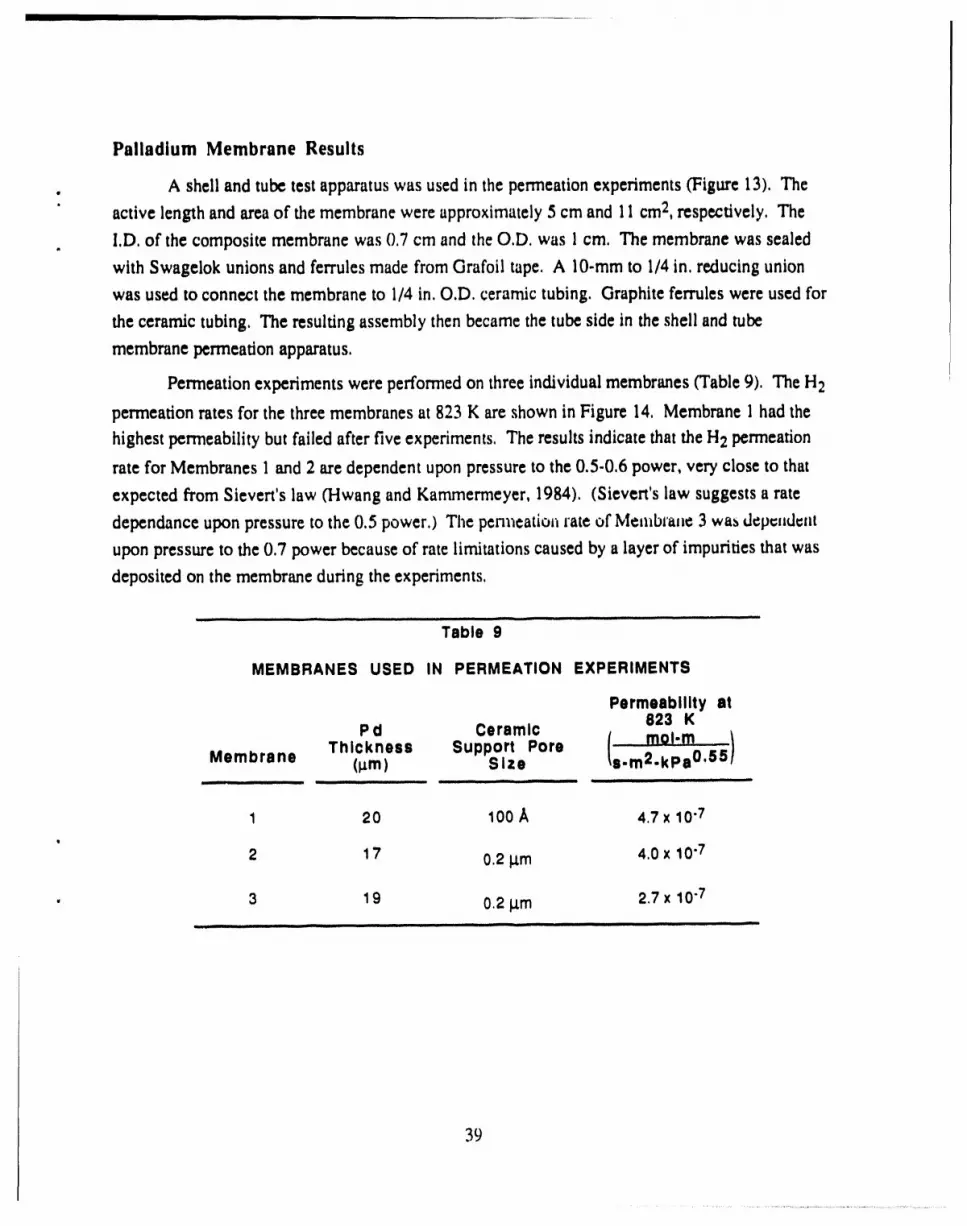
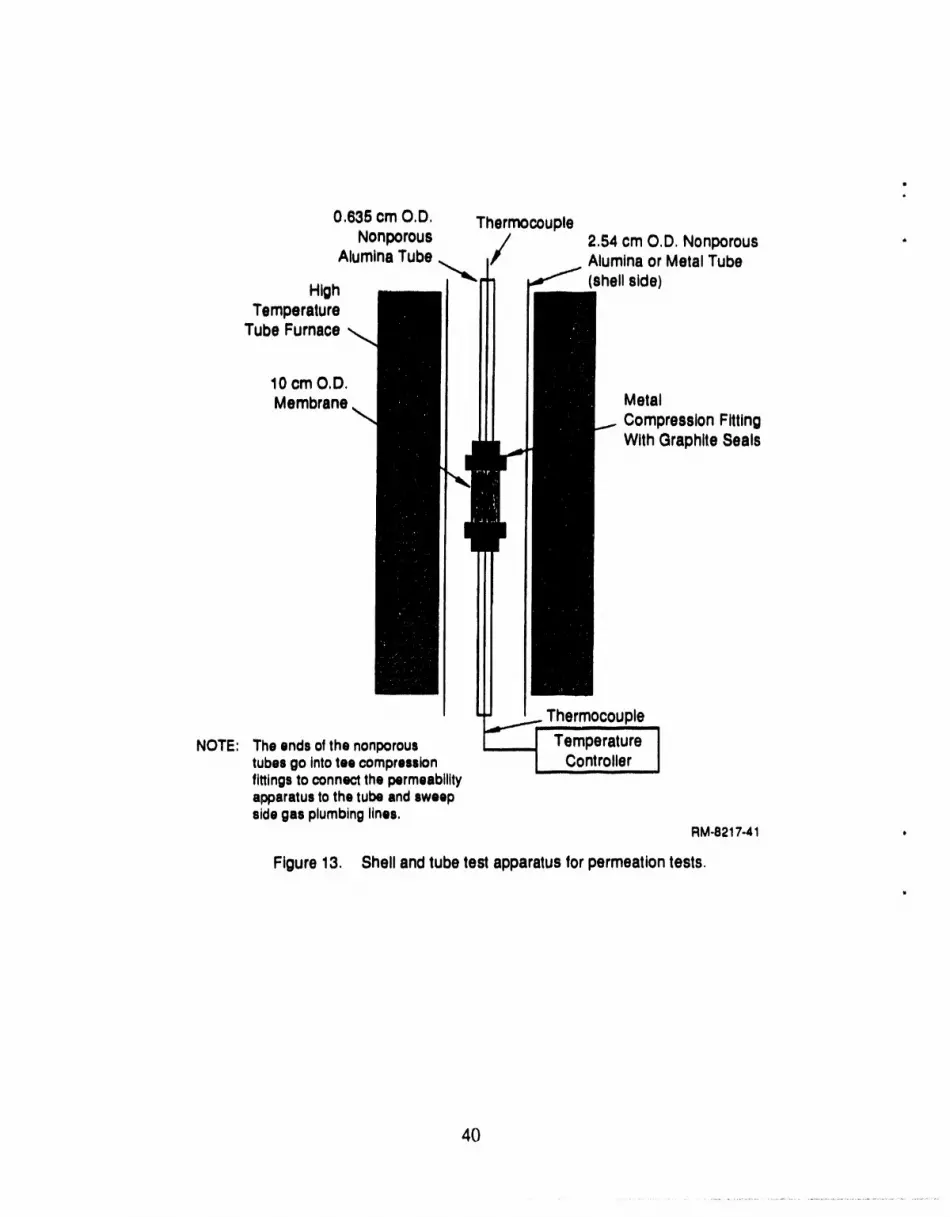
13 Shell and tube test apparatus for permeation tests .................................... 40
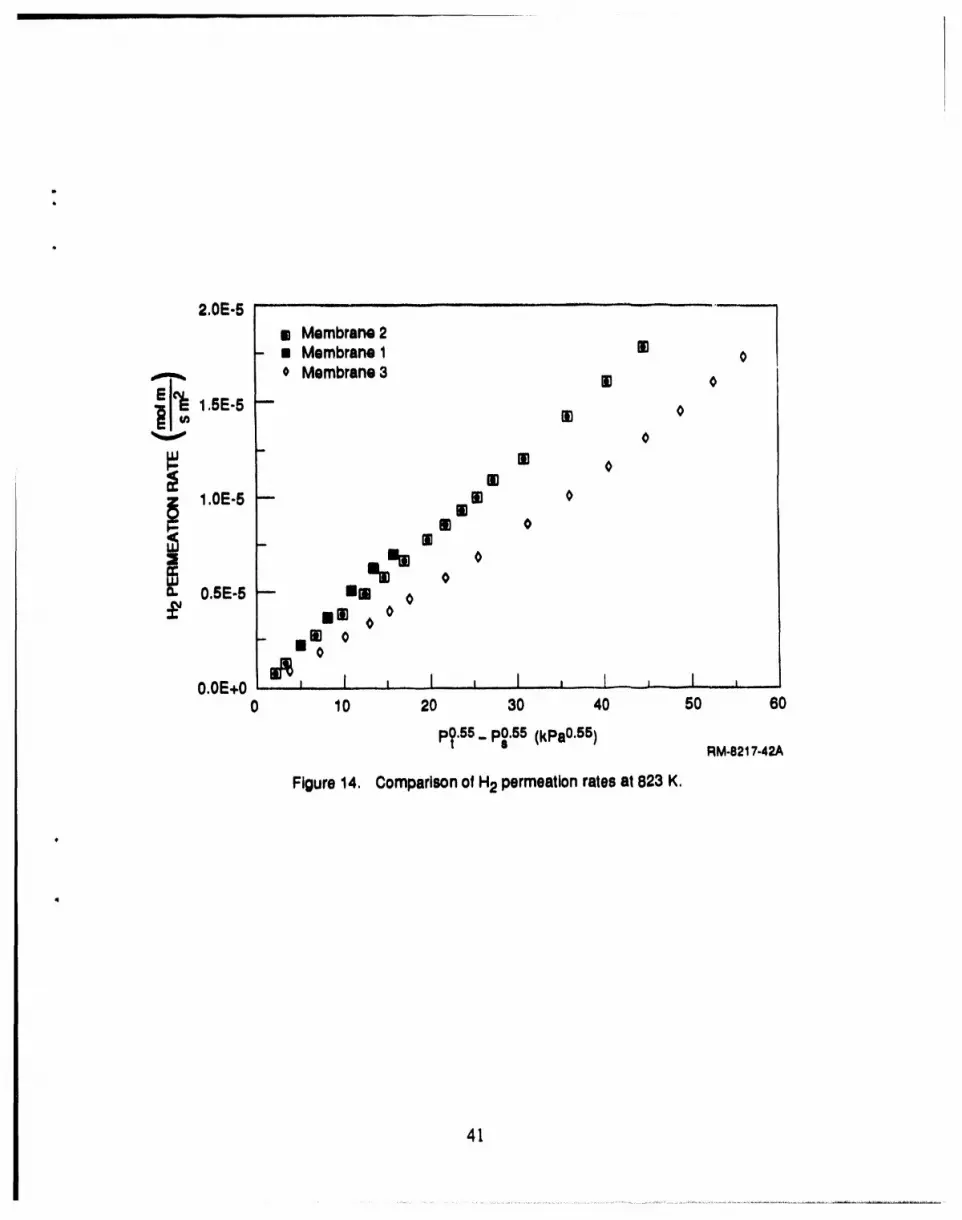
14 Comparison of H2 permeation rates at 823 K ........................................ 41
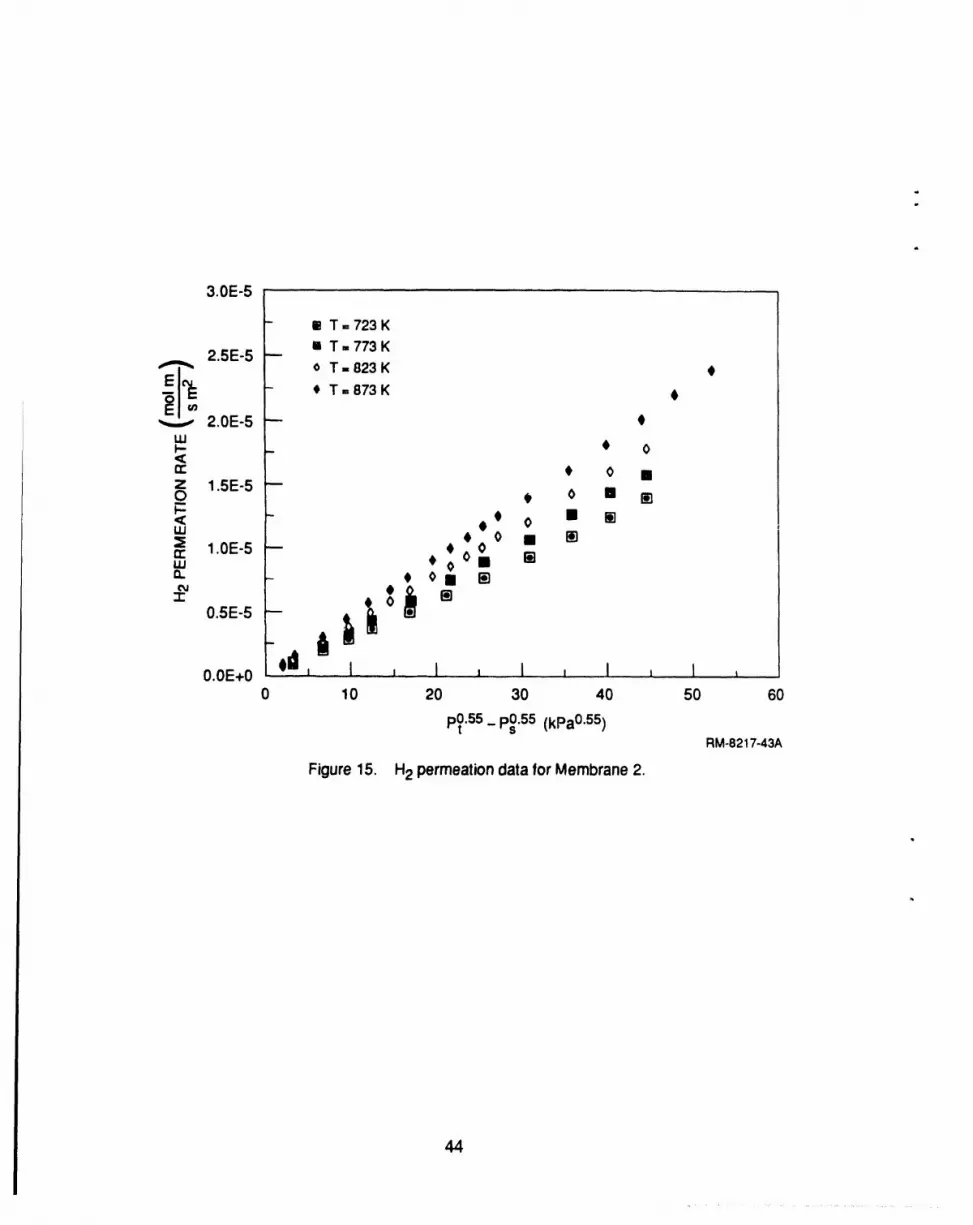
15 H2 permeation data for membrane 2 ..................................................... 44
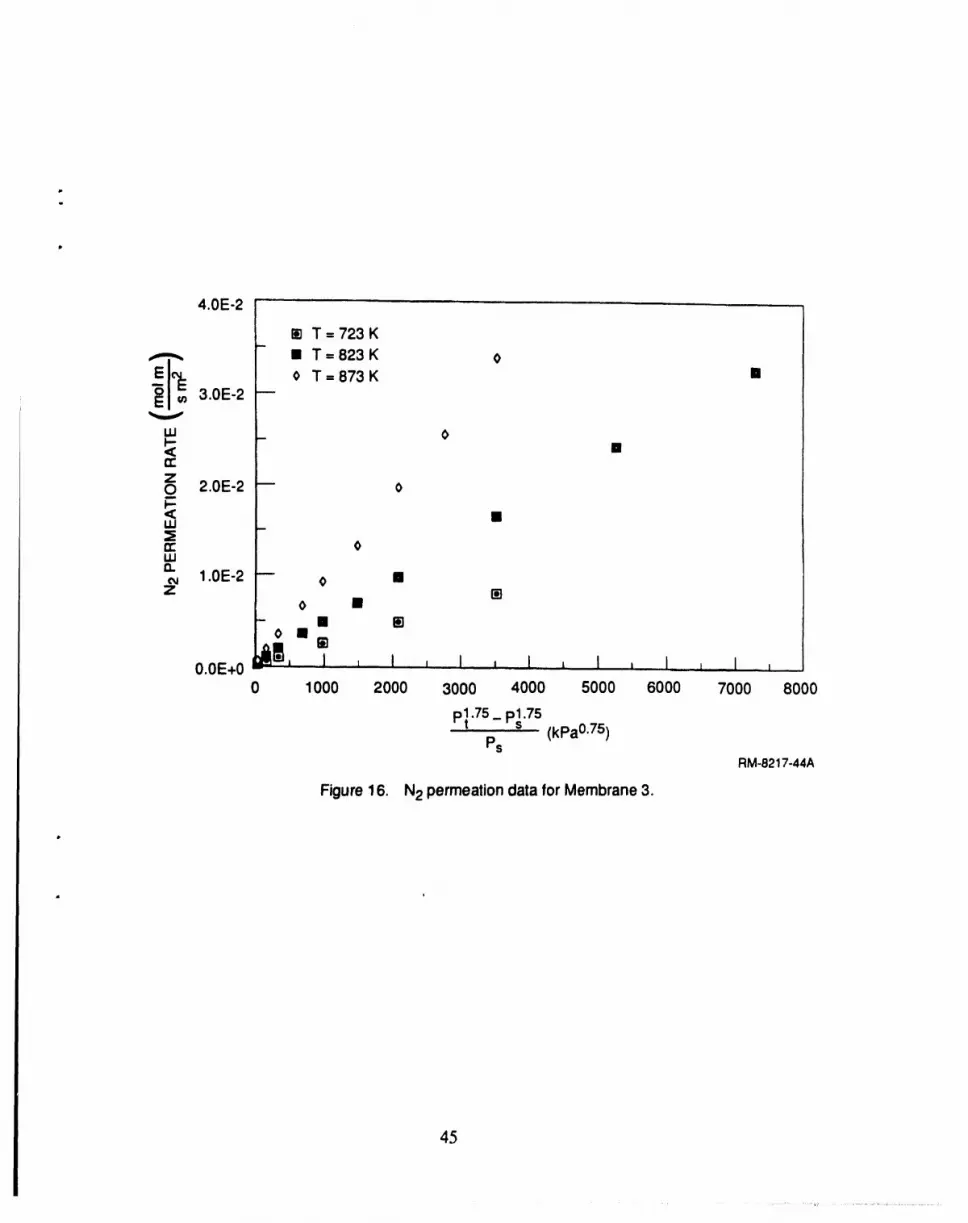
16 N2 permeation data for membrane 3 ..................................................... 45
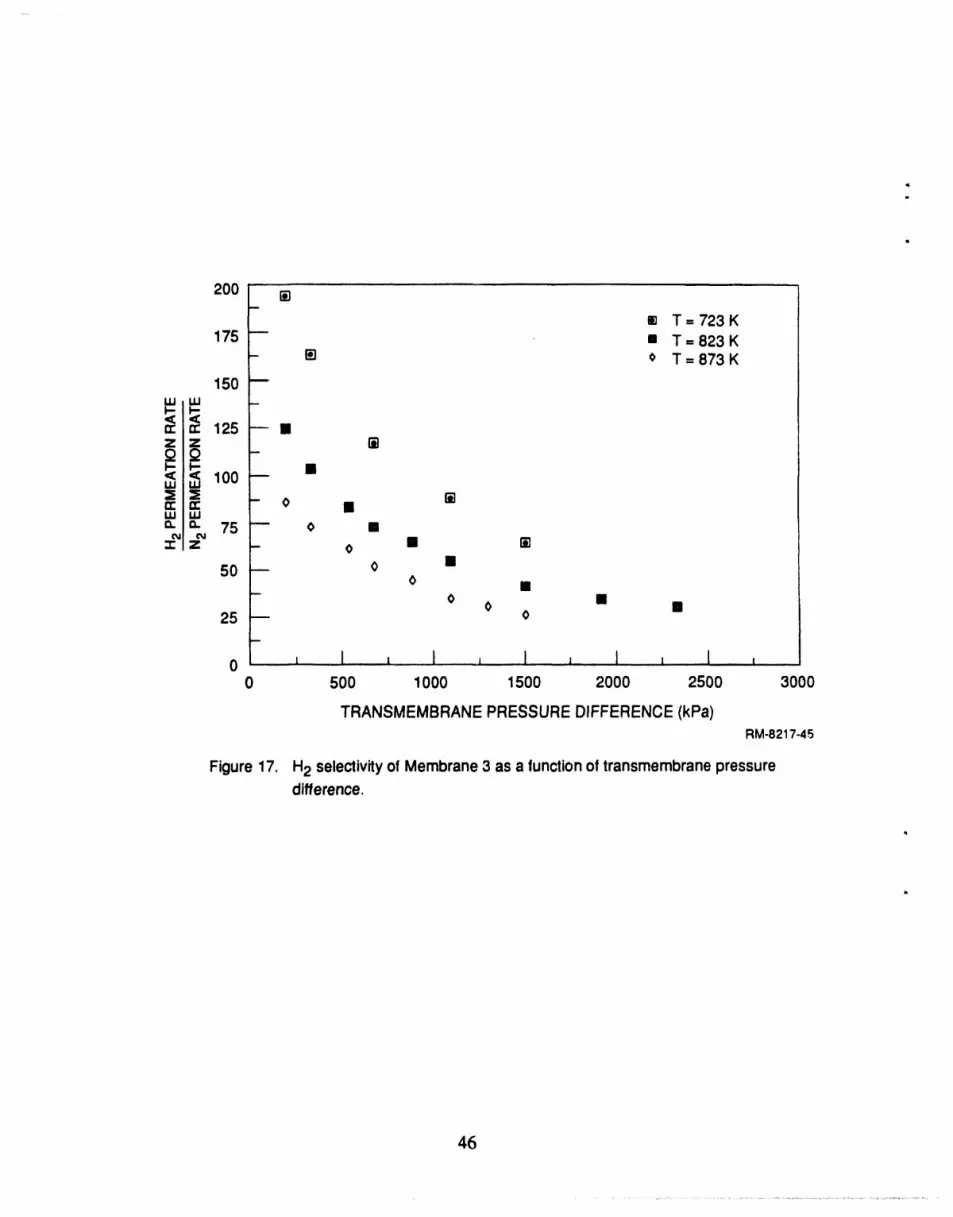
17 H2 selectivity of membrane 3 as a function of transmembrane opressure difference ........................................................................... 46
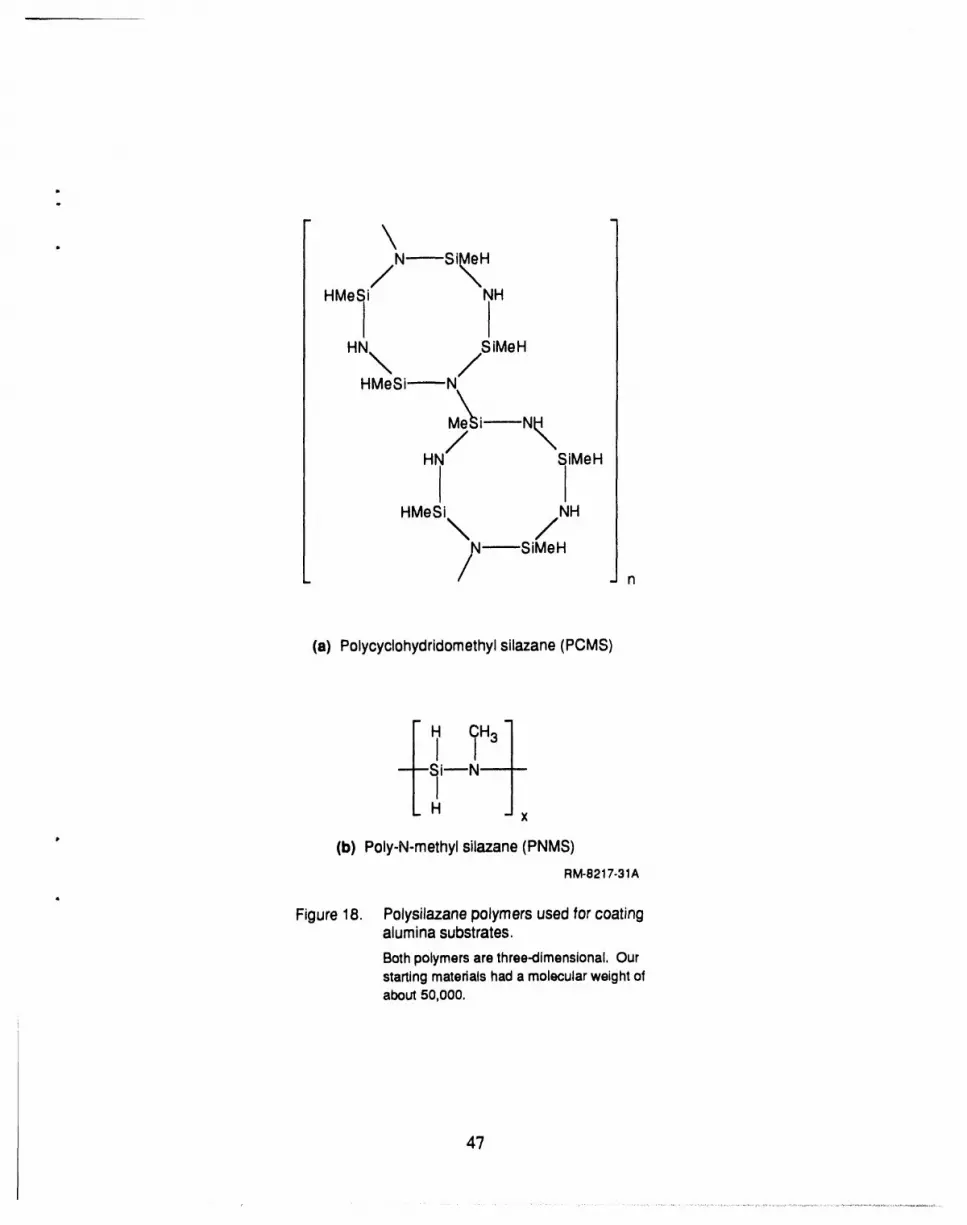
18 Polysilazanes used for coating alumina substrates ..................................... 47
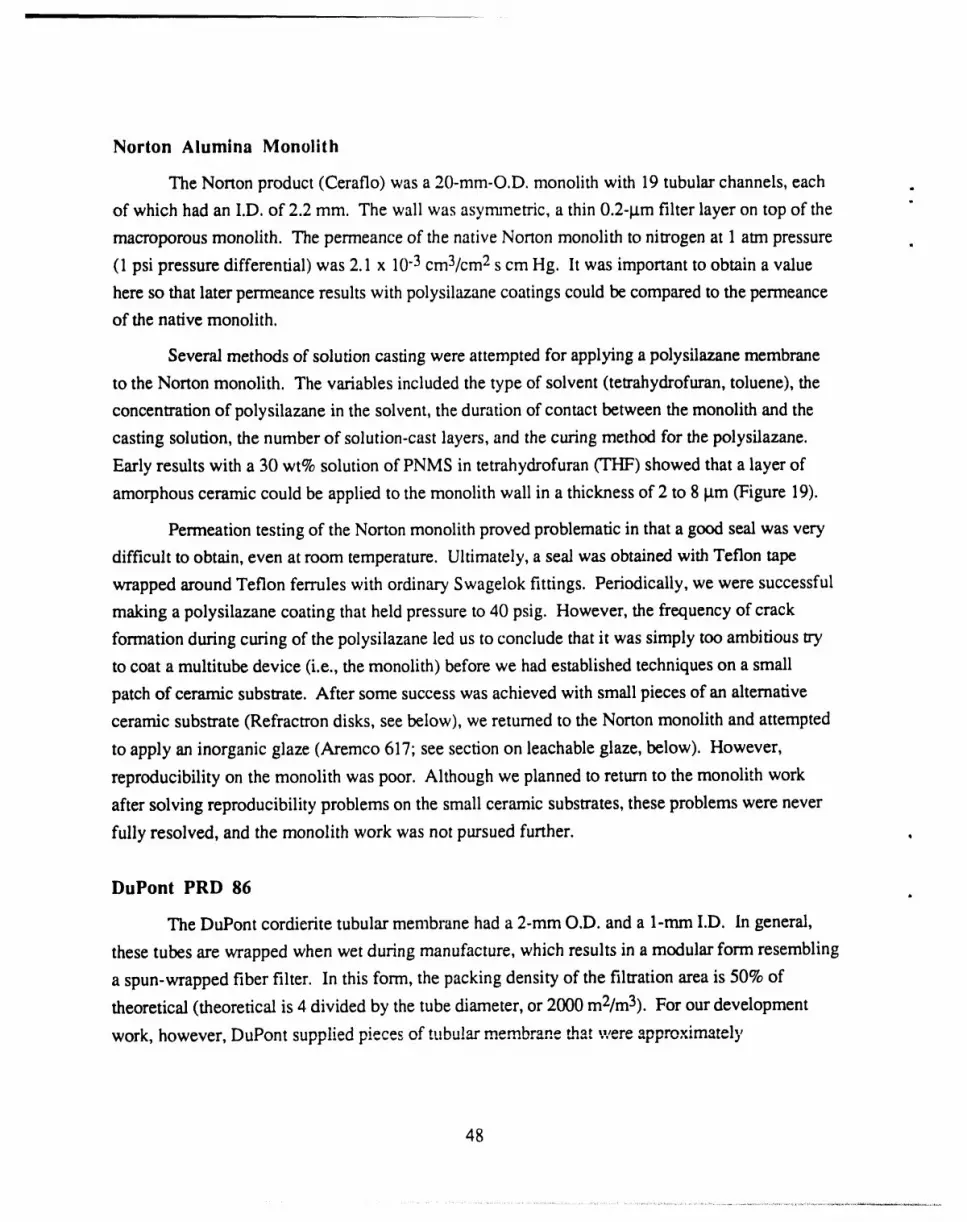
19 Cross section of Norton's asymmetric filter near the surface of aninternal tube after deposition of polysilazane-derived skin ........................... 49
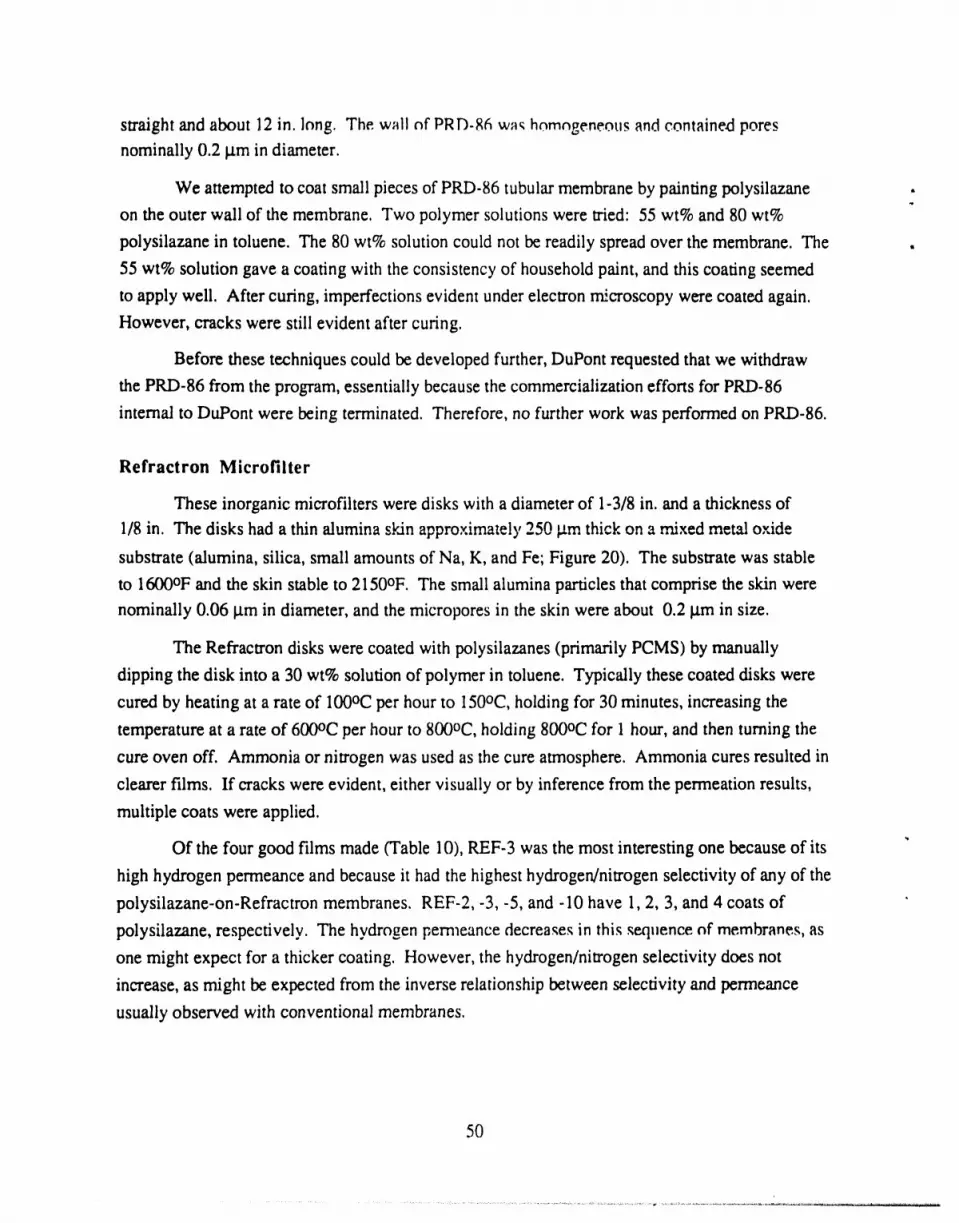
20 Cross section of native Refractron disk ................................................. 51
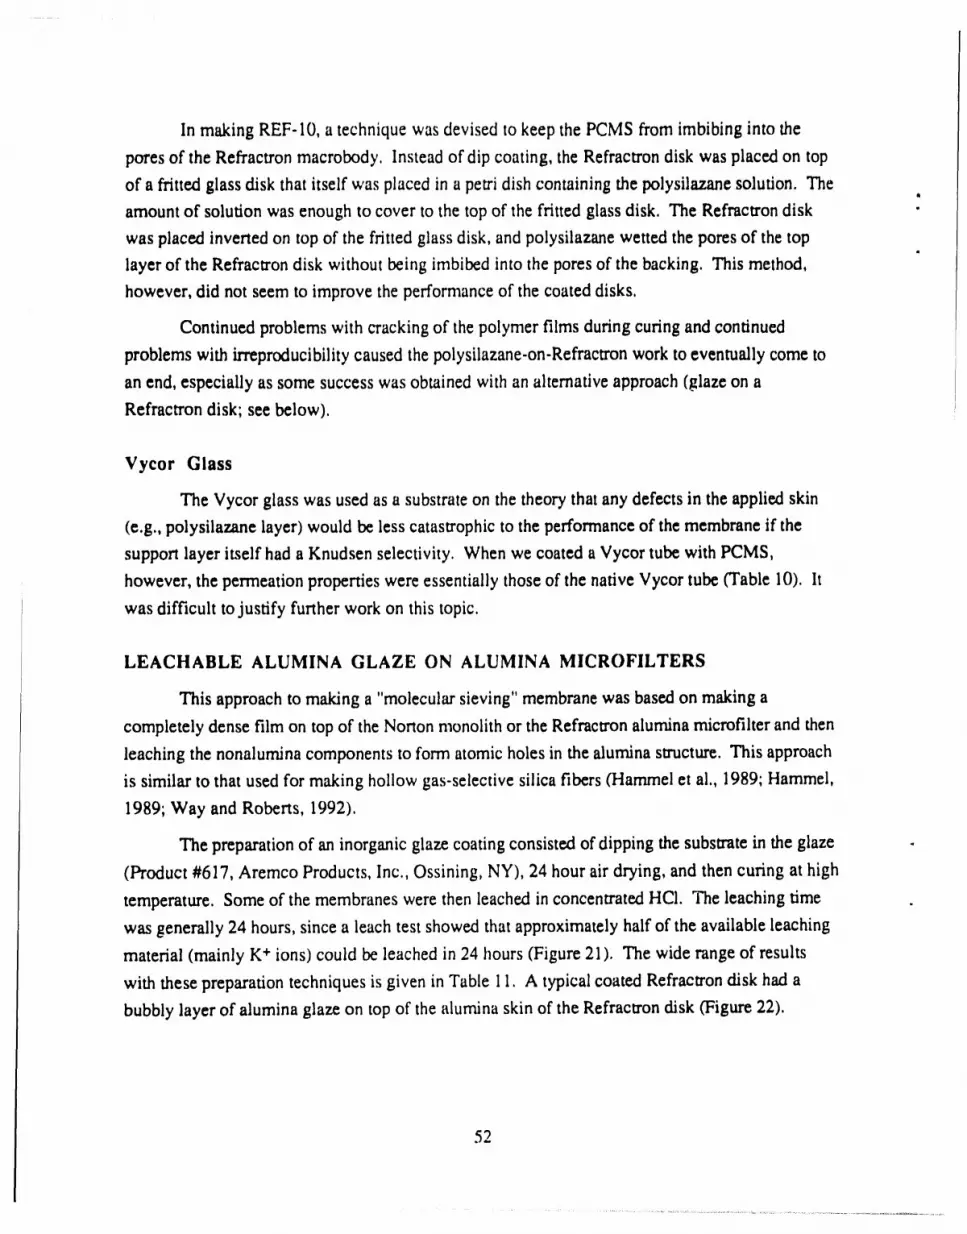
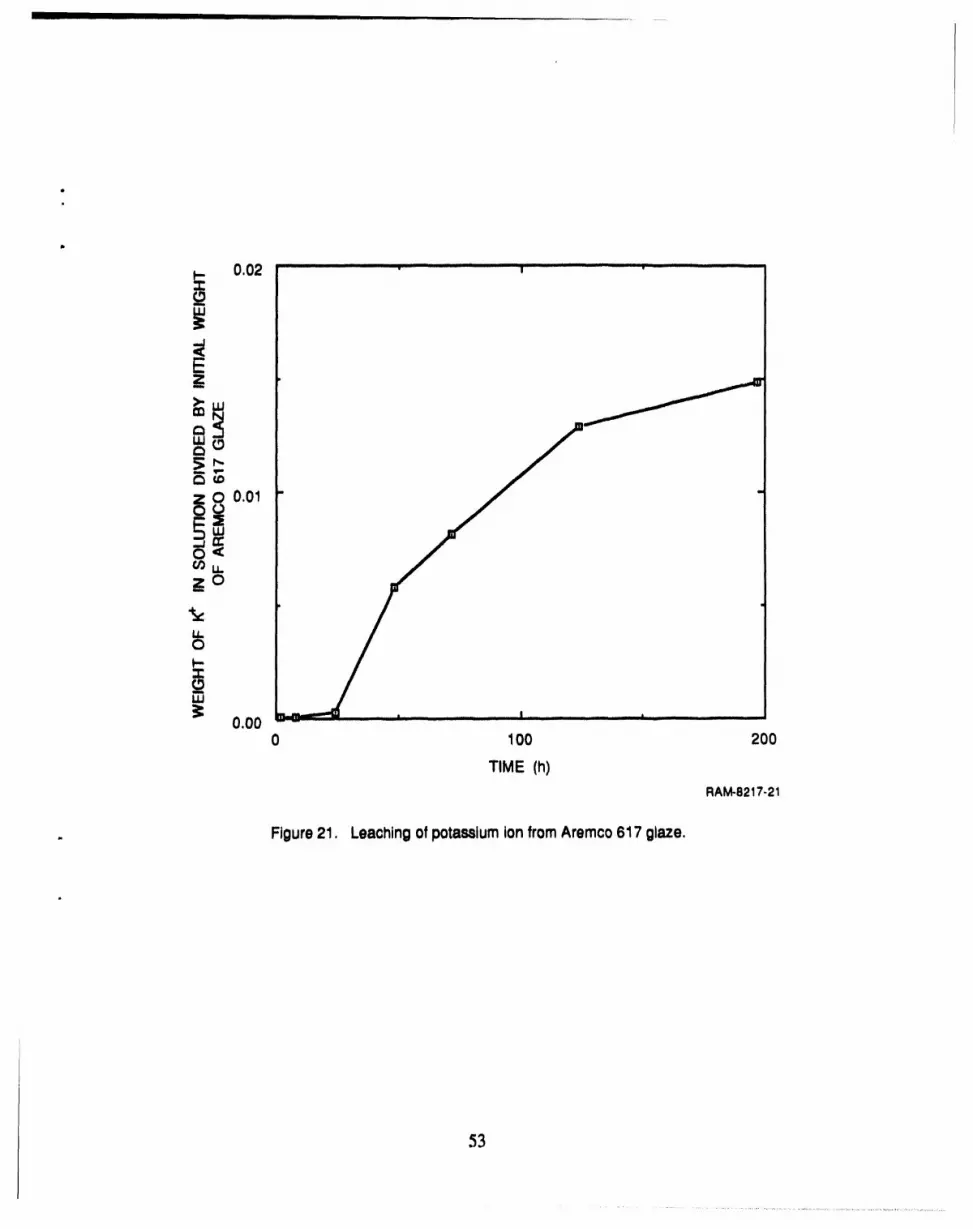
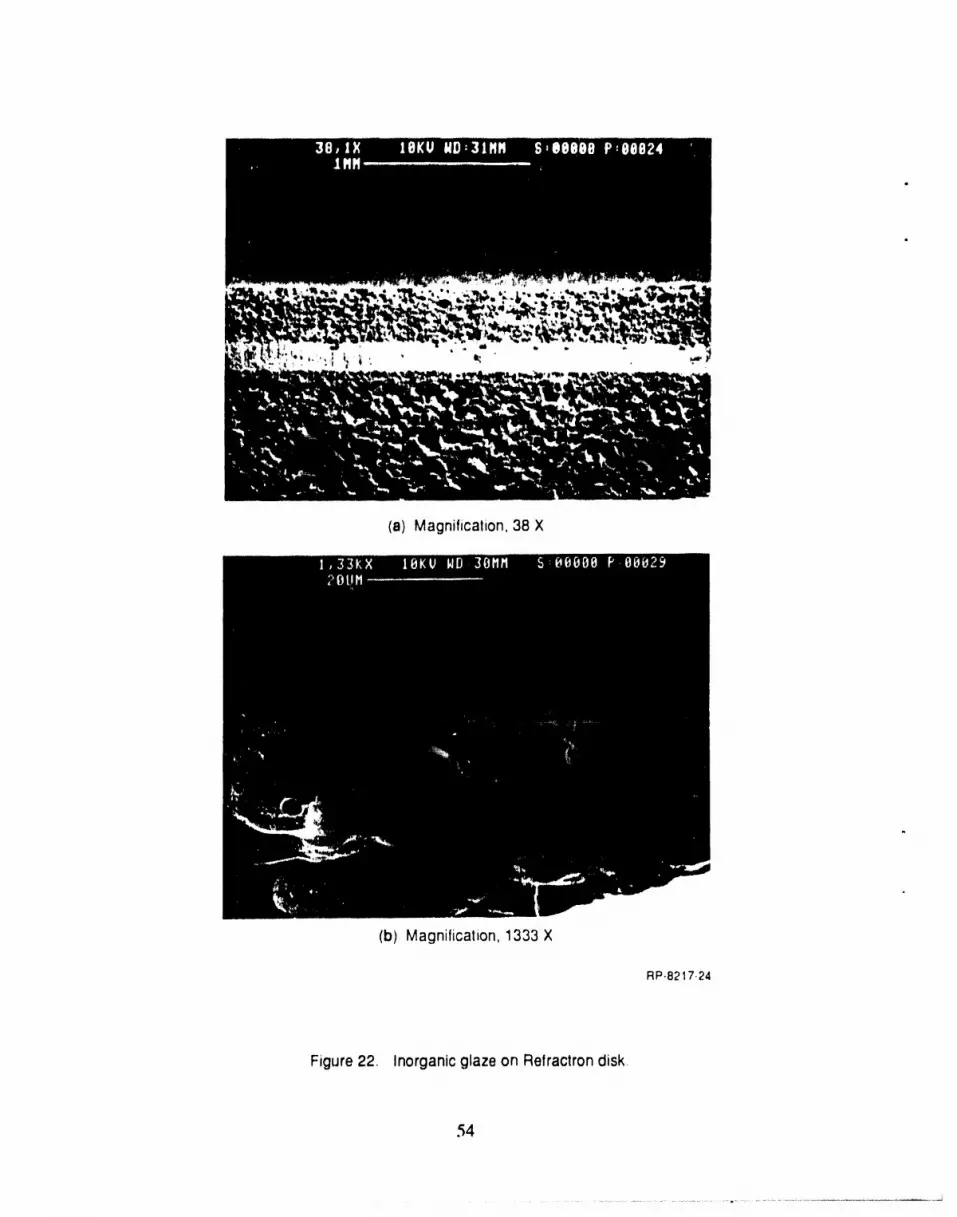
21 Leaching of potassium ion from Aremco 617 glaze .................................. 53
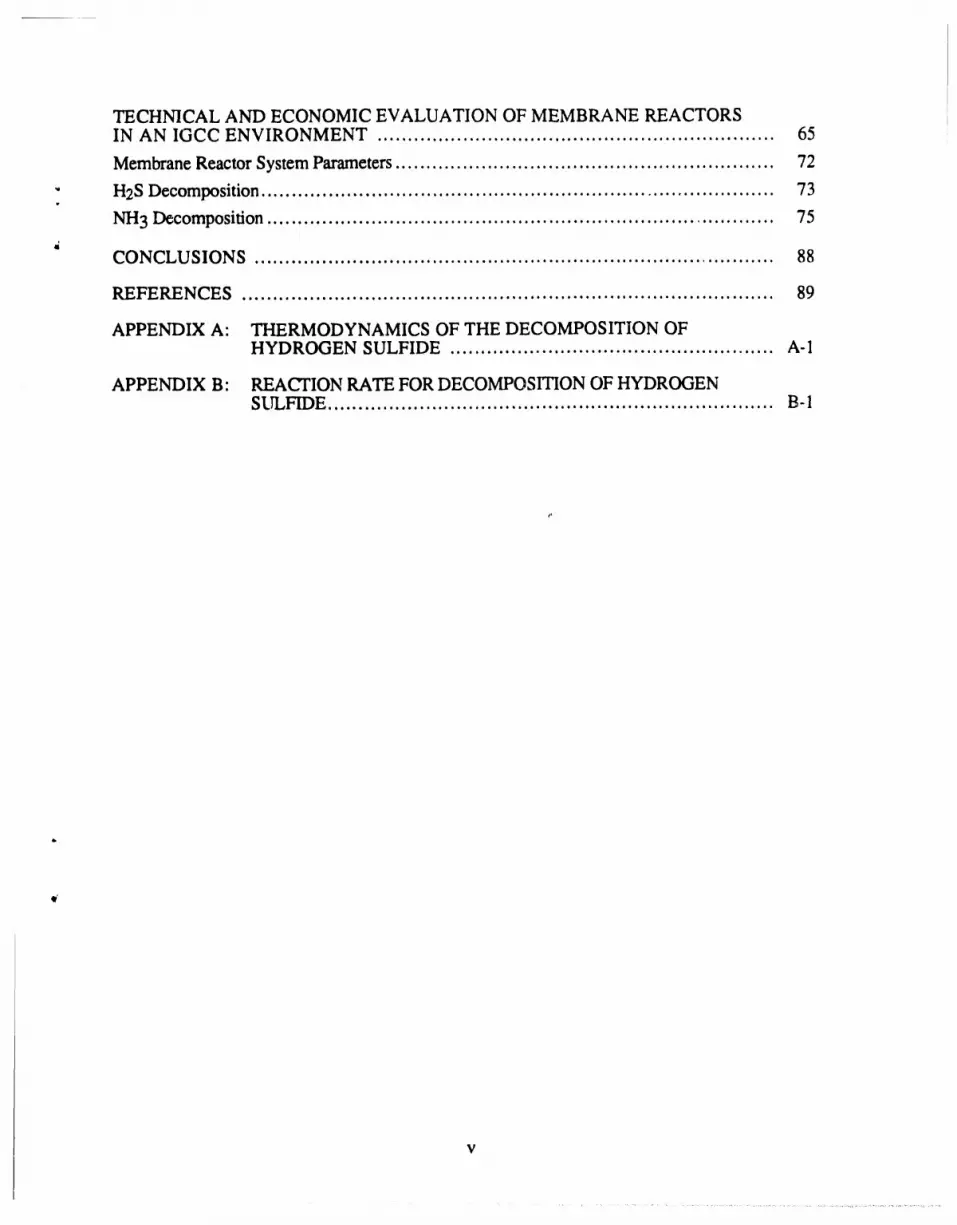
vi
22 Inorganic glaze on Refractron disk ....................................................... 54
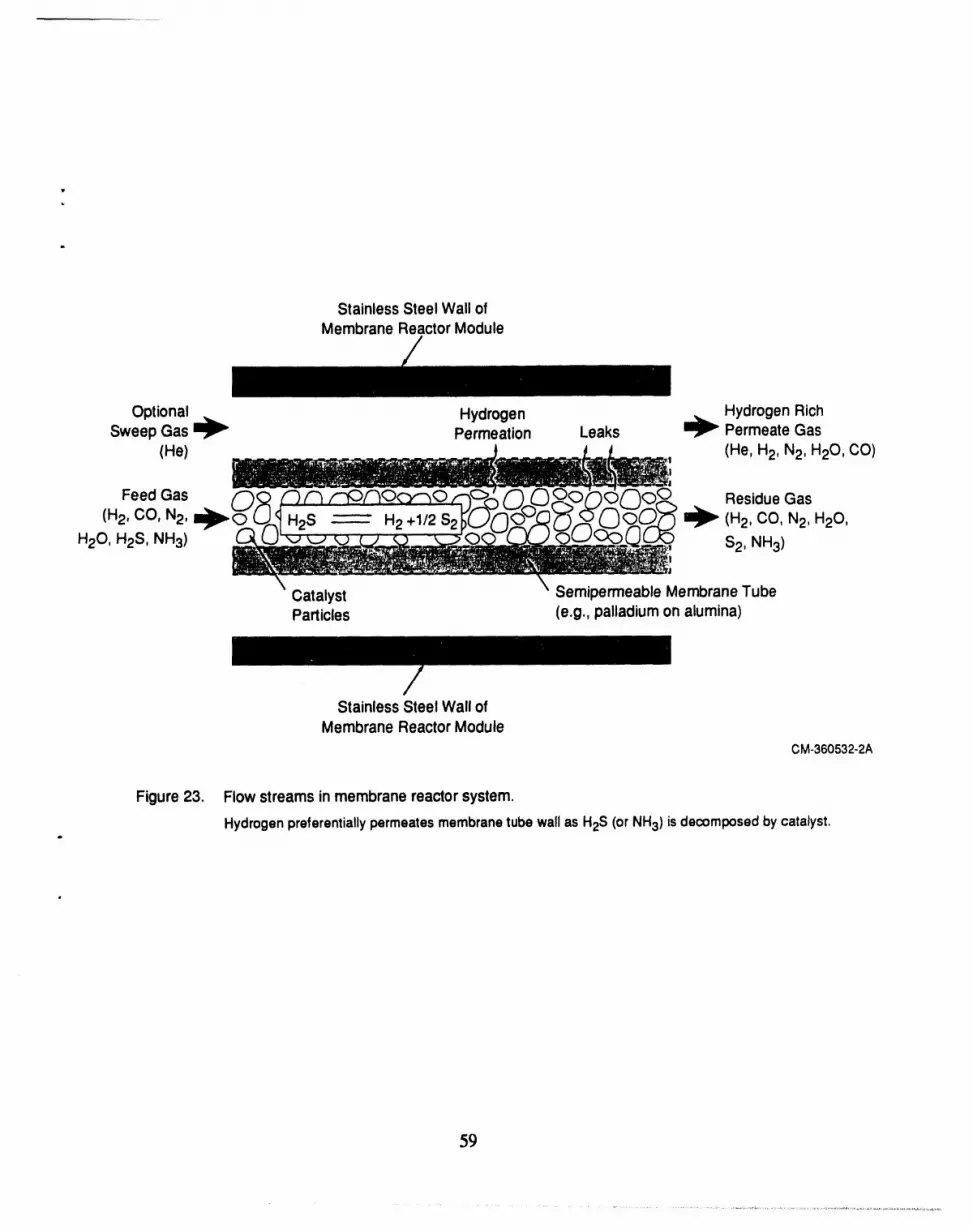
23 Flow streams in membrane reactor system ............................................. 59
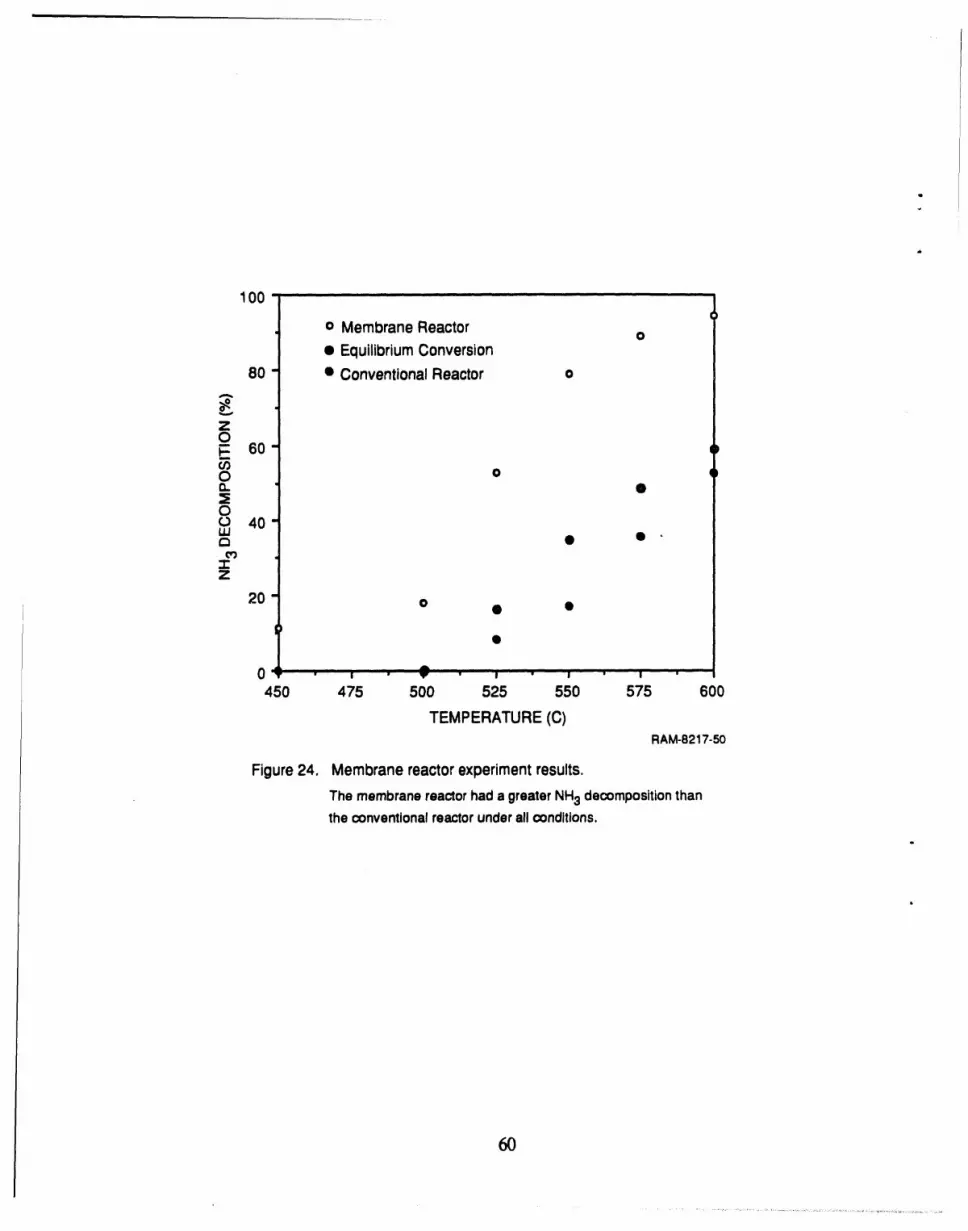
24 Membrane reactor experiment results ..................................................... 60 l
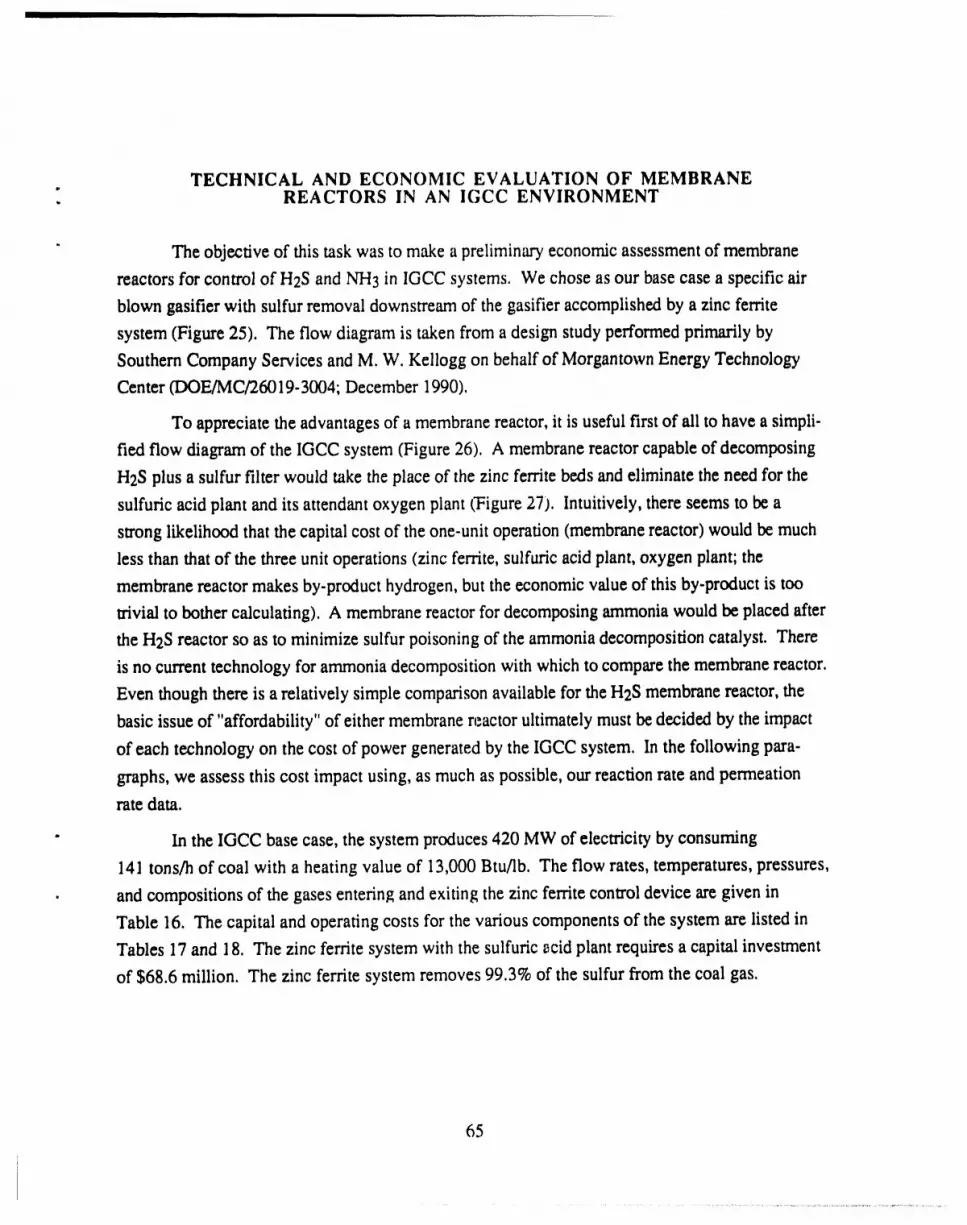
25 Block flow diagram of IGCC base case ................................................ 66
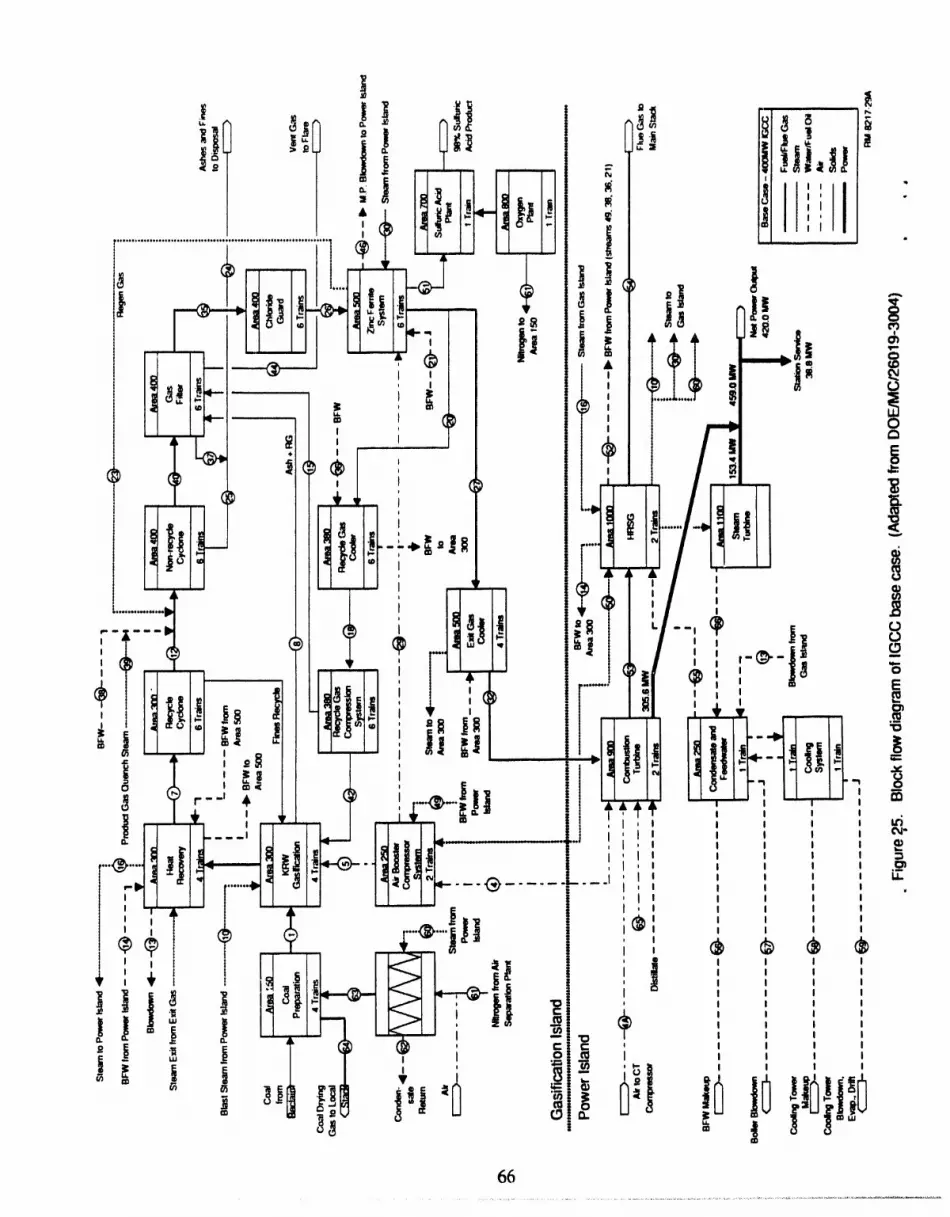
26 Simplified flow diagram of conventional IGCC technology ......................... 67
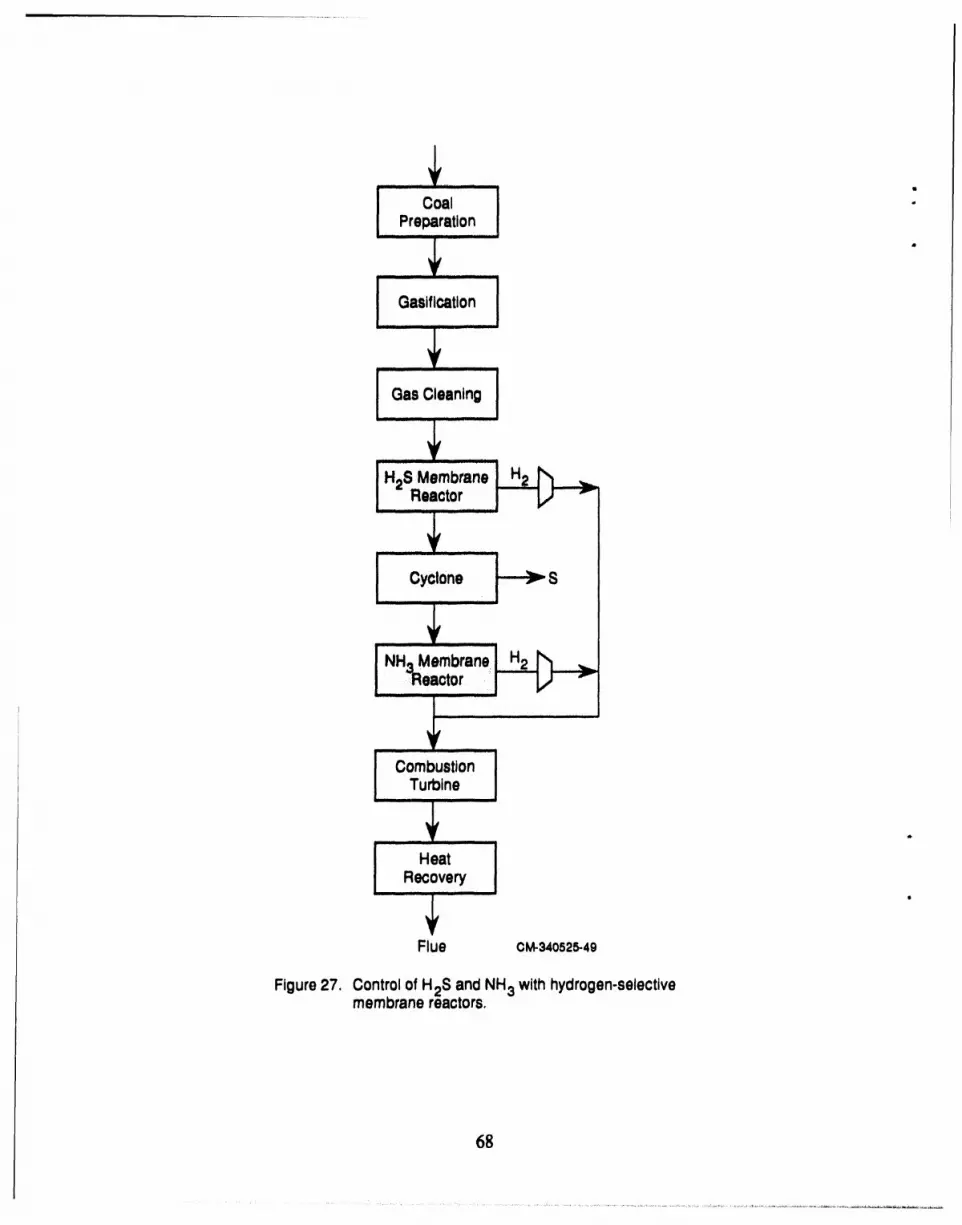
27 Control of H2S and NH3 with hydrogen-selective membrane reactors ........... 68
28 Effect of reactor temperature on decomposition of H2S ............................. 74
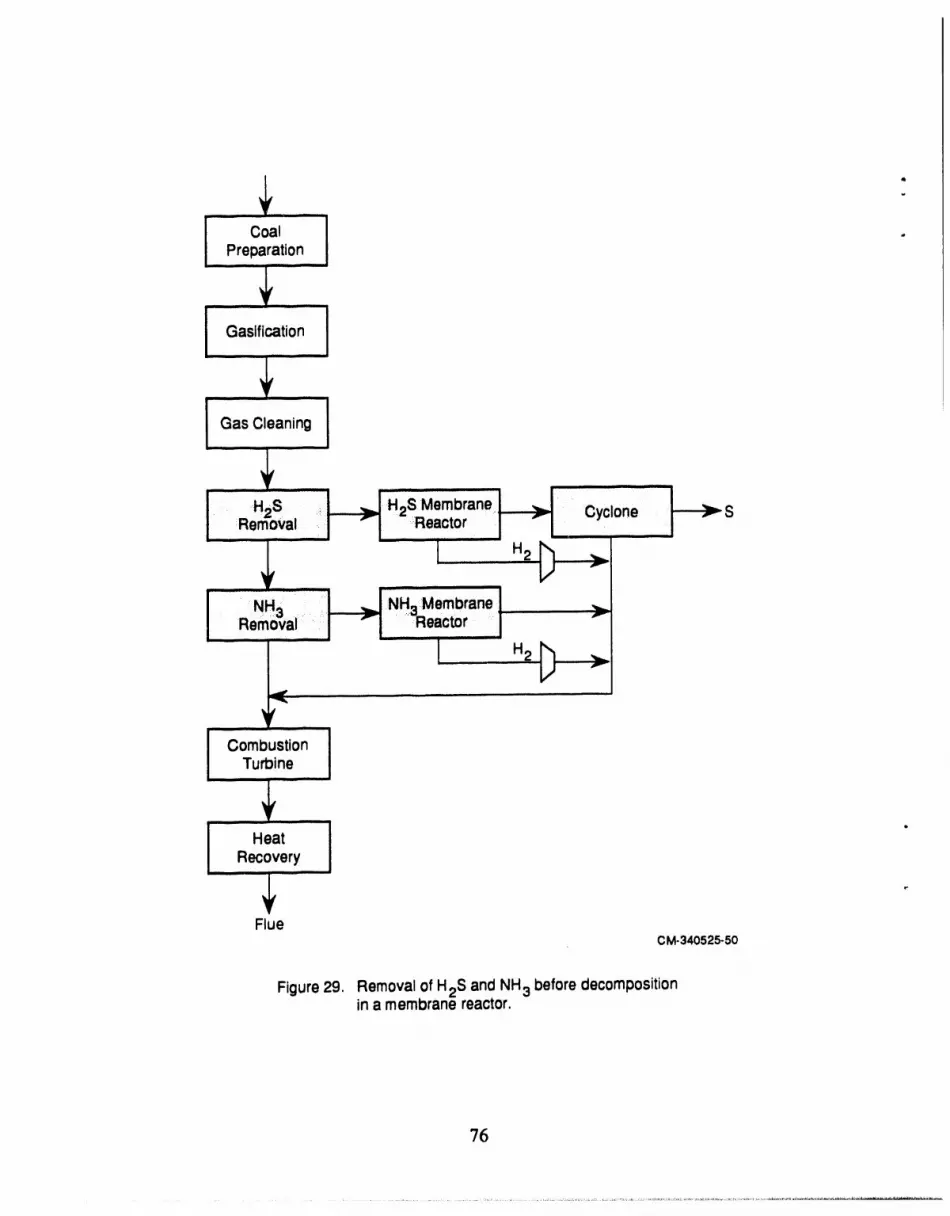
29 Removal of H2S and NH3 before decomposition in a membrane reactor ....... 76
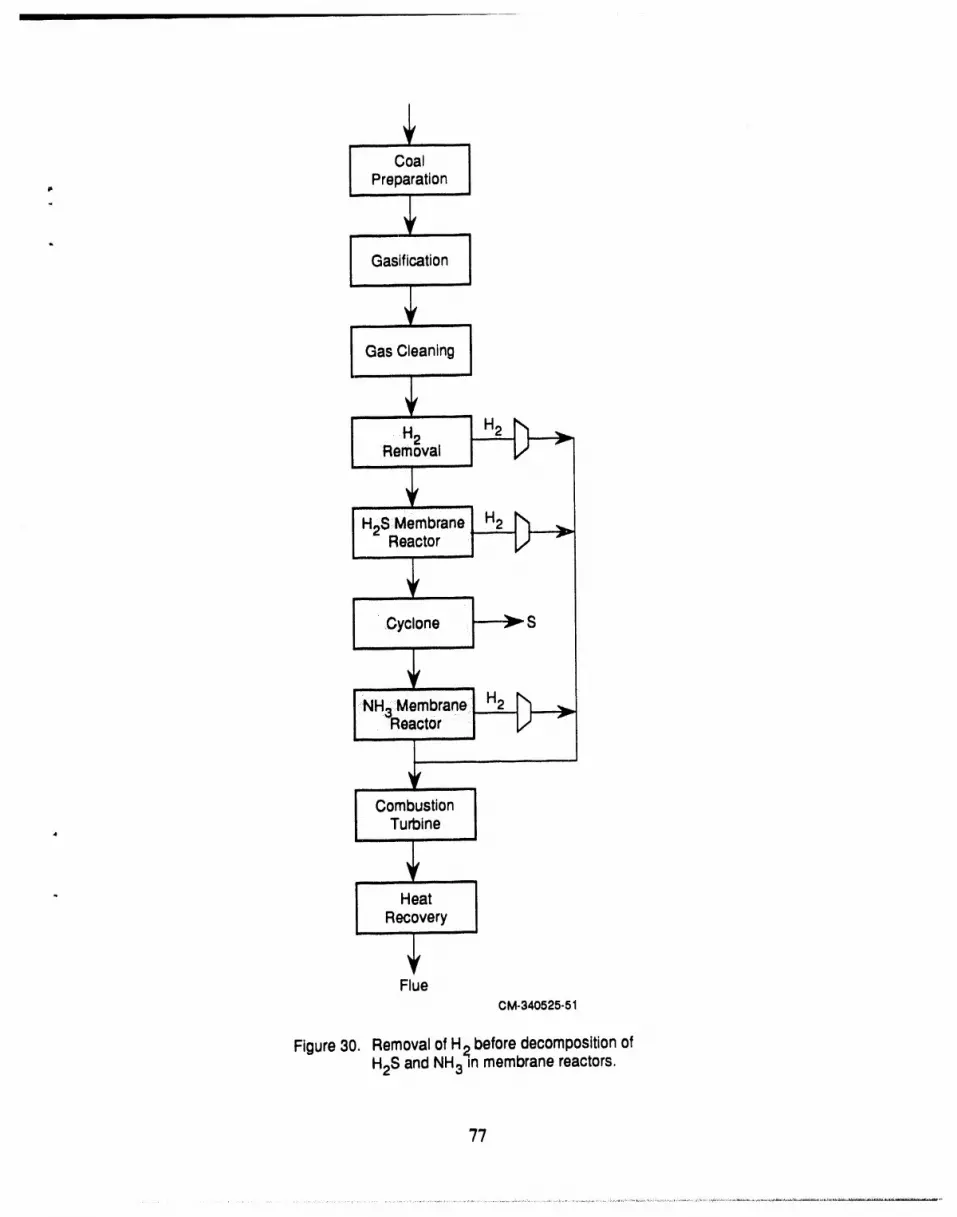
30 Removal of H2 before decomposition of H2S and NH3 inmembrane reactors ............................................................................ 77
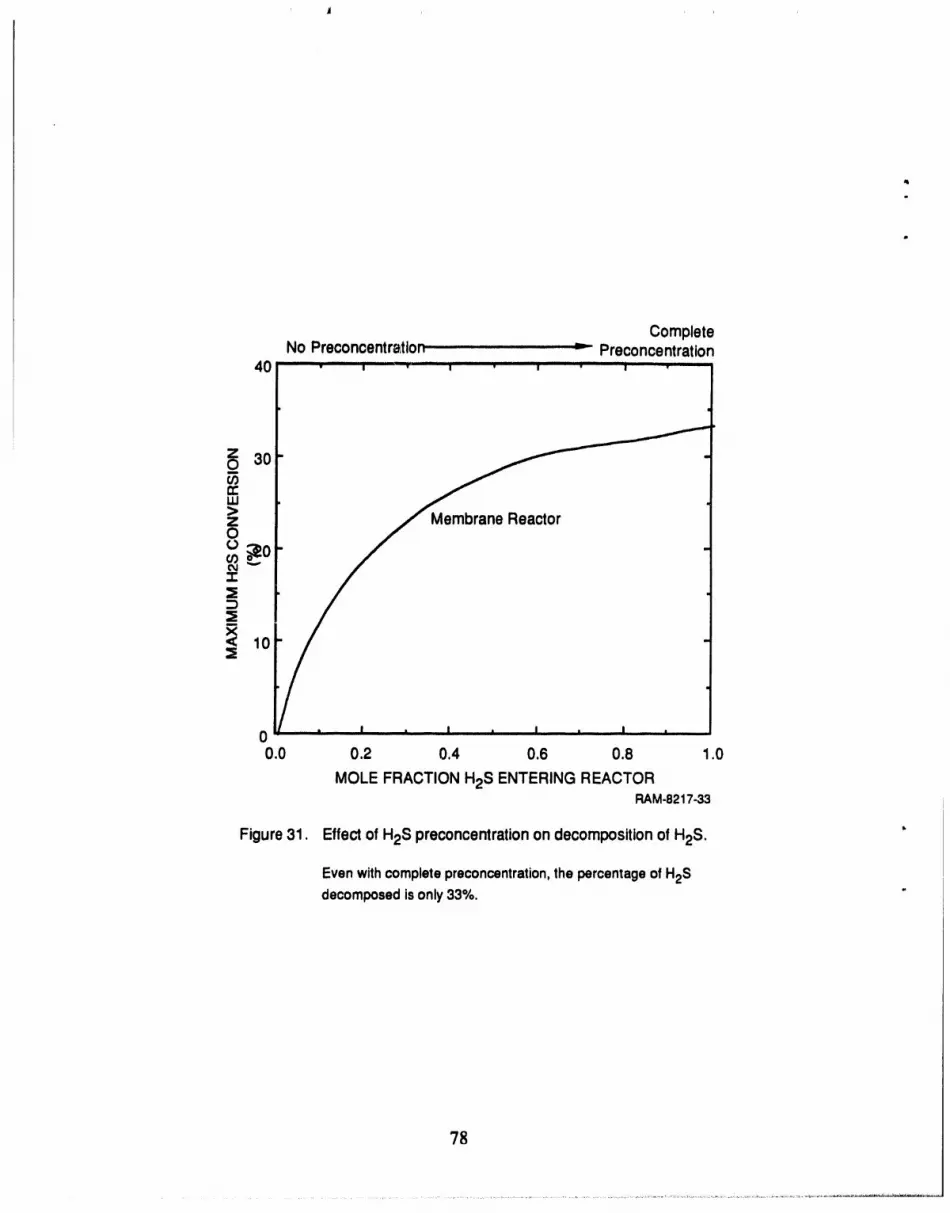
31 Effect of H2S preconcentration on decomposition of H2S .......................... 78
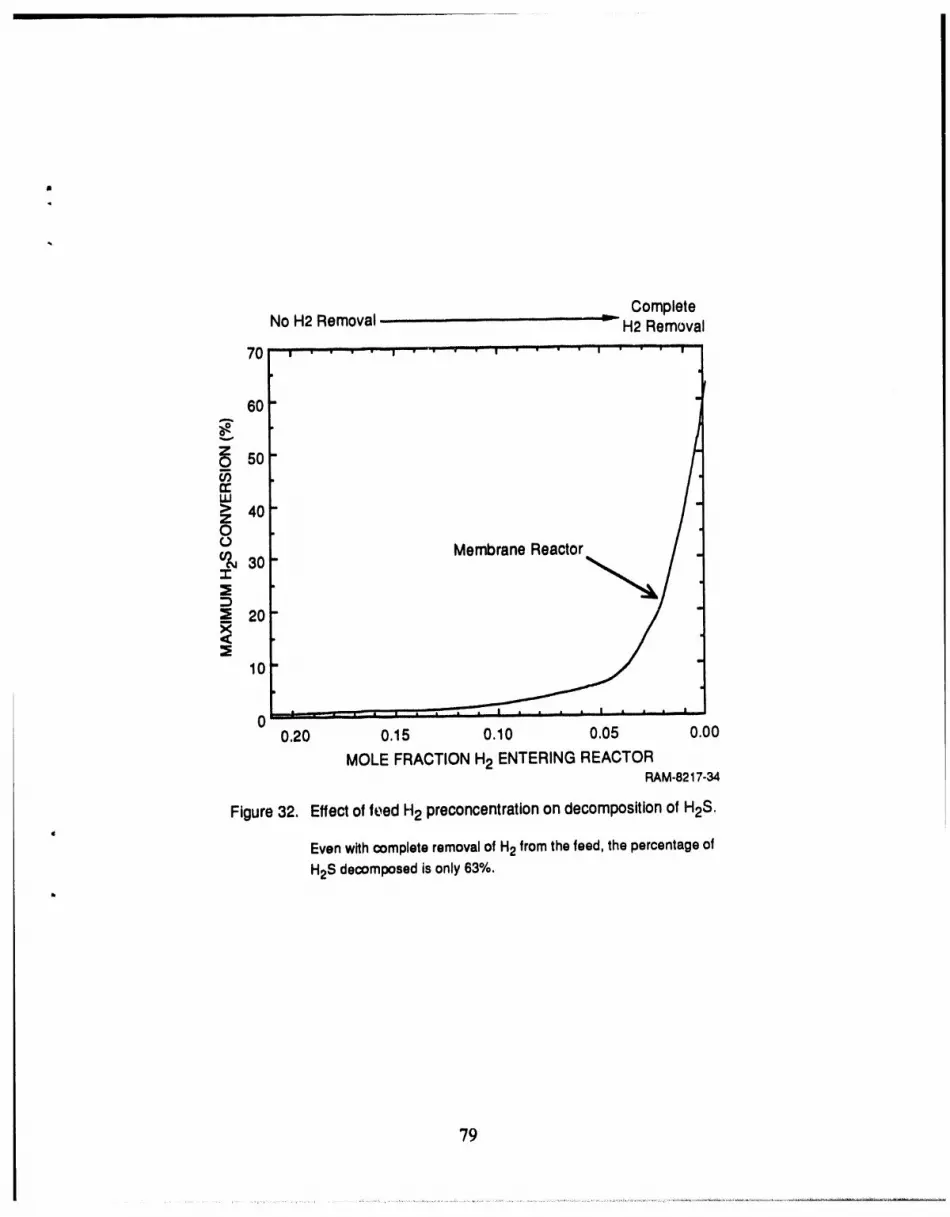
32 Effect of feed H2 preconcentration on decomposition of H2S ..................... 79
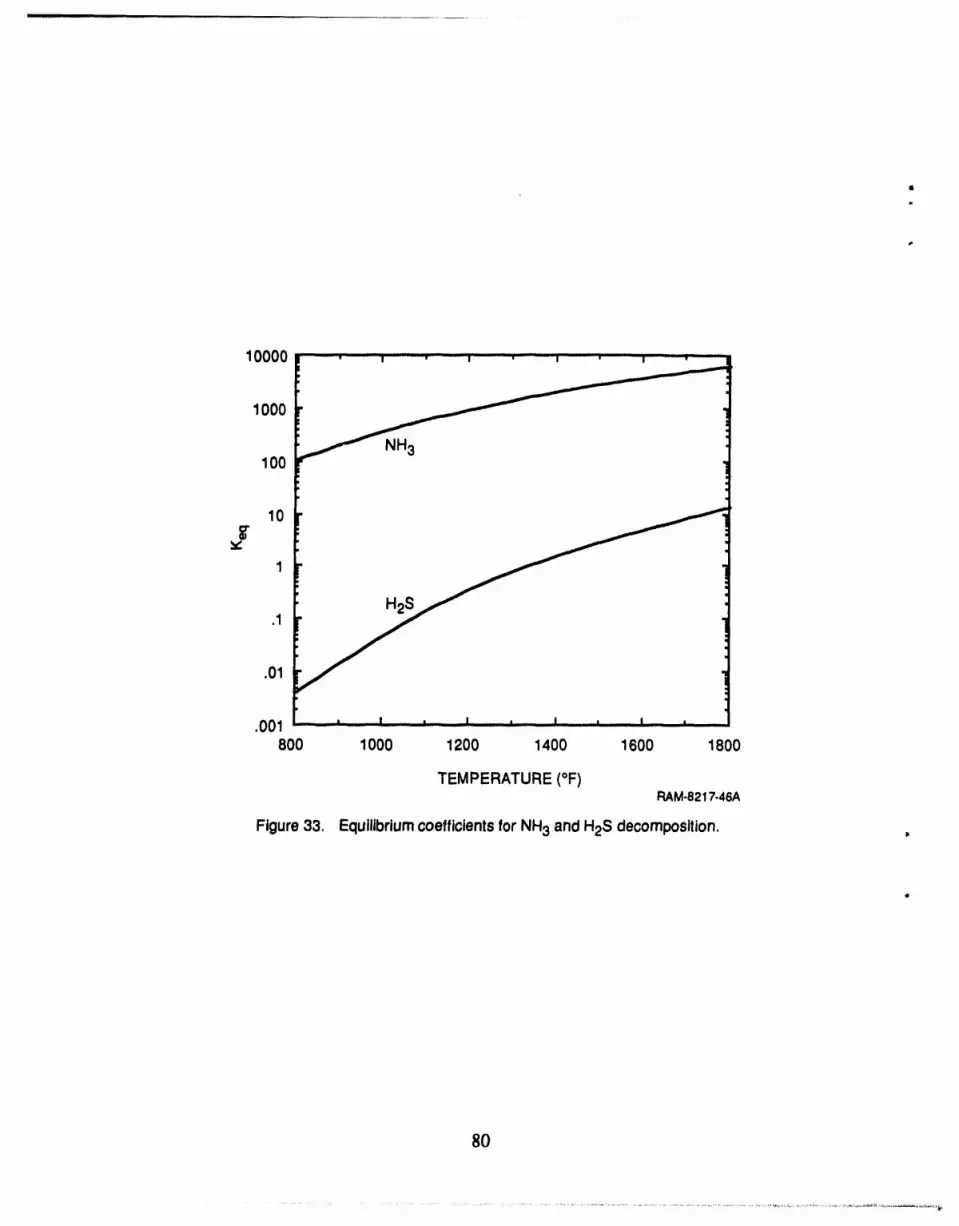
33 Equilibrium coefficients for NH3 and H2S decomposition .......................... 80
34 Ammonia decomposition with NH3 preconcentration ................................. 81
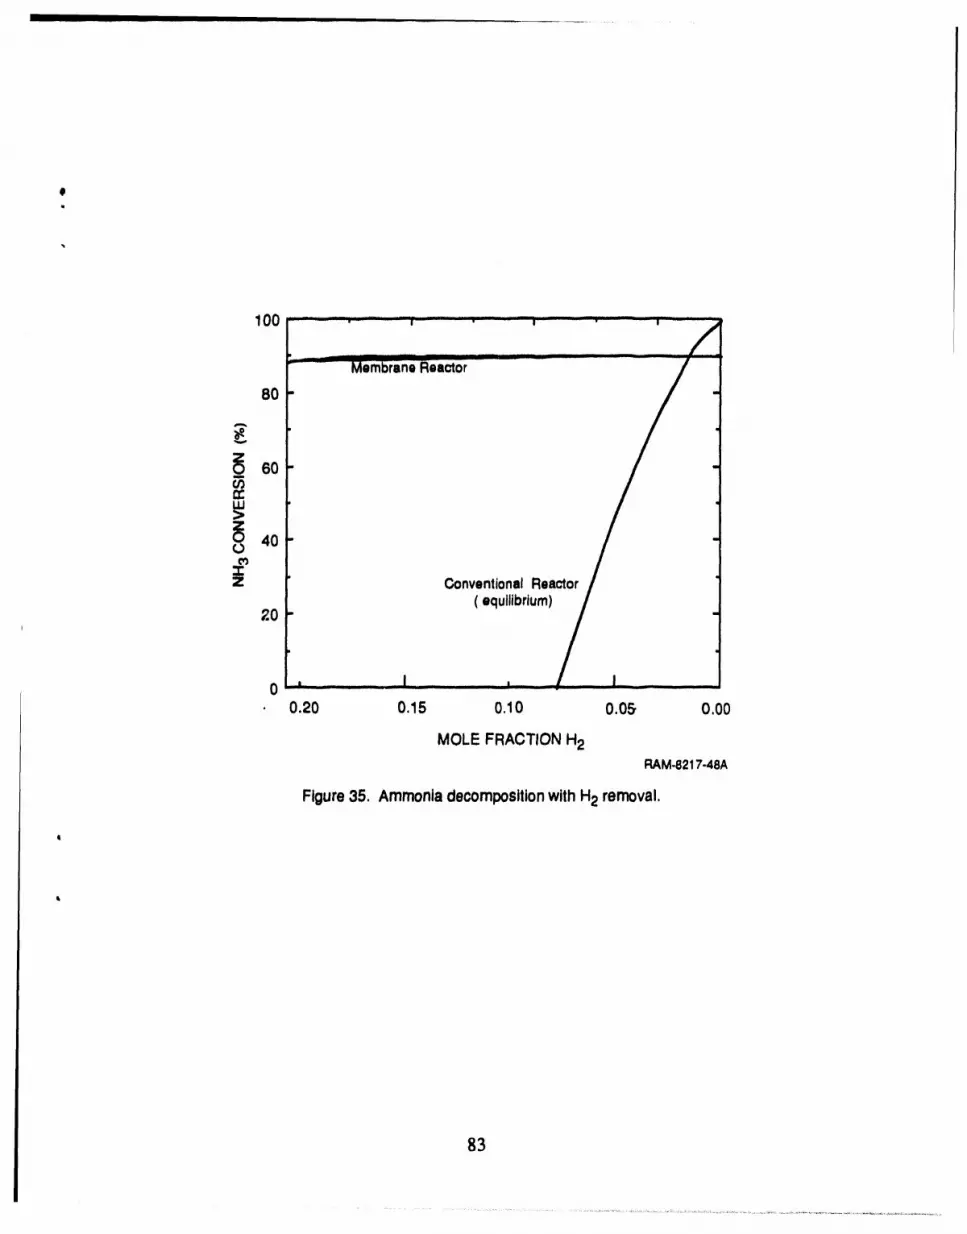
35 Ammonia decomposition with H2 removal .............................................. 83
36 Effect of ammonia preconcentration on membrane reactor cost .................... 84
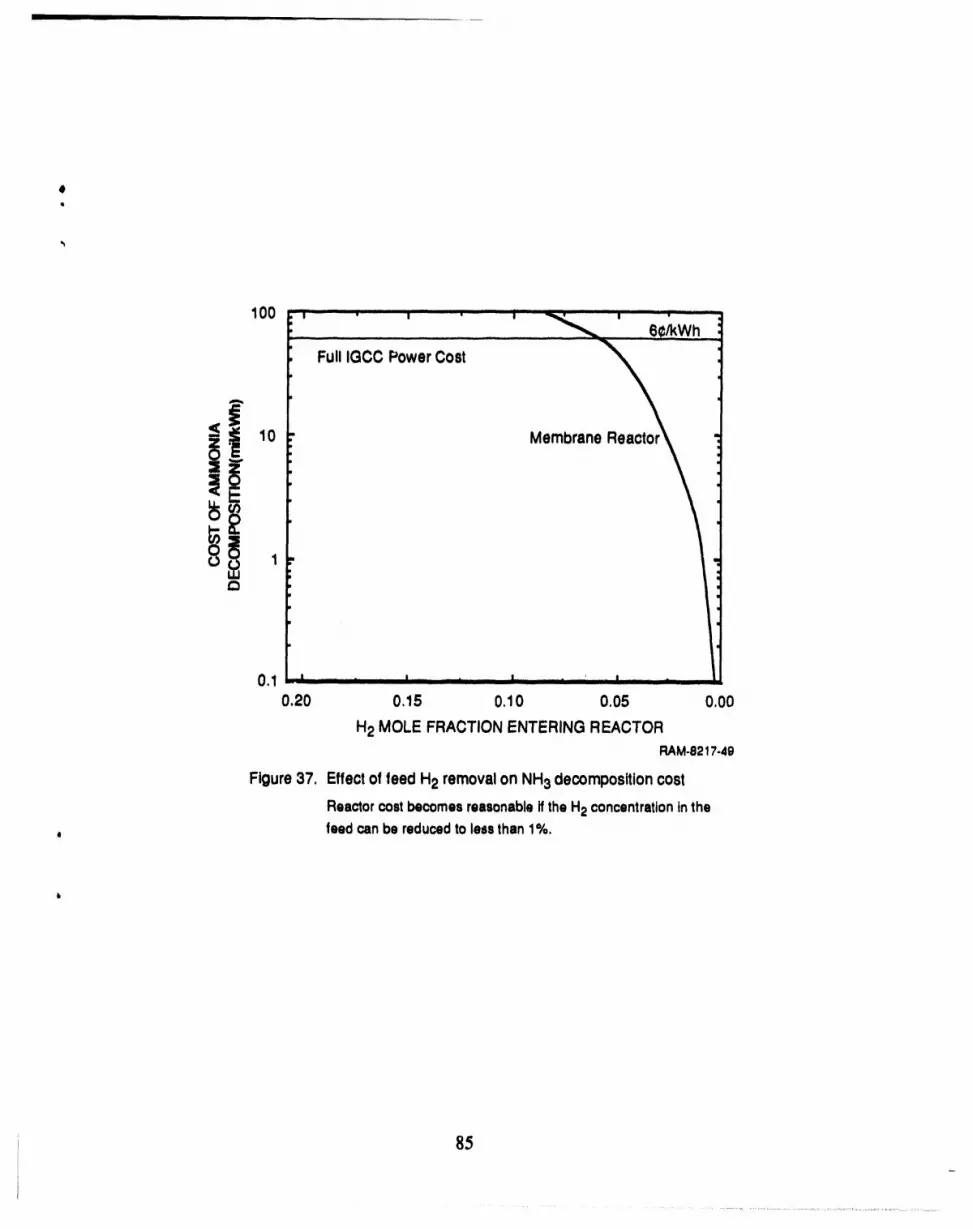
37 Ammonia removal cost with H2 removal ............................................... 85
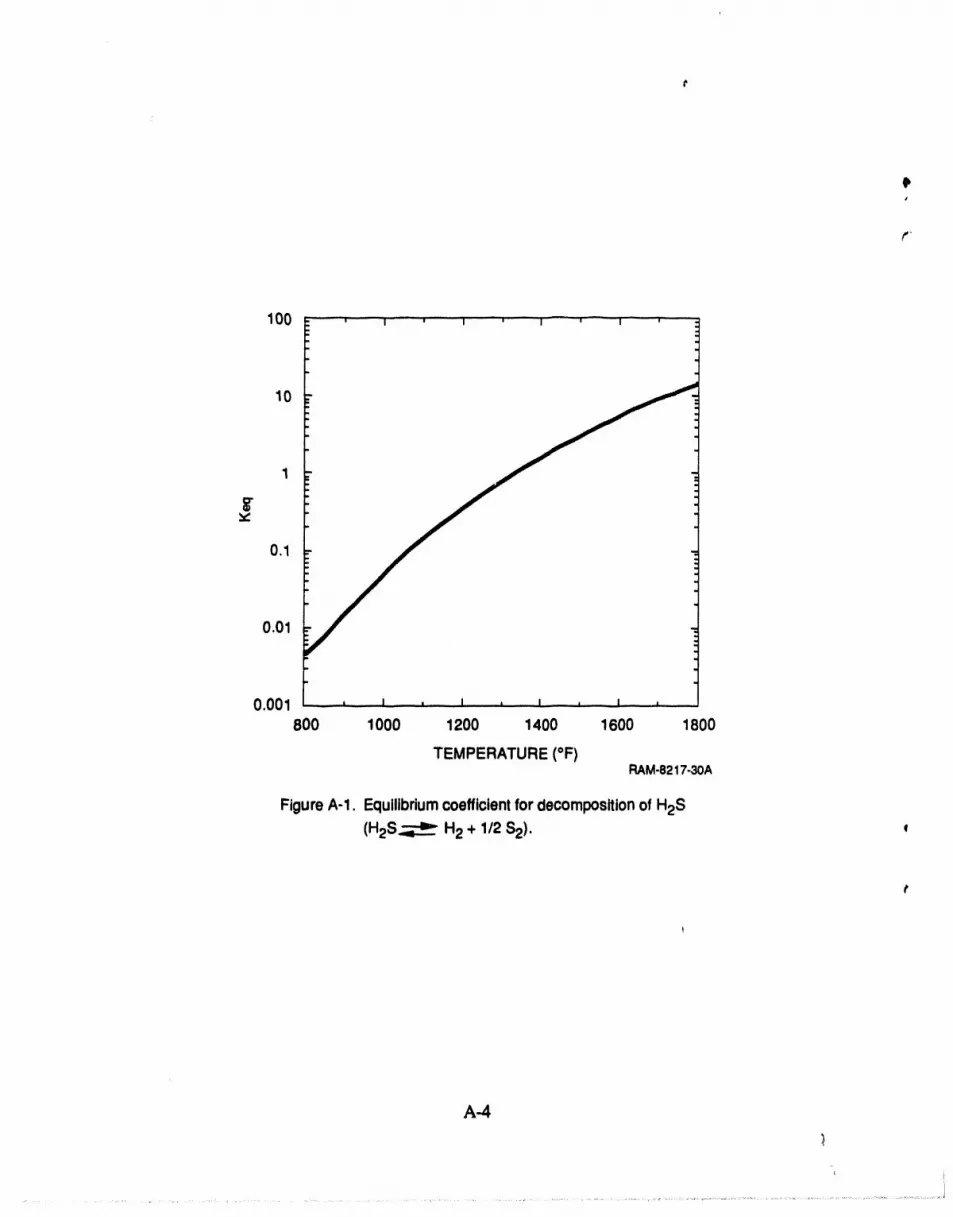
A-1 Equilibrium coefficient for decomposition of H2S .................................... A-4
2 Commercially Available Porous InorganicMembranes .............................. 5
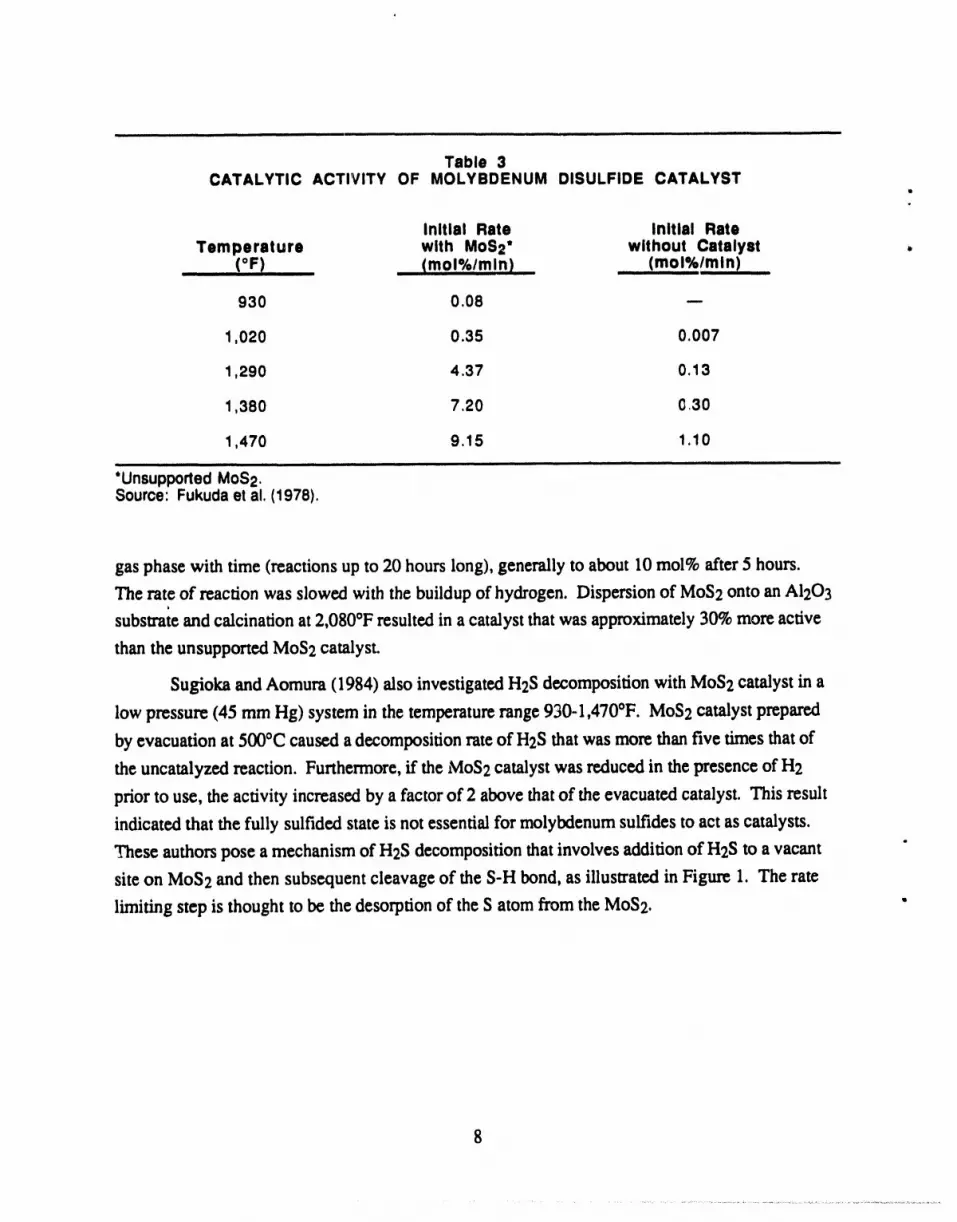
3 Catalytic Activity of Molybdenum Disulfide Catalyst ................................ 8
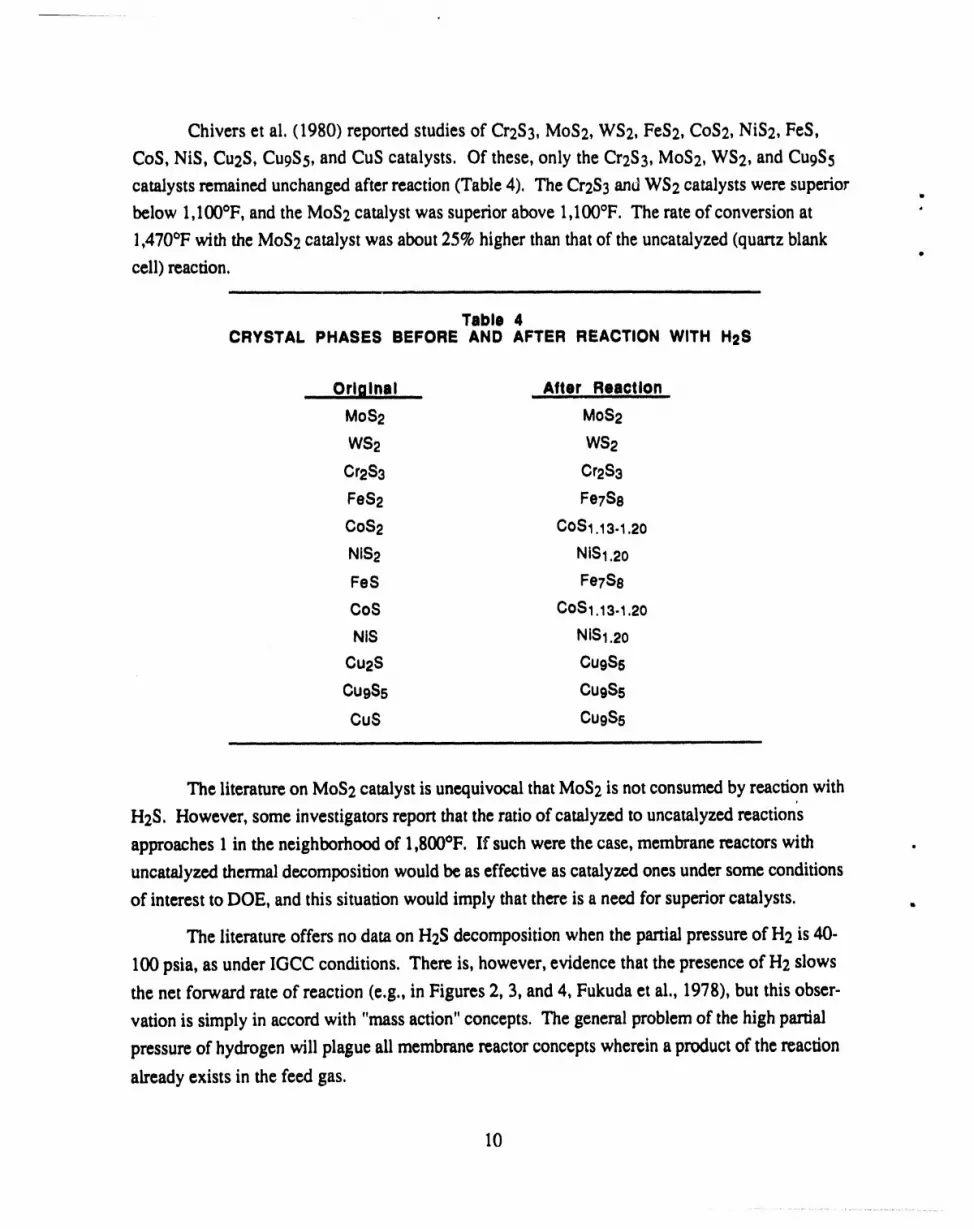
4 Crystal Phases Before and After Reaction with H2S ............................... 10
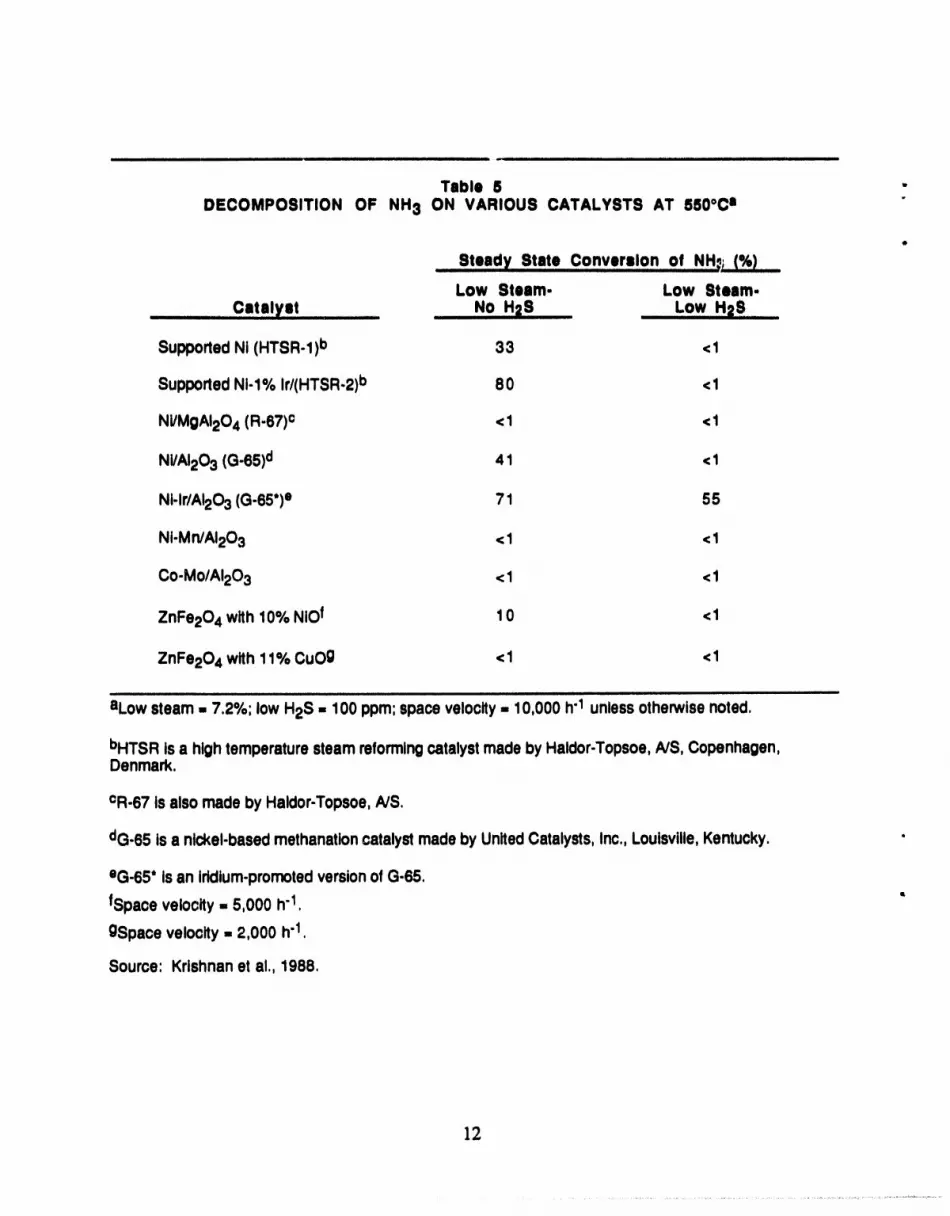
5 Decomposition of NH3 on Various Catalysts at 550°C ............................ 12
6 Decomposition of NH3 on Various Catalysts at 800°C ............................ 13
7 Data Used to Determine H2S Reaction Rate Coefficient ............................. 21
8 Comparison of Permeation Rates of Hydrogen Through Commercialand Laboratory Membranes ................................................................. 33
9 Membranes Used in Permeation Experiments .......................................... 39
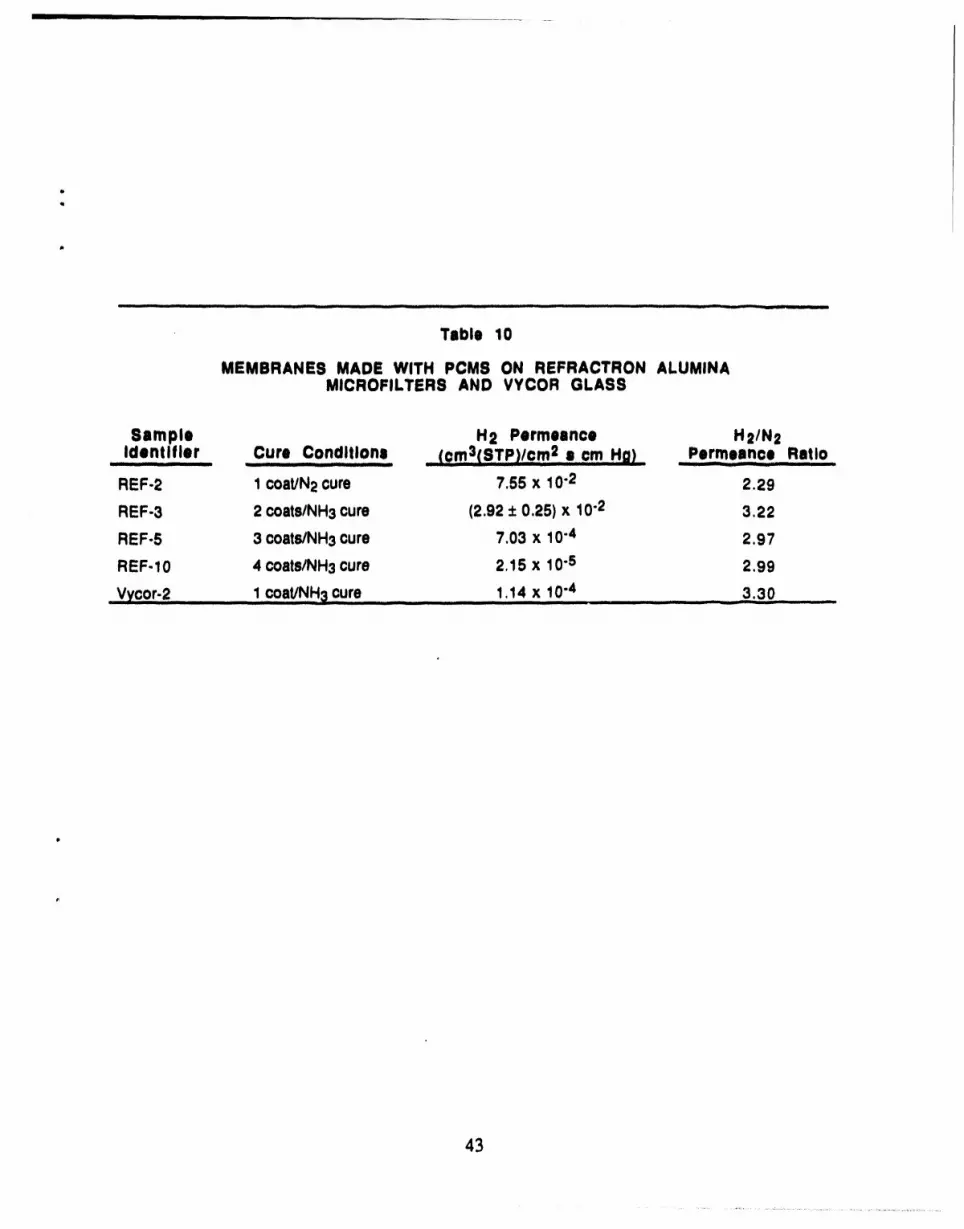
10 Membranes Made with PCMS on Refractron Alumina Microfiltersand Vycor Glass ............................................................................. 43
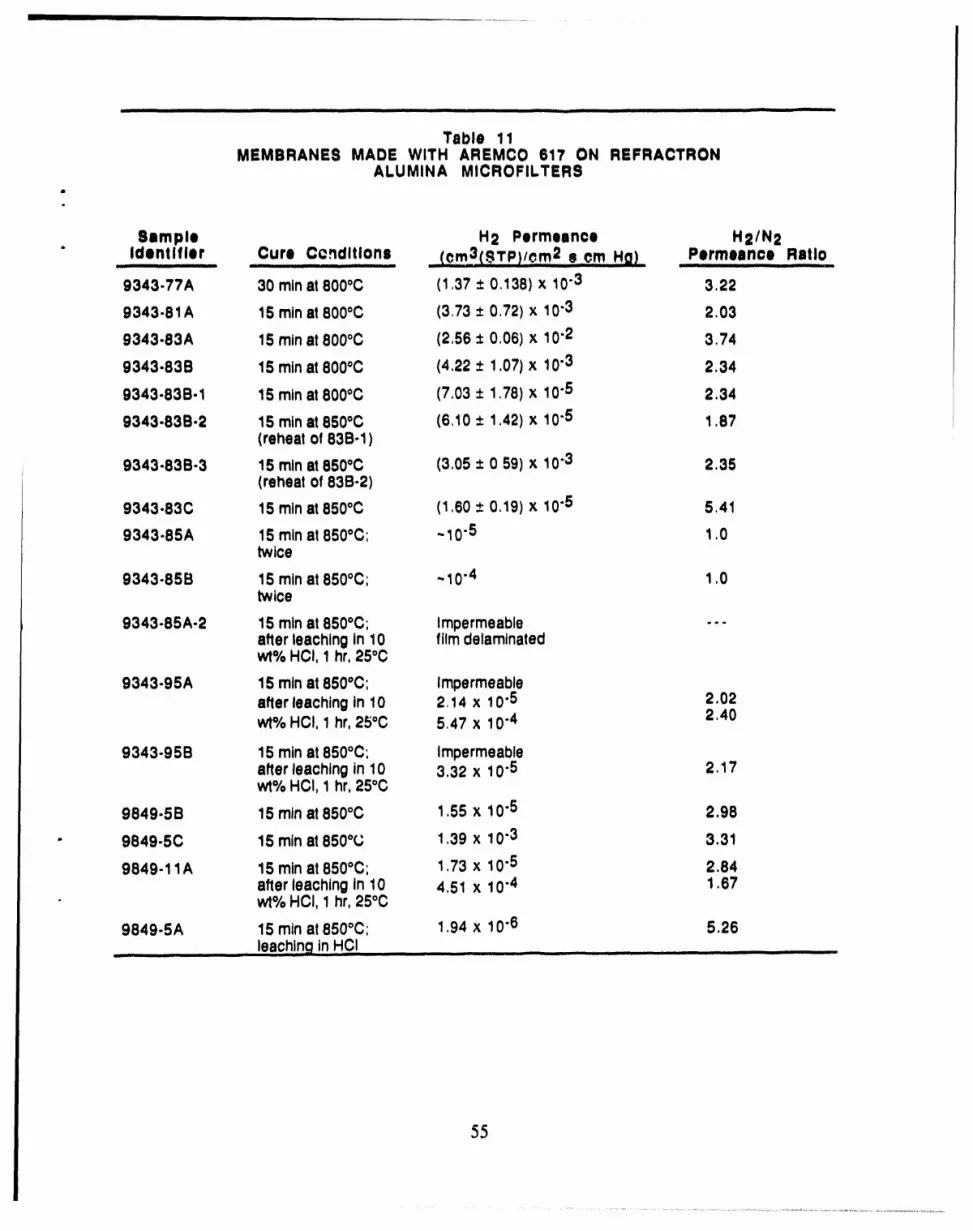
11 Membranes Made with Aremco 617 on RefractronAluminaMicrofilters......................................................................... 55
12 Properties of Various Batches of Aremco 617 ........................................ 56
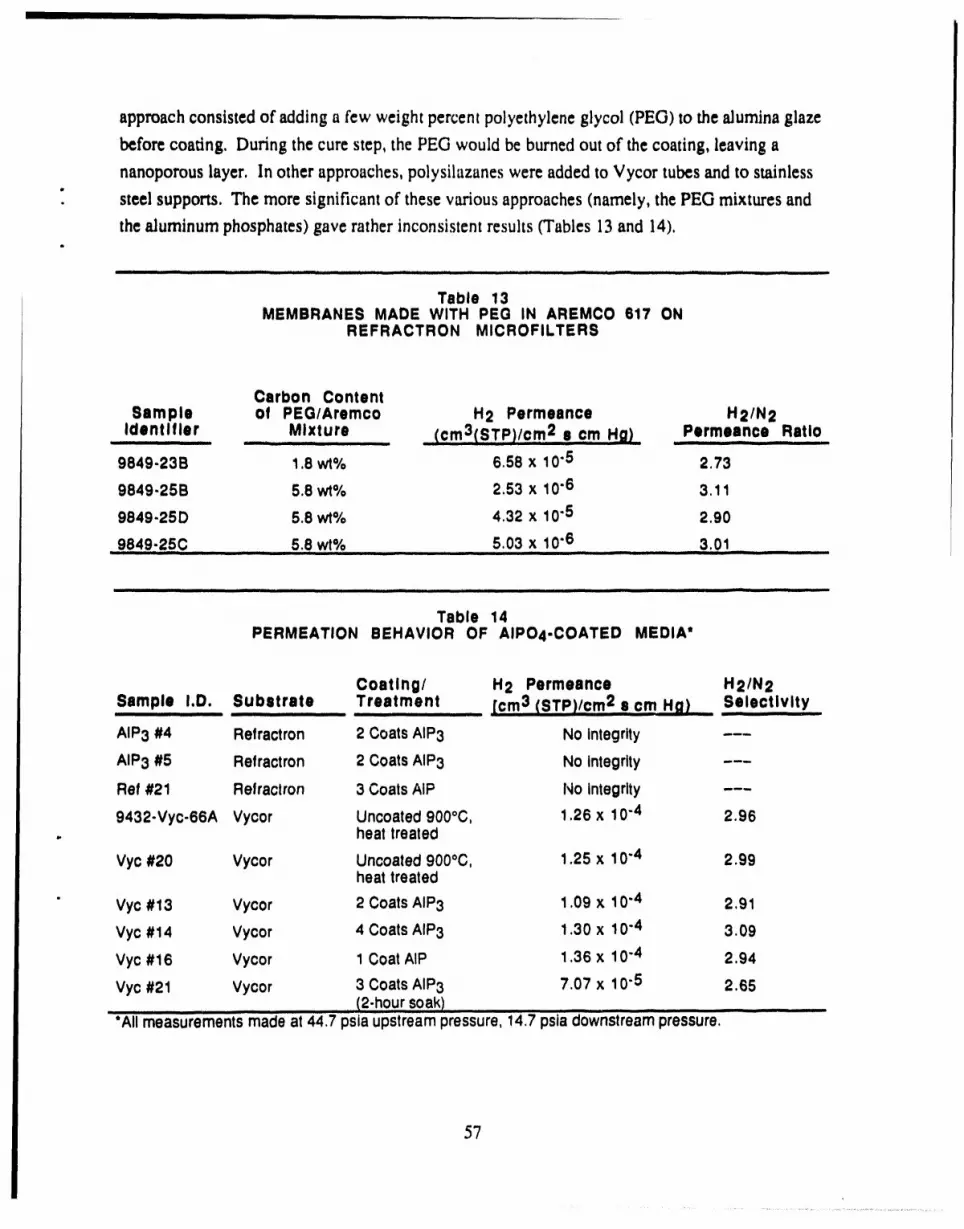
13 Membranes Made with PEG in Aremco 617 on Refractron Microfilters ......... 57
14 Permeation Behavior of AlPO4-Coated Media.......................................... 57
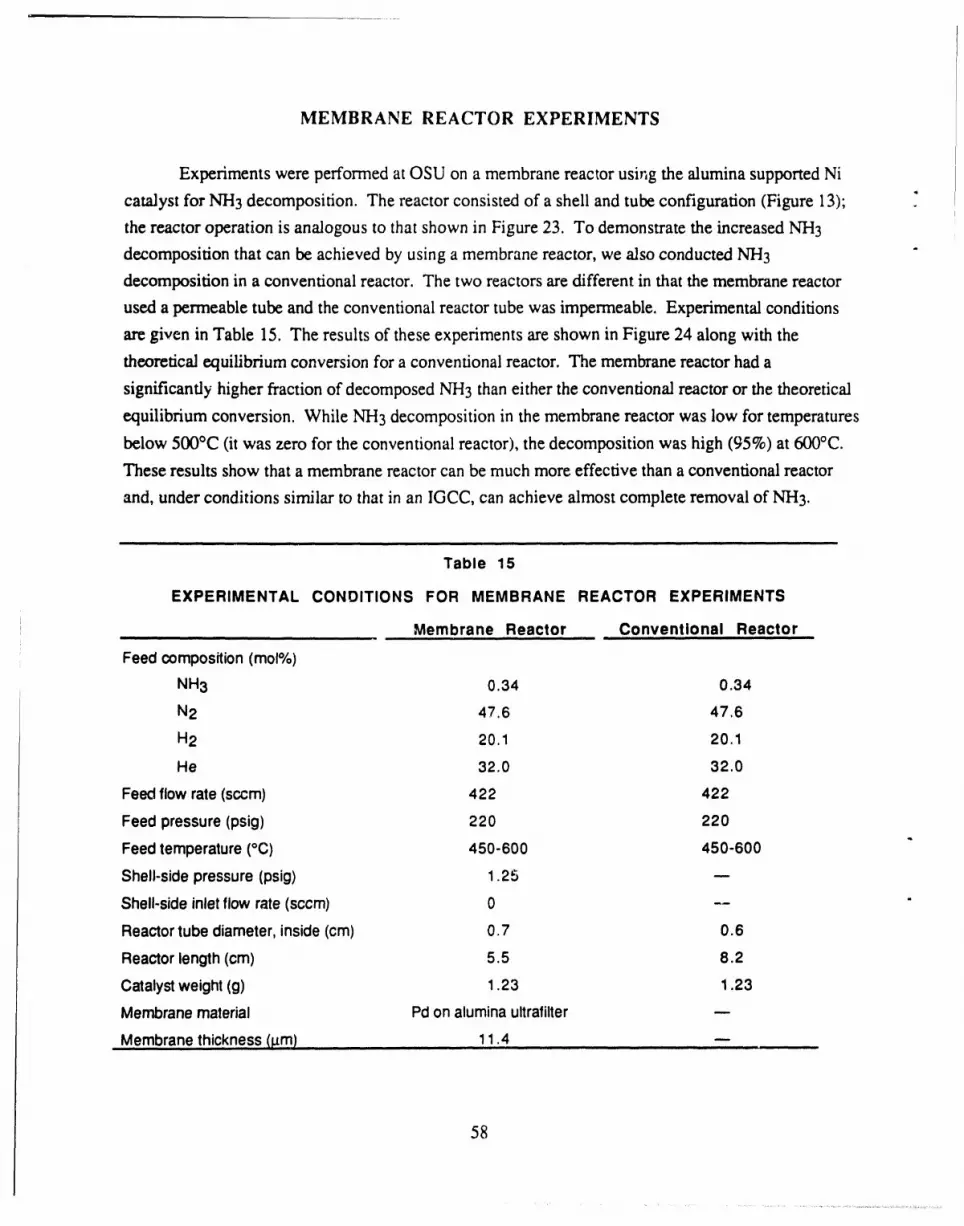
15 ExperimentalConditions for MembraneReactorExperiments ....................... 58..p
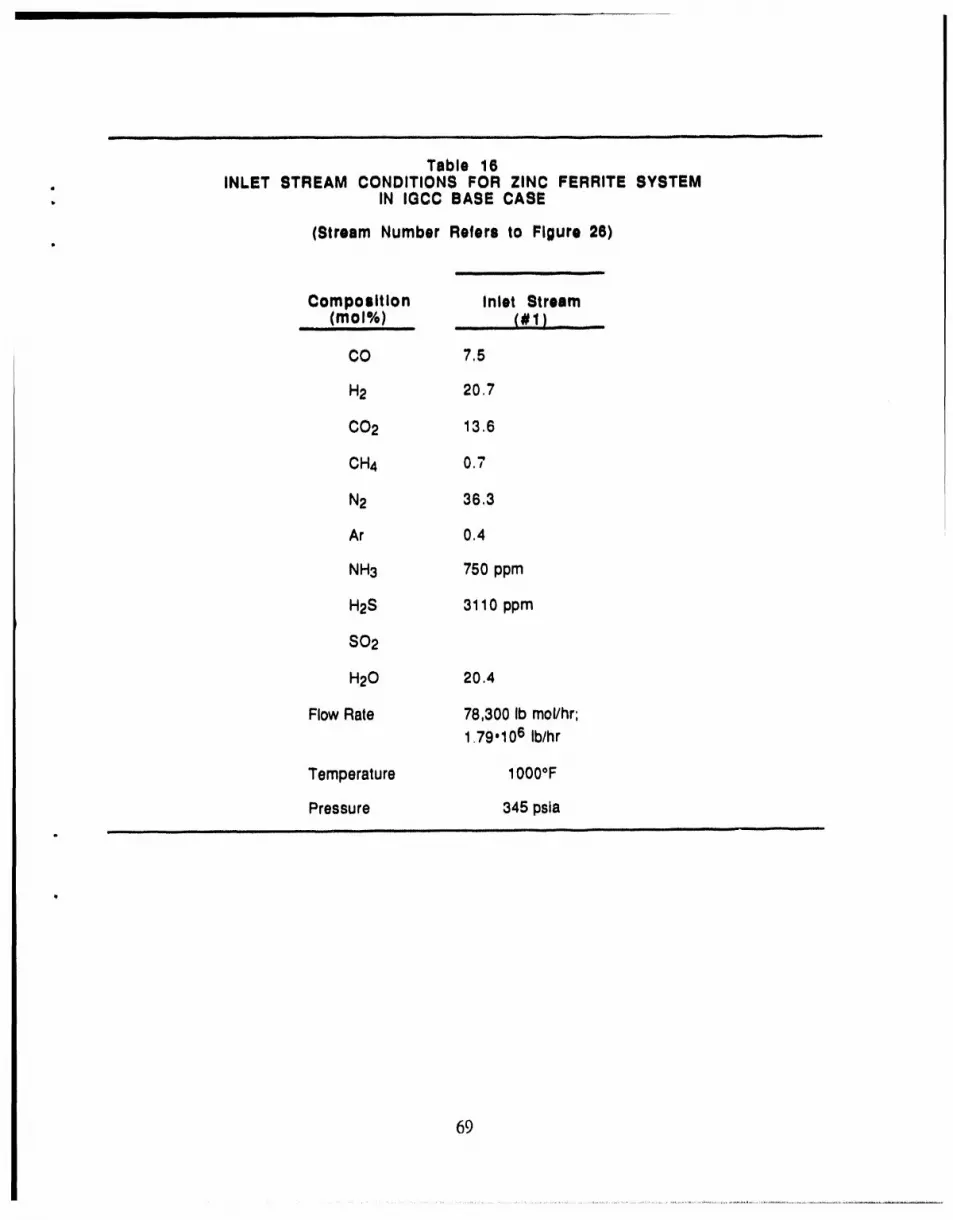
16 Inlet Stream Conditions for Zinc Ferrite System in IGCC Base Case ........... 69
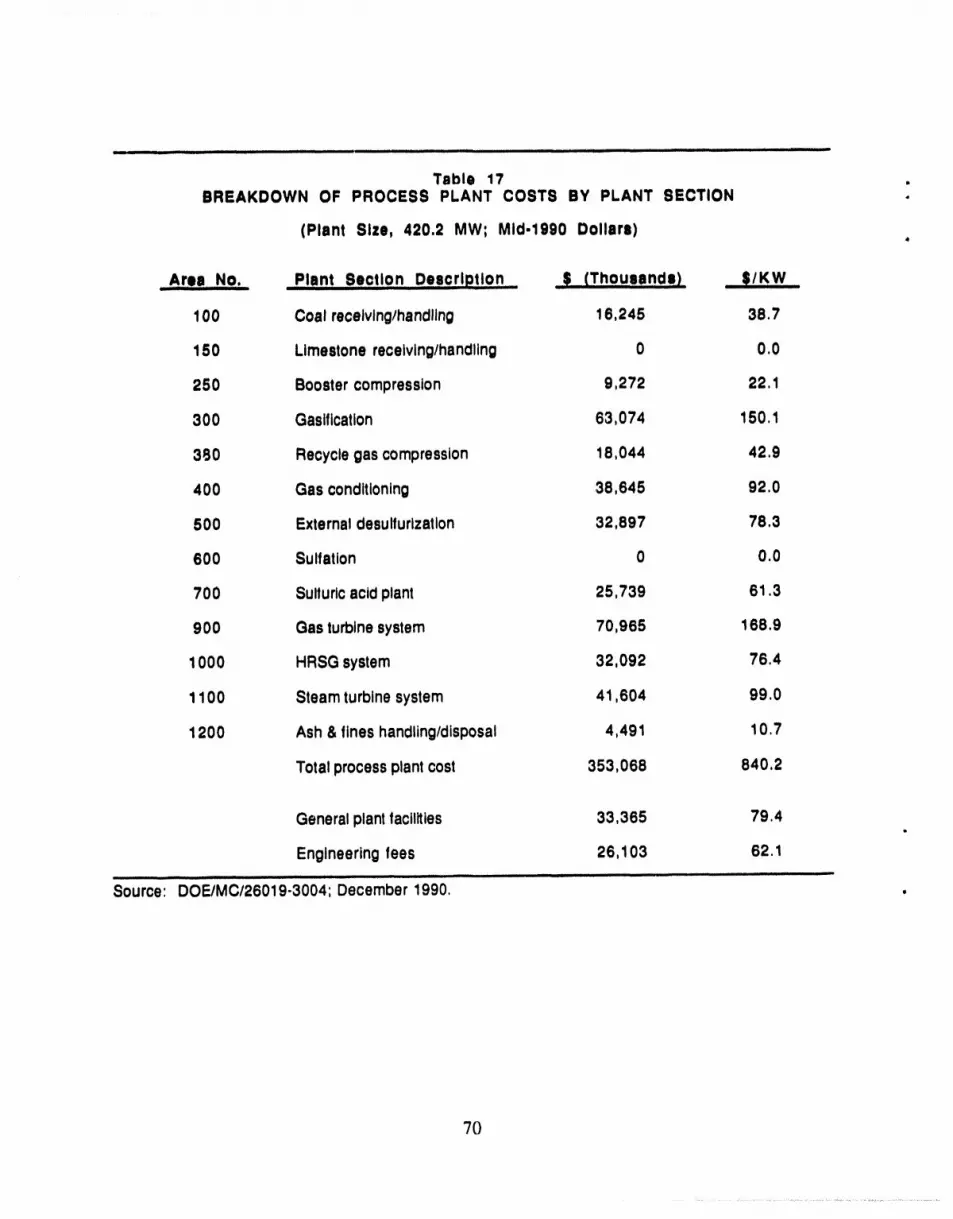
17 Breakdown of Process Plant Costs by Plant Section ................................ 70 O
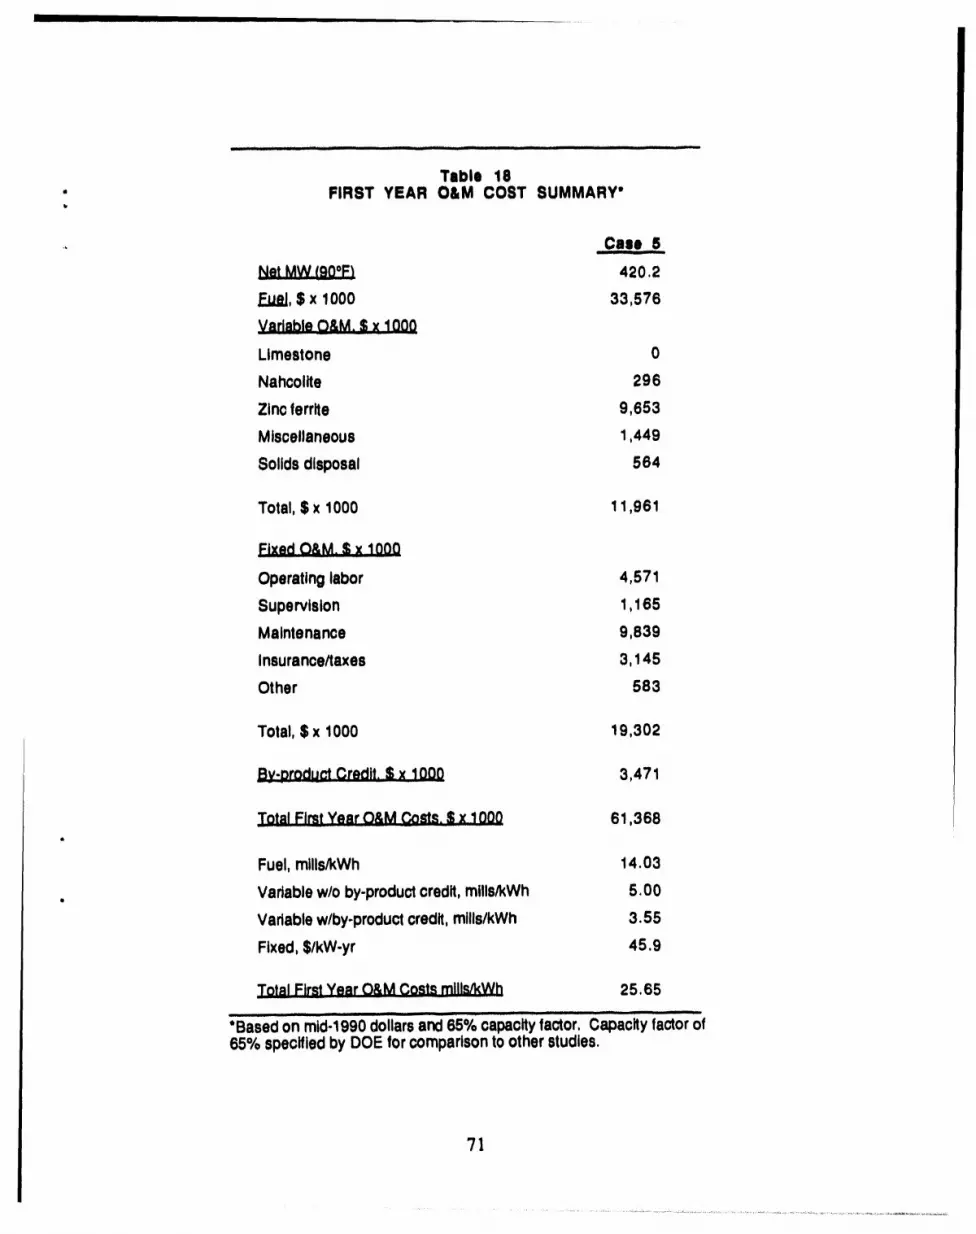
18 First Year O&M Cost Summary .......................................................... 71
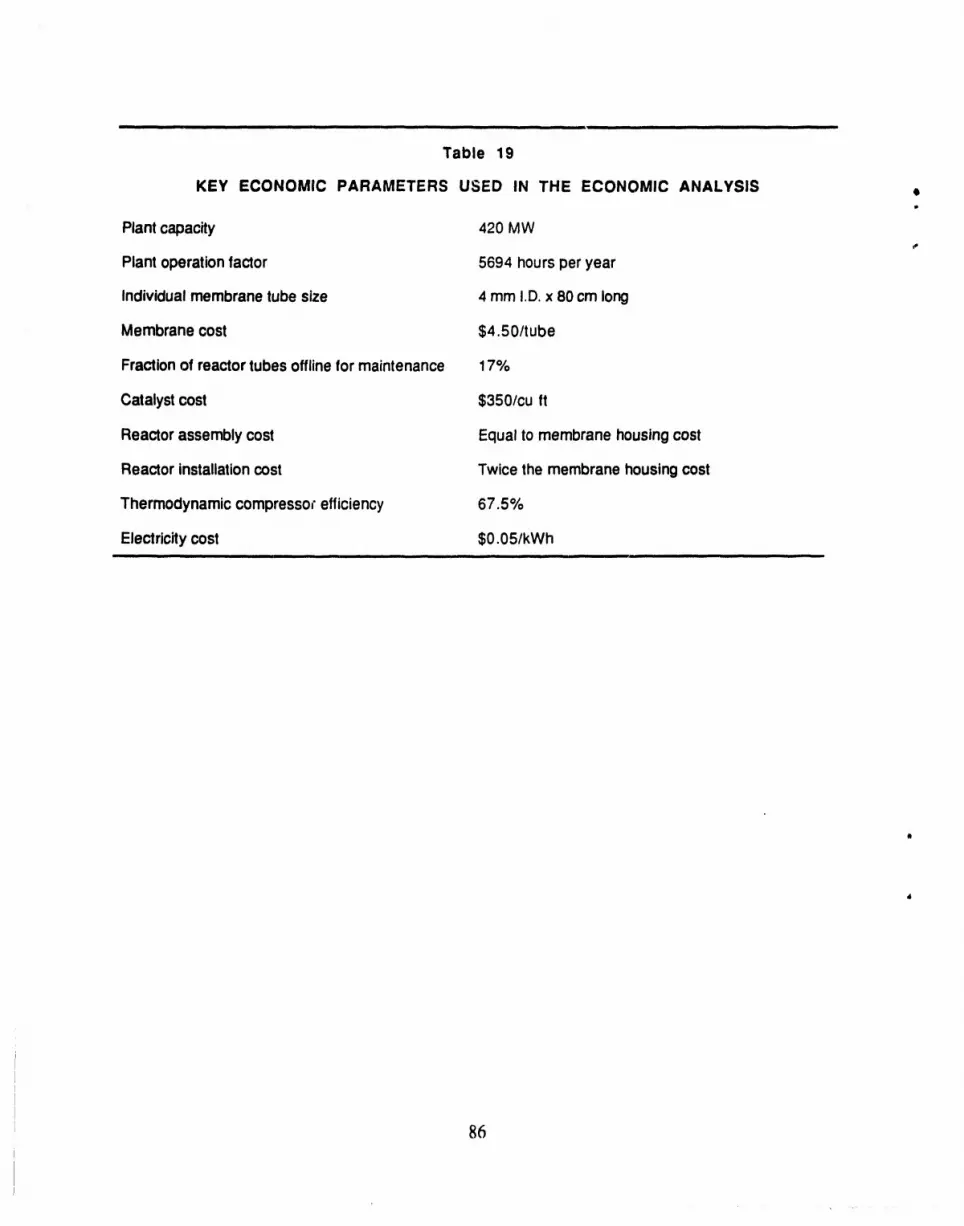
19 Key Economic ParametersUsed in the Economic Analysis ........................ 86
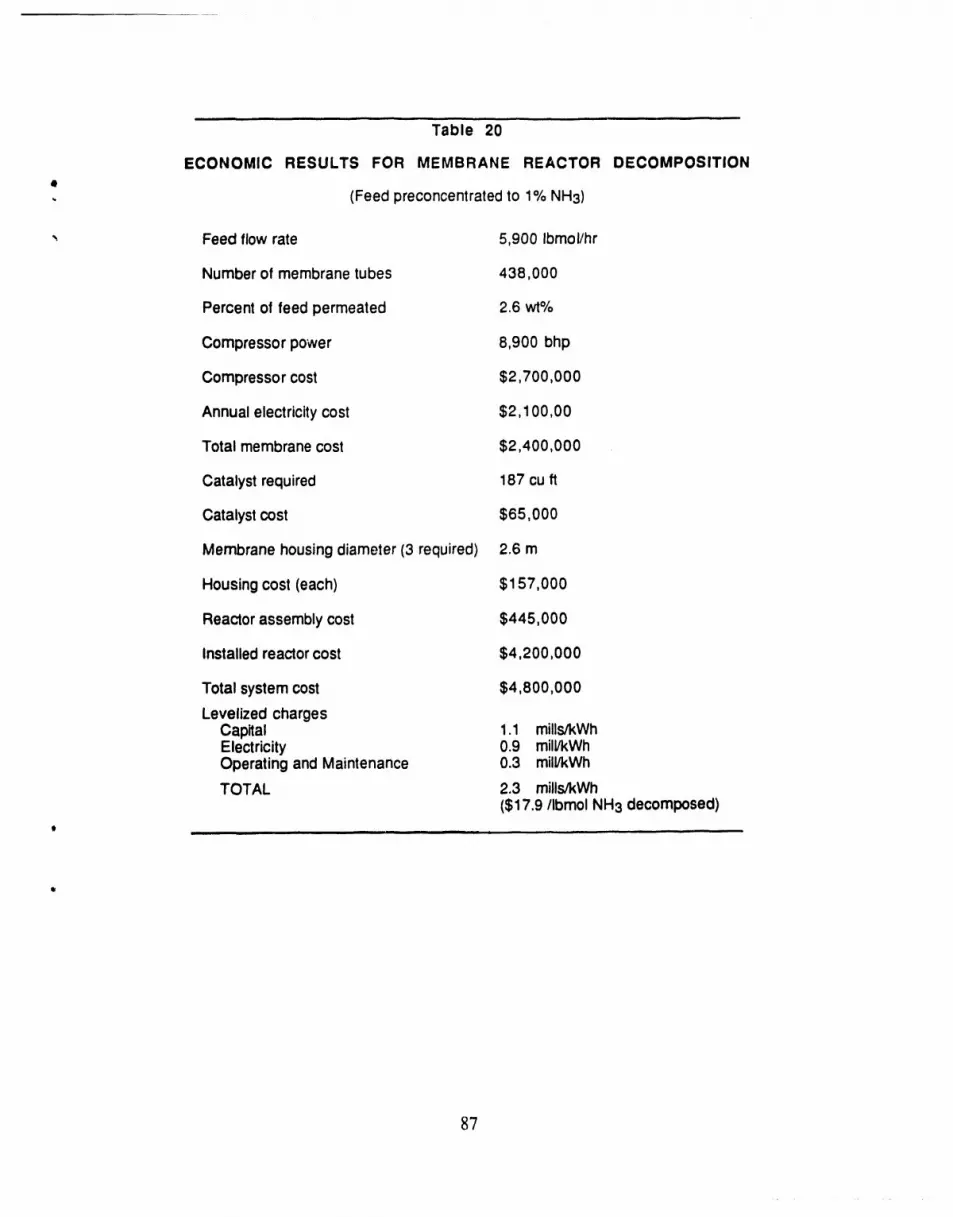
20 Economic Results for MembraneReactorDecomposition ............................ 87
A-1 Thermodynamic Parametersfor Decomposition of H2S ............................ A-3
B-1 Data Used to Determine H2S Reaction Rate Coefficient ............................ B-2
VUl
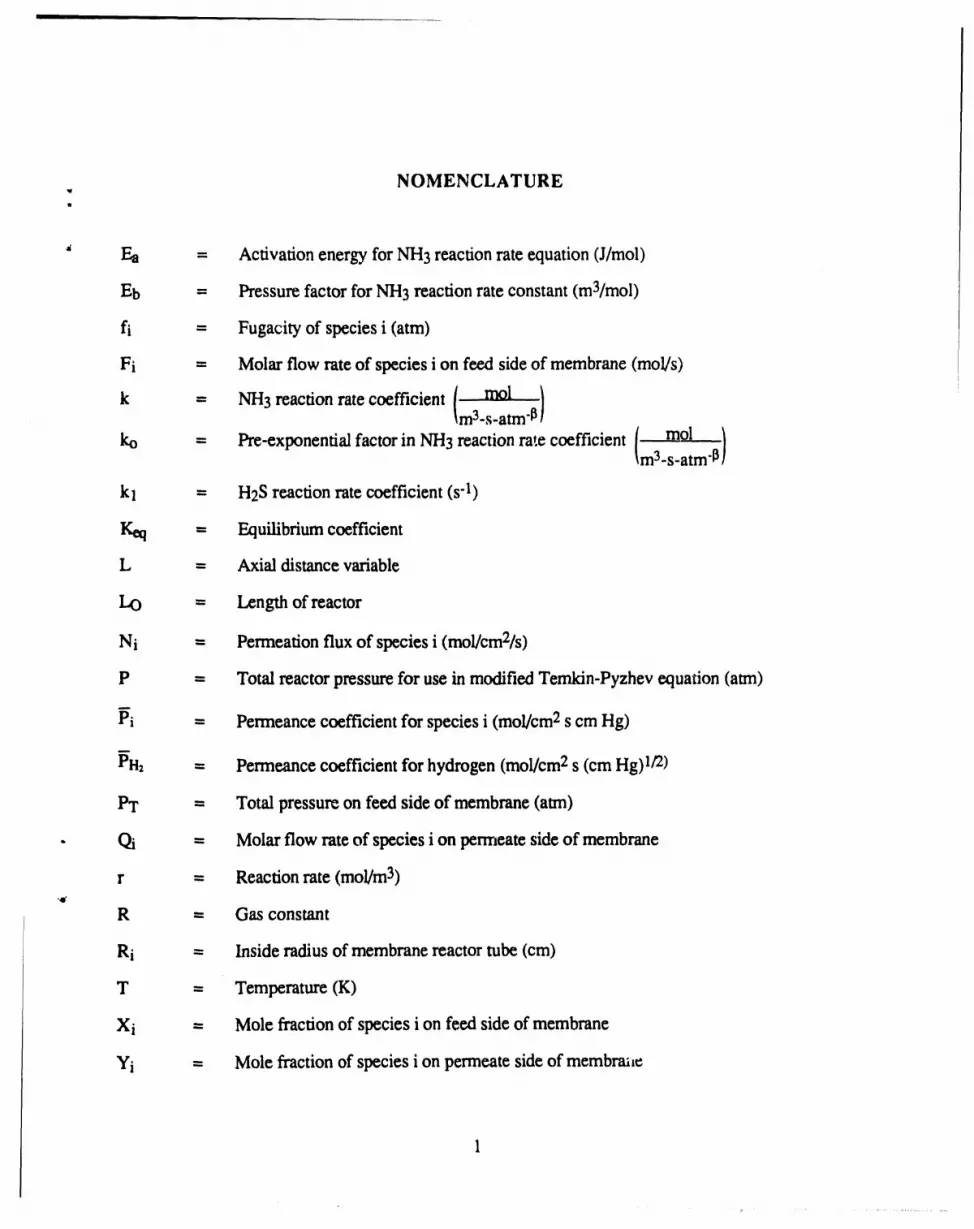
NOMENCLATUREw
I
Ea = Activation energy for NH3 reaction rate equation (J/mol)
Eb = Pressure factor for NH3 reaction rate constant (m3/mol)
fi = Fugacity of species i (atm)
Fi = Molar flow rate of species i on feed side of membrane (mol/s)
rrlol
k = NH3 reaction rate coefficient ,,(m3-s-atm'13)
ko = Pre-exponential factor in NH3 reaction rote coefficient [ mol I_m3-s-atm-I3!
kl = H2S reaction rate coefficient (s"l)
Keq = Equilibrium coefficient
L = Axial distance variable
LO = Length of reactor
Ni = Permeation flux of species i (mol/cm2/s)
P = Total reactor pressure for use in modified Temkin-Pyzhev equation (atm)
Pi - Permeance coefficient for species i (mol/cm 2 s cm Hg)
PH2 -- Permeance coefficient for hydrogen (mol/cm 2 s (cm Hg) 1/2)
PT = Total pressure on feed side of membrane (atm)
• Qi = Molar flow rate of species i on permeate side of membrane
r = Reaction rate (mol/m 3),¢
R = Gas constant
Ri = Inside radius of membrane reactor tube (cm)
T = Temperature (K)
Xi = Mole fraction of species i on feed side of membrane
Yi = Mole fraction of species i on permeate side of membrmie
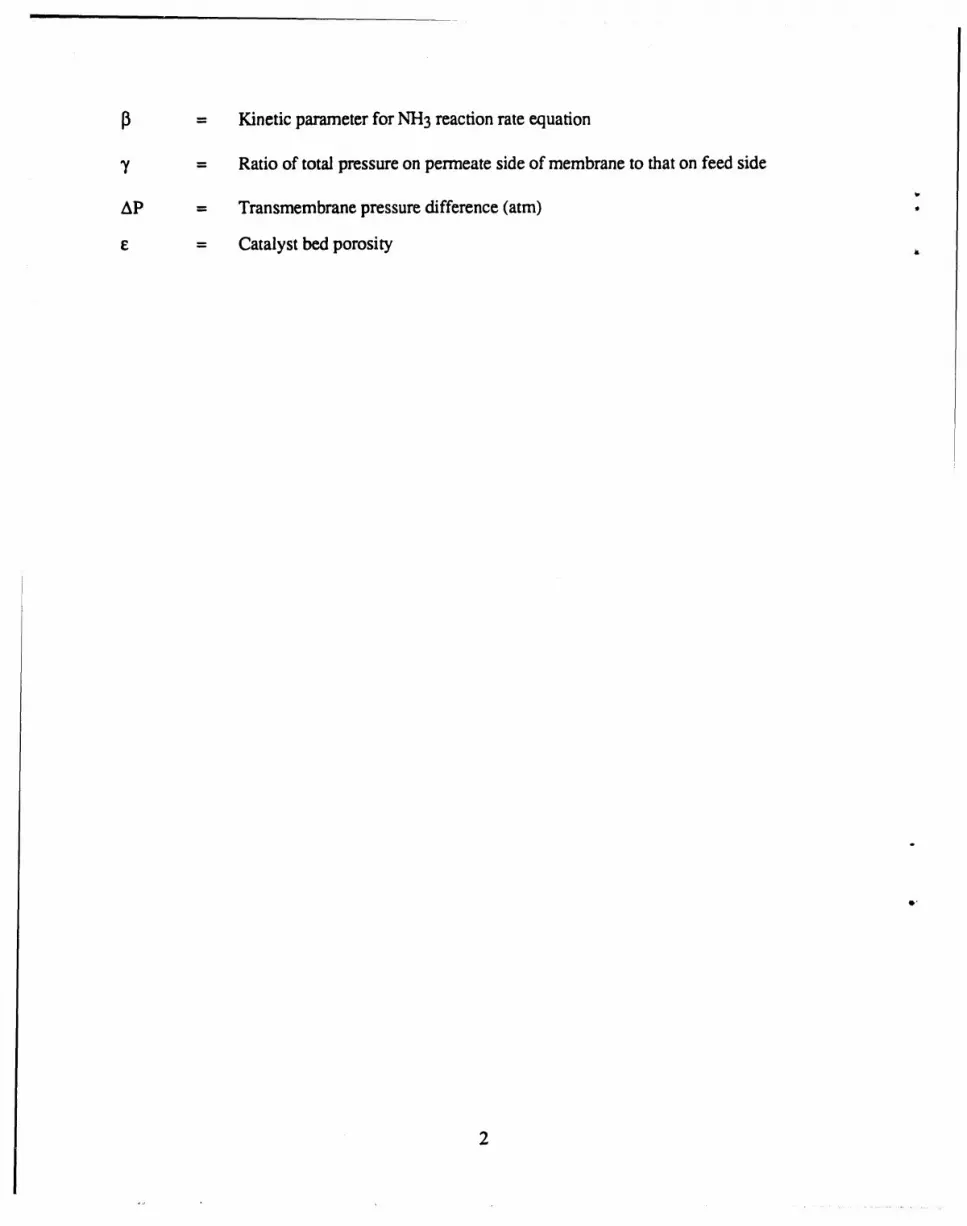
13 = Kinetic parameter for NH3 reaction rate equation
7 = Ratio of total pressure on permeate side of membrane to that on feed side
AP = Transmembrane pressure difference (atm) •
E = Catalyst bed porosity ,,
INTRODUCTION
The U.S. Department of Energy (DOE) is seeking to develop high temperature, high4
pressure ceramic membrane technology to perform a variety of gas separation processes to improve
the efficiency and economics of advanced power generation systems such as direct coal-fueled
turbines (DCFT) and the integrated gasification combined cycle (IGCC) process. The temperatures
encountered in these power generation systems are far above the temperature range for organic
membrane materials (typically 150-200°C for polymers such as silicone rubber, polysulfone, and
cellulose esters). Inorganic materials such as ceramics are therefore the most likely membrane
materials for use at high temperatures.
The focus of this project was control of H2S and NH3 in IGCC systems. The IGCC
process consists basically of a gasifier to produce synthetic gas, followed by a gas turbine
generator. The temperature and pressure ranges encountered in the IGCC process are 1,000° to
2,000°F and 200 to 1,000 psia. There are several potential applications for a high temperature
membrane reactor process in the IGCC process. Downstream of the hot particle removal device,
for example, both H2S and NH 3 could be removed and catalytically decomposed, leaving the fuel
value of the gasifier stream intact. Alternatively, H2S and NH 3 could be decomposed directly in
the gasifier. In either case, a membrane reactor has the potential to efficiently effect both H2S and
NH3 decomposition. The primary advantages of using a membrane reactor over a conventional
reactor are that the fraction of the contaminant decomposed is higher and the reaction rate faster.
Overall, the technology of mcmbra,-acrcactors is likely to impact several DOE program areas.
The objective of this project was to develop high temperature, high pressure catalytic
ceramic membrane reactors and to demonstrate the feasibility of using these membrane reactors to
control gaseous contaminants (hydrogen sulfide and ammonia) in IGCC systems. Our strategyt,
was to f'trst develop catalysts and membranes suitable for the IGCC application and then combine
these two components as a complete membrane reactor system. We also developed a computer
° model of the membrane reactor and used it, along with experimental data, to perform an economic
analysis of the IGCC application. Our results have demonstrated the concept of using a membrane
reactor to remove trace contaminants from an IGCC process. Experiments showed that NH 3
decomposition efficiencies of 95% can be achieved. Our economic evaluation predicts ammonia
decomposition costs of less than 1% of the total cost of electricity; improved membranes would
give even higher conversions and lower costs.
L
REVIEW OF PREVIOUS WORK
g
We used computerized and ad hoc methods for our literature search. The computerized
search used the Chemical Abstracts data base back to 1967, our strategy is presented in Table 1.
We searched primarily in the areas of H2S and NH3 decomposition, since we believed our files
were sufficient for our review of membrane technology.
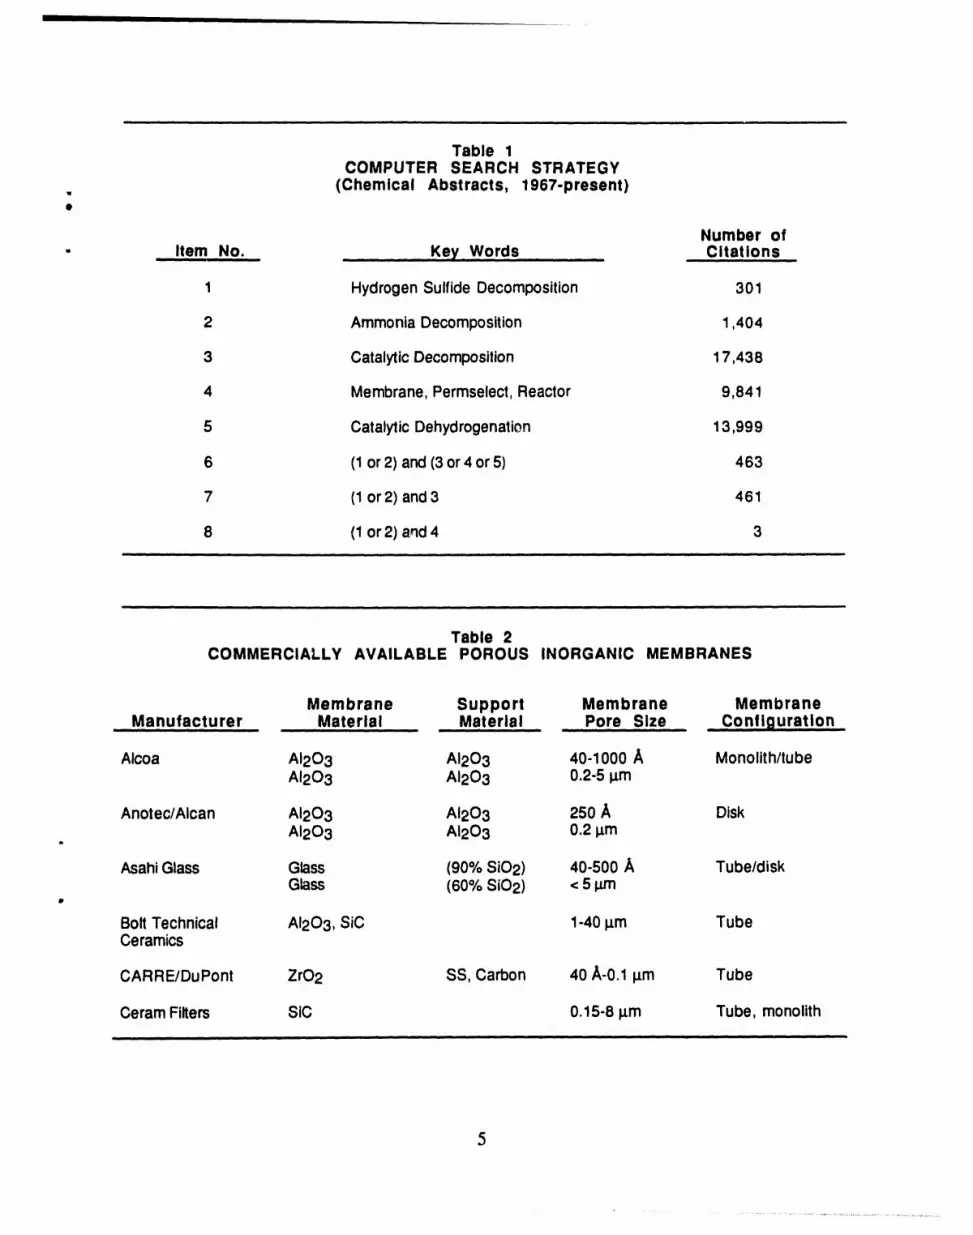
MEMBRANES
Inorganic membrane materials are the only suitable ones for IGCC/membrane reactor use.
The most comprehensive single source of information on commercial inorganic membranes is a
recent review by Egan (1989). This review covers inorganic membranes made from metals, metal
oxides, glasses, and carbon; explains briefly the relevant transport mechanisms and manufacturing
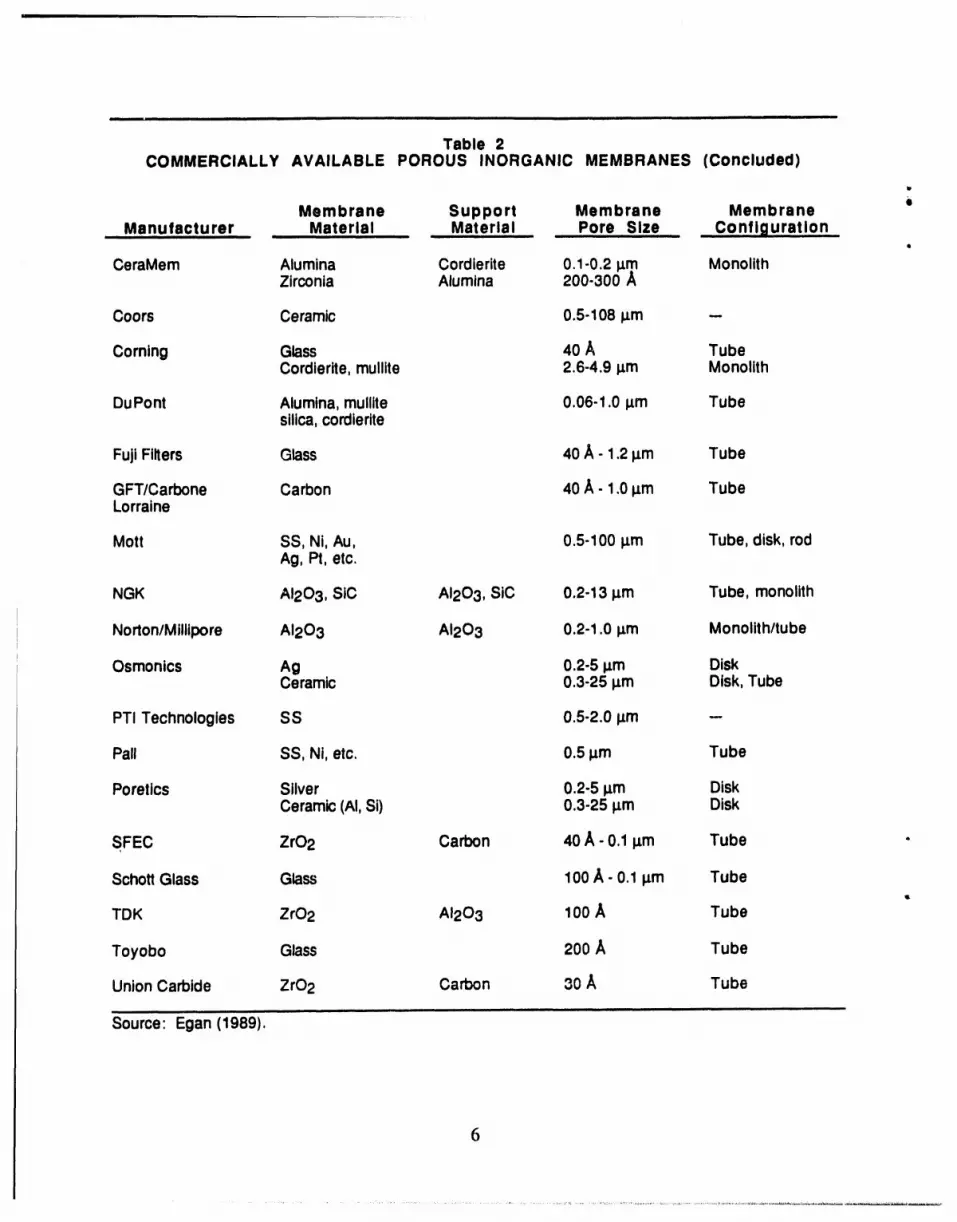
techniques; and includes 199 references. A wide range of pore sizes is available in commercial
membranes (Table 2). Mechanisms of transport in inorganic materials include viscous flow,
Knudsen diffusion, surface diffusion, capillary condensation, and molecular sieving. These
mechanisms, except molecular sieving, are described by Hwang and Kammermeyer (1984).
Descriptions of molecular sieving have been given by Koresh and Sofer (1987) and by Way and
Roberts (1989).
Research on inorganic membranes today is focusing on finer pore sizes, pore stability, and
manufacturing reproducibility. For example, Anderson et al. (1988) are using soluble .,r.
organometallic precursors and decomposing these in the pores of inorganic ultrafilters. Results of
recent work show pore sizes are now approaching the 10/_ size range. Keizer et al. (1988) have
studied the dip coating of an alumina boehmite sol onto a microporous (1,600 A) alumina support.
This technique resulted in a thin layer (4 I.tm)with 27 A average pore size. Suzuki (1987) has
made inorganic membranes with pores smaller than 20/_, by synthesizing zeolites in the pores of
metallic, glass, and metal oxide microporous substrates.
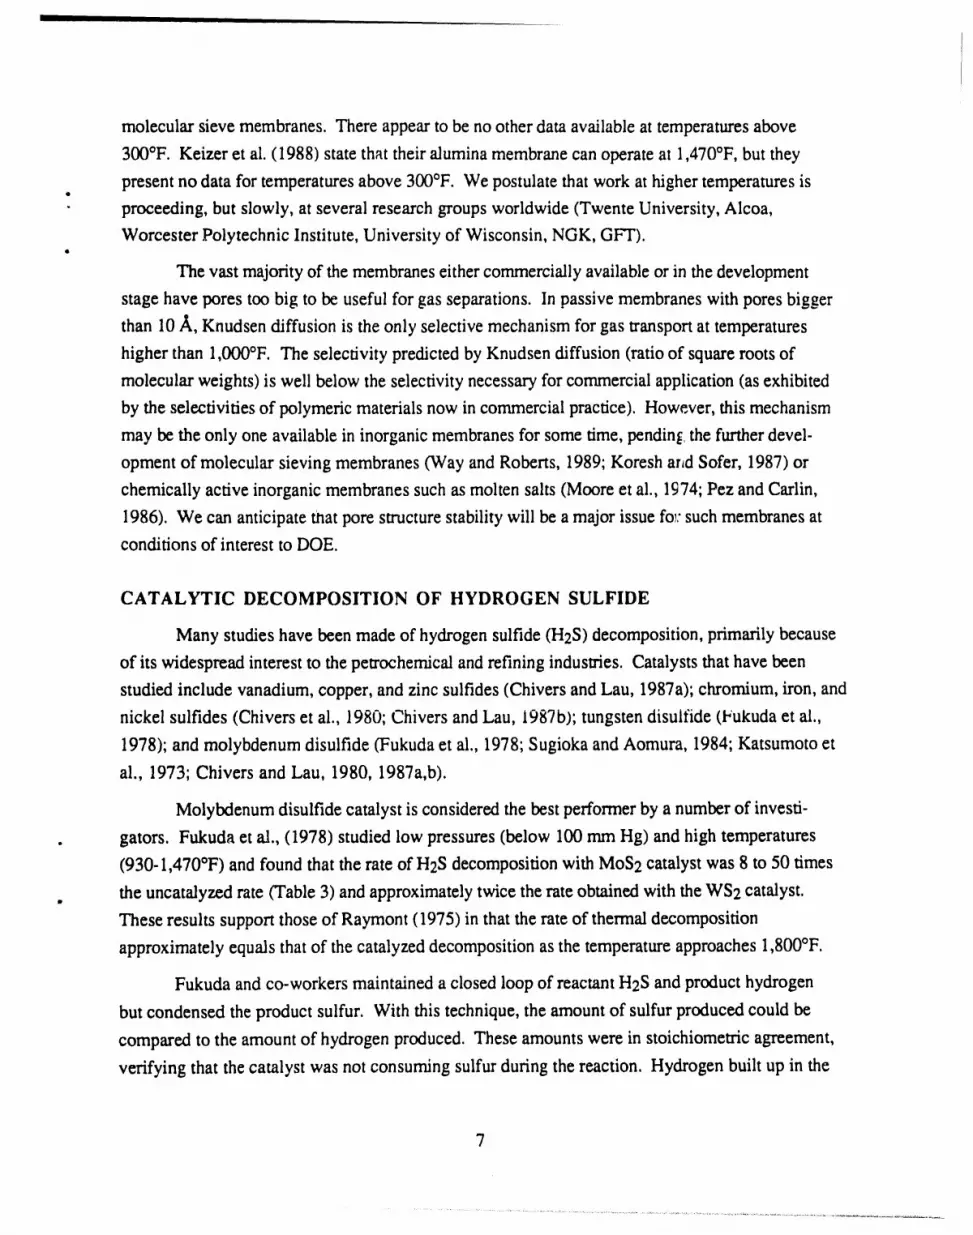
There is little work reported with membranes at conditions of interest to DOE. Bhave et al.
(1989) reported that the pores of the commercial Alcoa product (alumina ultrafilter) open up upon
heating. The pores are originally 40 ,/_and open to 57 fi if heated to 1,000°F, to 63/_ if heated to
1,200°F, and to 76/I, if heated to 1,500°F. It is not clear if these pores would continue growing in
long-term testing. Koresh and Sofer (1987) reported CH4/H2 separation at 930°F in carbon
I i
Table 1COMPUTER SEARCH STRATEGY
. (Chemical Abstracts, 1967-present)
Number of- .. Item No. Key Words Citations
1 HydrogenSulfide Decomposition 301
2 AmmoniaDecomposition 1,404
3 CatalyticDecomposition 17,438
4 Membrane,Permseiect,Reactor 9,841
5 CatalyticDehydrogenation 13,999
6 (1or 2) and(3or4 or 5) 463
7 (1or 2) and 3 461
8 (1or 2) and4 3
Table 2COMMERCIALLY AVAILABLE POROUS INORGANIC MEMBRANES
Membrane Support Membrane MembraneManufacturer Material Material Pore Size Configuration
Alcoa AI203 AI203 40-1000 A Monolith/tubeAI203 AI203 0.2-5 I_m
Anotec/Alcan AI203 AI203 250 A DiskAI203 AI203 0.2 _m
bHTSR is a hightemperaturesteamreformingcatalystmade byHaldor-Topsoe,/VS,Copenhagen,Denmark.
CR-67is alsomade by Haldor-Topsoe,/VS.
dG-65 is a nickel-basedmethanationcatalystmadeby UnitedCatalysts,Inc., Louisville,Kentucky.
eG-65* tsan iridium-promotedversionof G-65.
fSpace velocity- 5,000 h"1.
gSpace velocity= 2,000 h"1.
Source: Krishnanet al., 1988.
12
i Jill ] iiIml III I u L I IIIInlln iiiilullill i ......... ] i i ]u.l_rllll : ......................................
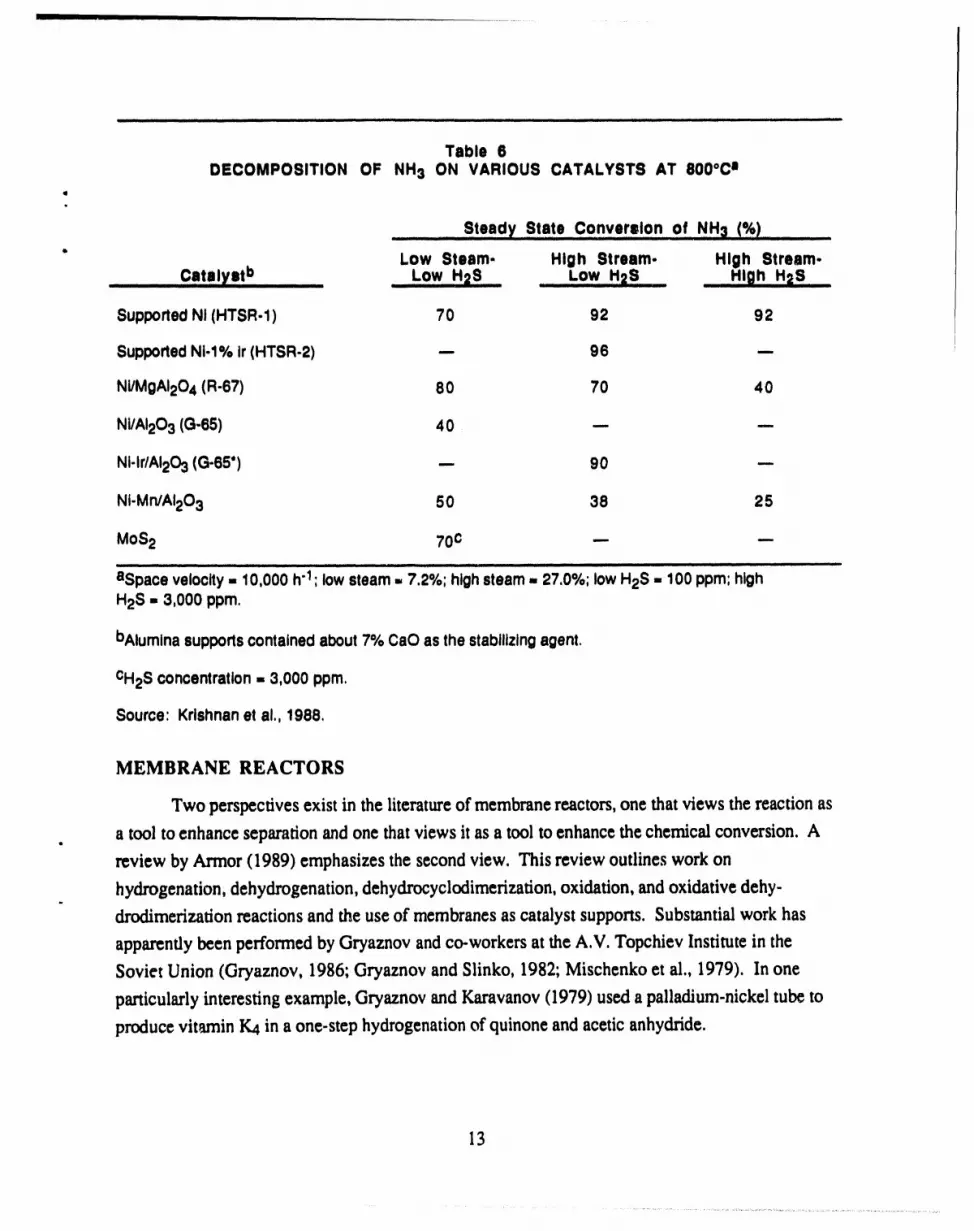
Table 6DECOMPOSITION OF NH3 ON VARIOUS CATALYSTS AT 8000Ca
t
Steady State C0nverslon of NH3 (%)
" Low Steam- High Stream- High Stream-.........Catnlyatb ......... LowH2S............-owH=S __H_ghH2S.....
SupportedNI (HTSR-1) 70 92 92I
SupportedNi-1% ir (HTSR-2) -.- 96 --.
Ni/MgAI204 (R-67) 80 70 40
Ni/AI203 (G-65) 40 --- ---
NI-Ir/AI203(G-65") -- 90 --
Nt-Mn/AI203 50 38 25
MoS2 70c --. .._i ii i i iiitl i iiiiii i tt i 11 i ii iii ]1 iii i ] HI,Ill II . II Iltll Iltt I IIIITJ I IIII I IHIIr I I I I[11111111 I III tt t ttlt lit
bAluminasupportscontainedabout7% CaO as thestabilizingagent.
CH2Sconcentration= 3,000 ppm.
Source: Krishnanet al., 1988,
MEMBRANE REACTORS
Two perspectivesexist in the literatureof membranereactors,one thatviews the reactionas
atool to enhanceseparationandonethatviewsit asatooltoenhancethechemicalconversion.A
review byArmor (1989) emphasizes the secondview. This reviewoutlines workon' nhydrogenatlo , dehydrogenation, dehydrocyclodimerization,oxidation, and oxidative dehy-
drodimerization reactions and the use of membranesas catalyst supports. Substantial work has
apparently been performed by Gryaznov and co-workers at the A.V. Topchiev Institute in the
Soviet Union (Gryaznov, 1986; Gryaznov and Slinko, 1982; Mischenko et al., 1979). In one
particularly interesting example, Gryaznovand Karavanov (1979) used a palladium-nickel tube to
produce vitamin K4 in a one-step hydrogenation of quinone and aceticanhydride.
13
Dehydrogenation of cyclohexane to form benzene has been a popular reaction to study in a
membrane reactor (Shinji et al., i982; Itoh et al., 1985; Mohan and Govind, 1986; itoh et al. 1987;
Sun and Khang, 1988). Because cyclohexane and benzene are fairly large molecules, Vycor glass
tubes with a 40 ,_ pore size provide by Knudsen diffusion a sufficiently selective removal of the
hydrogen formed. A platinum catalyst dispersed on alumina has typically been used for this
reaction; temperatures have been in the range of 400°F, and the pressure has beenatmospheric.
Literature focus on the use of membrane reactors to enhance separation has been on hydro-
gen sulfide removal (Kameyama et al., 1979, 1981a,b; Abe, 1987), Kameyama and co-workers
employed Vycor glass tubular membranes with no catalyst in the temperature range 930°F to
1,470°F and pressures up to 60 psia. Kameyama et al. (198 lb) also used an alumina membrane
with 1,000 _ pores and a MoS2 catalyst. At 1,470°F with a Vycor glass membrane, there was no
difference in the extent of conversion with and without the MoS2 catalyst. These investigators also
ran a Vycor membrane for 216 hours at 1,100-1,470°F with no loss of performance. Abe (1987)
used molybdenum sulfide beads as a catalyst in alumina membranes to decompose H2S. By
placing the catalyst in different areas in the membrane (inside the membrane tube, on the inside
wall of the membrane tube), they were able to obtain different conversions. The temperature and
pressure were near 1,470°F and 55 psia, respectively. Fukuda et al. (1978) simulated one feature
of a membrane reactor in their study of H2S decomposition with MoS2 and WS2 catalysts by
continuously removing the sulfur and intermittently removing the product hydrogen.
The theory of tubular membrane reactors has been adequately expressed by Itoh et al.
(1985) and by Mohan and Govind (1986). If plug flow is assumed, as these investigators did, the
relevant differential equations are one-dimensional. When the catalyst is in the walls of the mem-
brane rather than inside the membrane tube, the reaction rate terms must be included in the equa-
tions that describe the wall transport. This approach results in a second-order differential equation
(Sun and Khang, 1988).
14
_t
CATALYST DEVELOPMENT
On the basis of the literature survey presented previously, we selected two catalysts to
prepare and evaluate for H2S and NH3 decomposition. For H2S decomposition, we chose an
alumina supported MoS2 catalyst. MoS 2 was chosen because it significantly enhances the H2S
decomposition rate and is not consumed by reaction with H2S. For NH3 decomposition, we chose
an alumina supported Ni catalyst because of its high catalytic activity and low cost relative to other
catalysts.
CATALYST PREPARATION
We prepared both H2S decomposition and NH3 decomposition catalysts by imbibing
alumina particles with an aqueous solution. The alumina particles were obtained from United
Technologies, Inc., Louisville, KY (Product No. CS308). Particle diameters were between 246
/.tm and 833 I.tm (20/60 mesh). To make the MoS2 catalyst for H2S decomposition, we prepared
an aqueous solution consisting of 8 g of ammonium molybdate ([NI-1416Mo70'24o4H20) dissolved
in 40 mL of water. We added all of this solution to 50 g of alumina particles. This volume of
solution was calculated to approximately equal the pore volume of the alumina particles. The
wetted particles were dried overnight at room temperature and for 24 hours at 120°C, and then
calcined at 400°C for 2 hours. The particles were sulfided by flowing a gas mixture of H2S in H2
(10% H2S; 1 atm) over the particles while raising the temperature from room temperature to 400°C
(at 150°C per hour). The temperature was held at 400°C for 2 hours, and then the oven was turned
off. Nitrogen gas was introduced to purge the system, and the resulting 50 g of catalyst was
stored under nitrogen.
The catalyst for ammonia decomposition was prepared similarly by imbibing an aqueous
solution consisting of 21.5 g of nickel nitrate (Ni(NO3)2°6H20) in 40 mL of water into a fresh
batch of alumina particles. The Ni solution was slowly added to 50 g of alumina particles. The
" particles were dried overnight at room temperature and at 1200C for 24 hours, and then calcined at
400°C for 2 hours. The particles were then placed in a tube and exposed to hydrogen at 1 atm
pressure. The gas temperature was raised at 150°C per hour to 400°C and held at 400°C for
2 hours. The oven was turned off, the system was purged with nitrogen, and the resulting 50 g of
catalyst were stored under nitrogen.
15
CATALYST PERFORMANCE
H 2S Decomposition
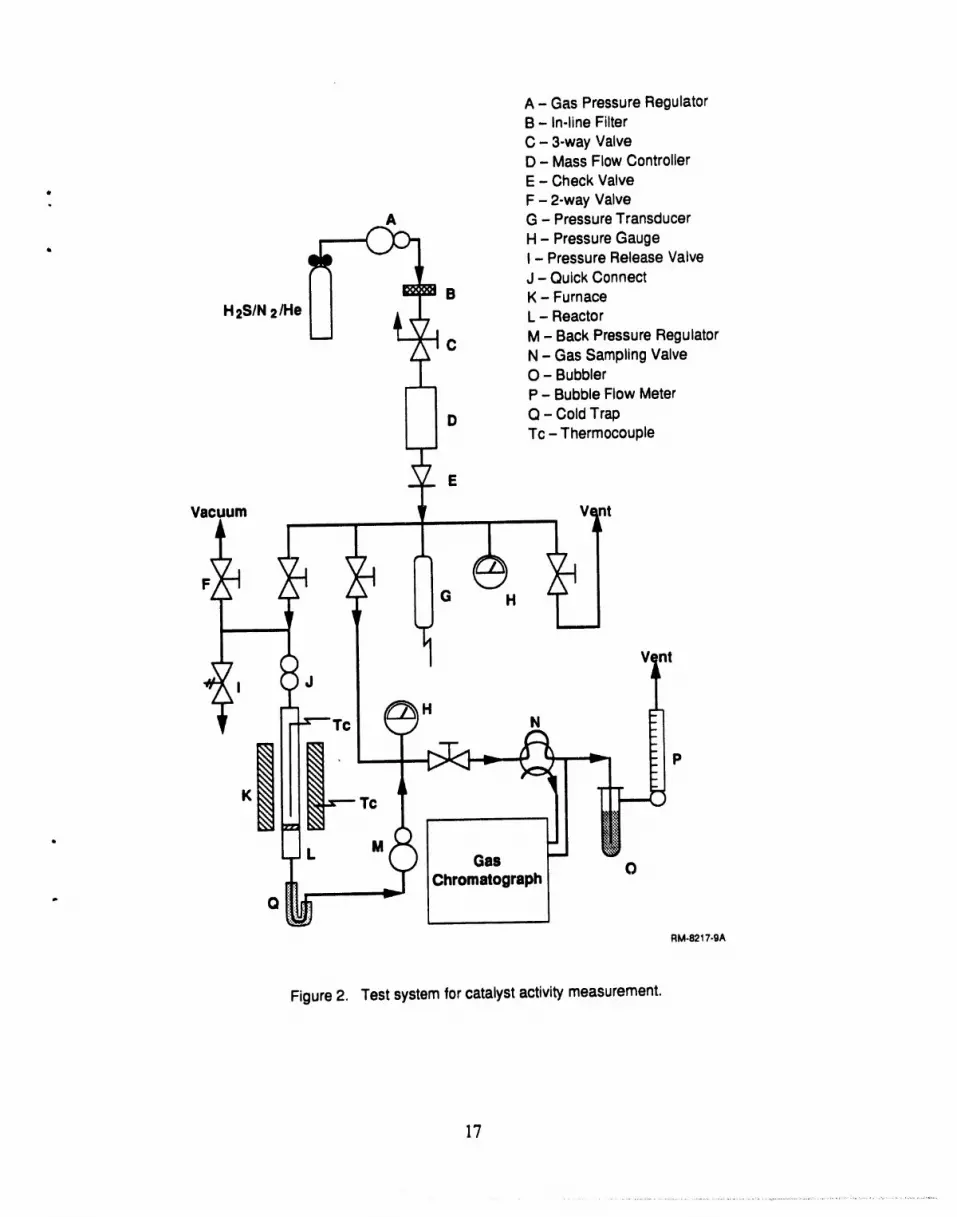
The apparatuswe usedto measurethe activityof the H2Scatalystis shownin Figure2. A ,gas mixture (forexample, 0.5%H2S,balance He) was passed througha tubularreactor wherethe
H2S decomposed. The productgas was analyzed by gas chromatography. By varying the flow
rate and measuringthe extent of H2Sdecomposition, we obtainedreactionrate coefficients. These
rate coefficientswereused in ourcomputermodel to simulate the membranereactorperformance.
To provide temperaturecontrol over thereaction conditions, the reactorwas held in a furnace
capable of 800°C operation(Applied Test Systems Series3210). Gas exiting the furnace was
cooled to capturesulfur (ff any) and to allow injection into the chromatograph. Reactorpressure
was maintained as high as 500 psig with a back pressure regulator. The stainless steel reactortube
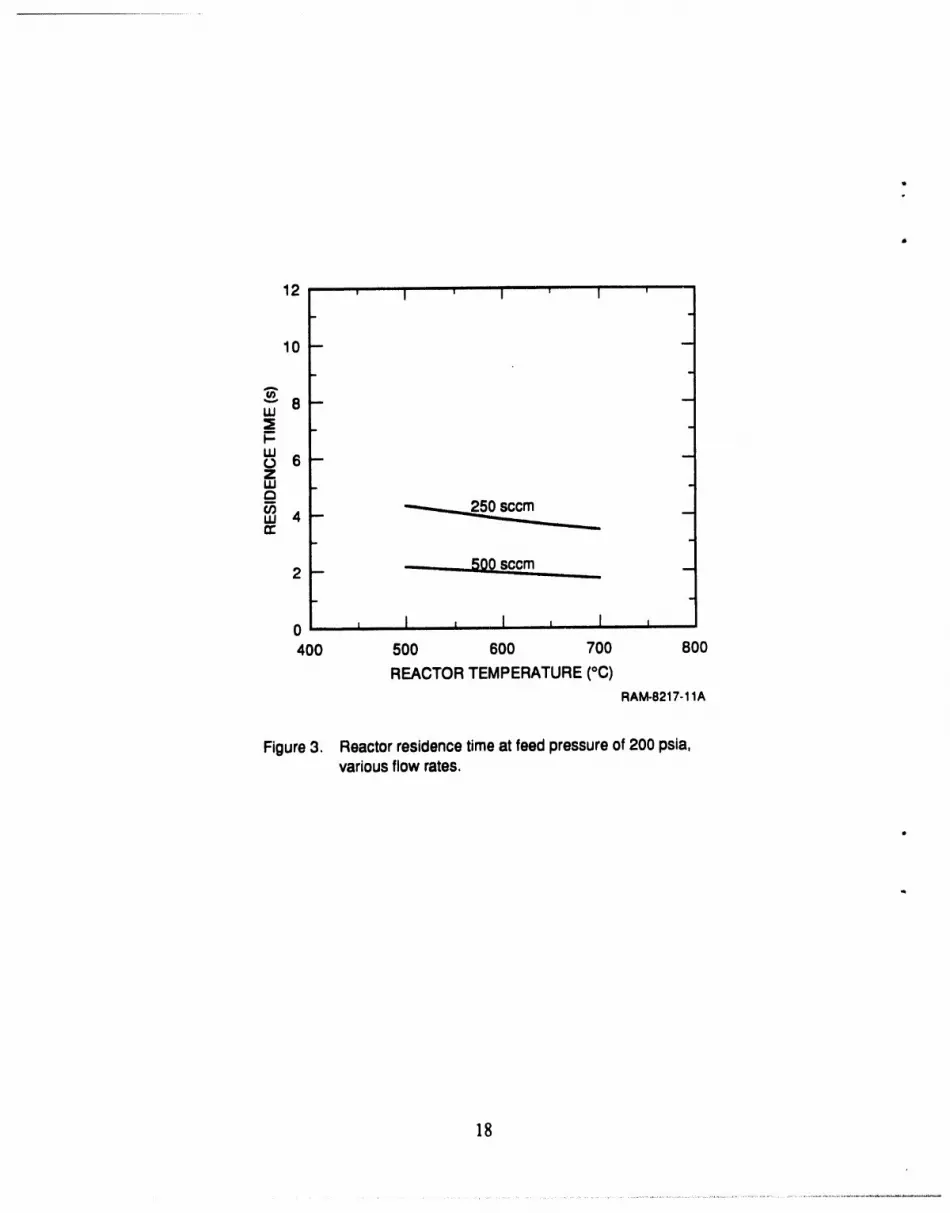
was 7.0 mm I.D. (9.5 mm O.D.) and 30.5 cm long. The residence time in this reactor varied
depending upon the feed flow rate, temperature,and porosityof thecatalyst; typically we had
residence times of 2 to 10 seconds in our experiments.
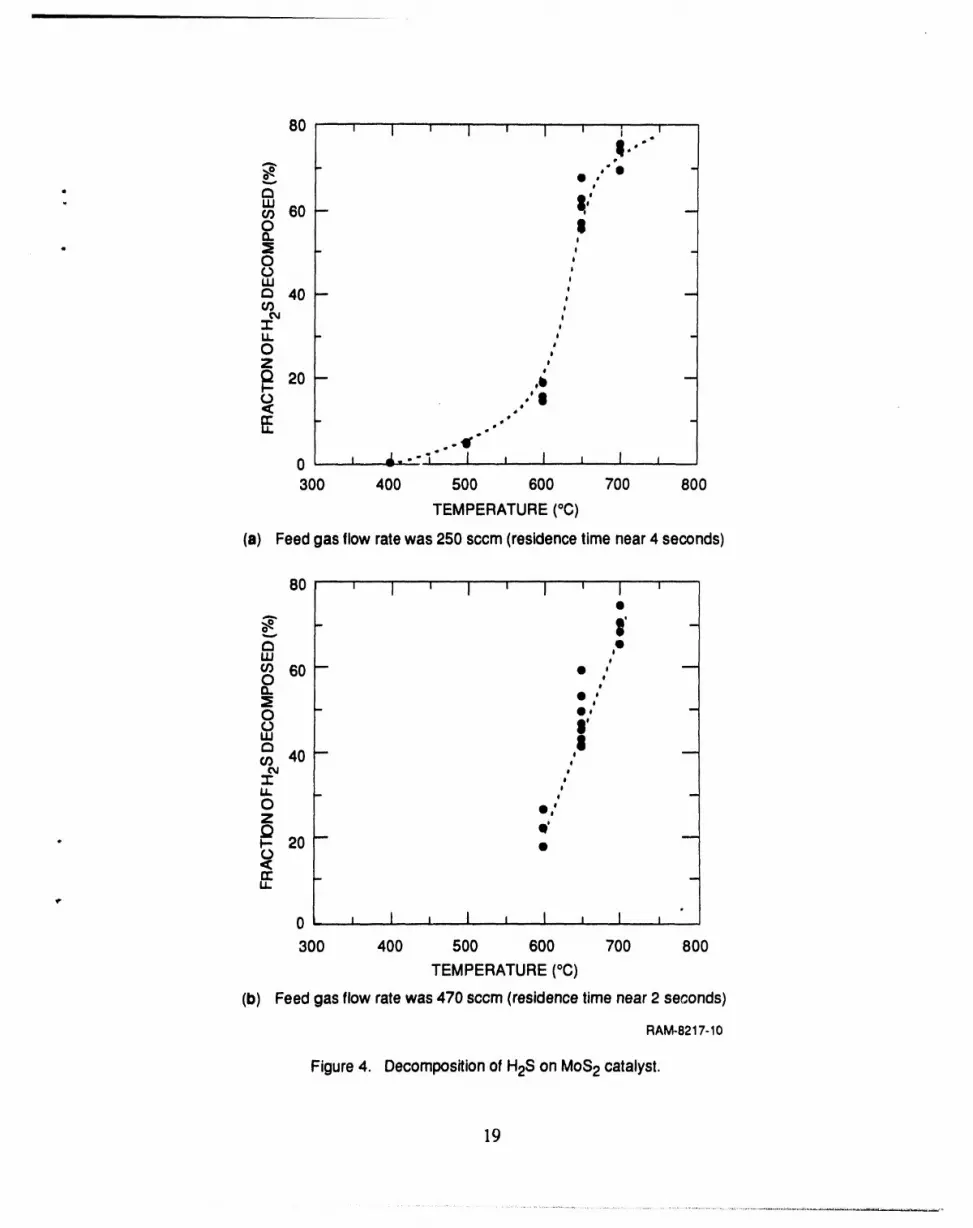
Three grams of the MoS2 catalyst wereplaced in the reactortube, and a feed gas mixture
(0.5% H2S in He) was passed over the catalyst panicles. We varied the temperature of the reactor
between 400°C and 700°C. The reactorpressurewas maintained at 200 psia. The feed gas flow
r,t?ewas held constant at either250 standardcubic centimetersperminute (seem) or470 seem; the
residence time was about 4 seconds at the lower flow rate and about 2 seconds at the higherflow
rate (Figure 3). At higher temperatures morethan 60% of the H2Swas decomposed, whereas
below 400°C no decomposition could be measured (Figure 4). The fact that the fractionalconver-
sion was practically the same with either flow rate (and thereforewith either residencetime) sug-
gests that the reaction time is less than2 seconds.
To ensure that the reductionin H2Sconcentrationas the gaspasses through the reactoris
due to catalyticdecomposition and not to anirreversiblereactionwith the catalyst (e.g., H2S +MoS2 ---)H2 + MoS3,resulting in consumptionof the catalyst), we ran our H2S decomposition
tests for a total of 14 hours. During this time, the numberof moles of H2S decomposed was
approximately 20 times more than the numberof moles of MoS2present at the outset of the test.
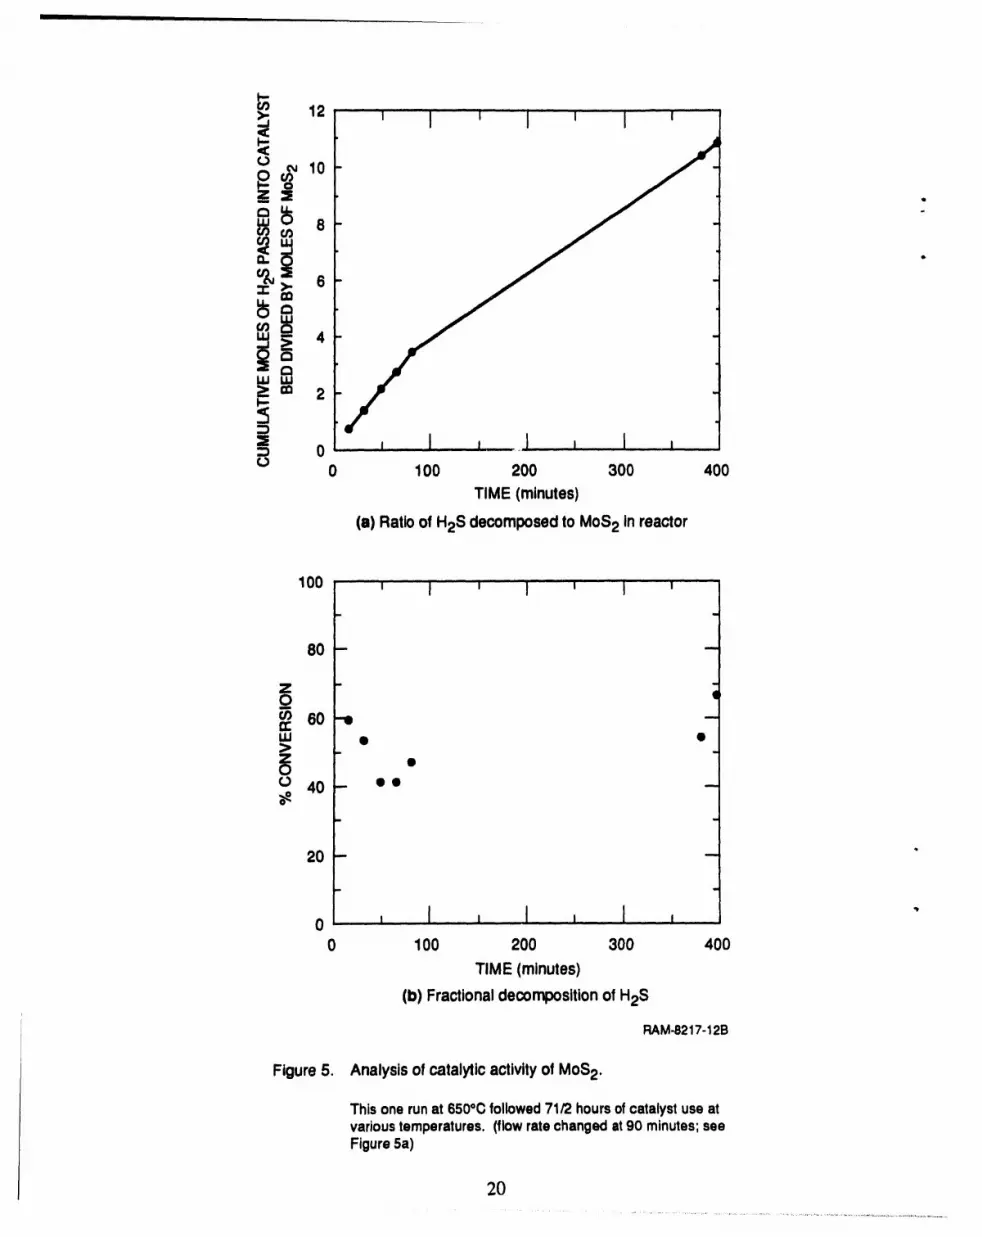
For example, during one run at 650°C, the moles of H2S decomposed exceeded the moles of MoS2
present by a factorof 10 (Figure 5). The fractional conversionwas constant (within experimental
error)for this 400-minute run. We also measuredthe catalytic activity of the catalyst support
particles (alumina) without the MoS2catalyst. At temperaturesup to 800°C and a residence time of
16
A - GasPressureRegulatorB- In-line FilterC - 3-wayValveD - MassFlowController
. E - Check Valve- F - 2-wayValve
A G - PressureTransducer
. _ H - PressureGauge
_ I- PressureReleaseValve
J - QuickConnectB K- Furnace
H2S/N 2/He Av" L- Reactor"LJ
"1C M- BackPressureRegulatorN - Gas SamplingValveO - Bubbler
II P- BubbleFlowMeter
D Q - ColdTrapTc- Thermocouple
Vacuum V( rRti
K Tc
• 5M ( Gas
p
RM-8217-9A
Figure 2. Test systemforcatalystactivitymeasurement.
17
12 ' ' I ' '"1 ' t ' .....
10 -
u,J
m __ 6 --
_ .
-W 4 -- -
2-- _ -
0 _ I ,, I i , I ,400 500 600 700 800
REACTOR TEMPERATURE (°13)
RAM-8217-11A
Figure 3. Reactor residence time at feed pressure of 200 psia,various flow rates.
18
0 " '"' I _ I w ! i i I.....
.'= .j
- LU _,,¢n 60--O $
• _= . , .OILl
40-- 0 _O°
"I" oJl -
O i
Z e_20- .b --
I"
.'"OE
.e"0 , .J..-'.i"" i i I l I ,300 400 500 600 700 800
TEMPERATURE (°C)
(a) Feed gas flow rate was 250 sccm (residence time near 4 seconds)
80 i I i 'i I I _ I 1 '
- 8o _W #
60-- • ' --OIrt je
O - • -|'
I,,1,1,.-., II40 .,
"I" 0e1.1.
O •0ZQ _ e'
- _ 20 •¢,.)<E -
0 J I i I I I I I I
300 400 500 600 700 800
TEMPERATURE (°C)
(b) Feed gas flow rate was 470 sccm (residence time near 2 seconds)
about 4 seconds (total pressure 200 psia), there was no detectable decomposition of H2S,
indicating that the native alumina particles had no catalytic activity and, further, that the rate of
• thermal decomposition was negligible. These results show that decomposition of H2S in our
reactor is caused entirely by the activity of the MoS2 catalyst.
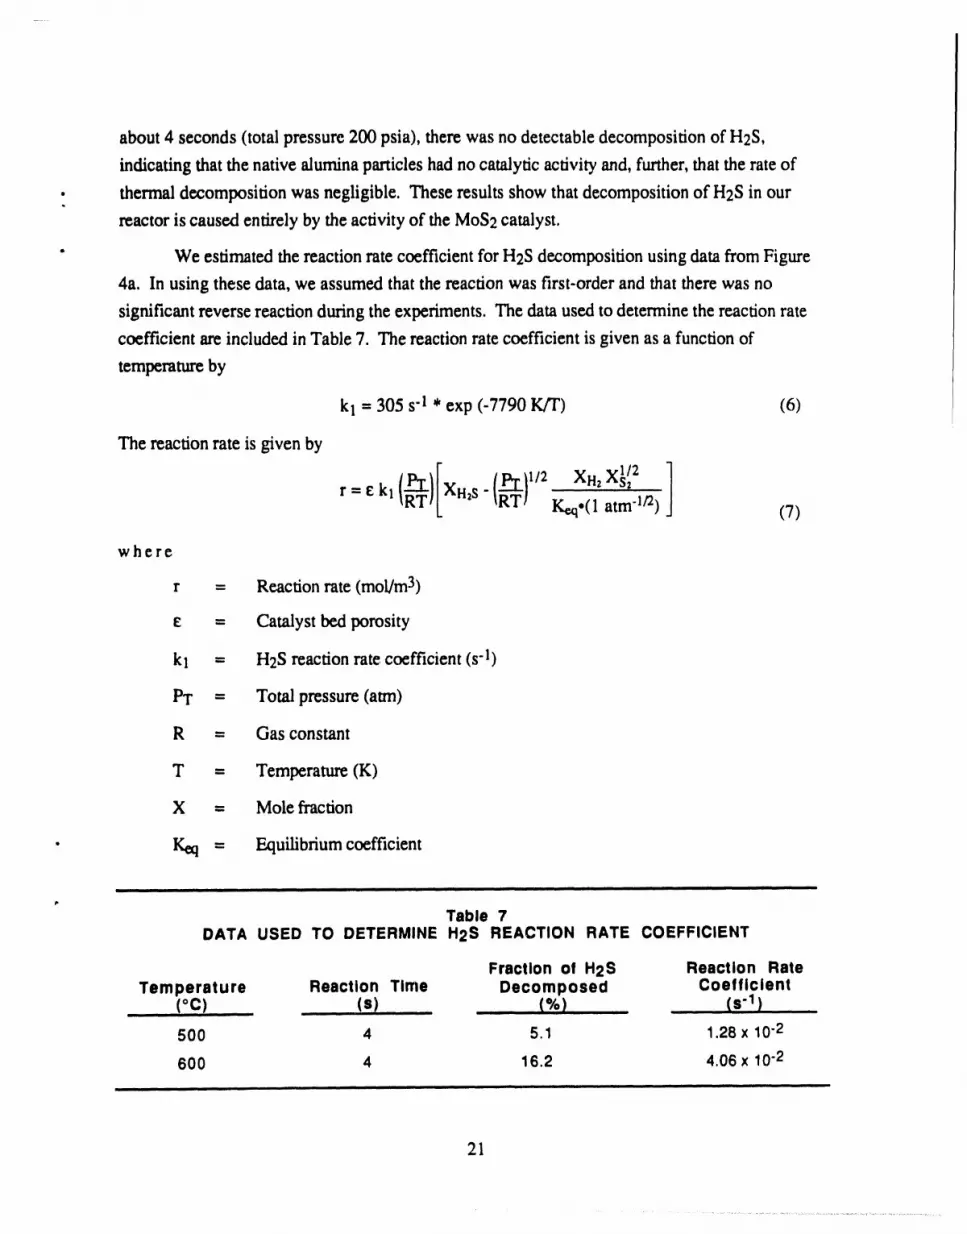
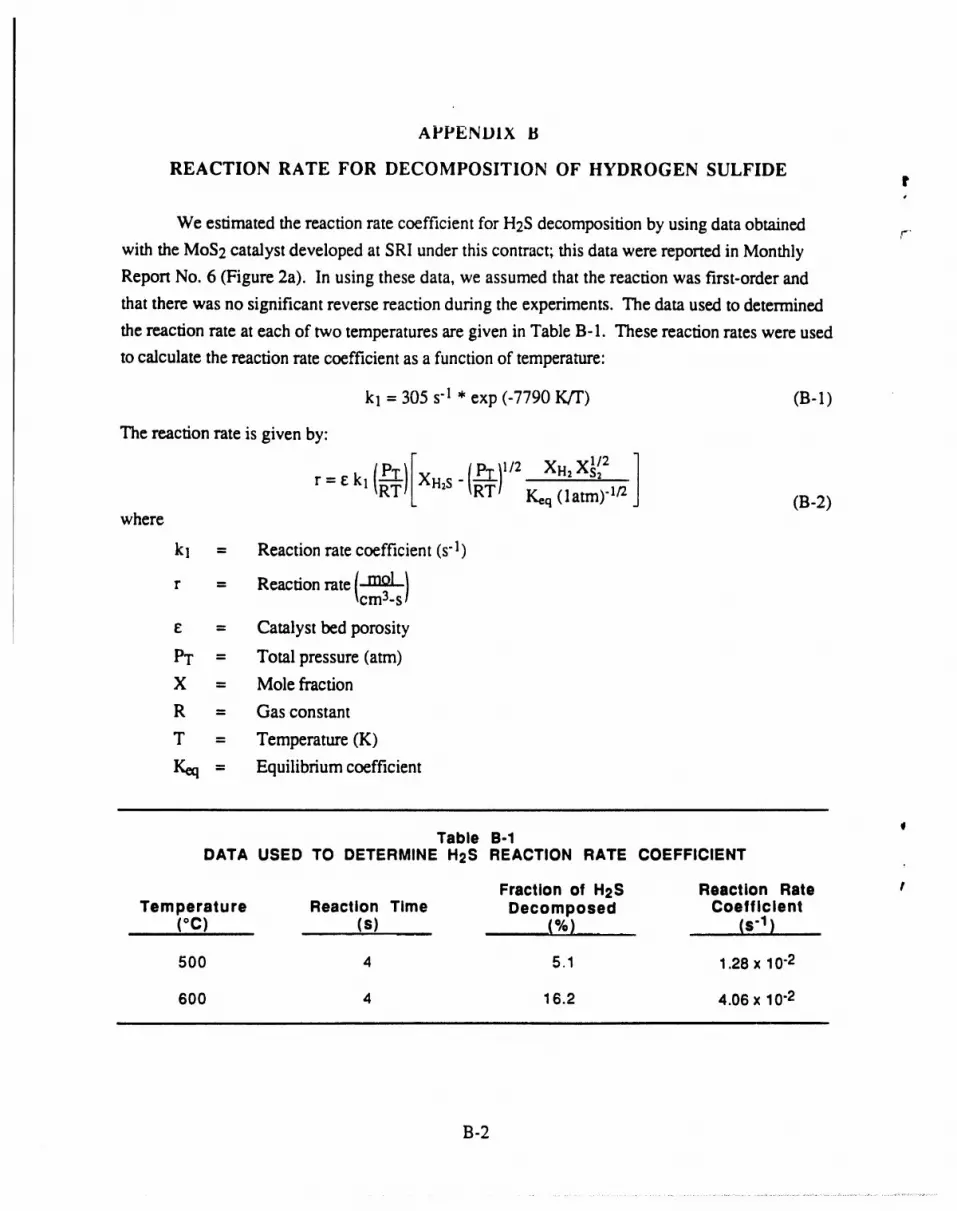
" We estimated the reaction rate coefficient for H2S decomposition using data from Figure
4a. In using these data, we assumed that the reaction was first-order and that there was no
significant reverse reaction during the experiments. The data used to determine the reaction rate
coefficient are included in Table 7. The reaction rate coefficient is given as a function of
temperature by
kI = 305 s"1 * exp (-7790 K/T) (6)!
The reaction rate is given by
f_ l /2 xH,,,s,r = t kl XH2S"/RT! Ke.q,(1 atm "1/2) (7)
where
r = Reaction rate (mol/m 3)
t = Catalyst bed porosity
kl = H2S reaction rate coefficient (s"l)
PT = Total pressure (aim)
R = Gas constant
T = Temperature (K)
X = Mole fraction
• Keq = Equilibrium coefficient
i ii iii i iii iiii iiii i i i i
Table 7DATA USED TO DETERMINE H2S REACTION RATE COEFFICIENT
Fraction of H2S Reaction RateTemperature Reaction Time Decomposed Coefficient
(oc) .... (s) ............ (%)500 4 5.1 1.28x 10.2
600 4 16.2 4.06 x 10.2
21
NH 3 Decomposition
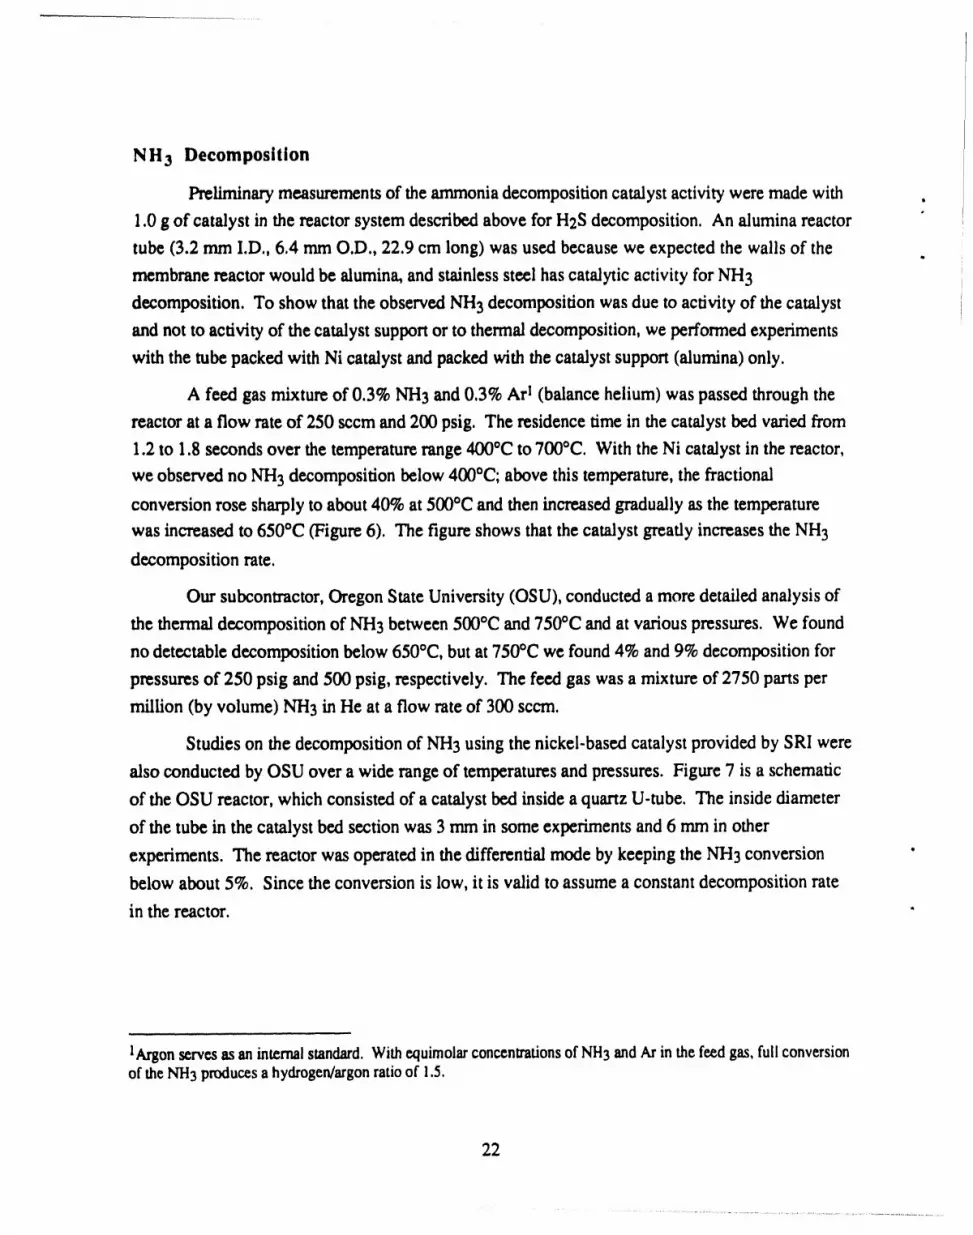
Preliminarymeasurementsof the ammoniadecompositioncatalyst activityweremade with
1.0 g of catalyst in the reactorsystem describedabove for H2Sdecomposition. An alumina reactor
tube (3.2 mm I.D., 6.4 mm O,D., 22.9 cm long) was used because we expected the walls of the
membrane reactorwouldbe alumina, and stainlesssteel has catalytic activity for NH3
decomposition. To show that the observed NI-I3decomposition was due to activityof the catalyst
and not to activityof the catalyst supportor to thermaldecomposition, we performedexperiments
with the tube packed with Ni catalyst and packed with thecatalyst support (alumina)only.
A feed gas mixture of 0.3% NH3 and 0.3% ArI (balance helium) was passed throughthe
reactorat a flow rateof 250 sccm and 200 psig. The residence time in the catalyst bed variedfrom
1.2 to 1.8 seconds over the temperaturerange 400°C to 700°C. With the Ni catalyst in the reactor,
we observed no NH3 decompositionbelow 400°C; above this temperature,the fractional
conversionrose sharplyto about 40% at 500°C and then increasedgraduallyas the temperaturewas increased to 650°C (Figure6). The figureshows thatthe catalyst greatly increasesthe NH3
decomposition rate.
Oursubcontractor,Oregon State University(OSU), conducted a moredetailed analysis of
the thermaldecomposition of NH3 between 500°C and 750°C and at variouspressures. We found
no detectable decomposition below 650°C, but at 750°C we found 4% and 9% decomposition for
pressures of 250 psig and 500 psig, respectively. The feed gas was a mixtureof 2750 parts per
million (by volume) NH3 in He at a flow rate of 300 seem.
Studies on the decompositionof NH3 using the nickel-based catalyst provided by SRI were
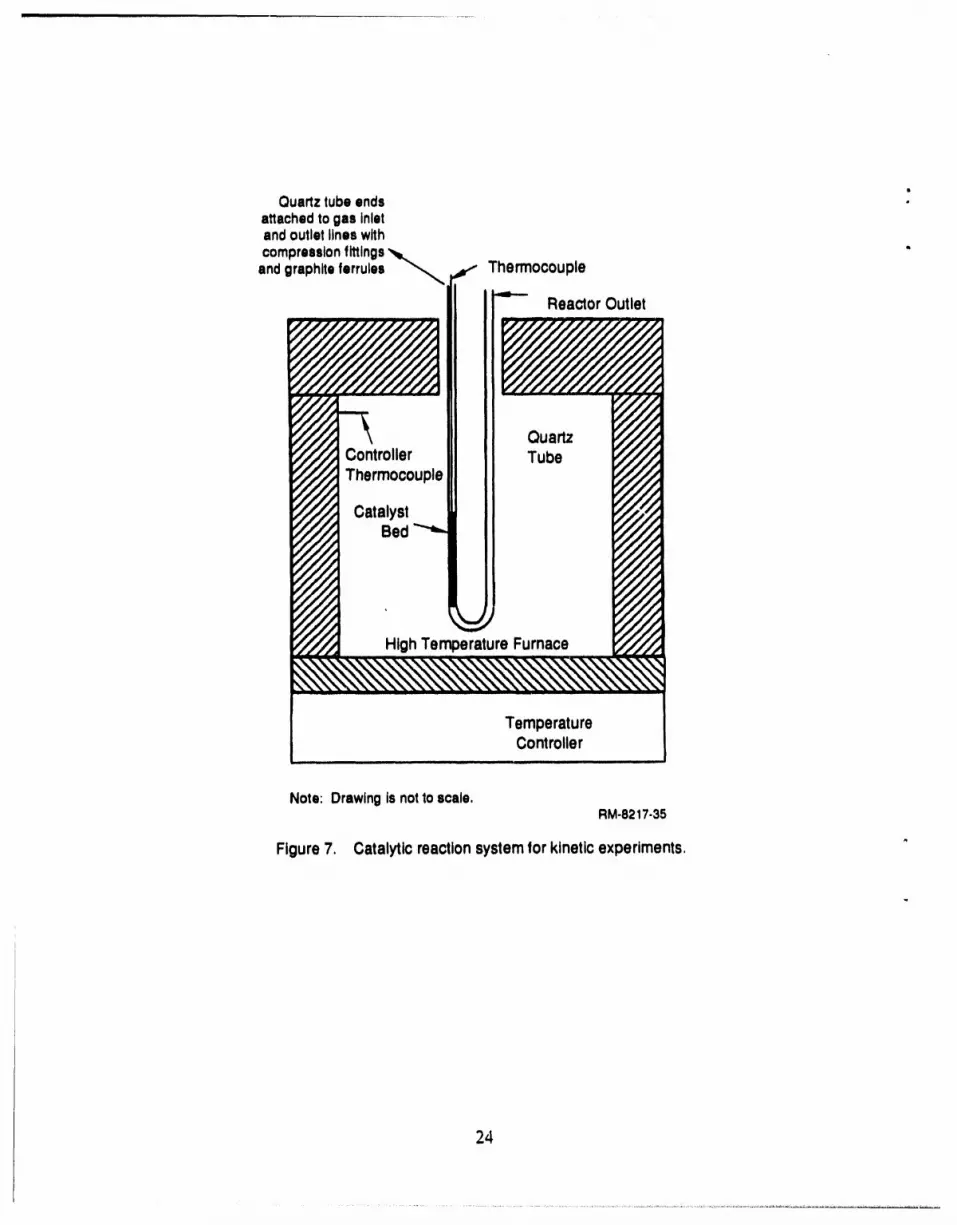
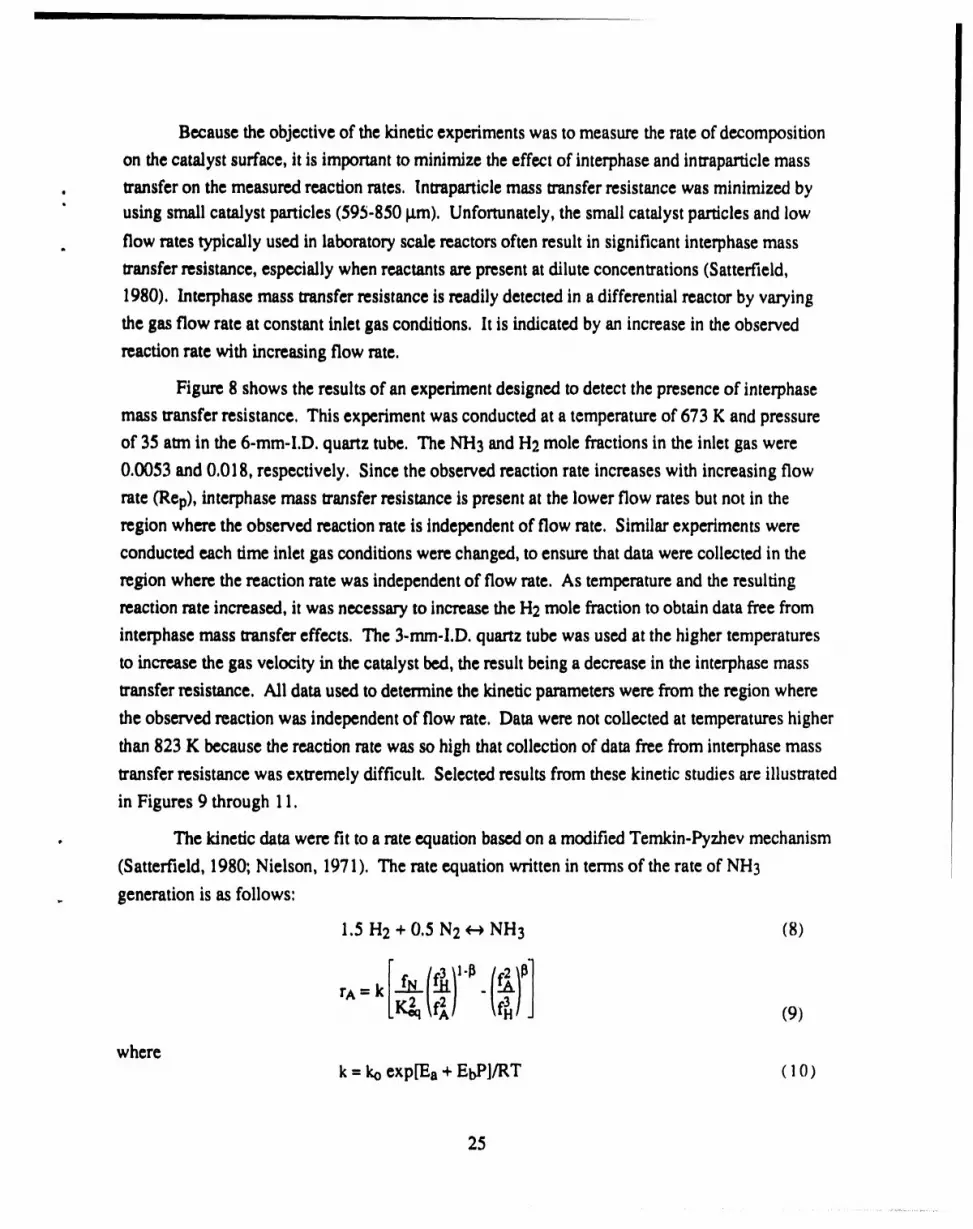
also conducted by OSU overa wide range of temperaturesand pressures. Figure 7 is a schematic
of the OSU reactor,which consisted of a catalyst bed insidea quartz U-tube. The inside diameter
of the tube in the catalyst bed sectionwas 3 mm in some experimentsand 6 mm in other
experiments. The reactorwas operatedin the differentialmode by keeping the NH3 conversion
below about 5%. Since the conversion is low, it is valid to assume a constant decomposition rate
9849.11A 15 rainat850°C; 1.73 x 10.5 2.84after leachingin 10 4,51 x 10⁻⁴ 1,67
- wt% HCI, 1 hr,25°C
9849-5A 15 rainat850°C; 1,94 x 10.6 5.26.......... leachinginHCI ....................................................... ......
55
Defect-free coatings on the Norton monolith could not be achieved. However, early results
with alumina glaze on the Refractron disks were rather encouraging and surprising, When the
alumina glaze was applied by dip coating and then cured by ramping the temperature for 40
minutes from room temperature to 850oC and then holding at 850oc for 15 minutes, the resulting
membrane had a hydrogen/nitrogen selectivity of 5.41 (Sample 9343-83C).
Reproducibility was a recurring problem. Two membranes were prepared with
hydrogen/nitrogen sclectivities greater than the Knudsen diffusion value of 3.74. These
membranes were Samples 9343-83C and 9849-5A. One of these membranes was leached in HCI,
and the other was not. It was surprising that a selectivity exceeding that predicted by Knudsen
diffusion could be found without HCI leaching of the glaze. In addition, it was surprising that the
permeance of the membrane not leached (Sample 9343-83C) exceeded by a factor of 10 that of the
membrane which was leached. These results typified the work with putting alumina glaze on
Refractron disks, and it was eventually decided that the approach itself was unlikely to lead to
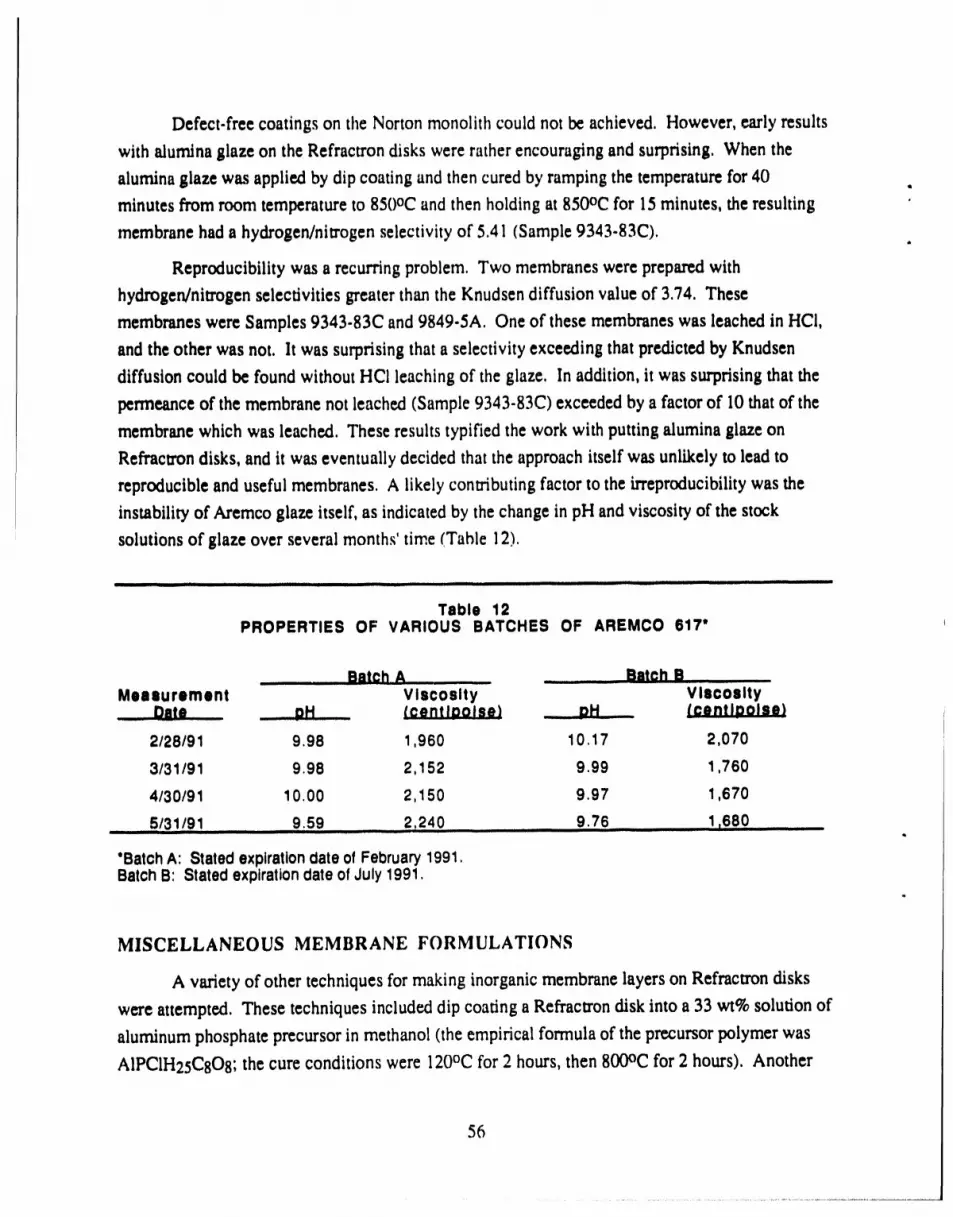
reproducible and useful membranes. A likely contributing factor to the irreproducibility was the' 1instability of Arcmco glaze ltse f, as indicated by the change in pH and viscosity of the stock
!
solutions of glaze over several months' time (Table 12).
Illllfl II IIIlIIlll I I IIH n iii [1111ii ii ill i iiiiiiiii1111 III I I IIIIIII I [[llj
Table 1RPROPERTIES OF VARIOUS BATCHES OF AREMCO 617"
.............. Batch A ............ . .................... Batch B .
Pressure 345 pslai iii iiiiiii IIIIm i III I . rlllllllUll i iii IIIB IIT!I lU I IIIIII i " I_l
O
69
................................ .... ii i ii i i _ ill11ii] IWIIIIRIITIIrlTII[JTI I I ................................
Table 17BREAKDOWN OF PROCESS PLANT COSTS BY PLANT SECTION
(Plant Size, 420.2 MW; Mid-1990 Dollars)
Area No. Plant Section DescriPtion ...... _$ (ThOuaand|) _;/KW
100 Coal receivinghandling 16,245 38.7
150 Limestonereceiving/handling 0 0.0
250 Boostercompression 9,272 22. i
300 Gasification 63,074 150.1
380 Recyclegascompression 18,044 42.9
400 Gas conditioning 38,645 92.0
500 Externaldesulfurlzatlon 32,897 78.3
600 Sulfatlon 0 0.0
700 Sulfuricacid plant 25,739 61,3
900 Gasturbinesystem 70,965 !68.9
1000 HRSG system 32,092 76.4
1100 Steamturbinesystem 41,604 99.0
1200 Ash& fines handling/disposal 4,491 10.7
Totalprocessplantcost 353,068 840.2
Generalplantfacilities 33,365 79.4
Engineeringfees 26,103 62.1
Source:'""DoE/Mc/26019-3004:' December 1990, '................... .
?O
Lit_ l,ln:_|I_l ............. II . - Hill 11111i iiiiii ii i ......
Table 18• FIRST YEAR O&M COST SUMMARY"b
,, Case S
Net MW{900F! 420,2
_, $ x 1000 33,576
YariableQ&M, Sx 1000
Limestone 0
Nahcolite 296
Zinc ferrlte 9,653
Miscellaneous 1,449
Solidsdisposal 564
Total,$ x 1000 11,961
FixedO&jM.SX1000
Operating labor 4,571
Supervision 1,165
Maintenance 9,839
Insurance/taxes 3,145
Other 583
Total,$ x 1000 19,302i!
By.productCredit.$ x 1000 3,471
TotalFirstYearO&M Costs.Sx 1000 61,368
Fuel,mills/kWh 14.03
Variablew/oby-productcredit,mills/kWh 5.O0I
Variable w/by-productcredit,mills/kWh 3.55
Fixed,$/kW-yr 45.9
TotalFirstYearO&MCostsmills/kWh 25.65
"Basedon mid:i990 dollarsand65=/,,¢a_city factorl CapacityfactorOf65% specifiedby DOE for comparisonto otherstudies.
71
To assess the cost of the membrane reactor systems, we chose to require that the H2S
reactor remove the same fraction of H2S as the zinc ferrite system (99.3%) and that the NH 3
reactor remove 90% of the ammonia (exact requirements for ammonia removal are not currently
specified by any regulatory agency, but 90% removal is expected for the future because of the
Clean Air Act amendments of 1990). We explain first the system parameters used in the membrane
reactor calculations.
Membrane Reactor System Parameters
The important parameters include membrane permeance and decomposition rates for H2S
and N- _3. The H2 permeance used in these evaluations is based on experimental data from OSU.
(Early permeance data were used, since that was all that was available at the time the economic
evaluations were performed' Because we expect the permeance in a commercial membrane
module to be less than that in laboratory membranes, we used a permeance value about half that
reported by OSU. /.lthough palladium is essentially impermeable to gases other than H2, there is
bound to be a finite leak rate due to fine cracks in the palladium layer or to defects in the seal
between the membrane tube and the module. We have assumed that a commercial module would
have a leak rate 10 times greater than that measured by OSU for their laboratory membrane. We
believe that membranes can be made thinner than those produced by OSU, and therefore we have
used a palladium membrane thickness of 5 _m. After adjustment 3 to 1000°F, the membrane
parameters used in calculations for H2S and NH 3 decomposition are as follows:
• Permeance of H2 (1flOf_°F)= 9.55 x 10.5 cm3(STP)'cmcm2.s-cm Hg0.5
• Leak rate of other species (1000°F) = 8.75 x 10"1°cm3(STP)'cmcm2-s-cm Hg
• Palladium membrane thickness = 5 I,tm.
The H2S reaction rate is given by Equation (B-2) and Keq is given by Equation (A-3) (see
Appendices A and B). The NH 3 reaction rate is given by Equations (6) and (7) and Keq which is -
defined by Equation (11), is given by
Keq = 1.0132 x l0 s {1022s°/Tl"sl°s log(T)-.8534-25.90x 10"ST + 14.90 x 10"8T2)} (40)
3 Permeationwasadjustedfor temperatureby usingan activationenergyof 2564cal/mol.This activationenergywasdeterminedusingthedata of Uemiyaetal. (1988).
72
where T is the temperature in kelvins. With the model developed by OSU and the parameters
mentioned above, we are able to compare the performance between a membrane reactor and aconventional reactor.
,m
H 2S Decomposition
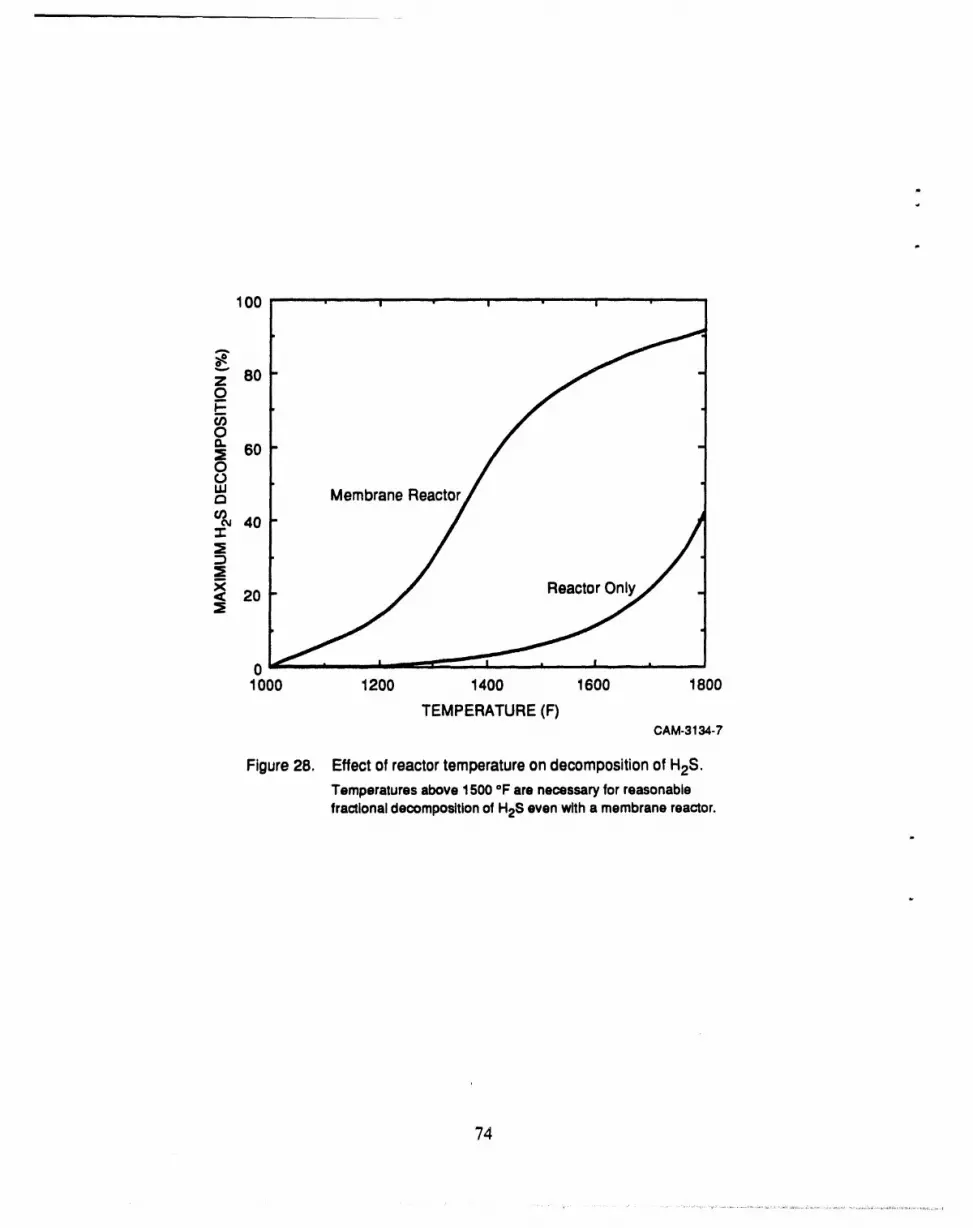
Figure 28 shows the maximum H2S decomposition attainable with both membraneand
conventional reactors4 over a range of temperatures. The figure shows that at 1000°F, the
operating temperatureof the IGCC, neither the conventinnal nnr the membrane reactor show any
conversion. Even at 1800°F (where Keqis most favorable), the conventional reactor achieves an
H2S conversion of only 40%. The membrane reactor, although substantially better than the
conventional reactor, can achieve at best a 92% decomposition, far less than the 99+% removal
desired. The reason for the low percentage of H2S decomposition is that a large fi'actionof the
feed stream leaks through the membrane as we try to achieve high conversions. Any H2S that
leaks through the membrane can not decompose and, if enough leaks through, the result is a low
percentage of H2S decomposition.
The low conversion calculated for the membrane reactor indicates that the reaction rate is
low relative to the leak rate. Therefore, to achieve higher H2S conversion we must increase the
reaction rate or lower the leak rate; since the leak rate is difficult to control, we chose to work
toward increasing the reaction rate. The reaction rate is low because of three factors: low equilib-
rium coefficient (see Figure A-1 ), high H2 concentration in feed, andlow H2S concentration in
feed [see Equation (A-4)]. While we cannot affect the first factor, it is possible to change the
concentrations of both H2 and H2S in the feed. Bearing this in mind, we have proposed two
modified process configurations to increase the fractional decomposition of H2S in the membrane
reactor.
The first configuration provides for preconcentration of the H2S prior to introduction to the
. membrane reactor (Figure 29). The second configuration provides for H2 removal from the feed
stream prior to introduction to the membrane reactor (Figure 30). To achieve these two separation
"6
4 Themaximumdecompositionwitha conventionalreactoroccurswhenenoughH2SdecomposessuchthattheremainingH2Sis in equilibriumwith theothergas species.Witha membranereactor,decompositioncan continueas long as the reactionproduct,H2,is removedbythe membrane.Thusthe maximumdecompositionwithamembranereactoroccurswhentheentirefeedstreamhaspermeatedthemembrane.(BecausesomeundecomposedH2Spermeatesthe membranethroughleaks,thepermeatestreamcancontaina significantfractionof H2S.)
The objective of this project was to develop high temperature, high pressure catalytic ,,
ceramic membrane reactors and to demonstrate the feasibility of using these membrm_e reactors to
control gaseous contaminants (hydrogen sulfide and ammonia) in IGCC systems. Our strategy
was to first develop catalysts and membranes suitable for the IGCC application, and then combine
these two components as a complete membrane reactor system. We also developed a computer
model of the membrane reactor and used it, along with experimental data, to perform an economic
analysis of the IGCC application.
The two catalysts we prepared were very effective in increasing the decomposition rate of
both NH3 and H2S. Our membrane development work demonstrated that palladium membranes
produced by electroless plating onto alumina ultrafilters produces an effective membrane for
selective H2 permeation. The NH3 catalyst was used with the palladium membrane in a membrane
reactor. We achieved 95% NH3 decomposition under some conditions, and under all conditions a
membrane reactor resulted in significantly greater NH3 decomposition than did a conventionalreactor.
Economic evaluations indicate that decomposition of H2S in the IGCC process with a
membrane reactor is very difficult (and even more so with a conventional reactor) because of the
low value of the H2S decomposition equilibrium constant and the high ratio of H2 to H2S in the
feed stream. For NH3 our evaluations were promising; the maximum conversion that could be
achieved was 89%. To achieve the desired level of NH3 decomposition (90%), the NH3 should be
concentrated in the feed prior to entering the membrane reactor. If the feed NH3 concentration can
be increased to 5%, the cost of producing electricity would increase by about 1% as a result of the
costs for the ammonia decomposition reactor. These calculations were performed using early
experimental results. Later experiments showed improved membrane propertie3; if these data were
used in the economic analysis, higher conversions and lower costs would have resulted.
This project has demonstrated the feasibility of using a membrane reactor to remove trace
contaminants from an IGCC process. Experiments showed that NH3 efficiencies of 95% can be
achieved. Our economic evaluation predicts costs of less than 1% of the total electricity cost;
improved membranes would give even higher conversions and lower costs. We believe the
catalysts are sufficiently developed and that the primary need for future work is improvements in
the H2 selective membrane. Methods fur f_tbric_ttiilginexpensive and robust membranes are
needed.
88
REFERENCES
MEMBRANES
Anderson, M., M. Gieselmann, and Q. Xu, "Titania and Alumina Ceramic Membranes,"J. Memb. Sci., 39, 243-258 (1988).
Bhave, R. R., D. F. Flowers, J. L. Pszczolkowski, and P.K.T. Liu, "Assessment of CommercialCeramic Membranes for High Temperature Gas Separations," presented at 6th Symposium onSeparation Science and Technology for Energy Applications, Knoxville, 'IN, October 22-26,1989.
Egan, B. Z., "Using Inorganic Membranes to Separate Gases' R & D Status Review,"ORNL/TM- 11345, November 1989.
Hwang, S.T., and K. Kammermeyer, Membranes in Separations (Robert E. Krieger, Malabar,FL, 1984).
Keizer, K., R.J.R. Uhlhorn, R. J. Van Vuren, and A. J. Burggraaf, "Gas Separation Mechanismsin Microporous Modified y-A1203 Membranes," J. Memb. Sci., 39, 285-300 (1988).
Koresh, J. E., and A. Sofer, "The Carbon Molecular Sieve Membranes," Sep. Sci. Technol., 22,973-982 (1987).
Moore, R. H., C. H. Allen, G. F. Schiefelbein, and R. J. Maness, "A Process for Cleaning andRemoval of Sulfur Compounds from Low BTU Gases," Interim Report, October 1972-August1974, GPO Catalog No. I:63, 10:100/Int. 1 (1974).
Pez, G. P., and R. T. Carlin, "Method for Gas Separation," U.S. Patent 4617029, October 14,1986; Assignee: Air Products and Chemicais, Inc.
Suzuki, H., U.S. Patent 4699892 (1987).
Way, J. D., and D. L Rober:s, "Hollow Fiber Inorganic Membranes for High Temperature Gas, Separations," presented at 6th Symposium on Separation Science and Technology for Energy
Applications, Knoxville, TN, October 22-26, 1989.
r_
CATALYSIS- HYDROGEN SULFIDE
Chivers, T., J. B. Hyne, and C. Lau, "The Thermal Decomposition of Hydrogen Sulfide overTransition Metal Sulfides," Int. J. Hydrogen Energy, 5,499-506 (1980).
Chivers, T., and C. Lau, "The Thermal Decomposition of Hydrogen Sulfide over Vanadium andMolybdenum Sulfides andMixed Sulfide Catalysts in Quartz andThermal Diffusion ColumnReactors," Int. J. Hydrogen Energy, 12,235-243 (1987a).
89
Chivers, T., and C. Lau, "The Use of Thermal Diffusion Column Reactors for the Production ofHydrogen and Sulfur from the Thermal Decomposition of Hydrogen Sulfide over Transition MetalSulfides," Int. J. Hydrogen Energy, 12, 561-569 (1987b).
Fukuda, K., M. Dokiya, T. Kameyama, and Y. Kotera, "Catalytic Decomposition of Hydrogen tSulfide," Ind. Eng. Chem. Fund., 17, 243-248 (1978).
Katsumoto, M., K. Fueki, and T. Mukaibo, "An Investigation of the Gas-Solid InterfaceReaction," Bull. Chem. Soc. Japan, 46, 3641-3644 (1973).
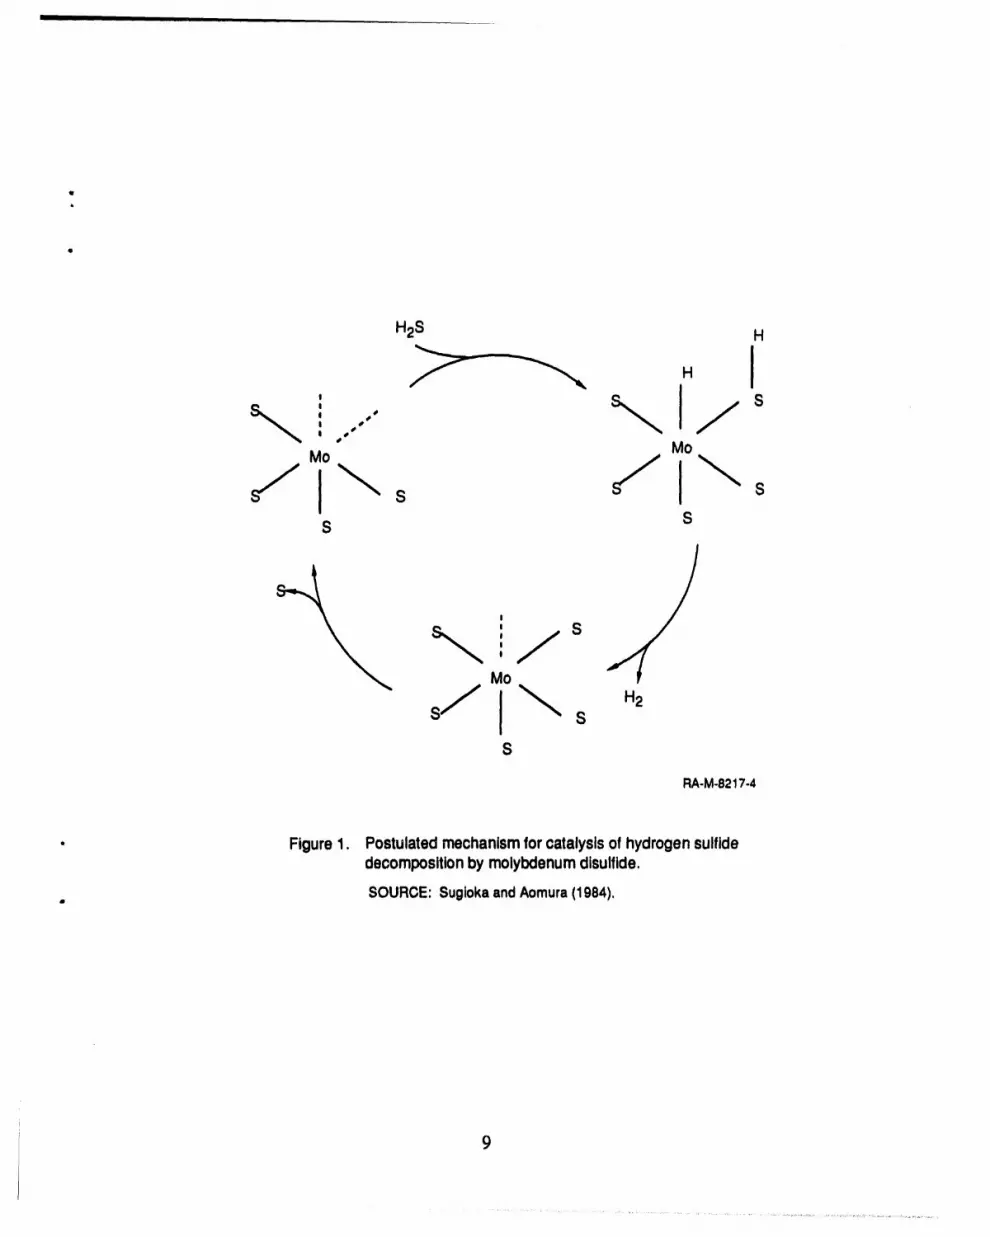
Sugioka, M., and K. Aomura, "A Possible Mechanism for Catalytic Decomposition of HydrogenSulfide over Molybdenum Disulfide," Int. J. Hydrogen Energy, 9, 891-894 (1984).
CATALYSIS- AMMONIA
Ertl, G., and M. Huber, "Mechanism and Kinetics of Ammonia Decomposition on Iron," J.Catal., 61,537-539 (1980).
Friedlander, A. G., P. R. Courty, and R. E. Montarnal, "Ammonia Decomposition in thePresence of Water Vapor, I. Nickel, Ruthenium and Palladium Catalysts," J. Catal., 48, 312-321(1977a).
Friedlander, A. G., P. R. Courty, and R. E. Montarnal, "Ammonia Decomposition in thePresence of Water Vapor, II. Kinetics of the Reaction of Nickel Catalysts," J. Catal., 48, 322-332(1977b).
Gates, B., J. Katzer, and G. Schuit, Chemistry of Catalytic Processes (McGraw-Hill, New York,1979).
Klimisch, R., and K. Taylor, "Catalytic Reduction of Nitric Oxide on Ruthenium," Ind. Eng.Chem., Prod. Res. Dev., 14, 26-29 (1975).
Krishnan, G. N., B. J. Wood, and A. Sanjurjo, "Study of Ammonia Removal in CoalGasification Processes, Topical Report: Literature Review," DOE Contract DE-AC21-86MC23087, May 1987.
Krishnan, G. N., B. J. Wood, G. T. Tong, and J. G. McCarty, Final Report, DOE Contract DE-AC21-86MC23087, September 1988.
McCabe, R. W., "Kinetics of Ammonia Decomposition on Nickel," J. Catal., 79, 445-450 ,_(1980).
Nielsen, A., "Review of Ammonia Catalysis," in: Catalysis Reviews, Vol. 4, H. Heinemann(Ed.) (Marcel Dekker, Inc., New York, 1971), pp. 1-25.
Rostrup-Nielson, J. R., "Activity of Nickel Catalysts for Steam Reforming of Hydrocarbons," J.Catal., 31,173-199 (1973).
Satterfield, C. N., Heterogeneous Catalysis in Practice (McGraw-Hill, New York 1980).
9O
Taylor, K., R. Sinkevitch, and R. Klimisch, "The Dual State Behavior of Supported Noble MetalCatalysts," J. Catal., 35, 34-43 (1974).
Tsai, W., J. Vajo, and W. H. Weinberg, "Mechanistic Details of the HeterogeneousDecomposition of Ammonia on Platinum," J. Phys. Chem., 89, 4926-32 (1985).
_, MEMBRANE REACTORS
Abe, F., "Porous Membrane for Use in Reaction Process," European Patent Application 228885,dated July 15, 1987; filed December 22, 1986; Applicant: NGK Insulators, Ltd.
Armor, J. M., "Catalysis with Permselective Inorganic Membranes," Appl. Catal., 49, 1-25(1989).
Gryaznov, V. M., and A. N. Karavanov, Khim-Farm. Zh., 13, 74 (1979).
Gryaznov, V. M., and M. G. Slinko, Discuss Faraday Soc., 73 (1982).
Gryaznov, V. M., "Hydrogen Permeable Palladium Membrane Catalysts," Platinum Met. Rev.,30, 68-72 (1986).
Itoh, N., Y. Shindo, K. Haraya, K. Obata, andT. Hakuta, "A Membrane Reactor for Promoting aReversible Reaction," Paper No. 1l-P04, International Congress on Membranes and MembraneProcesses, Tokyo, Japan, June 8-12, 1987.
Itoh, N., Y. Shindo, K. Haraya, K. Obata, T. Hakuta, and H. Yoshitome, "Simulation of aReaction Accompanied by Separation," Ind. Chem. Eng., 25, 138-142 (1985).
Kameyama, T., M. Dokiya, K. Fukuda, and Y. Kotera, "Differential Permeation of HydrogenSulfide through a Microporous Vycor-Type Glass Membrane in the Separation System ofHydrogen and Hydrogen Sulfide," Sep. Sci. Tech., 14, 953-957 (1979).
Kameyama, T., M. Dokiya, M. Fujishige, H. Yokokawa, and K. Fukuda, "Possibility ofEffective Production of Hydrogen from Hydrogen Sulfide by Means of a Porous Vycor GlassMembrane," Ind. Eng. Chem. Fundam., 20, 97-99 (1981a).
Kameyama, T., K. Fukuda, M. Fujishige, H. Yokokawa, and M. Dokiya, "Production ofHydrogen from Hydrogen Sulfide by Means of Selective Diffusion Membranes," HydrogenEnergy Prog,, 2,569-579 (1981 b).I
Misehenko, A. P., V. M. Gryaznov, V. S. Smirnov, E. D. Senina, I. L. Parbuzina, N. R.Roshan, V. P. Polyakova, and E. M. Savitsky, U.S. Patent 4179470 (1979).
Mohan, K., and R. Govind, "Analysis of a Cocurrent Membrane Reactor," AIChE J., 32, 2083-2086 (1986)
Shinji, O., M. Misono, and Y. Yoneda, "The Dehydrogenation of Cyclohexane by the Use of aPorous Glass Reactor," Bull. Chem. Soc. Japan, 55, 2760-2764 (1982).
Sun, Y. M., and S. J. Khang, "Catalytic Membrane for Simultaneous Chemical Reaction andSeparation Applied to a Dehydrogenation Reaction," Ind. Eng. Chem. Res., 27, 1136-1142(1988).
91
GENERAL
Barrer, R. M., "Diffusion in and through Solids" (Cambridge University Press, New York, 1951).
Blum, Y., R. M. Laine, K. B. Schwartz, D. J. Rowcliffe, R. C. Benning, and D. C. Cotts, "A •New Catalytic Method for Producing Preceramic Polysilazanes," in Better Ceramics throughChemistry//, C. J. Brinker, E. D. Clark, and D. R. Ulrich, Eds., Mater. Res. Soc. Syrup. Proc.,73, 389 (1986). .'
Blum, Y. D., K. B. Schwartz, and R. M. Laine, "Preceramic Polye_er Pyrolysis I. PyrolyticProperties of Polysilazanes," J. Mat. Sci., 24, 1707-1718 (1989).
Collins, J. P., J. D. Way, and N. Kraisuwansarn, "A Mathematical Model of a CatalyticMembrane Reactor for the Decomposition of NH3," North American Membrane Society,Lexington, KY, May 1992.
Hammel, J. J., "Porous Inorganic Siliceous-Containing Gas Enriching Material and Process ofManufacture and Use," U.S. Patent 4,853,001, Assignee: PPG Industries, Inc., Pittsburgh, PA(August 1, 1989).
Hammel, J. J., W. J. Robertson, W. P. Marshall, H. W. Baach, B. Das, M. A. Smoot, and P.Beaver, "process of Gas Enrichment with Porous Siliceous-Containing Material," U.S. Patent4,842,620, Assignee: PPG Industries, Inc., Pittsburgh, PA (June 27, 1989).
Okubo, T., K. Haruta, K. Kusakabe, S. Morooka, H. Anzai, and S. Akiyama, "Equilibrium Shiftof Dehydrogenation at Short Space-Time with Hollow Fiber Ceramic Membrane," Ind. Eng.Chem. Res., 30, 614-616 (1991).
Rhoda, R. N., "Electroless Palladium Plating," Trans. Inst. Metal Finishing, 36, 82-85 (1959).
Roberts, D. L., I. C. Abraham, Y. Blum, and J. D. Way, "Gas Separation with GlassMembranes," Final Report, DOE Contract DE-AC21-88MC25204, May 1992.
Uemiya, S., Y. Kuda, K. Sugino, N. Sato, T. Matuda, E. Kikuchi, "A PalladiumNorous ClassComposite Membrane for Hydrogen Separation," Chem. Len., pp. 1687-90 (1988).
Wise, E. M., Palladi_ecovery, Properties, and Uses (Academic Press, New York, 1968).
92
Q
Appendix A
THERMODYNAMICS OF THE DECOMPOSITIONOF HYDROGEN SULFIDE
APPENDIX A ¢a
THERMODYNAMICS OF THE DECOMPOSITION OF HYDROGEN SULFIDE:
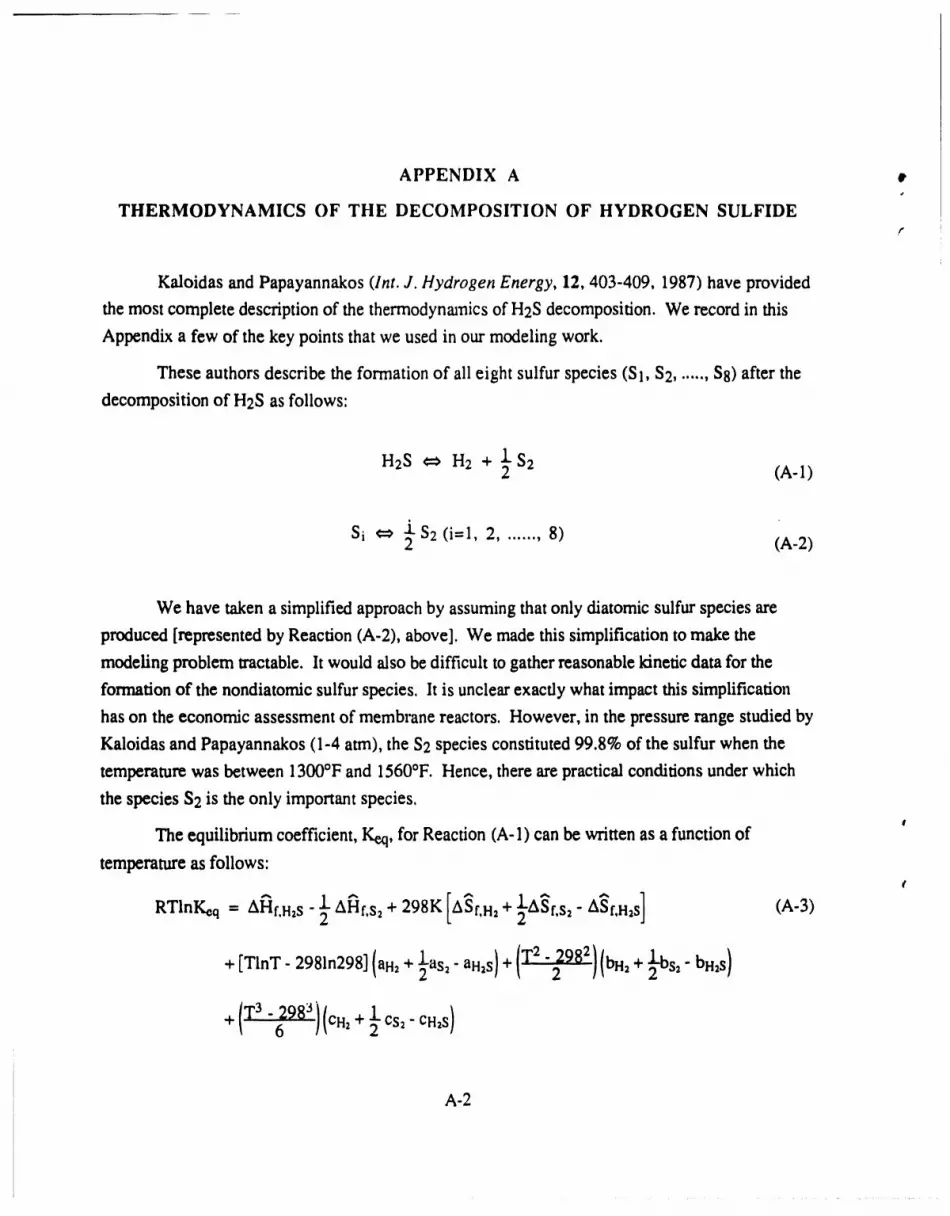
Kaloidas and Papayannakos (Int. J. Hydrogen Energy, 12,403-409, 1987) have provided
the most complete description of the thermodynamics of H2S decomposition. We record in this
Appendix a few of the key points that we used in our modeling work,
These authors describe the formation of all eight sulfur species (SI, $2, ..... , $8) after the
decomposition of H2S as follows:
H2S _ H2 + ½S2 (A-I)
Si _ _- 52 (i-l, 2, ...... ,8) (A-2)
We have taken a simplified approach by assuming that only diatomic sulfur species are
produced [represented by Reaction (A-2), above]. We made this simplification to make the
modeling problem tractable. It would also be difficult to gather reasonable kinetic data for the
formation of the nondiatomic sulfur species. It is unclear exactly what impact this simplification
has on the economic assessment of membrane reactors. However, in the pressure range studied by
Kaloidas and Papayannakos (1-4 atm), the S2 species constituted 99.8% of the sulfur when the
temperature was between 1300°F and 1560°F. Hence, there are practical conditions under which
the species $2 is the only important species.I
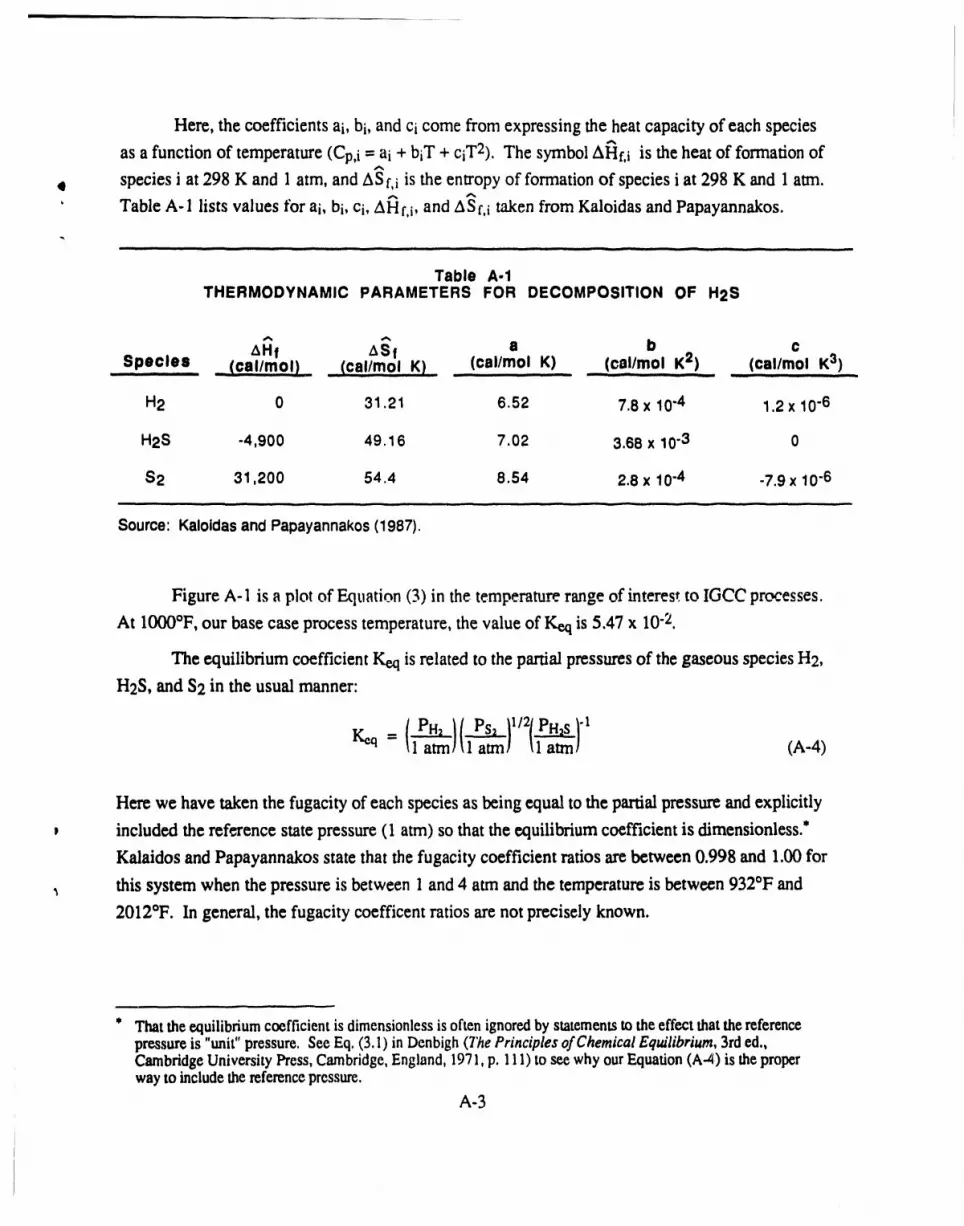
The equilibrium coefficient, Keq, for Reaction (A-1) can be written as a function of