Determination of Aflatoxins and Ochratoxin A in Ginseng and Other Botanical Roots by Immunoaffinity Column Cleanup and Liquid Chromatography with Fluorescence Detection Mary Trucksess, U.S. Food and Drug Administration, 5300 Paint Branch Pkwy, College Park, MD Carol Weaver, U.S. Food and Drug Administration, 5300 Paint Branch Pkwy, College Park, MD Carolyn Oles, U.S. Food and Drug Administration, 5300 Paint Branch Pkwy, College Park, MD Kathleen D’Ovidio, and University of Maryland, College Park, MD Jeanne Rader U.S. Food and Drug Administration, 5300 Paint Branch Pkwy, College Park, MD Abstract Mycotoxins are toxic secondary metabolites produced by certain molds and are common contaminants of many important food crops, such as grains, nuts, and spices. Some mycotoxins are found in fruits, vegetables, and botanical roots. These contaminants have a broad range of toxic effects, including carcinogenicity, immunotoxicity, neurotoxicity, and reproductive and developmental toxicity. The public health concerns related to both acute and chronic effects of mycotoxins in animals have prompted more than 100 countries to establish regulatory limits for some of the well-known mycotoxins, such as the aflatoxins (AFL). Our research focused on method development for 2 of these toxins, AFL and ochratoxin A (OTA), in ginseng and other selected botanical roots. Methods using an immunoaffinity column (IAC) cleanup, liquid chromatographic separation, and fluorescence detection were modified and evaluated. Two types of IAC cleanup were evaluated: IAC for AFL, and IAC for both AFL and OTA. Three derivatization techniques to enhance the fluorescence of the AFL were compared: precolumn trifluoroacetic acid, postcolumn bromination, and postcolumn ultraviolet irradiation. No derivatization was needed for OTA. Results for AFL using the single analyte IAC cleanup and the 3 derivatization techniques were all comparable for ginseng and for other roots such as ginger, licorice, and kava-kava. Recoveries of added AFL for ginseng at levels from 2 to 16 ng/g were about 80%. Using IAC cleanup for both AFL and OTA recoveries of added AFL for ginseng at 4–16 ng/g were about 70%, and for ginger, licorice, and kava- kava were about 60%. Recoveries of added OTA for ginseng, ginger, and echinacea at 4 ng/g were about 55%. Many herbs are imported from countries where quality control may be deficient. The materials may be moldy due to exposure to adverse weather conditions, insect damage, improper harvesting procedures, transportation, inadequate drying, and poor storage facilities. The growing mold may produce toxic secondary metabolites, such as mycotoxins. Among hundreds of fungal secondary metabolites, 5 mycotoxins are of major health concern for humans and Corresponding author’s e-mail: [email protected]. NIH Public Access Author Manuscript J AOAC Int. Author manuscript; available in PMC 2008 November 24. Published in final edited form as: J AOAC Int. 2006 ; 89(3): 624–630. NIH-PA Author Manuscript NIH-PA Author Manuscript NIH-PA Author Manuscript
Transcript
Determination of Aflatoxins and Ochratoxin A in Ginseng andOther Botanical Roots by Immunoaffinity Column Cleanup andLiquid Chromatography with Fluorescence Detection
Mary Trucksess,U.S. Food and Drug Administration, 5300 Paint Branch Pkwy, College Park, MD
Carol Weaver,U.S. Food and Drug Administration, 5300 Paint Branch Pkwy, College Park, MD
Carolyn Oles,U.S. Food and Drug Administration, 5300 Paint Branch Pkwy, College Park, MD
Kathleen D’Ovidio, andUniversity of Maryland, College Park, MD
Jeanne RaderU.S. Food and Drug Administration, 5300 Paint Branch Pkwy, College Park, MD
AbstractMycotoxins are toxic secondary metabolites produced by certain molds and are commoncontaminants of many important food crops, such as grains, nuts, and spices. Some mycotoxins arefound in fruits, vegetables, and botanical roots. These contaminants have a broad range of toxiceffects, including carcinogenicity, immunotoxicity, neurotoxicity, and reproductive anddevelopmental toxicity. The public health concerns related to both acute and chronic effects ofmycotoxins in animals have prompted more than 100 countries to establish regulatory limits for someof the well-known mycotoxins, such as the aflatoxins (AFL). Our research focused on methoddevelopment for 2 of these toxins, AFL and ochratoxin A (OTA), in ginseng and other selectedbotanical roots. Methods using an immunoaffinity column (IAC) cleanup, liquid chromatographicseparation, and fluorescence detection were modified and evaluated. Two types of IAC cleanup wereevaluated: IAC for AFL, and IAC for both AFL and OTA. Three derivatization techniques to enhancethe fluorescence of the AFL were compared: precolumn trifluoroacetic acid, postcolumnbromination, and postcolumn ultraviolet irradiation. No derivatization was needed for OTA. Resultsfor AFL using the single analyte IAC cleanup and the 3 derivatization techniques were all comparablefor ginseng and for other roots such as ginger, licorice, and kava-kava. Recoveries of added AFL forginseng at levels from 2 to 16 ng/g were about 80%. Using IAC cleanup for both AFL and OTArecoveries of added AFL for ginseng at 4–16 ng/g were about 70%, and for ginger, licorice, and kava-kava were about 60%. Recoveries of added OTA for ginseng, ginger, and echinacea at 4 ng/g wereabout 55%.
Many herbs are imported from countries where quality control may be deficient. The materialsmay be moldy due to exposure to adverse weather conditions, insect damage, improperharvesting procedures, transportation, inadequate drying, and poor storage facilities. Thegrowing mold may produce toxic secondary metabolites, such as mycotoxins. Among hundredsof fungal secondary metabolites, 5 mycotoxins are of major health concern for humans and
NIH Public AccessAuthor ManuscriptJ AOAC Int. Author manuscript; available in PMC 2008 November 24.
Published in final edited form as:J AOAC Int. 2006 ; 89(3): 624–630.
NIH
-PA Author Manuscript
NIH
-PA Author Manuscript
NIH
-PA Author Manuscript
domestic animals: aflatoxins (AFL), deoxynivalenol, fumonisins (FB), ochratoxin A (OTA),and zearalenone (1). AFL consist of 4 structurally related compounds: the aflatoxins B1(AFB1), B2 (AFB2), G1 (AFG1), and G2 (AFG2). More than 35 types of food products in themarketplace have been reported to be contaminated with AFL or metabolites of AFL. Theseinclude tree nuts, peanuts, figs, melon seed, pumpkin seed, sesame seed, sunflower seed, lotusseed, coix seed, red pepper, white pepper, nutmeg, paprika, mixed spice, rice, corn, mixedcereals, chilies, and copra (2). AFL have been found in herbs and spices at levels ranging fromless than 10 to 51 ng/g (3). In another report, AFL were found in ginseng samples at levelsranging from 0.2 to 15 ng/g (4). OTA has been found in many cereals, raisins, cocoa products,green coffee beans, wine, soybeans, grape juice, pork sausages (5), spices, and herbs (6).
The International Agency for Research on Cancer (IARC; 7) has classified AFB1 as a humancarcinogen and OTA as a possible human carcinogen. Our research focused on methods forAFL and OTA in botanical roots, specifically ginseng. Ginseng is one of the most widely soldherbs in the United States and has been used for over 3000 years for its medicinal andadaptogenic properties. There are 2 plant species labeled as ginseng: American ginseng (Panaxquinquefolius), a species native to and primarily grown in the United States; and Asian ginseng(Panax ginseng), more commonly grown in Korea, Japan, and China.
Many analytical methods have been developed for AFL and OTA. These includechromatographic techniques such as thin-layer chromatography (TLC), liquid chromatography(LC), and immunoaffinity-based methods, such as enzyme-linked immunosorbent assay(ELISA) and immunoaffinity column (IAC) LC. These methods are applicable primarily tograin and grain products, but some are applicable to body fluids and animal tissues (8,9). Themethods can give unreliable results when applied to new types of products. The very limitedsurveys of mycotoxin contamination in some herbal products thus far published are sketchy(3,5,10). No detailed information on the methods is described, and the number of samplesanalyzed is limited. For the most part, no attempts were made to confirm the results byappropriate techniques.
Because the IAC is more environmental- and user-friendly (11), it was selected as a cleanupcolumn for this project. The IAC has the capability to isolate and purify the toxins that werethen separated and quantified by reverse-phase LC without derivatization for OTA but withprecolumn and postcolumn derivatization for AFL with fluorescence detection.
In this study, 2 types of IAC were evaluated: IAC for AFL (IAC/AFL; contains antibodiesspecific to AFL) and IAC for AFL and OTA (IAC/AFL-OTA; contains antibodies specific toAFL and OTA). Three different derivatization techniques to produce the highly fluorescentderivatives AFB2a and AFG2a from the less fluorescent AFB1 and AFG1, respectively, usingreverse-phase LC separation were compared: precolumn derivatization (preCD) withtrifluoroacetic acid (TFA), and postcolumn derivatization (PCD) using a PHRED cell or Kobracell. The PHRED produces AFB2a and AFG2a derivatives from AFB1 and AFG1 respectively,that are subjected to ultraviolet (UV) irradiation while passing through the reaction coil thatwraps around the UV light. The Kobra cell generates bromine to produce the brominatedderivatives of the AFB1 and AFG1.
ExperimentalPlant Material
The finely ground ginseng (Panax quinquefolius) samples were purchased from SchumacherGinseng (Marathon, WI). The finely ground Echinacea purpea, ginger (zingiber officinale),kava-kava (Piper methysticum), and licorice (glycyrrhiza glabra) samples were purchasedfrom Penn Herb Co. (Philadelphia, PA).
Trucksess et al. Page 2
J AOAC Int. Author manuscript; available in PMC 2008 November 24.
NIH
-PA Author Manuscript
NIH
-PA Author Manuscript
NIH
-PA Author Manuscript
Apparatusa. Orbital shaker.—No. DS-500E (VWR International, Bridgeport, NJ).
b. Centrifuge tube.—50 mL, polypropylene.
c. Refrigerated centrifuge.—No. DS-500E (VWR International).
d. Solid-phase extraction (SPE) manifold.—12 ports (Alltech Associates).
e. Glass microfiber filter paper.—11 cm, No. 934AH (Whatman, Inc., Florham Park,NJ).
f. IAC.—Aflatest P column, Aflaochra Test column (Vicam, Watertown, MA).
g. Column reservoir.—15 mL polypropylene (Alltech Grace Davison).
h. LC system.—Model 2690 Alliance and Model 474 fluorescence detector (WatersCorp., Milford, MA). LC operating conditions.—Flow rate, 1.0 mL/min; detector foraflatoxins set at excitation wavelength (Ex) 362 nm, emission wavelength (Em) 440nm, for OTA set at Ex 333 nm. Em 460 nm; column: for aflatoxins, WatersAQ12S031546WT, YMC ODS-AQ S-3, 4.6 × 150 nm; for OTA, Beckman No.235332, Utrasphere, 4.6 × 250 mm, 5 μm (Beckman Instruments, Inc., Fullerton, CA).
i. LC/mass spectrometry (LC/MS) system.—Micromass Quattro Micro triple-quadrupole mass spectrometer with an Agilent HPLC (Model 1100) electrosprayionization (ESI) source cooperated with the following conditions: source temperature150°C, desolvation temperature 250°C, cone gas flow 208 L/h, desolvation gas flow508 L/h; column. Phenomenex Luna 3 μL, 2 mm, C18; mobile phase, acetonitrile-water-acetic acid (50 + 50 + 1); flow rate. 0.230 mL/min.
j. PCD system.—PHRED cell (postcolumn photochemical derivatization cell; AURAIndustries, New York, NY) and Kobra cell (postcolumn bromination derivatizationcell; R-Biopharm Inc., Marshall, MI), set at 100 μA. (Caution: Do not turn on currentuntil the LC pump is operating to avoid overheating the cell membrane.)
(c) AFL—A6636, A9887, A0138, A0263 (Sigma-Aldrich) Prepare stock standard solutionsof each of the 4 AFL at 10μg/mL in acetonitrile according to revised AOAC Method 971.22(12). Prepare an intermediate mixed standard solution to contain AFL at 400 ng/mL (B1, B2,G1, and G2 at 200, 50, 100, and 50 ng/mL) by adding appropriate amount of each aflatoxinstock standard to the same volumetric flask and diluting to volume with acetonitrile. Use the400 ng/mL solution to prepare working standard solutions and to spike test samples forrecovery study. Prepare working standard solutions with total AFL at 1, 2, 4, and 8 ng/mL bydiluting the intermediate mixed standard solution with methanol–water (1 + 1).
(d) OTA standard solutions—OTA was isolated from cultures and purified in the U.S.Food and Drug Administration (FDA) laboratory. Prepare a stock standard solution at 100μg/mL in methanol according to AOAC Method 973.37 (12). Prepare intermediate standardsolutions at 200 and 20 ng/mL. Prepare working standards at 4, 2, 1, and 15 ng/mL by making
Trucksess et al. Page 3
J AOAC Int. Author manuscript; available in PMC 2008 November 24.
NIH
-PA Author Manuscript
NIH
-PA Author Manuscript
NIH
-PA Author Manuscript
serial dilution from the 20 ng/mL intermediate standard solution with methanol water (1 + 1).Use the 200 ng/mL OTA intermediate standard for recovery study.
(e) Mobile phase—Isocratic, 1 mL/min. For AFL precolumn derivatization, wateracetonitrile methanol (60 + 25 + 15); for AFL postcolumn derivation with the Kobra cell,water–methanol–acetonitrile (620 + 220 + 160) + 350 μL 4 N nitric acid + 120 mg potassiumbromide; for AFL postcolumn derivation with the PHRED cell, water– methanol–acetonitrile[600 + 250 +150); for OTA, acetonitrile–water–acetic acid [50 + 50+1).
Extraction of SamplesWeigh 5 g of test sample in a 50 mL centrifuge tube. Add 1 g NaCl and 25 mL of extractionsolution, and shake at 300 rpm for 30 min. Centrifuge at standard acceleration of gravity (g)of 5323 mm/s2 (centrifuge set at 7000 rpm) at 10°C for 10 min. Pipet 7 mL into a 50 mLcentrifuge, add 28 mL PBS mixture, and centrifuge again. Filter through glass microfiber paper.Collect 25 mL filtrate (equivalent to 1 g of test sample) into a 25 mL graduated cylinder andproceed immediately with IAC chromatography.
IAC ChromatographyAttach the IAC to the SPE manifold and connect a reservoir to the IAC. Add diluted test extractto the reservoir and pass through the IAC. Wash the column with 10 mL PBS followed by 10mL water. Let the column run by gravity. Use a syringe to pass air through to dry the columnfor 1 s.
(a) Aflatest P column(1) Precolumn derivatization: Remove the column and place in a 4 mL vial. Add 1.0 mLCH3CN to column directly. Collect eluate into a 4 mL vial. Collect in the same vial. Wait 1min, add 1.0 mL CH3CN to the column again. Wait another 1 min and add 1.0 mL CH3CN.Push air through the column when the column stops dripping in order to collect the remainingeluate. Evaporate the eluate to dryness under a stream of nitrogen in a 50°C water bath. Add200 μL CH3CN to the dry film. Mix on a Vortex mixer, add 300 μL derivatization reagent,cap, and mix. Place the vial in a 65°C heating block for 9 min. Remove from the heat, cool,add 500 μL water, and perform LC analysis. Prepare derivatives of aflatoxin standards byevaporating 1 mL of each working standards to dryness and follow the same procedure as fortest samples.
(2) Postcolumn derivatization: Remove the column and place it in a 5 mL volumetric flask,making sure that the tip of the column is inside of the flask and the body of the column isslightly above the opening of the flask. Elute the column in the same manner as (a). Collectthe eluate, add water, and dilute to the mark. Mix and perform LC analysis
(b) Aflaochra test column—Use the same procedure as for the Aflatest P column, exceptelute AFL and OTA from the column with methanol, collect the eluate in 5 mL volumetricflask, and dilute to mark with water. Perform LC analysis for OTA, and perform postcolumnderivatization LC analysis for AFL.
For OTA analysis, inject 50 μL reagent blank (50% methanol), working OTA standards, ortest sample into the LC column. Identify the OTA peak in the test samples by comparingretention times (ca 8.7 min) with those of standards. Construct the standard curve. Determinethe concentration of OTA in the test solution from the standard curve. If the test sample gives
Trucksess et al. Page 4
J AOAC Int. Author manuscript; available in PMC 2008 November 24.
NIH
-PA Author Manuscript
NIH
-PA Author Manuscript
NIH
-PA Author Manuscript
a response that is out of the range of the standard curve, dilute with acetonitrile-water orconcentrate and reinject to bring the sample response within the range of standard curve.
For pre-CD of AFL, inject 50 μL reagent blank (50% acetonitrile), derivatives of aflatoxinworking standards, or test sample into the LC column. Identify peaks of AFL test samples bycomparing retention times with those of standards. Aflatoxins elute in the order G2a (derivativeof G1), B2a (derivative of B1), G2, and B2 with retention times between ca 4 and 10 min andshould be baseline resolved. Construct standard curves of each aflatoxin. Determine theconcentration of each aflatoxin in a test solution from the standard curves.
For PCD of AFL, use the same LC procedure as for precolumn derivatization. Aflatoxins elutein the order AFG2, AFG2a, AFB2, and AFB2a with retention times between ca 10 and 20 min.
CalculationsPlot peak area (response, y-axis) of each toxin (OTA and each aflatoxin) standards againstconcentration (ng/mL, x-axis) and determine slope (S) and y-intercept (a). Calculate the levelof toxin in the sample with the following formula if the injection volumes of the standards andtest solutions are the same:
where R is the test solution peak area and V is the final volume (mL) of the injected test solution.W is 1 g test sample passed through the IAC. The level of total aflatoxins is the sum of the 4aflatoxins.
ResultsThe extraction method for AFL in corn, peanuts, and peanut butter (8) was modified. The testsample size was reduced to 5 g because the botanical roots obtained from commercial sourceswere in a very fine powder form. The extraction solvent was methanol–PBS (8 + 2) containing1% Tween 20, and the filtered extract was diluted with 1% Tween 20 in PBS before passingthrough the IAC to avoid clogging with colloidal particles.
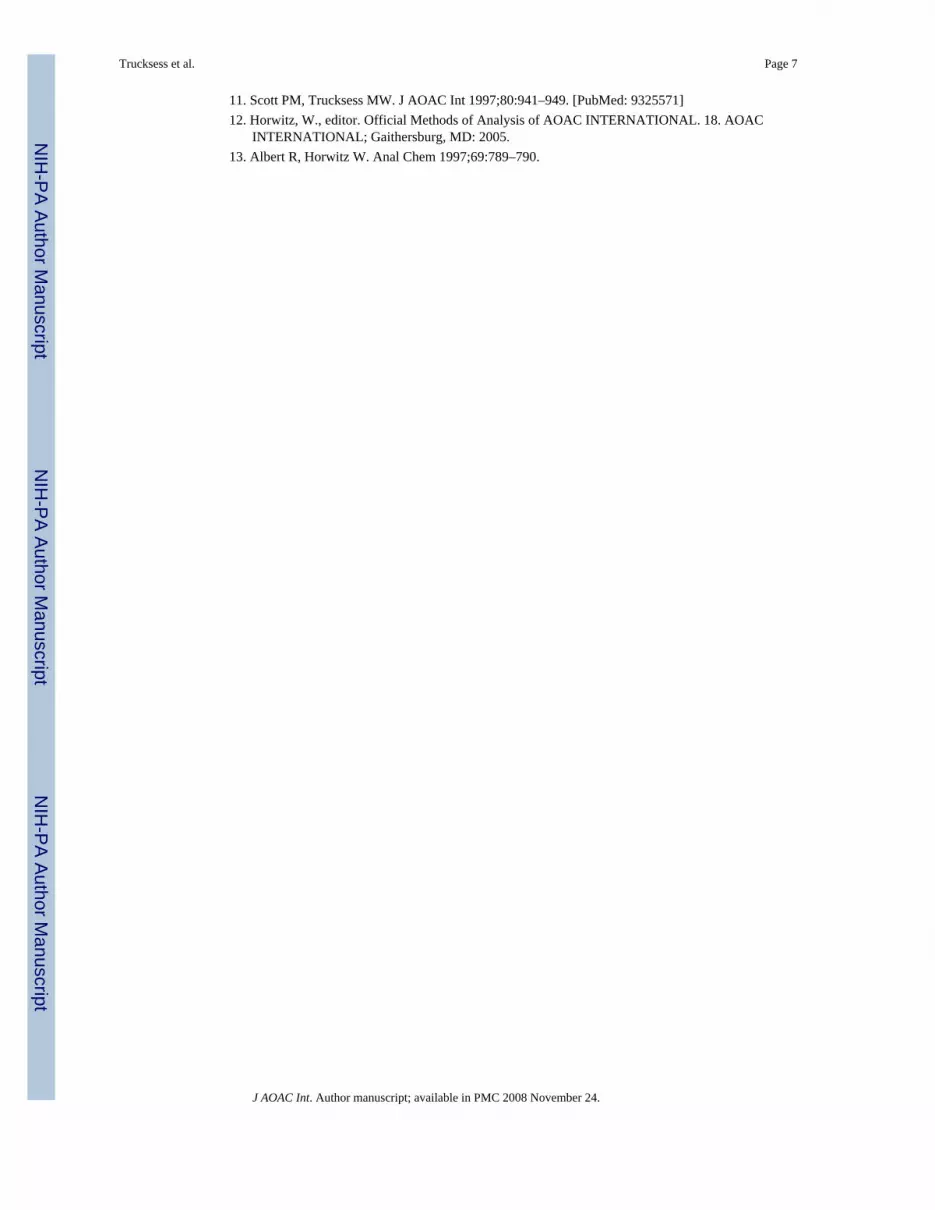
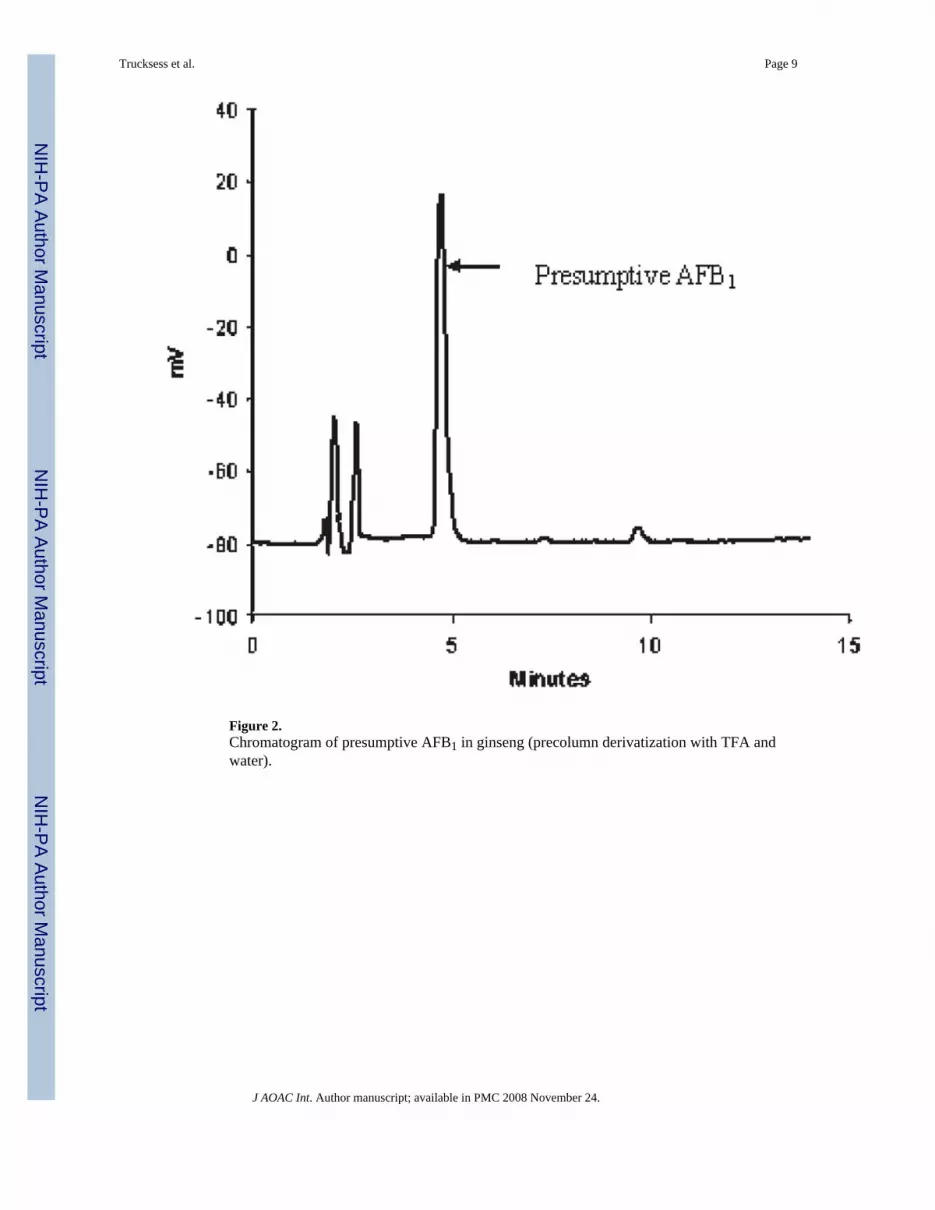
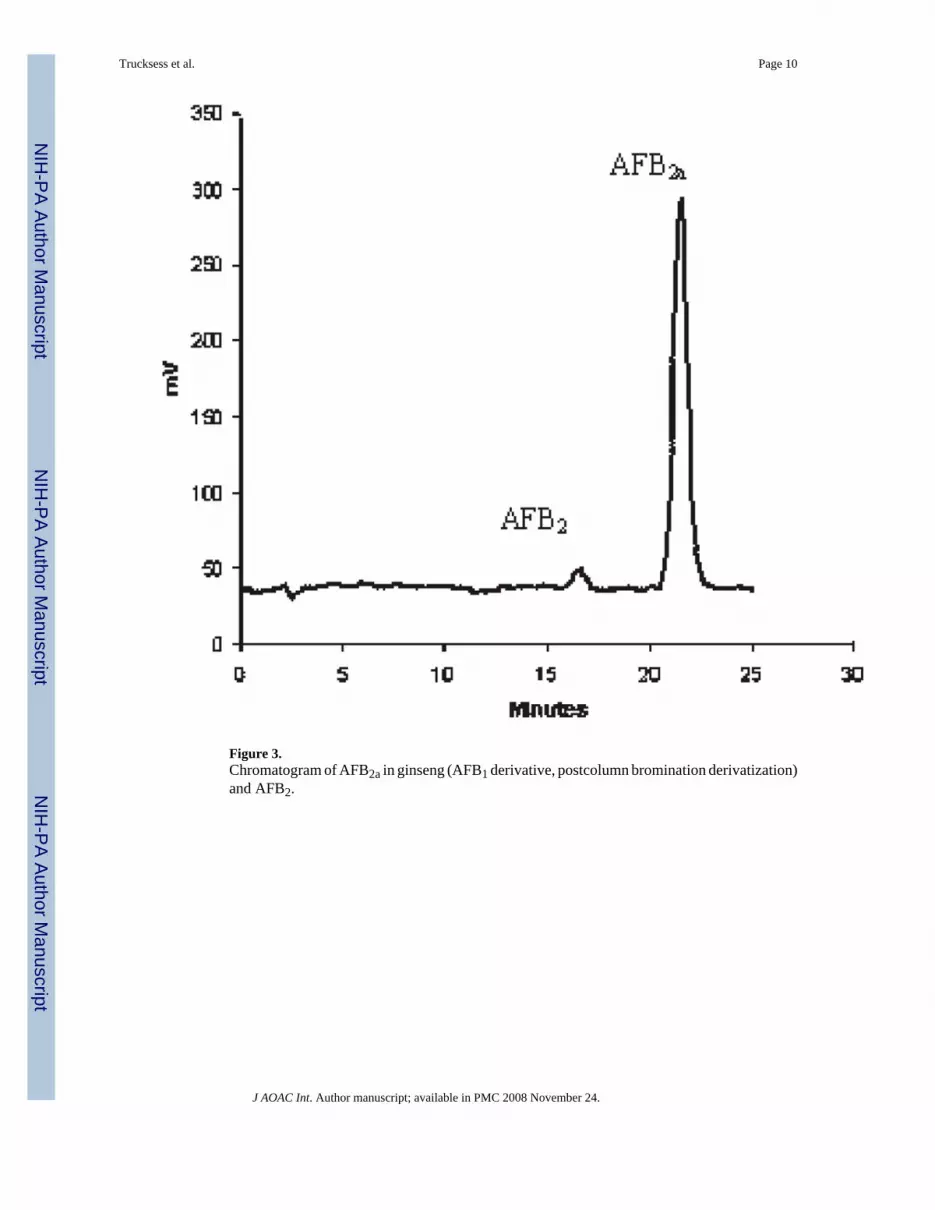
Figure 1 shows liquid chromatograms of aflatoxin standards, and Figures 2 and 3 showchromatograms of naturally aflatoxin-contaminated ginseng extracts obtained by preCD andPCD bromination derivatization quantification. This root was purchased in a commercialmarket and showed mold growth on the surface. It was found to contain AFB1 at 14.8 ng/g andAFB2 at 0.4 ng/g. The disadvantage of using preCD is that it requires extra time for samplepreparation prior to derivatization and for the derivatization. The PCD is free from interferenceand is less time-consuming.
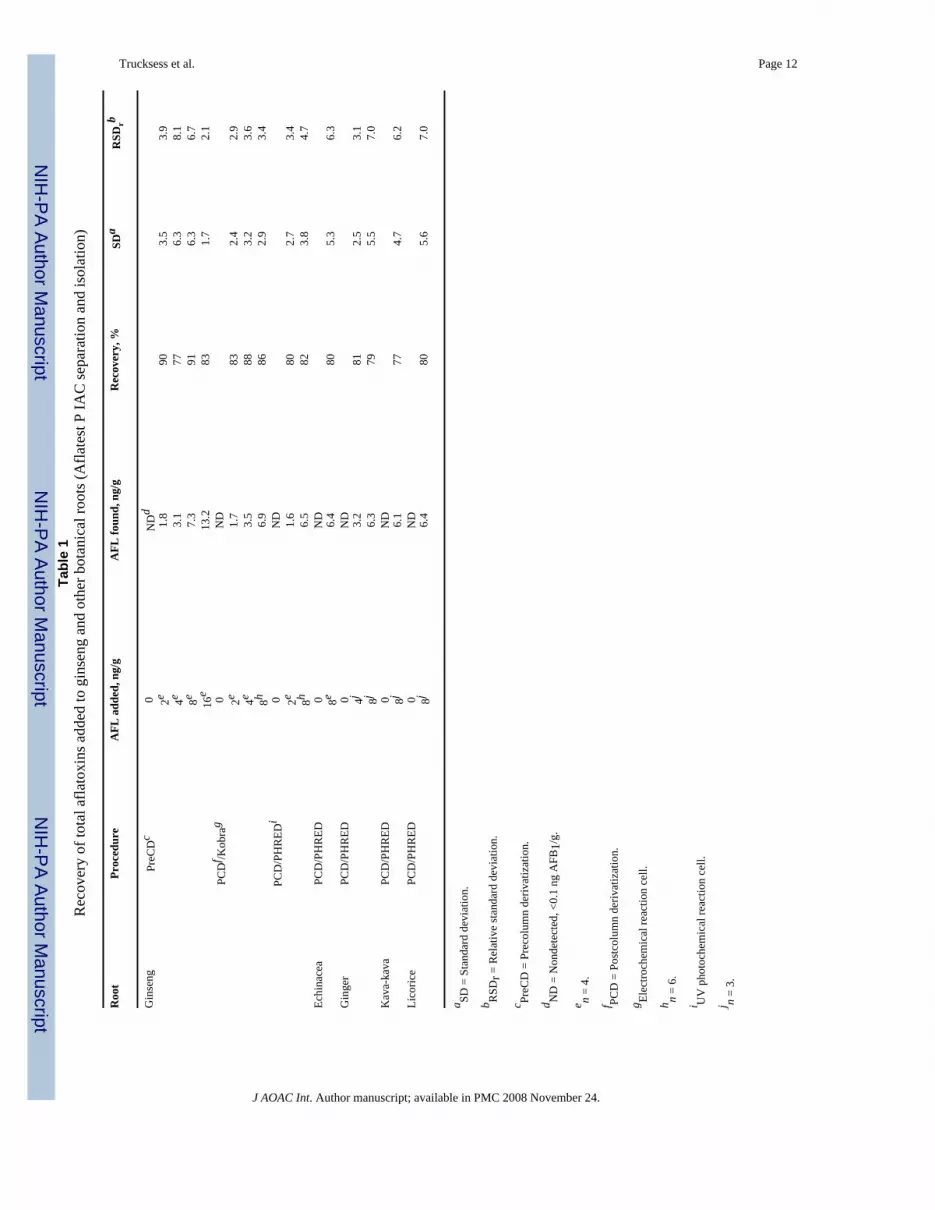
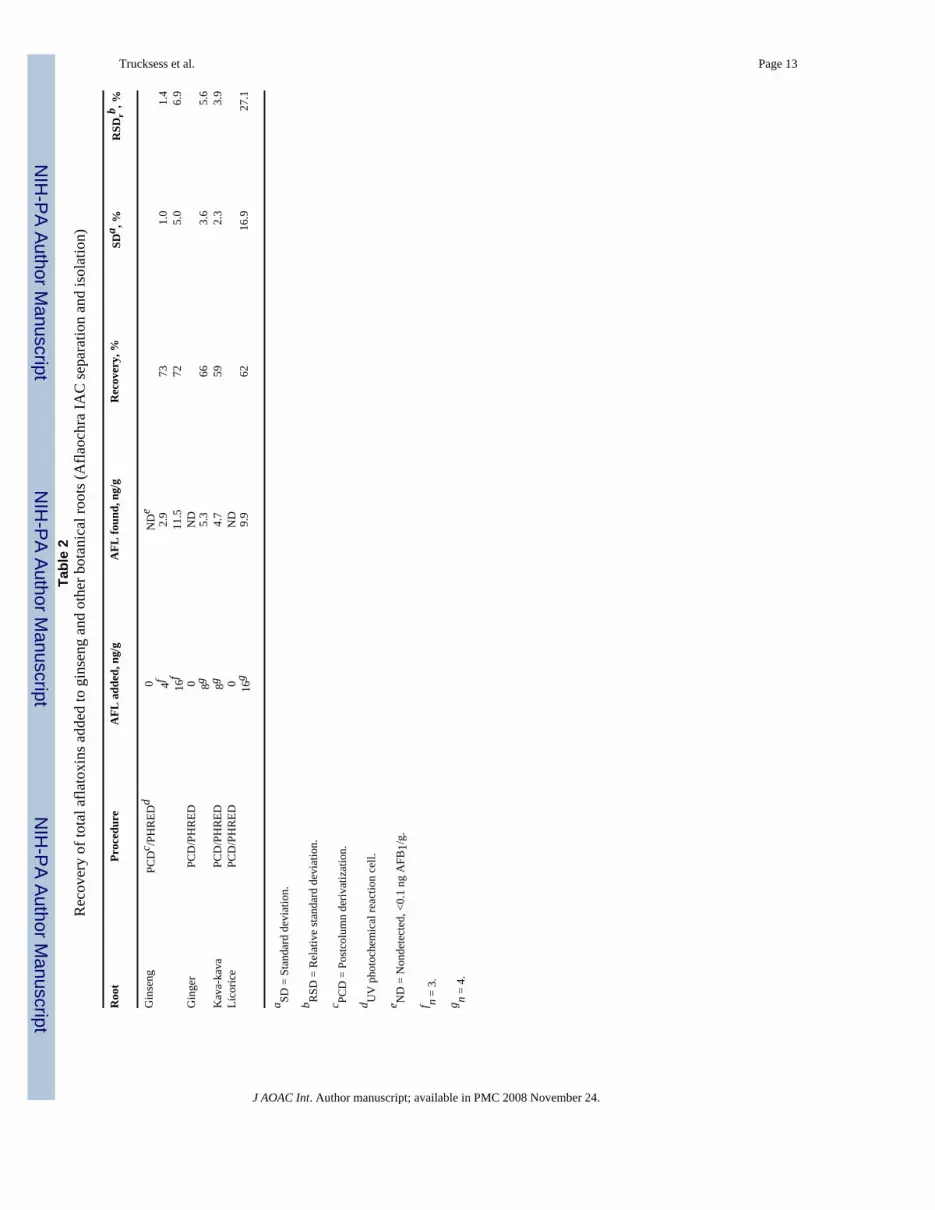
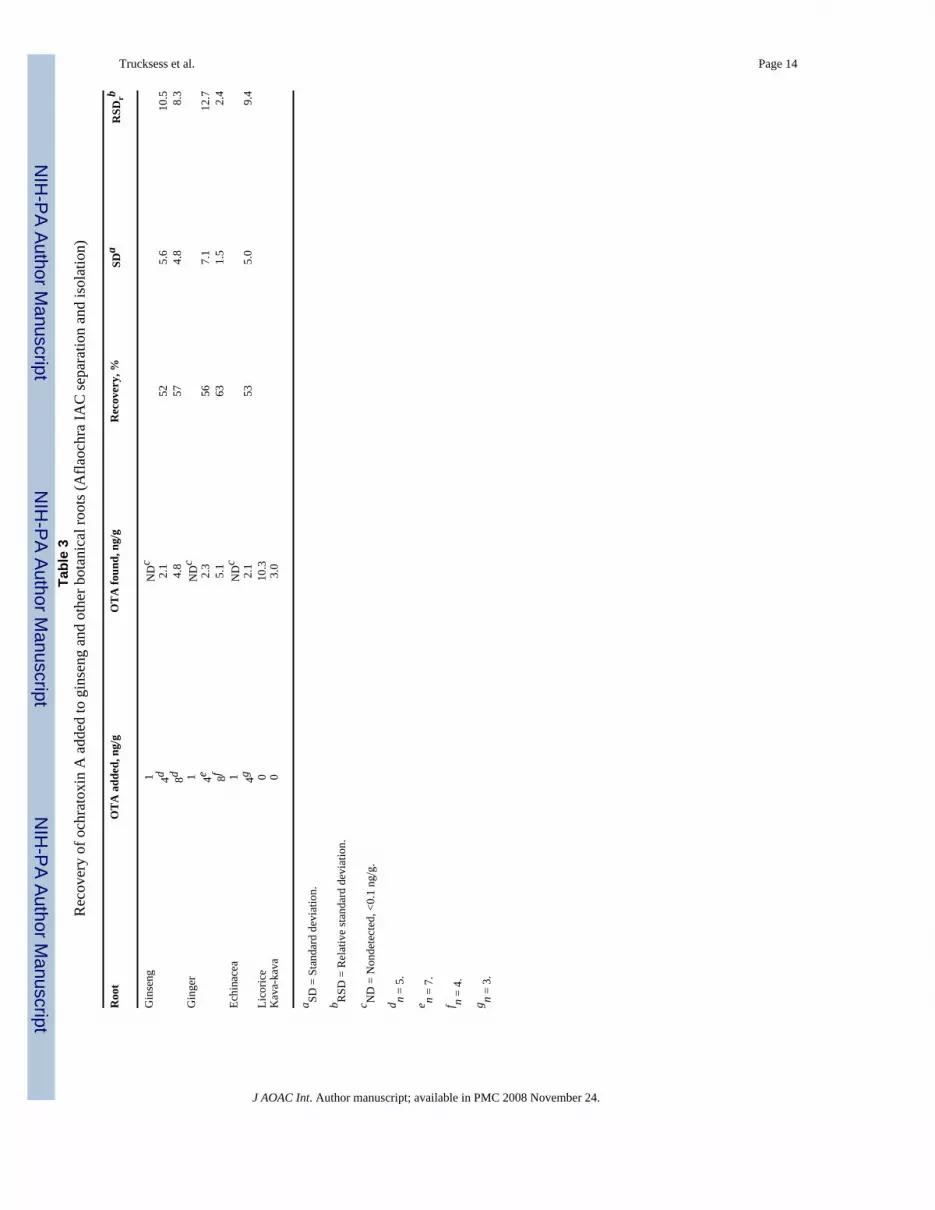
Recoveries of AFL from ginseng using IAC cleanup for AFL at various levels with the 3derivatization techniques are similar for various levels as shown in Table 1. The within-laboratory repeatability relative standard deviation (RSDr) values obtained using preCD areonly slightly higher than those obtained using PCD. The RSDr values of the PCD/Kobra andPCD/PHRED are within the limit of the HorRat (13). Therefore, PCD/PHRED was used forAFL in other botanicals. Recoveries of AFB1, and AFG2, were all above 80%. Recoveries ofAFB2 and AFG2 were about 60–70 and 40–50%, respectively. Tables 2 and 3 give recoveriesof AFL and OTA in ginseng, ginger, and E. purpea using IAC for multitoxins, AFL, and OTA.In general, recoveries for AFL were 60–70% and for OTA were 50–60%.
Licorice roots and kava-kava roots purchased from a botanical supplier were found to containOTA at 3.0 and 10.3 ng/g. Corrected for about 50% recovery (from recovery data of the other
Trucksess et al. Page 5
J AOAC Int. Author manuscript; available in PMC 2008 November 24.
NIH
-PA Author Manuscript
NIH
-PA Author Manuscript
NIH
-PA Author Manuscript
roots), the actual concentrations found were 6 and 20 ng/g, respectively. The identity of OTAin kava-kava was confirmed by LC/MS.
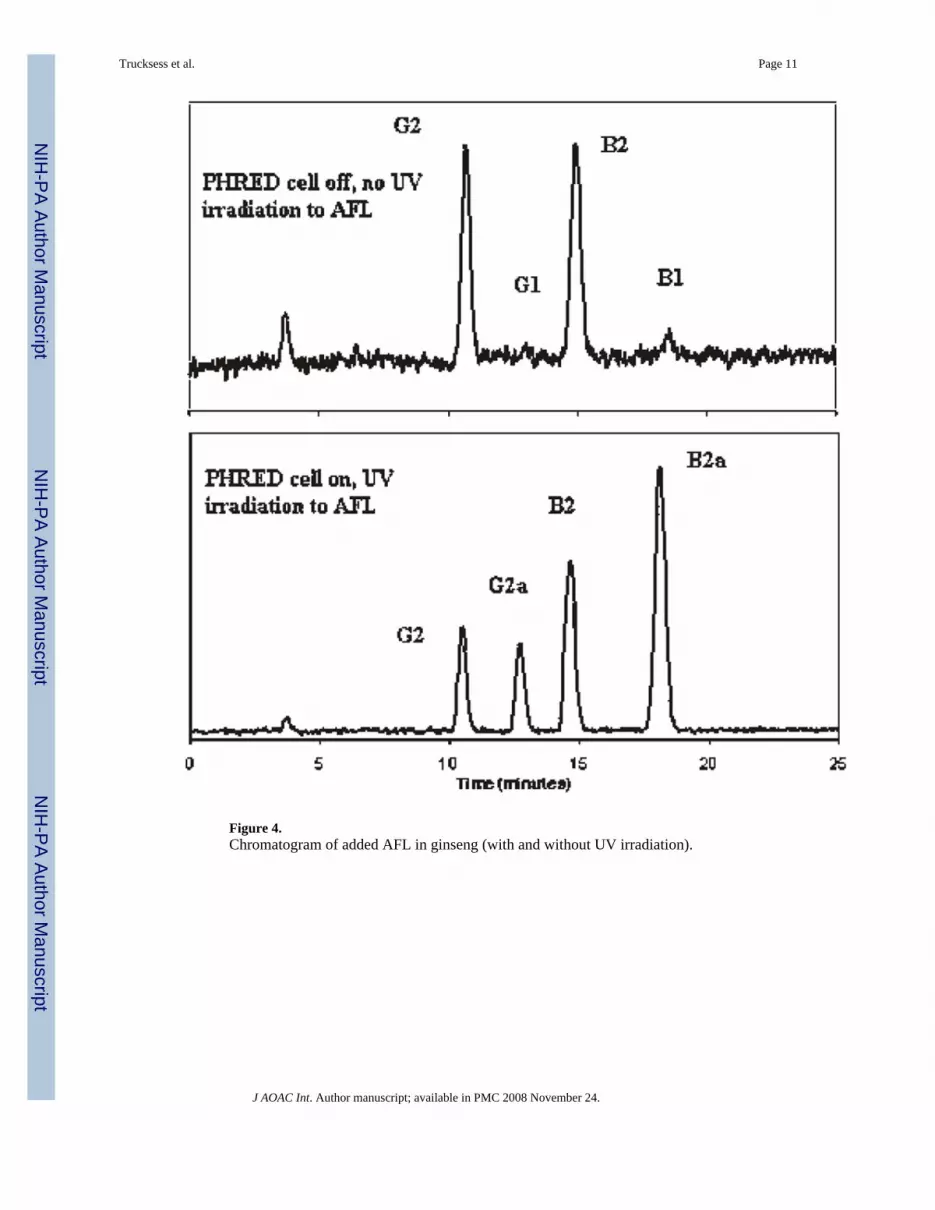
DiscussionPCD can be used as a tool for confirmation of identity if preCD is used for quantification. ThePHRED cell can be turned on for quantification and turned off for confirmation, as shown onFigure 4. When PHRED cell is turned off, no AFB2a and AFG2a are formed from the AFB1and AFG1, respectively, that are present in the test extract. Consequently, the fluorescenceresponses of the 2 compounds are much less or may not be detectable. The Kobra cell can beused for confirmation in a similar way, as shown in Figure 3, but the column eluate would haveto by-pass the cell to avoid derivative formation. It was found that even without applyingcurrent to the Kobra cell for 24 h, derivatives of AFB1 and AFG1 were formed in the columneluate containing AFB1 and AFG1 passed through the Kobra cell. This could be due to the factthat the membrane of the Kobra cell still holds bromine that derivatized AFB1 and AFG1.
The Kobra cell gave slightly higher responses and greater slopes for the calibration curve thandid the PHRED cell using the same calibrators with the same setting for the same fluorescencedetector. The PHRED mobile phase, a mixture of water and organic solvents, affected the LCcolumn less than the Kobra cell mobile phase. The elution time was about 3 min longer for thePHRED cell. The Kobra cell was less convenient to use because it required daily columnflushing with water as recommended by the manufacturer. Both the Kobra cell and PHREDcell gave reproducible results using the same calibrators.
In conclusion, an IAC packed with antiaflatoxin antibodies is suitable for AFL determinationin botanical roots. An IAC packed with antibodies specific for AFL and OTA gave recoveriesof added AFL lower than an IAC for AFL alone. Recoveries of added OTA from the multitoxinscolumn were<60%.
AcknowledgementsThis work was partially supported by the Office of Dietary Supplements, National Institutes of Health, Bethesda, MD.The authors wish to thank Martha Gay, FDA, for performing confirmation of identity for OTA in kava-kava roots.
References1. Miller JD. J Stored Products Res 1995;31:1–6.2. Wilson, DM. Mycotoxins and Food Safety. DeVries, JW.; Trucksess, MW.; Jackson, LS., editors.
Kluwer Academic/Plenum Publishers; New York, NY: 2002. p. 1-17.3. MacDonald S, Castle L. Food Addit Contam 1996;13:121–128. [PubMed: 8647302]4. D’Ovidio KL, Trucksess MW, Weaver C, Horn E, McIntosh M, Bean G. Food Addit Contam
2006;23:174–180. [PubMed: 16449060]5. Pittet, A. Mycotoxins and Phycotoxins in Perspective at the Turn of the Millennium. de Koe, WJ.;
Samson, RA.; van Egmond, HP.; Gilbert, J.; Sabino, M., editors. Ponsen & Looyen; Wageningen, TheNetherlands: 2001. p. 153-172.
6. Patel S, Hazel CM, Winterton AGM, Mortby E. Food Addit Contam 1996;13:833–841. [PubMed:8885323]
7. International Agency for Research on Cancer (IARC). IARC Monographs on the Evaluation ofCarcinogenic Risks to Humans: Heterocyclic Amines and Mycotoxins. 56. IARC; Lyon, France: 1993.
8. Trucksess MW, Stack ME, Nesheim S, Page SW, Albert RH. J Assoc Off Ana Chem 1991;74:81–88.9. Trucksess, MW. Mycotoxins and Phycotoxins in Perspective at the Turn of the Millennium. de Koe,
WJ.; Samson, RA.; van Egmond, HP.; Gilbert, J.; Sabino, M., editors. Ponsen & Looyen, Wageningen;The Netherlands: 2000. p. 29-40.
J AOAC Int. Author manuscript; available in PMC 2008 November 24.
NIH
-PA Author Manuscript
NIH
-PA Author Manuscript
NIH
-PA Author Manuscript
11. Scott PM, Trucksess MW. J AOAC Int 1997;80:941–949. [PubMed: 9325571]12. Horwitz, W., editor. Official Methods of Analysis of AOAC INTERNATIONAL. 18. AOAC
INTERNATIONAL; Gaithersburg, MD: 2005.13. Albert R, Horwitz W. Anal Chem 1997;69:789–790.
Trucksess et al. Page 7
J AOAC Int. Author manuscript; available in PMC 2008 November 24.
NIH
-PA Author Manuscript
NIH
-PA Author Manuscript
NIH
-PA Author Manuscript
Figure 1.Chromatogram of added aflatoxins in ginseng (precolumn derivatization with TFA and water).
Trucksess et al. Page 8
J AOAC Int. Author manuscript; available in PMC 2008 November 24.
NIH
-PA Author Manuscript
NIH
-PA Author Manuscript
NIH
-PA Author Manuscript
Figure 2.Chromatogram of presumptive AFB1 in ginseng (precolumn derivatization with TFA andwater).
Trucksess et al. Page 9
J AOAC Int. Author manuscript; available in PMC 2008 November 24.
NIH
-PA Author Manuscript
NIH
-PA Author Manuscript
NIH
-PA Author Manuscript
Figure 3.Chromatogram of AFB2a in ginseng (AFB1 derivative, postcolumn bromination derivatization)and AFB2.
Trucksess et al. Page 10
J AOAC Int. Author manuscript; available in PMC 2008 November 24.
NIH
-PA Author Manuscript
NIH
-PA Author Manuscript
NIH
-PA Author Manuscript
Figure 4.Chromatogram of added AFL in ginseng (with and without UV irradiation).
Trucksess et al. Page 11
J AOAC Int. Author manuscript; available in PMC 2008 November 24.
NIH
-PA Author Manuscript
NIH
-PA Author Manuscript
NIH
-PA Author Manuscript
NIH
-PA Author Manuscript
NIH
-PA Author Manuscript
NIH
-PA Author Manuscript
Trucksess et al. Page 12Ta
ble
1R
ecov
ery
of to
tal a
flato
xins
add
ed to
gin
seng
and
oth
er b
otan
ical
root
s (A
flate
st P
IAC
sepa
ratio
n an
d is
olat
ion)
Roo
tPr
oced
ure
AFL
add
ed, n
g/g
AFL
foun
d, n
g/g
Rec
over
y, %
SDa
RSD
rb
Gin
seng
PreC
Dc
0N
Dd
2e1.
890
3.5
3.9
4e3.
177
6.3
8.1
8e7.
391
6.3
6.7
16e
13.2
831.
72.
1PC
Df /K
obra
g0
ND
2e1.
783
2.4
2.9
4e3.
588
3.2
3.6
8h6.
986
2.9
3.4
PCD
/PH
RED
i0
ND
2e1.
680
2.7
3.4
8h6.
582
3.8
4.7
Echi
nace
aPC
D/P
HR
ED0
ND
8e6.
480
5.3
6.3
Gin
ger
PCD
/PH
RED
0N
D4j
3.2
812.
53.
18j
6.3
795.
57.
0K
ava-
kava
PCD
/PH
RED
0N
D8j
6.1
774.
76.
2Li
coric
ePC
D/P
HR
ED0
ND
8j6.
480
5.6
7.0
a SD =
Sta
ndar
d de
viat
ion.
b RSD
r = R
elat
ive
stan
dard
dev
iatio
n.
c PreC
D =
Pre
colu
mn
deriv
atiz
atio
n.
d ND
= N
onde
tect
ed, <
0.1
ng A
FB1/
g.
e n =
4.
f PCD
= P
ostc
olum
n de
rivat
izat
ion.
g Elec
troch
emic
al re
actio
n ce
ll.
h n =
6.
i UV
pho
toch
emic
al re
actio
n ce
ll.
j n =
3.
J AOAC Int. Author manuscript; available in PMC 2008 November 24.
NIH
-PA Author Manuscript
NIH
-PA Author Manuscript
NIH
-PA Author Manuscript
Trucksess et al. Page 13Ta
ble
2R
ecov
ery
of to
tal a
flato
xins
add
ed to
gin
seng
and
oth
er b
otan
ical
root
s (A
flaoc
hra
IAC
sepa
ratio
n an
d is
olat
ion)
Roo
tPr
oced
ure
AFL
add
ed, n
g/g
AFL
foun
d, n
g/g
Rec
over
y, %
SDa , %
RSD
rb , %
Gin
seng
PCD
c /PH
RED
d0
ND
e
4f2.
973
1.0
1.4
16f
11.5
725.
06.
9G
inge
rPC
D/P
HR
ED0
ND
8g5.
366
3.6
5.6
Kav
a-ka
vaPC
D/P
HR
ED8g
4.7
592.
33.
9Li
coric
ePC
D/P
HR
ED0
ND
16g
9.9
6216
.927
.1
a SD =
Sta
ndar
d de
viat
ion.
b RSD
= R
elat
ive
stan
dard
dev
iatio
n.
c PCD
= P
ostc
olum
n de
rivat
izat
ion.
d UV
pho
toch
emic
al re
actio
n ce
ll.
e ND
= N
onde
tect
ed, <
0.1
ng A
FB1/
g.
f n =
3.
g n =
4.
J AOAC Int. Author manuscript; available in PMC 2008 November 24.
NIH
-PA Author Manuscript
NIH
-PA Author Manuscript
NIH
-PA Author Manuscript
Trucksess et al. Page 14Ta
ble
3R
ecov
ery
of o
chra
toxi
n A
add
ed to
gin
seng
and
oth
er b
otan
ical
root
s (A
flaoc
hra
IAC
sepa
ratio
n an
d is
olat
ion)
Roo
tO
TA
add
ed, n
g/g
OT
A fo
und,
ng/
gR
ecov
ery,
%SD
aR
SDrb
Gin
seng
1N
Dc
4d2.
152
5.6
10.5
8d4.
857
4.8
8.3
Gin
ger
1N
Dc
4e2.
356
7.1
12.7
8f5.
163
1.5
2.4
Echi
nace
a1
ND
c
4g2.
153
5.0
9.4
Lico
rice
010
.3K
ava-
kava
03.
0
a SD =
Sta
ndar
d de
viat
ion.
b RSD
= R
elat
ive
stan
dard
dev
iatio
n.
c ND
= N
onde
tect
ed, <
0.1
ng/g
.
d n =
5.
e n =
7.
f n =
4.
g n =
3.
J AOAC Int. Author manuscript; available in PMC 2008 November 24.


![Photoautotrophic propagation of Brazilian ginseng [Pfaffia glomerata (Spreng.) Pedersen]](https://static.documents.page/doc/80x56/6346118738eecfb33a06d928/photoautotrophic-propagation-of-brazilian-ginseng-pfaffia-glomerata-spreng-pedersen.jpg)


![[Aflatoxins: Biological effects and mechanisms of influence on organism of animals and humans]](https://static.documents.page/doc/80x56/6355bbae328574b6730c1573/aflatoxins-biological-effects-and-mechanisms-of-influence-on-organism-of-animals.jpg)


