European Journal of Political Research 15: 167-184 (1987) 0 Martinus Nijhoff Publishers, Dordrecht - Printed in the Netherlands Cycles of Political Control: the case of the Canton of Zurich, 1880-1983 Manuel EISNER Univer.riiv of Zurich, Switzerland Abstract. On the basis of data from the Canton of Zurich for the period from 1880 to 1983 this paper tests three models of political control: the ’crime control’. ‘conflict’. and ‘economic crises’ models. It is suggested that each of the models might be valid for a particular sub-period. The identification of sub-periods is based on the idea of Kondratiev cycles. For each sub-period the effects of crime rates, the frequency of strikes and of bankruptcies on the number of police personnel and the severity of convictions are estimated by means of ARIMA modeling. The results show different patterns for each sub-period. For the period from 1880 to 1933growth rates of the indicators of political control are best explained by the frequency of strikes. For the second period there is a strong direct effect of economic crises on the extent of political control. This paper is mainly concerned with an examination of cyclical changes in the extent of political control during the past 100 years in the canton of Zurich. The concept of political control embraces all political means and institutions which have the potential to control public order by means of force. This especially includes the police and judicial systems. The term is clearly distinguished from the more general concept of social control which may be understood as any attempt by individuals to manipulate the behaviour of other individuals through varying means (Gibbs 1981). Political control, in contrast, is tied to specialized state organisations as actors, and is enacted through formalized proceedings and a limited set of sanctions. The theoretical approach in this paper consists in a linking of two dimen- sions of theoretical thinking. On the one hand three simple models - ‘crime control’, ‘conflict’ and ‘economic cycles’ - of the determinants of political control are distinguished. Although we abstract in these models from formula- tions found in the literature, it is hoped that they reflect three basic orienta- tions in research on political and crime control. The other dimension refers to the concept of Kondratiev Cycles with a length of 40-60 years. The assumption is tested that different models for change in the extent of political control might be valid for each of the two sub-periods - 1880 to 1933 and 1934 to 1983 - distinguished in this paper. In connection with the rise of the ‘labelling perspective’ in the study of deviant behaviour since the 1960s, a growing body of literature has investig- ated the determinants of various dimensions of political control. Most of these
Transcript
European Journal of Political Research 15: 167-184 (1987) 0 Martinus Nijhoff Publishers, Dordrecht - Printed in the Netherlands
Cycles of Political Control: the case of the Canton of Zurich, 1880-1983
Manuel EISNER Univer.riiv of Zurich, Switzerland
Abstract. On the basis of data from the Canton of Zurich for the period from 1880 to 1983 this paper tests three models of political control: the ’crime control’. ‘conflict’. and ‘economic crises’ models. It is suggested that each of the models might be valid for a particular sub-period. The identification of sub-periods is based on the idea of Kondratiev cycles. For each sub-period the effects of crime rates, the frequency of strikes and of bankruptcies on the number of police personnel and the severity of convictions are estimated by means of ARIMA modeling. The results show different patterns for each sub-period. For the period from 1880 to 1933 growth rates of the indicators of political control are best explained by the frequency of strikes. For the second period there is a strong direct effect of economic crises on the extent of political control.
This paper is mainly concerned with an examination of cyclical changes in the extent of political control during the past 100 years in the canton of Zurich. The concept of political control embraces all political means and institutions which have the potential to control public order by means of force. This especially includes the police and judicial systems. The term is clearly distinguished from the more general concept of social control which may be understood as any attempt by individuals to manipulate the behaviour of other individuals through varying means (Gibbs 1981). Political control, in contrast, is tied to specialized state organisations as actors, and is enacted through formalized proceedings and a limited set of sanctions.
The theoretical approach in this paper consists in a linking of two dimen- sions of theoretical thinking. On the one hand three simple models - ‘crime control’, ‘conflict’ and ‘economic cycles’ - of the determinants of political control are distinguished. Although we abstract in these models from formula- tions found in the literature, it is hoped that they reflect three basic orienta- tions in research on political and crime control. The other dimension refers to the concept of Kondratiev Cycles with a length of 40-60 years. The assumption is tested that different models for change in the extent of political control might be valid for each of the two sub-periods - 1880 to 1933 and 1934 to 1983 - distinguished in this paper.
In connection with the rise of the ‘labelling perspective’ in the study of deviant behaviour since the 1960s, a growing body of literature has investig- ated the determinants of various dimensions of political control. Most of these
168
studies have concentrated either on the size and organization of the police force, or on the functioning of and change in the judicial system.’ As far as the broader theoretical orientation of the authors is concerned, a distinction can be observed between the functionalist view, which stresses the interrelation between crime and crime control, and the conflict view, which places political control rather in the context of social inequality and political tensions.
The ‘Crime Control’ Model
The crime control model assumes that police and justice systems are organis- ations with narrowly defined functions. The most important of these are thought to be the enforcement of law and the control of criminality. Phases of rising and declining frequencies of crime are expected to be mainly dependent on the extent of different measures of crime control. Once a rising tendency of criminality becomes known to the political actors, measures are taken to resume control. Thus police personnel will be expanded to allow for better conviction rates; for example, the severity of punishment may be raised in order to improve the deterrent effect of the judicial system. Such measures, taken together, will eventually increase the relative costs of criminal actions for the actors concerned. As a consequence, after a certain time lag crime rates will begin to decrease, which allows for a reduction in the extent of crime control. Various forms of this argument may be found in Becker (1968), Blumstein (1978) and Loftin and McDowall (1982).
It may be mentioned that quite the opposite relationship is postulated by the Labeling Theory, even if this theoretical approach is not further considered in what follows. In the radical version, Labeling Theory denies the existence of ‘crime’ as an objectively existing fact (see Becker 1963, Sack and Luderssen 1975/76). Rather, ‘crime’ is thought to be a product of labeling activity of police and justice systems: for some reasons - which are not clearly specified - there are cycles of rising and declining concern about crime control that produce changes in the officially recorded crime rate. Accordingly, officially recorded crime rates should be a lagged function of changes in the number of police and the activity of the judicial system.
The ‘Conflict’ Model
Under this heading may be summarised theories which place the historical development and the functioning of the police and justice system in the context of economic inequality and the maintenance of differential power (Gurr 1977, Jacobs 1979, Haferkamp 1980, Zwicky 1982, 1984). Thus, for American
169
SMSAs, Jacobs (1978, 1979, Jacobs and Britt 1979) found a positive relation- ship between income inequality on the one hand and the number of police, police use of deadly force and severity of punishment on the other. In Switzer- land, too, levels of public expenditures for control could be shown to be positively related to measures of inequality (Zwicky 1984). In a historical analysis of four cities since the end of the 18th century, Gurr et al. (1977) reported a strong tendency of police personnel to increase during periods of civil strive.*
One important manifestation of conflict about the unequal distribution of highly valued goods is the incidence of labour conflicts. Periods of intensified political conflict between the working class and the ruling class may be perceived by the powerful as a potential threat to the social and political order. This threat will be counteracted by an extension of the coercive potential. Thus, according to this perspective, a phase of rising frequency of strikes and other forms of political conflict is followed by an expansion of police personnel and the repressiveness of the judicial system.
The ‘Economic Cycles’ Model
This model should be regarded as a special case of the conflict model discussed above. But rather than linking political conflict to differential power and inequalities in income, here the effects of economic upswings and crises on the legitimacy of the society and the stability of the political system are empha- sized. The basic argument in this model is that economic growth is a source of legitimacy for the social order; growing incomes serve to satisfy rising expec- tations, marginalised groups may become integrated because of good oppor- tunities for work, and the state is likely to appease social problems through welfare politics (Davies 1962, Henry and Short 1964, Olson 1971, Siegenthaler 1981). In such circumstances there is little need for high levels of repression. It is only at the end of longer periods of growth that tendencies towards rising tensions in the social structure are to be expected (Johnson 1968, Siegenthaler 1978). There will be growing discrepancies between those who win and those who lose during the upswing, and between declining growth rates and continu- ously rising expectations. The beginning of the recession then triggers a potentially revolutionary situation, which is known in the literature as the J-Curve Phenomenon (Davies 1962). During the depression a large number of unemployed and - especially during the 19th century - a high level of depriva- tion amongst the lower classes pose a continuous threat to the powerful. This argument would lead us to expect a low level of political control during the economic upswing, and rising tendencies of control from the beginning of stagnation until the end of the depression phase.
Some Hypotheses
The three models discussed above relate cycles of repression and political control to economic cycles, crime waves and cyclical changes in political conflict respectively. Although there are some relationships between eco- nomic cycles, crime and political conflict, they are far from being completely interdependent. This prevents us from building a global model which could integrate the discussed perspectives. We therefore formulate some weak hypotheses concerning the explicative power of the models concerned. They mainly refer to the change in the determinants of political control across the two sub-periods distinguished.
The whole period 1880-1983 was divided into two sub-periods, the first covering the years 1880-1933, the second stretching from 1934 to 1983, thus coinciding roughly with the usual dating of the Kondratiev-Cycles (for a survey over the different periodizations see van Duijn (1983)). Within the theoretical approaches to Kondratiev-Cycles, several authors suggest that K-Cycles might reflect phases of different legitimatory foundations of society, of changing lines of conflict and distinct periods of political structures (Gordon 1980, Weber 1981, Lipiez 1985). Bornschier proposes to subsume these different aspects under the concept of ‘socio-political regimes’ (Bornschier 1985,1986). The idea is that the basic parameters of a socio-political regime remain stable during a K-Cycle, whereas at the end of a cycle a discontinuous change with the establishment of a new socio-political regime can be observed. The main manifest conflict line of the bourgeois K-Cycle (e.g. from around 1880 to about 1935) is described in these approaches as large scale class conflict between workers and the ruling class (Gordon 1980). It starts with the rise of labour unions and socialist parties in many countries of the World-System-core during the 1880s and 1890s. It is dominated by high levels of class conflict, and specifically strikes, throughout the period and it ends with the integration of the working class before and during World War 11.
In Switzerland this integration took the form of the so-called ‘peace treaties’ between labour unions and employers organizations. In these treaties the workers basically renounced the right to strike over wages, and received in return the establishment of compulsory arbitration between workers and employers (Handbuch der Schweizer Geschichte, Vol. 2, 1980).3 For this K-Cycle, we therefore expect a close link between strike waves and cycles of political control.
In contrast, for the last K-Cycle we expect only a weak relationship between strikes and political control. Other conflict lines have become more important since World-War I1 (e.g. minority problems, generation conflicts, environ- ment problems) and other forms of political activity - such as demonstrations and grassroot movements - have become more important. Their impact on
171
changes in the extent of political control could not be assessed in this study. Still, taking new forms of political conflict also into account, it seems
plausible to assume a lower level of conflict than in the previous period. In terms of the concept of functional substitution, structural tensions might therefore rather be expected to manifest themselves in individualized deviant behaviour, such as suicide, crime, forms of psychic illness, or drug dependency (Zwicky 1982). Although these forms of behaviour are not directly political, they might well be perceived by political actors as indicators of illegitimacy and therefore contribute to changes in the extent of control. Earlier research for the Canton of Zurich found that indicators of economic crises in particular had a strong positive correlation with indicators of individualized anomie (Eisner 1983) .4 Although our argument is burdened with more insecurities for this period, we expect some predictive power of the ‘economic’ and the ‘crime control’ models.
Method
Interrelations between variables were tested with two complementary meth- ods. The first method consisted of a visual inspection of the overlaid graphs for the relevant variables. Rather than yielding exact information about causal relationships, these graphs show the overall pattern in the most direct way and suggest possible models for statistical testing. The second approach makes use of the general class of ARIMA-models in order to compute multiple regres- sions. Without going into statistical details the main argument for the use of ARIMA-models should be briefly summarised (for an introduction see Chat- field 1975). The approach starts with the assumption that causal relationships in a dynamic system can only be assessed if the input in the system is randomly distributed over time. In experimental situations the input can be directly controlled in order to be at random, but historical time series usually contain a strong structured element which makes the testing of causal relationships without prior transformations impossible. In order to deal with this problem, Box and Jenkins (1976) designed a class of filters which transform stochastic time-series into white noise. Three groups of filters have been p r o p o ~ e d : ~ 1) Differencing, which takes account of the fact that sums of random shocks can show a ‘drift’ over time which may look very much like a trend; 2) Autoregres- sive filters which are based on the assumption that present values of a time- series are systematically related to a number of past observations of the same time-series; and 3) Moving-average filters which model a present value as a sum of a number of random shocks. The choice of an appropriate combination of filters to describe a time-series is based on the interpretation of the autocor- relation-function (ACF) and the partial autocorrelation-function (PACF)
172
which are not described here (see BodJenkins 1976). Generally, correlations between ‘prewhitened’ time-series tend to be much lower than correlations between original series. However, they allow a much more rigorous test of causal models.
In our case the variables were fitted with different models for each sub- period. As a first step the original data were log-differenced in order to obtain yearly growth rates. In six cases this was sufficient to transform the series into white noise. In two cases, however, the ACFs and PACF’s still showed some structure which suggested either an additional AR (1) or an AR (2) model. In both cases the AR (1) model proved sufficient to transform the differenced series into white noise.
The Data Set6
a) The dependent variables
Two different measures for political control were included in the data set. They were assumed to represent different aspects of the phenomenon to be measured. Police per 100,000: The data include the numbers of the ‘Kantonspolizei’ and the ‘Stadtpolizei Zurich’. They exclude administrative personnel and local police in the communities. The time series of the ‘Stadtpolizei’ had to be corrected twice (1891/92 and 1896/97) for expansions of the political borders of Zurich city. The long-term rise since the 1930s must be attributed to the increase of traffic; the sources do not allow for a distinction between traffic police and criminal police. In spite of this limitation, the number of police is probably the most direct expression of the repressive potential and the power monopoly of the state. Average nominal length of sentence: From 1876 to 1941 the highest judicial authority of the Canton of Zurich (the ‘Obergericht’) reported annual data on the exact amount of punishments pronounced in penal matters. The variable used in this data set excludes fines, and original values were divided through the number of persons convicted. From 1942 onwards, the sources only report intervals for the length of confinement, therefore arithmetic means of each interval were taken as approximate average length of the sentences passed. A discontinuity from 1941 to 1942 suggested that this approximation over-esti- mates real data. For all computations, therefore, the values of the post-1941 period were converted on the basis of 1942 having the same value as 1941.
Within the framework of the analysis of political control, this variable has two meanings: first, the severity of punishment directly informs possible offenders about the costs of a criminal act, given the chance that they might get
173
caught. Second, criminal courts’ decisions become known to a wide public through the mass media. As a system of symbols, they confer to the larger society information about repressive vs. liberal phases in government.
b ) The independent variables
In order to test the three models of political control three explanatory varia- bles were entered into the data set: one each for the ‘crime control’, the ‘conflict’ and the ‘economic cycles’ models.’
I. Penal law convictions per100,OOO: This variable is used as a gross estima- tion of changes in real crime rates. Several authors (see Sack and Liiderssen 1975, Monkkonen 1981) have questioned the use of conviction rates for this purpose, but better data, such as reported crime rates or arrest rates, were not available. The use of this variable is at least partly legitimized by the fact that other indicators of anomic tensions, such as suicides, covary strongly with the fluctuations in conviction rates (Eisner 1983). For lack of better data we therefore use this variable to test the crime control model.
2. Strikes: The time series consists of two parts: from 1880 to 1914 the data refer to the Canton of Zurich; from 1915 onwards reliable data were only available for the whole of Switzerland. There is strong evidence, though, that strike frequencies in Switzerland and the Canton of Zurich moved largely parallel to each other. The fit 1914/15 was made on the basis of data about the strike level in Switzerland from 1910 to 1914. We used this variable to test the ‘conflict’ model. Two shortcomings of this variable must, however, be men- tioned. First, it was not possible to measure conflict on a more structural level, for example with fluctuations in income inequalities.s Second, for our second sub-period (1936-1983), it would have been desirable to use other indicators of political conflict, but again we have to wait for better data covering this period.
3. Bankruptcies: In addition to being a good indicator of economic crises and structural change in the economy, earlier research has shown this variable to be a good predictor of fluctuations in the frequency of deviant behaviour (Eisner 1983). The original data for the period 188G1891 had to be rescaled because before 1892 the statistics were based on a wider definition of bank- ruptcy.
Results
As a preliminary step the interrelation between the two dependent variables was assessed, and gross overall effects of the independent variables were estimated on the basis of a visual inspection of the overlaid graphs (see Figure
174
1). As a second step, regression coefficients were computed for each sub- period on the basis of the prewhitened time series, with the independent variables entered at appropriate lags.
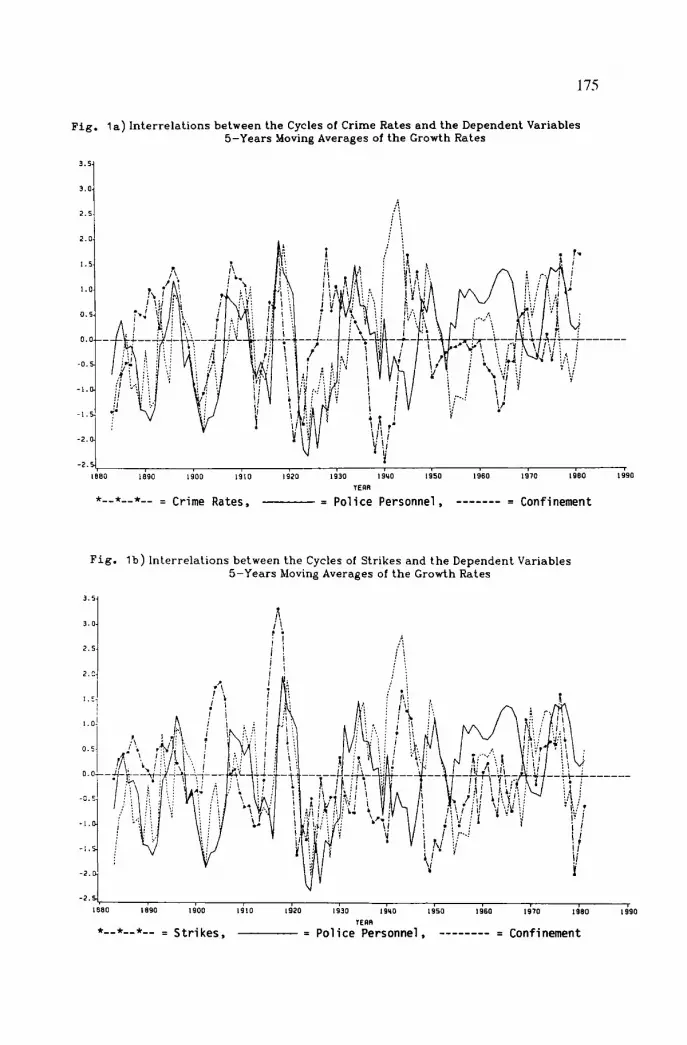
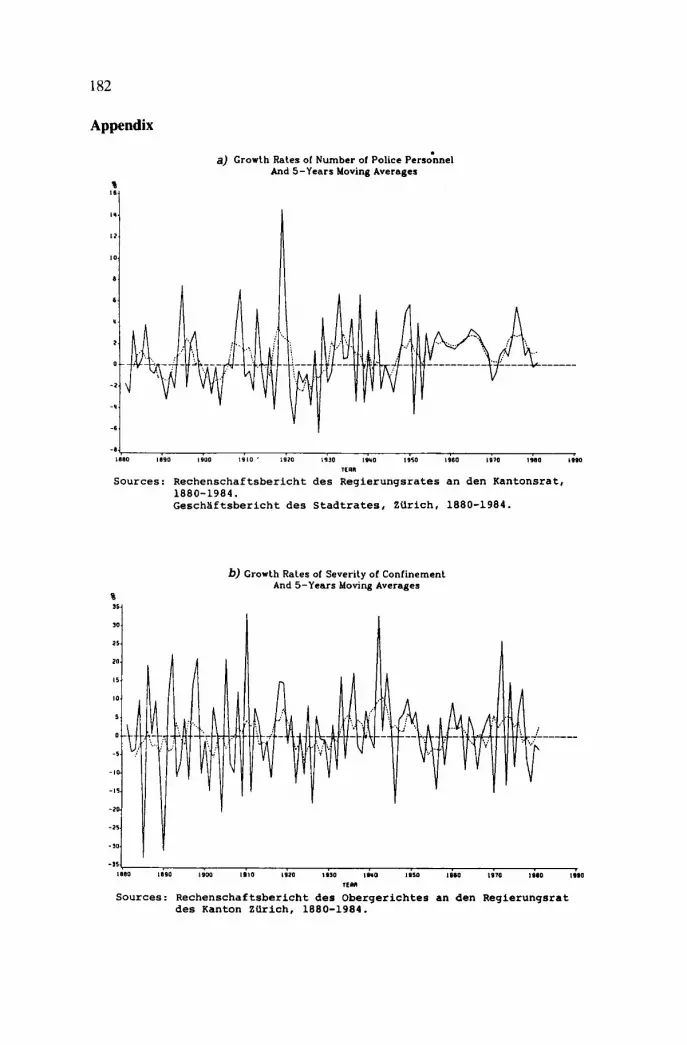
Let us first consider the interrelation between the two independent varia- bles (see Appendix 1, a) and b)). As was to be expected from their ACFs’, the yearly growth rates of both police personnel and the severity of confinement show very little regular pattern. Looking at the 5-year moving averages, however, we can clearly see a cyclical pattern of rising and declining tenden- cies over several years. Peaks of average growth rates for the number of police personnel are around 1883,1896.1907,1918,1933,1950,1965 and 1975. At least until World War I1 the periodicity of these cycles corresponds roughly to the dating of Kuznets-cycles (see Siegenthaler 1978. Beck 1983). Some of the cycles can also be observed for the severity-of-confinement variable (1896. 1918, 1934, 1950 and 1975) whereas for some phases there is no parallel movement. This impression is supported by a cross-correlation of + .24 of the prewhitened variables over the whole period. This suggests that there is some tendency of political actors to use both means of control at the same time as a response to perceived threats. What possible causes for these cycles are suggested if we overlay the five-year moving averages of the explanatory variables on the dependent variables?
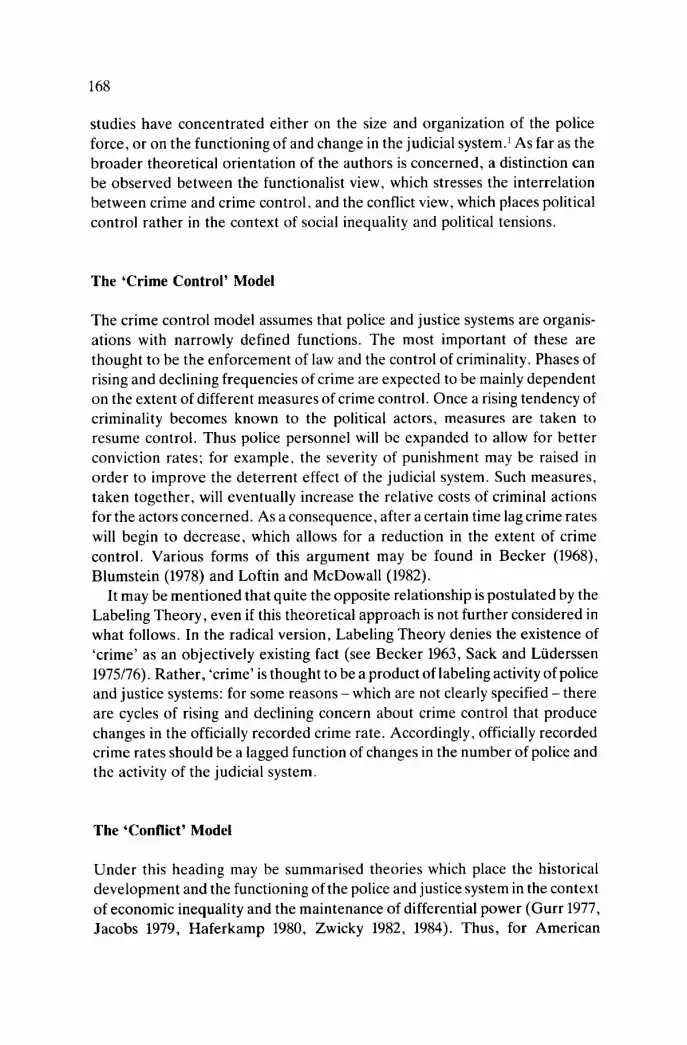
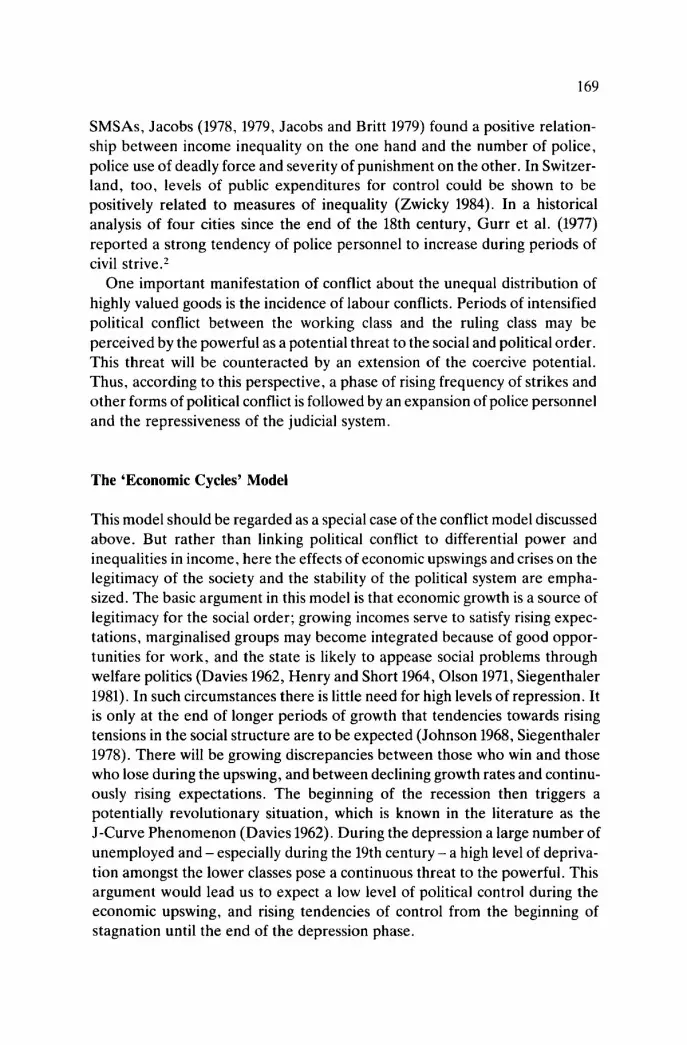
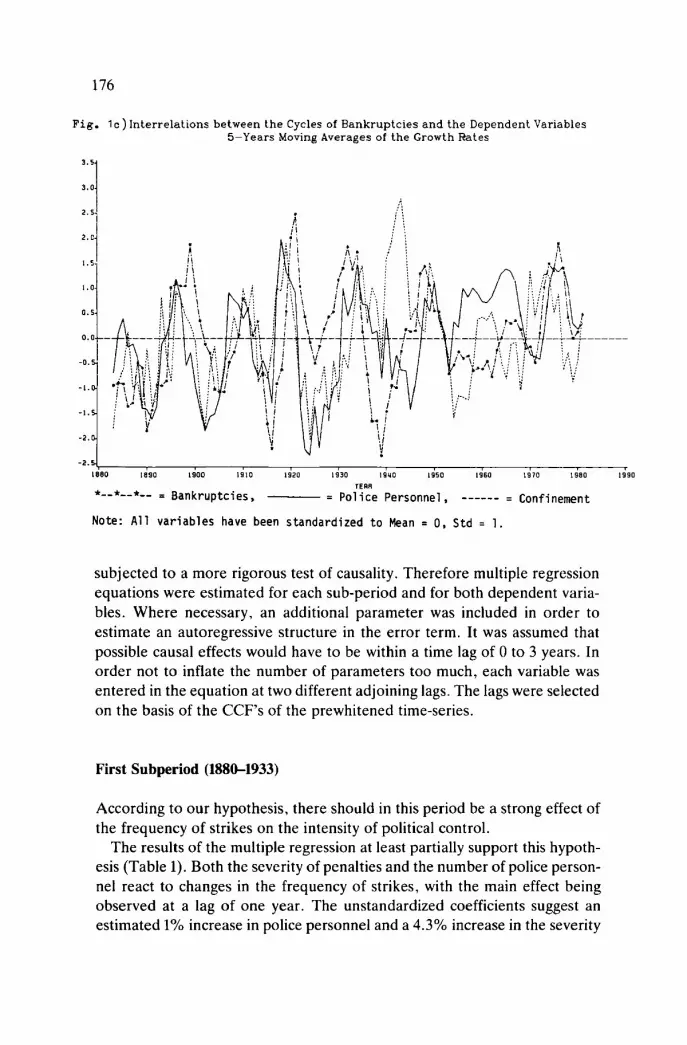
Until the end of World War I the number of persons convicted clearly precedes both fluctuations of police personnel and severity of confinement with a lead of of one to two years (see Figure la)). From 1920 until about 1950 only an effect on the police personnel seems to persist, even if the time lag has grown to about 3 years. After 1950 the graph suggests no interaction between the variables. Fluctuations in the frequency of strikes also seem to predict well both indicators of political control in the first sub-period- from 1880 to 1933 -if we except for the peak around 1904 in the growth of strike frequencies (see Figure lb)). In the second period the long-term tendencies of the strike variable apparently predict to some degree the long-term course of the severity of confinement variable although no match in the yearly fluctuations can be observed. Again, the course of the smoothed growth rates of police personnel seems to be unrelated to the proposed explanatory variable in the second period. The third time-series considered are growth rates of bankruptcies (see Figure lc)). The visual interpretation of the overlaid graph suggests three different periods. Until about 1920 the cycles of the indicator of economic crisis rather lag behind the variables of political control. From 1920 until about 1950 bankruptcies might have had some causal effects on the number of police personnel. After 1950 a weak tendency of the number of police personnel and the frequency of bankruptcies to fluctuate parallel to each other can be observed.
As a second step the results of the visual inspection of the graphs were
175
3.5.
3.0.
F i g . la ) Interrelations between the Cycles of Crime Rates and the Dependent Variables 5-Years Moving Averages of the Growth Rates
F i g . lb) Interrelations between the Cycles of Strikes and the Dependent Variables 5-Years Moving Averages of the Growth Rates
3 .5 i
- 2 .
1880 1890 1900 1910 1920 1930 19YO 1950 1960 1970 Id80 Is's0 TERR *--*--*-- = S tri kes , = Police Personnel, -------- = Confinement
176
Fig. l c ) Interrelations between the Cycles of Bankruptcies and the Dependent Variables 5-Years Moving Averages of the Growth Rates
Note: A l l var iables have been standardized t o Mean = 0. Std = 1.
subjected to a more rigorous test of causality. Therefore multiple regression equations were estimated for each sub-period and for both dependent varia- bles. Where necessary, an additional parameter was included in order to estimate an autoregressive structure in the error term. It was assumed that possible causal effects would have to be within a time lag of 0 to 3 years. In order not to inflate the number of parameters too much, each variable was entered in the equation at two different adjoining lags. The lags were selected on the basis of the CCF’s of the prewhitened time-series.
First Subperiod (188&1933)
According to our hypothesis, there should in this period be a strong effect of the frequency of strikes on the intensity of political control.
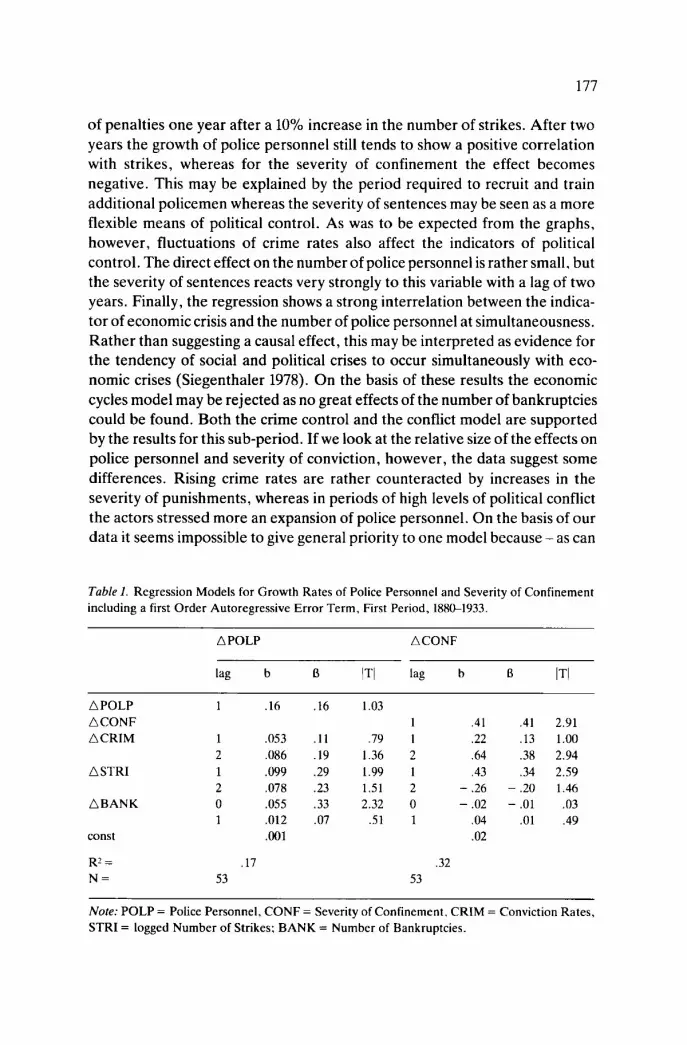
The results of the multiple regression at least partially support this hypoth- esis (Table 1). Both the severity of penalties and the number of police person- nel react to changes in the frequency of strikes, with the main effect being observed at a lag of one year. The unstandardized coefficients suggest an estimated 1% increase in police personnel and a 4.3% increase in the severity
177
of penalties one year after a 10% increase in the number of strikes. After two years the growth of police personnel still tends to show a positive correlation with strikes, whereas for the severity of confinement the effect becomes negative. This may be explained by the period required to recruit and train additional policemen whereas the severity of sentences may be seen as a more flexible means of political control. As was to be expected from the graphs, however, fluctuations of crime rates also affect the indicators of political control. The direct effect on the number of police personnel is rather small, but the severity of sentences reacts very strongly to this variable with a lag of two years. Finally, the regression shows a strong interrelation between the indica- tor of economic crisis and the number of police personnel at simultaneousness. Rather than suggesting a causal effect, this may be interpreted as evidence for the tendency of social and political crises to occur simultaneously with eco- nomic crises (Siegenthaler 1978). On the basis of these results the economic cycles model may be rejected as no great effects of the number of bankruptcies could be found. Both the crime control and the conflict model are supported by the results for this sub-period. If we look at the relative size of the effects on police personnel and severity of conviction, however, the data suggest some differences. Rising crime rates are rather counteracted by increases in the severity of punishments, whereas in periods of high levels of political conflict the actors stressed more an expansion of police personnel. On the basis of our data it seems impossible to give general priority to one model because - as can
Table I. Regression Models for Growth Rates of Police Personnel and Severity of Confinement including a first Order Autoregressive Error Term, First Period, 188C-1933.
A POLP ACONF
lag b a IT1 1% b a IT1
APOLP ACONF ACRIM
A STRI
ABANK
1 .16
1 ,053 2 ,086 1 ,099 2 ,078 0 ,055 1 ,012
,001
.I7 53
.16 1.03 1
. l l .79 1
.19 1.36 2
.29 1.99 1
.23 1.51 2
.33 2.32 0
.07 .51 1
.32 53
.41 .41 2.91
.22 .13 1.00
.64 .38 2.94
.43 .34 2.59 - .26 - .20 1.46 - .02 - .01 .03
.04 .01 .49
.02
Note: POLP = Police Personnel, CONF = Severity of Confinement, CRIM = Conviction Rates, STRI = logged Number of Strikes; BANK = Number of Bankruptcies.
178
be seen in the graphs - the frequency of strikes and fluctuations in crime rates covary strongly with each other.’
Second sub-period (19341983)
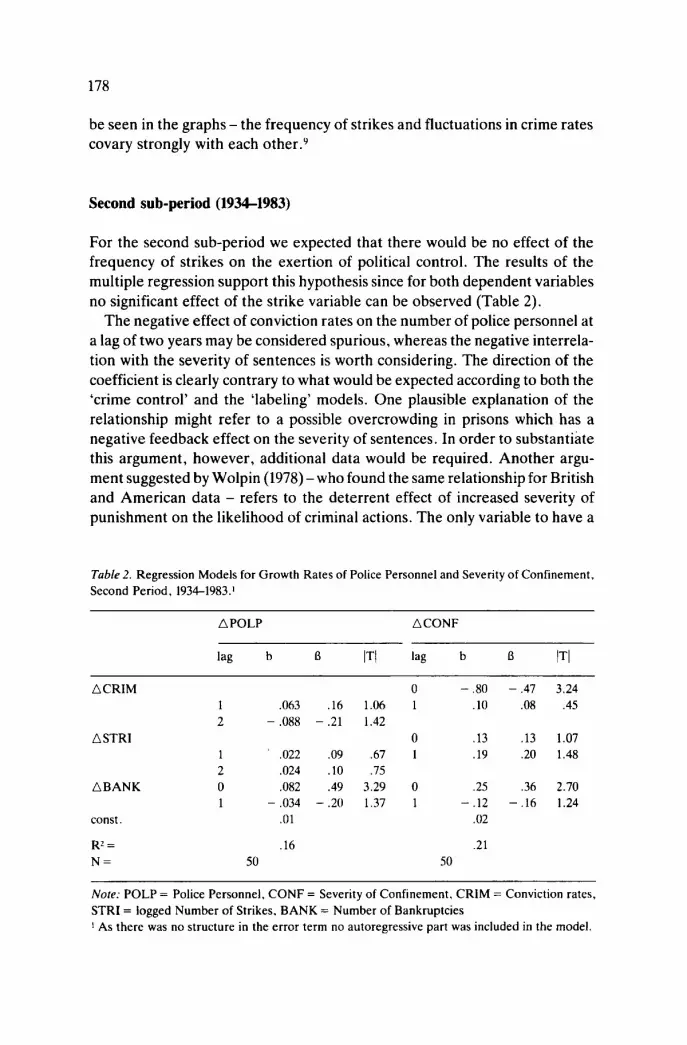
For the second sub-period we expected that there would be no effect of the frequency of strikes on the exertion of political control. The results of the multiple regression support this hypothesis since for both dependent variables no significant effect of the strike variable can be observed (Table 2).
The negative effect of conviction rates on the number of police personnel at a lag of two years may be considered spurious, whereas the negative interrela- tion with the severity of sentences is worth considering. The direction of the coefficient is clearly contrary to what would be expected according to both the ‘crime control’ and the ‘labeling’ models. One plausible explanation of the relationship might refer to a possible overcrowding in prisons which has a negative feedback effect on the severity of sentences. In order to substantiate this argument, however, additional data would be required. Another argu- ment suggested by Wolpin (1978) -who found the same relationship for British and American data - refers to the deterrent effect of increased severity of punishment on the likelihood of criminal actions. The only variable to have a
Table 2. Regression Models for Growth Rates of Police Personnel and Severity of Confinement, Second Period, 1934-1983.’
APOLP ACONF
lag b a IT1 1% b a IT1
ACRIM 1 2
1 2
ABANK 0 1
const.
A STRI
R2 =
N =
,063 - ,088
,022 ,024 ,082
- ,034 . O 1
.I6 50
0 .16 1.06 1
0 .09 .67 1 .10 .75 .49 3.29 0
- .21 1.42
- .20 1.37 1
- .80 - .47 3.24 .I0 .08 .45
.13 .13 1.07
.19 .20 1.48
.25 .36 2.70
.02 - .12 - .16 1.24
.21 50
Nore: POLP = Police Personnel, CONF = Severity of Confinement, CRlM = Conviction rates, STRI = logged Number of Strikes, BANK = Number of Bankruptcies I As there was no structure in the error term no autoregressive part was included in the model.
179
consistent effect on both the number of police personnel and the severity of confinement is the number of bankruptcies at simultaneity, with highly signifi- cant beta-coefficients of .49 and .36 respectively. This suggests that economic crises very strongly give rise to fears of social instability which manifest themselves in increased demands for public control activities. Our argument is supported by the fact that the bivariate CCF between bankruptcies and police personnel shows - apart from the correlation at lag zero - another significant peak at a lag of two years which was not included in the equation shown above. For the second period therefore, the ‘economic crises’ model apparently fits well the data on political control in the Canton of Zurich.
Conclusion
This paper began with the general proposition that different sociological models might apply to different periods in time. More specifically, each of the three models of political control described at the beginning of the paper tended to explain well the cyclical course of the extent of political control for one of the two specified sub-periods. This may be taken as evidence for the hypoth- esis that while regularities of interaction may persist over a period, they eventually give way to different patterns in due course. In the formulation of our hypotheses we expected such a change of pattern to be linked to the periodicity of Kondratiev Cycles. The results of the empirical investigation support this hypothesis. However, it has to be said that we do not know if this periodization is at its optimum. On the basis of the overlaid graphs a threefold periodization with breaking-points around 1920 and 1950 could also be valid and yield even better results.
Finally a certain inconsistency between the theory and the statistical ap- proach must be stressed. The hypotheses referred to cyclical patterns of rising and declining tendencies in the indicators of political control. However, as the testing of causal hypotheses with ARIMA models requires the time-series to be white noise, we had to remove precisely that cyclical structure from the data. Considering this, we might need more complex models which possibly include lagged feedback mechanisms in order specifically to test hypotheses which postulate interactions between cyclical patterns.
Acknowledgements
Many thanks to Hugo Meder for statistical advice and to Volker Bornschier and Robert Philip Weber for critical comments on earlier drafts of this paper.
Notes
I. For a general orientation see Gurr et al. (1977). Chambliss and Seidman (1971) and Haferkamp
2. The analysis of Gurr et al(l977) is different from the other research reported here insofar as the
3. The first 'peace-treaty' was concluded in 1937 between the Metal-Workers Union and the
4. Variables measured were suicide, crime against property, civil law cases and divorces. 5. They are usually referred to as ARIMA (n . p. q) models, where n denotes the degree of the
differencing part, p denotes the degree of the autoregressive part, and q is the degree of the moving-average part.
( 1980).
interaction between political conflict and inequality is not further considered.
employers.
6. See the Appendix, where detailed information about sources is also given. 7. Definitely more and better explanatory variables would be needed for a rigorous test of our
hypotheses. But desired data are often either not available for the whole period or they require very considerable amounts of time and manpower to be collected.
8. Yearly data on income inequalities exist from 1950 onwards. A test including this variable is to be made in the near future.
9. Exclusion of one variable in the regression causes the other to have larger effects. The direction of the effects and the distribution of lags. however. remain stable.
References
Beck. B. (1983). Lange Wellen wirtschaflichen Wachstums in der Schweiz. 18144913; eine Unter-
Becker, G. (1968). 'Crime and Punishment: an economic approach', Journal of Poli/ical Economy
Becker. H. (1963). Outsiders. New York: Free Press. Berk, R . , Brackman, H. , Lesser, A. (1977). A MeasureofJustice; an Empirical Study of Changes
Blumstein, A. et al. (1978). Deterrence and Incapacitation: Estimating the Effects of Criminal
Bonschier, V. (1986). 'Moderne Sozialstruktur und ihr Wandel'. Schweizerische Zeirschrift fur
Bornschier. V. (1986). 'Social Structure of Western Society; Divergence and Convergence'.
Box. G. and Jenkins, A. (1976). Time Series Analysis; Forecasting and Control (revised edition).
Chambliss, W. and Seidman, R. (1971). Law, Order and Power. Reading, Mass: Addison-Wesley. Chatfield. C. (1975). The Analysis of Time Series; an Introduction. London: Chapman and Hall. Davies, J . (1962). 'Toward a Theory of Revolution', American Sociological Review, 29: 5-19. van Duijn. J. (1983). The Long Wave in Economic Life. London: Allen & Unwin. Eisner, M. (1983). 'Wirtschaftliche Wachstumsschwankungen, abweichendes Verhalten und
Spannungen in der Sozialstruktur im Kanton Zurich, 185&1980'. Zurich Liz. arbeit. (un- published).
Gibbs. J. (1981). Norms, Deviance, and Social Control; Conceptual Matters. New York: Green- wood.
Gordon, D. (1980). 'Stages of Accumulation and Long Economic Cycles' in Hopkins, T. and
suchung der Hochbauinvesritionen und ihrer Bestimmungsgrunde. Bern: Haupt.
76: 169-217.
in the California Penal Code, 1955-1971. New York: Academic Press.
Sanctions on Crime Rates. Washington D.C.: National Academic Press.
Soziologie (to appear).
(mimeo).
San Francisco: Holden-Day.
181
Wallerstein, I . (eds.), Processes of the World-System. Beverly Hills: Sage.
Study of Four Cities. Beverly Hills: Sage.
Strafrechtsetzung. Opladen: Westdeutscher Verlag.
Gurr, T. , Grabovsky, R., Hula, R. (1977). The Politics of Crime and Conflict; a Comparative
Haferkamp, H. (1980). Herrschaft und Strafrecht; Theorien der Normentstehung und
Handbuch der Schweizer Geschichte (1980). Vol. 2. Bern: Haupt. Henry, A. and Short, J. (1964). Suicide and Homicide. New York: Free Press. Jacobs, D . (1978). ‘Inequality and the Legal Order’ Social Problems 25: 515-525. Jacobs. D. (1979). ‘Inequality and Police Strength: Conflict and Coercive Control in Metropolitan
Jacobs, D. and Britt, D. (1979). ‘Inequality and Police Use of Deadly Force’. Social Problems 26:
Jones, D. (1982). Crime. Protest, Community and Police in Nineteenth-Century Britain. London:
Lipiez, A. (1985). Accumulation, crises et sorties de cris: quelques rkflexions mithodologiques
Loftin, C. and McDowall, D. (1982). ‘The Police. Crime and EconomicTheory: An Assessment’,
Monkkonen. E. (1981). Police in Urban America, 1860-1920. Cambridge. Olson, M. (1971). ‘Rapid Growth as Destabilizing Factor’. pp 215-227 in Davies, J. (ed.). When
Men Revolt and Why. New York: Free Press. Sack, F. and Luderssen. K. (1975/76). Seminar: Abweichendes Verhalten, Vol. 1-111. Frankfurt
a.M.: Suhrkamp. Siegenthaler, H. (1978). ‘Kapitalbildung und sozialer Wandel in der Schweiz, 1850-1914’, Jahr-
bucher fur Nationalokonornie und Statistik 193, 1: 1-29. Siegenthaler, H. (1981). ‘Ansatze zu einer generalisierenden Interpretation langwelliger Wachs-
tumsschwankungen und ihrer sozialen Implikationen im fruhen 19. und 20. Jahrhundert’, in: Kellenbenz, H. (ed.), Wachstumsschwankungen, wirtschaftliche und soziale Auswirkungen, 8. Arbeitstagung der Gesellschaft fur Sozial- und Wirtschaftsgeschichte, Stuttgart, 1-45.
Siegenthaler. H. (1984). ‘The Structure of Economic Fluctuations, Individual Choice and Organi- zational Behavior’, in Kocka, J. and Rancki. G. (eds.), Economic Theory and History. Budapest.
Weber. R. (1981). ‘Society and Economy in the Western World System’, Social Forces 59: 1130- 1148.
Wolpin. K. (1978). ‘An Economic Analysisof Crime and Punishment in England and Wales, 1894- 1927’. Journal of Political Economy 86,51: 815-840.
Zwicky, H . (1982). Politkche A ktivitat, Illegitimitat und Stabilisierung. Diessenhoffen: Riiegger. Zwicky, H . (1984). ‘L’ inegalite des revenus et les ressources du controle social; un test de la these
Areas’, American Sociological Review 44: 913-925.
403ff.
Routledge & Kegan Paul.
autour de la notion de rigulation. Paris: CEPREMAP.
American Sociological Review 47: 393-401.
de menace: I’exemple des cantons suisses’. Deviance et sociktk 8: 357-375.
182
Appendix
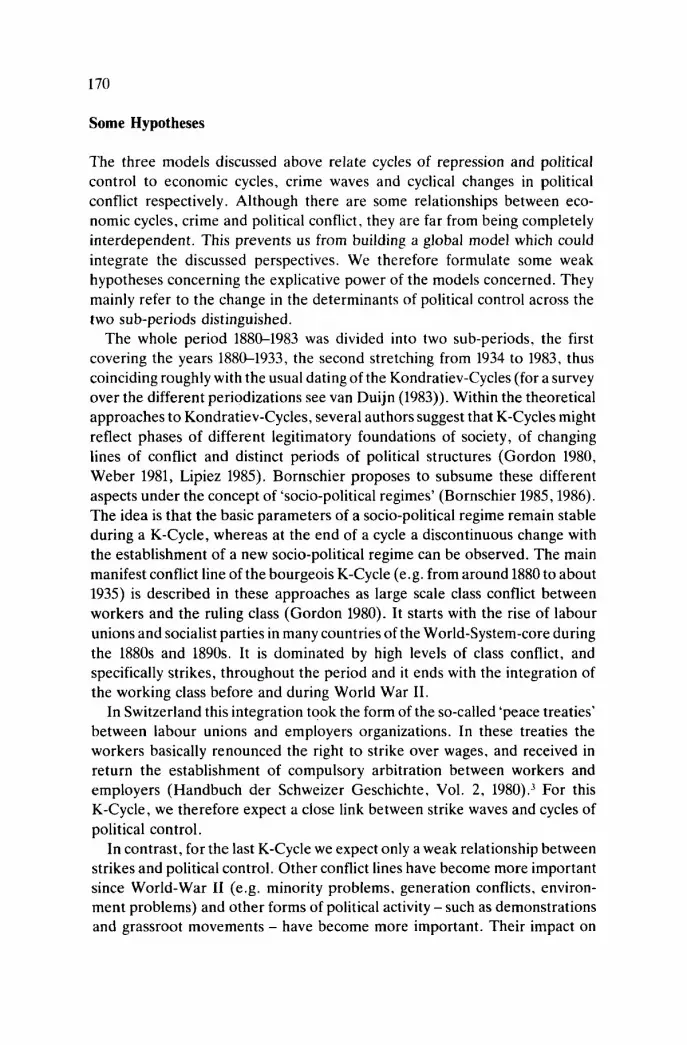
a) Growth Rates of Number of Police Personnel And 5-Years Moving Averages
-* 1800 I890 1900 1910 ’ 1920 1930 l 9 Y O 1950 1960 1970 I980 I990
i i n n Sources: Rechenschaftsbericht des Regierungsrates an den Kantonsrat,
1880-1984. Geschaftsbericht des Stadtrates, Zurich, 1880-1984.
b) Growth Rales of Severity of Confinement And 5-Years Moving Averages
301 I I
-3s 1880 I890 19w l a l o I920 I930 I l l 0 I l l 0 1IM 1970 lee0 Iwa
iram Sources: Rechenschaftsbericht deo Obergerichtes an den Regierungsrat
des Kanton Zurich, 1880-1984.
183
% 50,
YO.
10.
>a.
10.
0. -
I0
-?D
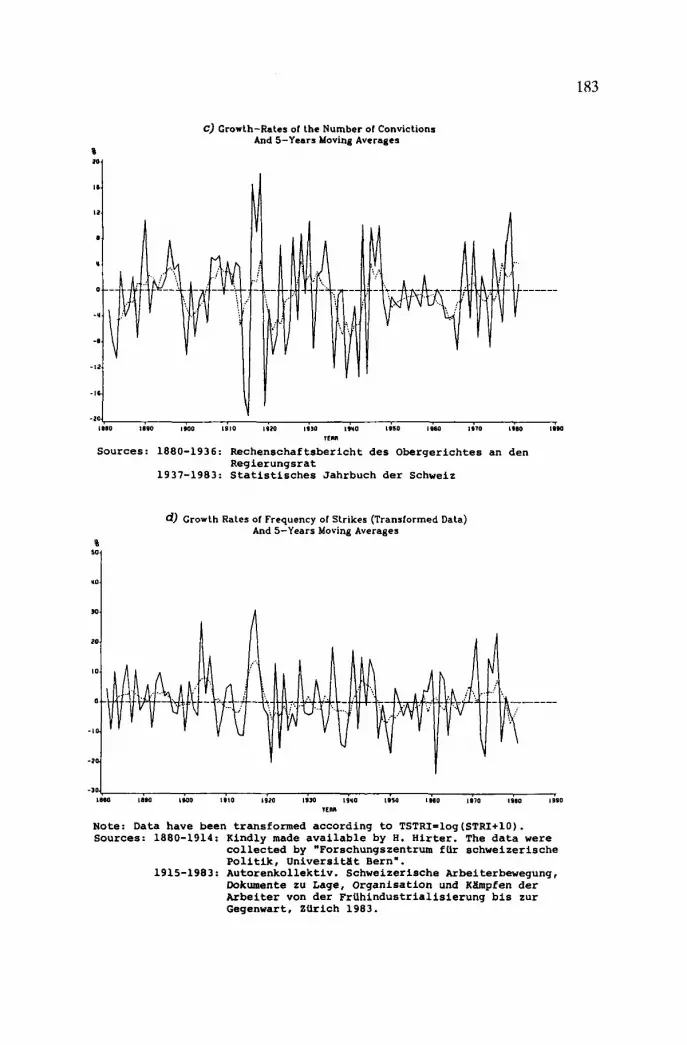
C) Growth-Rates of the Number of Convictions And 5-Years Moving Averages
I
-10 1110 1190 1900 I S 1 0 IWO 1910 I W O 1950 1980 1910 la80 1990
Sources: 1fnR
1880-1936: Rechenschaftsbericht des Obergerichtes an den Regierungsrat
1937-1983: Statistisches Jahrbuch der Schweiz
d) Growth Rates of Frequency of Strikes (Transformed Data) And 5-Years Moving Averages
-a 18eo IOM IMO 1910 IWO 1810 I ~ Y O IBYI i n o 19io 1980 ISSO
w n m Note: Data have been transformed according to TSTRI=log(STRI+lO). Sources: 1880-1914: Kindly made available by H. Hirter. The data were
collected by "Forschungszentrum flir schweizerische Politik, Universitat Bern".
1915-1983: Autorenkollektiv. Schweizerische Arbeiterbewegung, Dokumente zu Lage, Organisation und Khpfen der Arbeiter von der Friihindustrialisierung b i s zur Gegenwart, Zurich 1983.
184
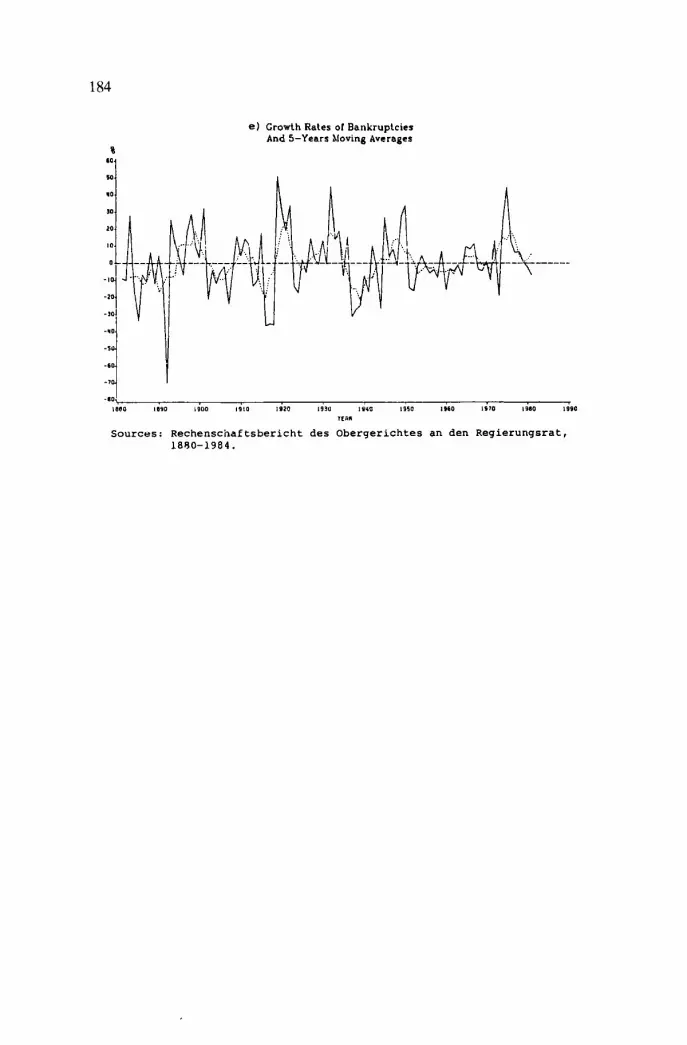
e) Growth Rates of Bankruptcies And 5-Years Moving Averages
%
18@0 I890 IS00 1910 I920 1930 I S Y O I950 IS60 I970 I940 1990 If i i l
Sources: Rechenschaftsbericht des Obergerichtes an den Regierungsrat, 1890-1984.