POPULATION ECOLOGY Computer Model for Simulating Almond Moth (Lepidoptera: Pyralidae) Population Dynamics JAMES E. THRONE, DAVID W. HAGSTRUM, AND JAN NAWROT 1 Grain Marketing and Production Research Center, USDAÐARS, 1515 College Avenue, Manhattan, KS 66502 Environ. Entomol. 27(2): 344Ð354 (1998) ABSTRACT We developed a computer model for simulating the population dynamics of the almond moth, Cadra cautella (Walker). The model incorporates previously published life history data for the almond moth developing on stored peanuts, Arachis hypogaea L., including stage-speciÞc immature developmental time and survival and adult longevity and fecundity. The model was modiÞed so that it also could be used to simulate almond moth population dynamics on stored, dried citrus pulp and stored corn (Zea mays L.). We tested the validity of the model by using 4 previously published data sets. The model was useful for interpreting population dynamics observed in the previously published studies and will be useful for optimizing management strategies for the almond moth. KEY WORDS Cadra cautella, citrus pulp, corn, peanuts, population dynamics, simulation model THE ALMOND MOTH, Cadra cautella (Walker), is a cos- mopolitan pest of stored grain and other stored prod- ucts, particularly cocoa, Theobroma cacao L., dried nuts and fruits, and peanuts, Arachis hypogaea L. (de Abreu et al. 1982). Eggs are laid on or near stored products. The larvae feed on the stored products, damaging the product directly and forming webbing on the surface that may interfere with processing. Older larvae may leave the food and wander to Þnd a pupation site. Adults are short-lived and do not feed on the stored products. Many control methods have been tested or used for almond moths. Use of protectant insecticides has been the predominant control strategy for the last 30 yr (Arthur 1989) but is now of limited usefulness because of problems with pest resistance to insecticides (Arthur et al. 1988). Fumigation with phosphine (Schesser 1977) or methyl bromide (Leesch et al. 1974) has been used to control existing infestations or sometimes on a regular schedule to prevent popula- tion increase, but the use of fumigants is becoming more restricted because of problems with environ- mental contamination. Other control strategies that have been tried experimentally but have not been widely used commercially are modiÞed atmospheres (Storey 1975), irradiation (Amoako-Atta and Partida 1976), low (Donahaye et al. 1995) or high tempera- tures (Arbogast 1981), biological control (Keever et al. 1986), mating disruption with pheromones (Prevett et al. 1989), and host plant (or commodity) resistance (Rathore et al. 1980). It is difÞcult to determine whether an almond moth population will reach or has reached damaging levels and which control method, or combination of meth- ods, will provide the best control. Depending on com- modity, populations may be sampled by using sticky (Bowditch and Madden 1996) or light traps (Kirk- patrick et al. 1972), or by examining the commodity directly (Riley 1957). However, relating number of insects in the samples to actual population size may be difÞcult (Vick et al. 1990, White et al. 1990), and population levels at which stored commodities should be treated have not been well established for most commodities. Thus, protectant chemicals and routine fumigations often have been used to try to suppress almond moth populations, with varying degrees of success (Kirkpatrick et al. 1972). Therefore, computer models that simulate almond moth population devel- opment in stored commodities could be useful for predicting timing and levels of population peaks and for optimizing control strategies. One of the essential components of a management model is a module for simulating the effects of envi- ronmental conditions on insect biology (Hagstrum and Throne 1989). Modules for simulating the effects of control strategies can then be developed and com- bined with the insect modules, and the resulting model can be used to investigate and optimize control strategies (Hagstrum and Flinn 1990). Development of population dynamics models can be particularly useful in identifying areas where further research is required to enhance understanding of observed pop- ulation dynamics (Ruesink 1976). Temperature, moisture, and diet are the main fac- tors inßuencing insect development on stored com- modities (Subramanyam and Hagstrum 1993) and should be included in a model for simulating almond This article reports the results of research only. Mention of a proprietary product does not constitute an endorsement or recom- mendation for its use by USDA. 1 Instytut Ochrony Roslin, UL. Miczurina 20, 60-318, Poznan, Po- land.
Transcript
POPULATION ECOLOGY
Computer Model for Simulating Almond Moth(Lepidoptera: Pyralidae) Population Dynamics
JAMES E. THRONE, DAVID W. HAGSTRUM, AND JAN NAWROT1
Grain Marketing and Production Research Center, USDAÐARS, 1515 College Avenue, Manhattan, KS 66502
Environ. Entomol. 27(2): 344Ð354 (1998)
ABSTRACT We developed a computer model for simulating the population dynamics of thealmond moth, Cadra cautella (Walker). The model incorporates previously published life historydata for the almondmothdeveloping on storedpeanuts, Arachis hypogaeaL., including stage-speciÞcimmature developmental time and survival and adult longevity and fecundity. The model wasmodiÞed so that it also could be used to simulate almond moth population dynamics on stored, driedcitrus pulp and stored corn (Zea mays L.). We tested the validity of the model by using 4 previouslypublished data sets. The model was useful for interpreting population dynamics observed in thepreviously published studies and will be useful for optimizing management strategies for the almondmoth.
KEY WORDS Cadra cautella, citrus pulp, corn, peanuts, population dynamics, simulation model
THE ALMOND MOTH, Cadra cautella (Walker), is a cos-mopolitan pest of stored grain and other stored prod-ucts, particularly cocoa, Theobroma cacao L., driednuts and fruits, and peanuts, Arachis hypogaea L. (deAbreu et al. 1982). Eggs are laid on or near storedproducts. The larvae feed on the stored products,damaging the product directly and forming webbingon the surface that may interfere with processing.Older larvae may leave the food and wander to Þnd apupation site.Adults are short-livedanddonot feedonthe stored products.
Many control methods have been tested or used foralmondmoths. Use of protectant insecticides has beenthe predominant control strategy for the last 30 yr(Arthur 1989)but is nowof limitedusefulnessbecauseof problems with pest resistance to insecticides(Arthur et al. 1988). Fumigation with phosphine(Schesser 1977) or methyl bromide (Leesch et al.1974) has been used to control existing infestations orsometimes on a regular schedule to prevent popula-tion increase, but the use of fumigants is becomingmore restricted because of problems with environ-mental contamination. Other control strategies thathave been tried experimentally but have not beenwidely used commercially are modiÞed atmospheres(Storey 1975), irradiation (Amoako-Atta and Partida1976), low (Donahaye et al. 1995) or high tempera-tures (Arbogast 1981), biological control (Keever etal. 1986),matingdisruptionwithpheromones(Prevettet al. 1989), and host plant (or commodity) resistance(Rathore et al. 1980).
It is difÞcult to determine whether an almond mothpopulation will reach or has reached damaging levelsand which control method, or combination of meth-ods, will provide the best control. Depending on com-modity, populations may be sampled by using sticky(Bowditch and Madden 1996) or light traps (Kirk-patrick et al. 1972), or by examining the commoditydirectly (Riley 1957). However, relating number ofinsects in the samples to actual population sizemay bedifÞcult (Vick et al. 1990, White et al. 1990), andpopulation levels at which stored commodities shouldbe treated have not been well established for mostcommodities. Thus, protectant chemicals and routinefumigations often have been used to try to suppressalmond moth populations, with varying degrees ofsuccess (Kirkpatrick et al. 1972). Therefore, computermodels that simulate almond moth population devel-opment in stored commodities could be useful forpredicting timing and levels of population peaks andfor optimizing control strategies.
One of the essential components of a managementmodel is a module for simulating the effects of envi-ronmental conditions on insect biology (Hagstrumand Throne 1989). Modules for simulating the effectsof control strategies can then be developed and com-bined with the insect modules, and the resultingmodel can be used to investigate and optimize controlstrategies (Hagstrum and Flinn 1990). Developmentof population dynamics models can be particularlyuseful in identifying areas where further research isrequired to enhance understanding of observed pop-ulation dynamics (Ruesink 1976).
Temperature, moisture, and diet are the main fac-tors inßuencing insect development on stored com-modities (Subramanyam and Hagstrum 1993) andshould be included in a model for simulating almond
This article reports the results of research only. Mention of aproprietary product does not constitute an endorsement or recom-mendation for its use by USDA.
1 Instytut Ochrony Roslin, UL. Miczurina 20, 60-318, Poznan, Po-land.
mothpopulation development.Nawrot (1979a) inves-tigated the effects of temperature and relative humid-ity on immature developmental time and survival andadult longevity and fecundity of the almond moth onpeanuts over the entire range of temperatures andrelative humidities at which the insect survives. Healso determined life history parameters of almondmoths on other foods (Nawrot 1979b).
Our objectives were to use previously publisheddata for almond moths on peanuts to develop a com-putermodel for simulating thepopulationdynamics ofthe almond moth on peanuts, to modify the model foruse on other commodities, and to determine the va-lidity of themodel.Development and validation of themodel would identify areas of research where furtherdata are required to enhance the usefulness of themodel as a management tool.
Materials and Methods
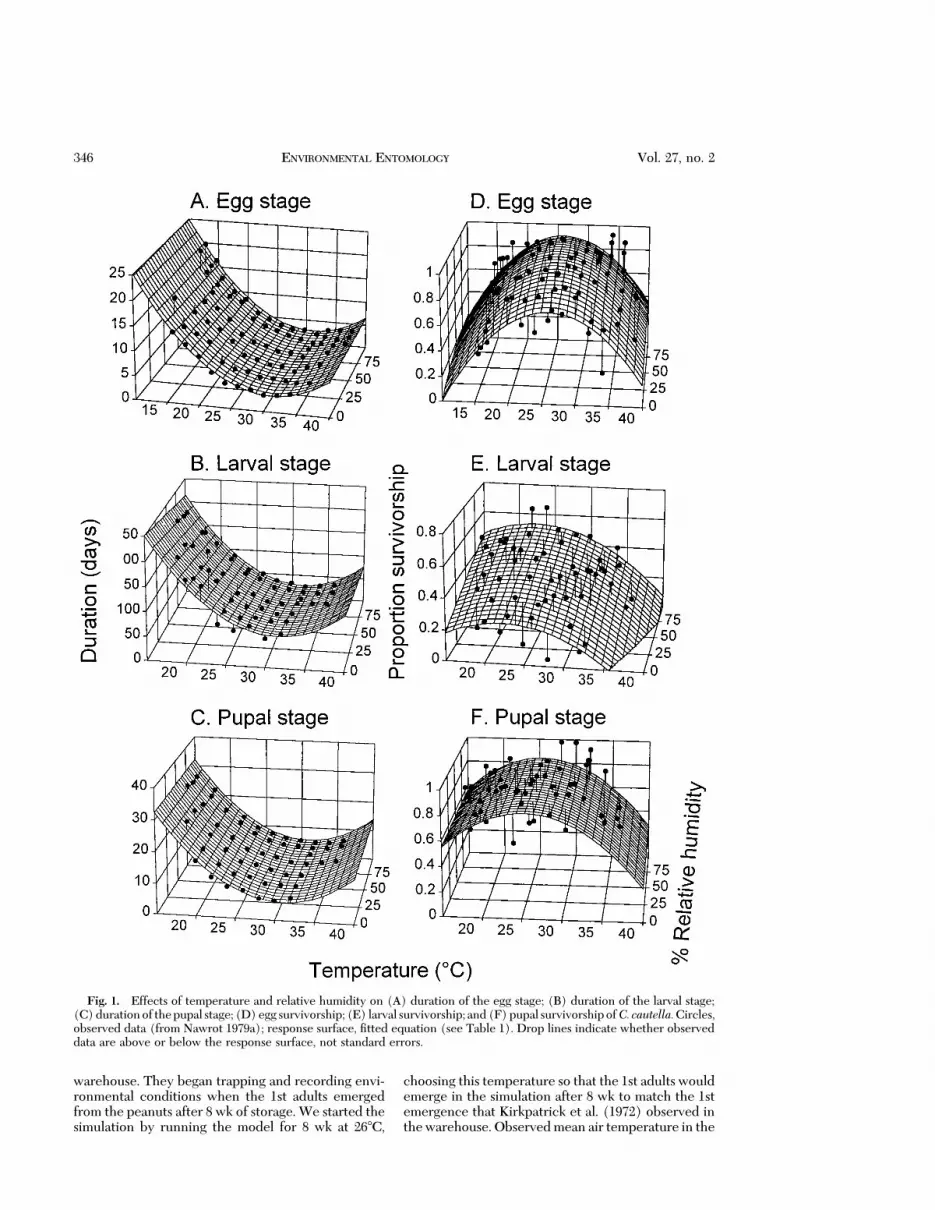
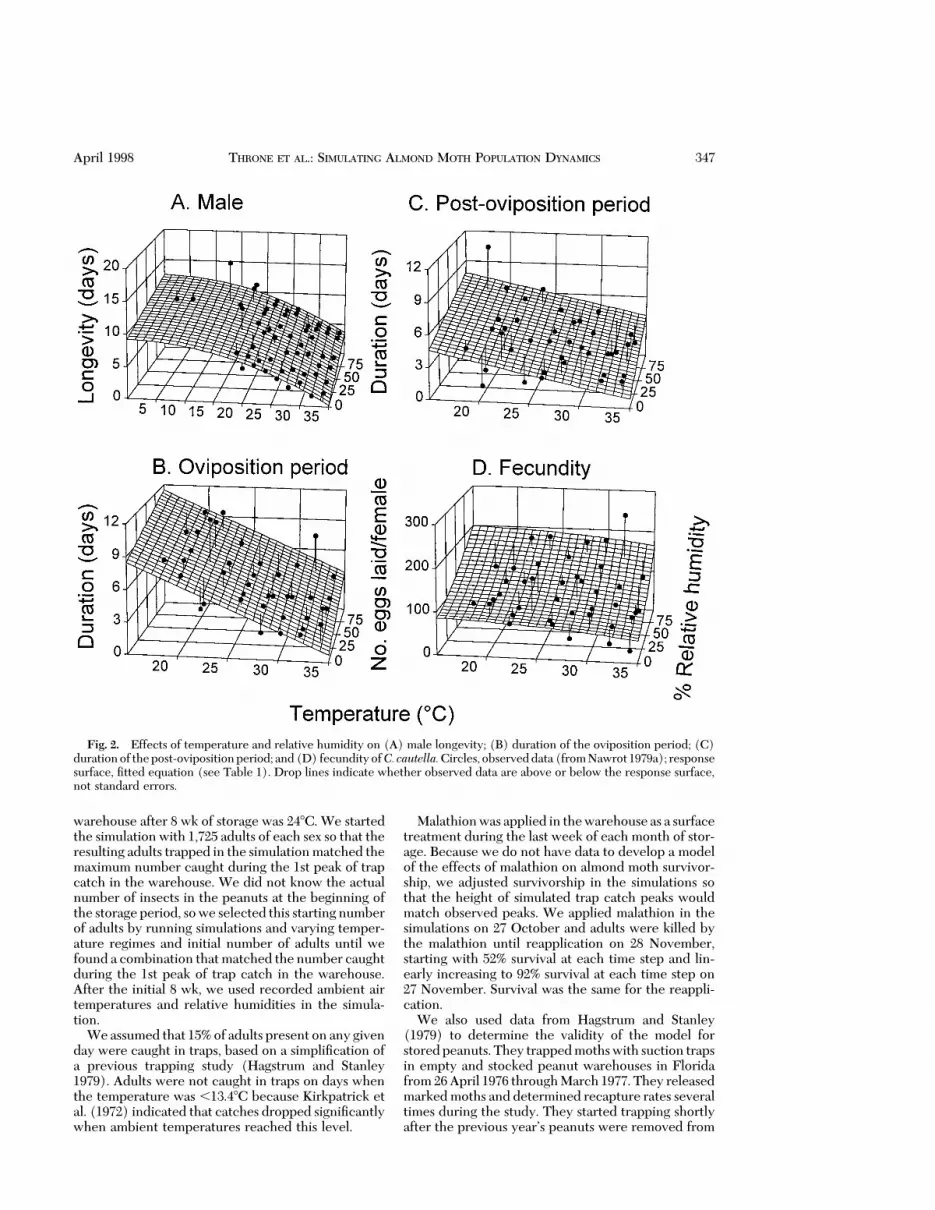
Model Development. The effects of temperatureand relative humidity on immature developmentaltime and survival and adult longevity and fecundity ofalmond moths were described by equations Þt usingTableCurve 3D software (Jandel ScientiÞc, SanRafael, CA). Equations were chosen for their Þt andsimplicity and because the shape of the response sur-face conformed to the general response to tempera-ture and relative humidity of other insects. We hadexpectations of the general shape of the responsesurfaces based on data for other insects and ensuredthat the selected response surfaces met these expec-tations when we extrapolated beyond our data. Weexpected that developmental times and mortality ofimmatureswould increase as temperature and relativehumidity decreased below or increased above opti-mum levels. Adult longevity should increase and rateof fecundity should decrease as temperature and rel-ative humidity decrease. Fit was determined by visualexamination of plots of predicted and observed data(Figs. 1 and 2), and by r2 values in Table 1. However,in interpreting r2, one must consider whether anyequation can Þt the observed data well. For example,the data for duration of immature stages followed aconsistent pattern as environmental conditionschanged (Figs. 1 AÐC), resulting in high r2 values forthese equations. Data for mortality of immature stages(Fig. 1 DÐF) and for adult fecundity and longevity(Fig. 2) were less consistent as environmental condi-tions changed, and this inconsistency is reßected inthe lower r2 values.Wedidnot try to increase r2 valuesby Þtting inconsistencies in the data as environmentalconditions changed.
Variation indevelopmental timewas simulatedwitha time-varying distributed delay (Manetsch 1976).The basis for thismethod is that the shape of the curvedescribing the number of individuals leaving a stageover time can be approximated by a member of theErlang family of density functions. The speciÞc func-tion is designated by K that is calculated as m2/s2,where m is mean development time of a stage at 1environmental condition and s2 is the variance asso-
ciated with that mean. When K equals 1, the functionis an exponential distribution. As K approaches inÞn-ity, the function approaches a discrete delay with avariance in developmental times of 0. The value of Kwas 11, 159, 29, 7, 9, and 4 for the egg, larval, pupal,adult male, ovipositing adult female, and post-ovipos-iting adult female stages, respectively. Themethod forcalculating K for each stage was according to Throne(1989). Emerging adults were distributed at a 1:1 sexratio. Time step in the model was 0.1 d (i.e., durationof development, survivorship, and fecundity were up-dated in the simulations every0.1dandenvironmentalconditions were input every 0.1 d).
Model Validation on Peanuts. We used publisheddata sets to determine the validity of the model. Themodel simulates population development based onenvironmental conditions but does not simulate theeffects of management strategies on insect popula-tions. We made assumptions about the effects of themanagement strategies used in the validation studiesbased on descriptions in the published studies. How-ever, we did not simulate the management strategiesin the model, but rather we tried to mimic the effectthat the management strategies had on the insect pop-ulations under the speciÞc conditions of the study.Theway thatwemimicked themanagement strategiesin this model would not be expected to be applicableto other management situations. For example, if theauthors stated that 10% of larvae were killed by mitesin their study, then we killed 10% of larvae in thesimulations. To actually model the effects of mites onalmond moth population dynamics, we would need toknow the effects of environmental conditions on mitepopulation development and on the interaction ofmites and almond moths. Submodels for simulatingmanagement strategies will need to be added beforethe model can be used for making management de-cisions, and development of these submodels awaitsthe collection of data required for modeling manage-ment strategies. However, the current model can beused to determine when pest control is required.
Approximately 1.4 million metric tons of peanutsare grown in the United States each year (USDA1994), with a production value of over $1 billion. Mostpeanuts are used for peanut butter or candy, or areeaten directly. Peanuts are grown in the southernUnited States, harvested in fall, dried, and placed intostorage. Peanuts may be moved into storage in a ware-house over a 1- to 2-mo period as harvest progresses.Protectant chemicals and fumigants are used to limitinsect infestation levels in storage. Peanuts may beremoved from storage over an extended period, de-pending upon processing needs.
We used 2 published data sets to determine thevalidityof themodel for storedpeanuts, and thesedatasets reported environmental conditions and estimatesof almond moth population levels. Kirkpatrick et al.(1972) tested2 typesof light traps formonitoringadultmoth activity in a peanut storage in Georgia from 11October to 19 December 1965. They found low levelsof Þeld infestation of the peanuts, so we assumed thatthe peanuts were infested by adults ßying into the
April 1998 THRONE ET AL.: SIMULATING ALMOND MOTH POPULATION DYNAMICS 345
warehouse. They began trapping and recording envi-ronmental conditions when the 1st adults emergedfrom the peanuts after 8 wk of storage. We started thesimulation by running the model for 8 wk at 268C,
choosing this temperature so that the 1st adults wouldemerge in the simulation after 8 wk to match the 1stemergence that Kirkpatrick et al. (1972) observed inthewarehouse.Observedmean air temperature in the
Fig. 1. Effects of temperature and relative humidity on (A) duration of the egg stage; (B) duration of the larval stage;(C)durationof thepupal stage; (D)egg survivorship; (E) larval survivorship; and(F)pupal survivorshipof C. cautella.Circles,observed data (from Nawrot 1979a); response surface, Þtted equation (see Table 1). Drop lines indicate whether observeddata are above or below the response surface, not standard errors.
346 ENVIRONMENTAL ENTOMOLOGY Vol. 27, no. 2
warehouse after 8 wk of storage was 248C. We startedthe simulation with 1,725 adults of each sex so that theresulting adults trapped in the simulationmatched themaximum number caught during the 1st peak of trapcatch in the warehouse. We did not know the actualnumber of insects in the peanuts at the beginning ofthe storage period, sowe selected this starting numberof adults by running simulations and varying temper-ature regimes and initial number of adults until wefound a combination thatmatched the number caughtduring the 1st peak of trap catch in the warehouse.After the initial 8 wk, we used recorded ambient airtemperatures and relative humidities in the simula-tion.
We assumed that 15%of adults present on any givenday were caught in traps, based on a simpliÞcation ofa previous trapping study (Hagstrum and Stanley1979). Adults were not caught in traps on days whenthe temperature was ,13.48C because Kirkpatrick etal. (1972) indicated that catches dropped signiÞcantlywhen ambient temperatures reached this level.
Malathionwas applied in thewarehouse as a surfacetreatment during the last week of each month of stor-age. Because we do not have data to develop a modelof the effects of malathion on almond moth survivor-ship, we adjusted survivorship in the simulations sothat the height of simulated trap catch peaks wouldmatch observed peaks. We applied malathion in thesimulations on 27 October and adults were killed bythe malathion until reapplication on 28 November,starting with 52% survival at each time step and lin-early increasing to 92% survival at each time step on27 November. Survival was the same for the reappli-cation.
We also used data from Hagstrum and Stanley(1979) to determine the validity of the model forstoredpeanuts. They trappedmothswith suction trapsin empty and stocked peanut warehouses in Floridafrom26April 1976 throughMarch 1977. They releasedmarkedmoths and determined recapture rates severaltimes during the study. They started trapping shortlyafter the previous yearÕs peanuts were removed from
Fig. 2. Effects of temperature and relative humidity on (A) male longevity; (B) duration of the oviposition period; (C)durationof thepost-ovipositionperiod; and(D) fecundityofC. cautella.Circles, observeddata(fromNawrot1979a); responsesurface, Þtted equation (see Table 1). Drop lines indicate whether observed data are above or below the response surface,not standard errors.
April 1998 THRONE ET AL.: SIMULATING ALMOND MOTH POPULATION DYNAMICS 347
storage. More peanuts were loaded into storage afterseveral months. The peanuts were fumigated withphosphine during the study and removed from thewarehouse near the end of the study.
We used recorded ambient air temperatures in thesimulation, and relative humidity was constant at 70%.We added newly emerged adult males and femalesover a 7-wk period to initialize the simulation: 16, 14,19, 39, 50, 46, and 40 of each sex per day for week 3Ð9.Numbers were chosen to match the 1st observed peak
of trap catch by running numerous simulations be-cause we did not know the actual infestation rate. Weinput adultsover a7-wkperiod, rather thanatone timeas in the 1st simulation, because in this study thepreviousyearÕs peanutshadalreadybeen in storage for#6 mo before trapping was started, and there shouldhave been almond moths in all stages present in re-sidualpeanuts at the initiationof trappingeven thoughthe bulk of the peanuts had been removed from stor-age. Based on observed recapture rates, 7% of females
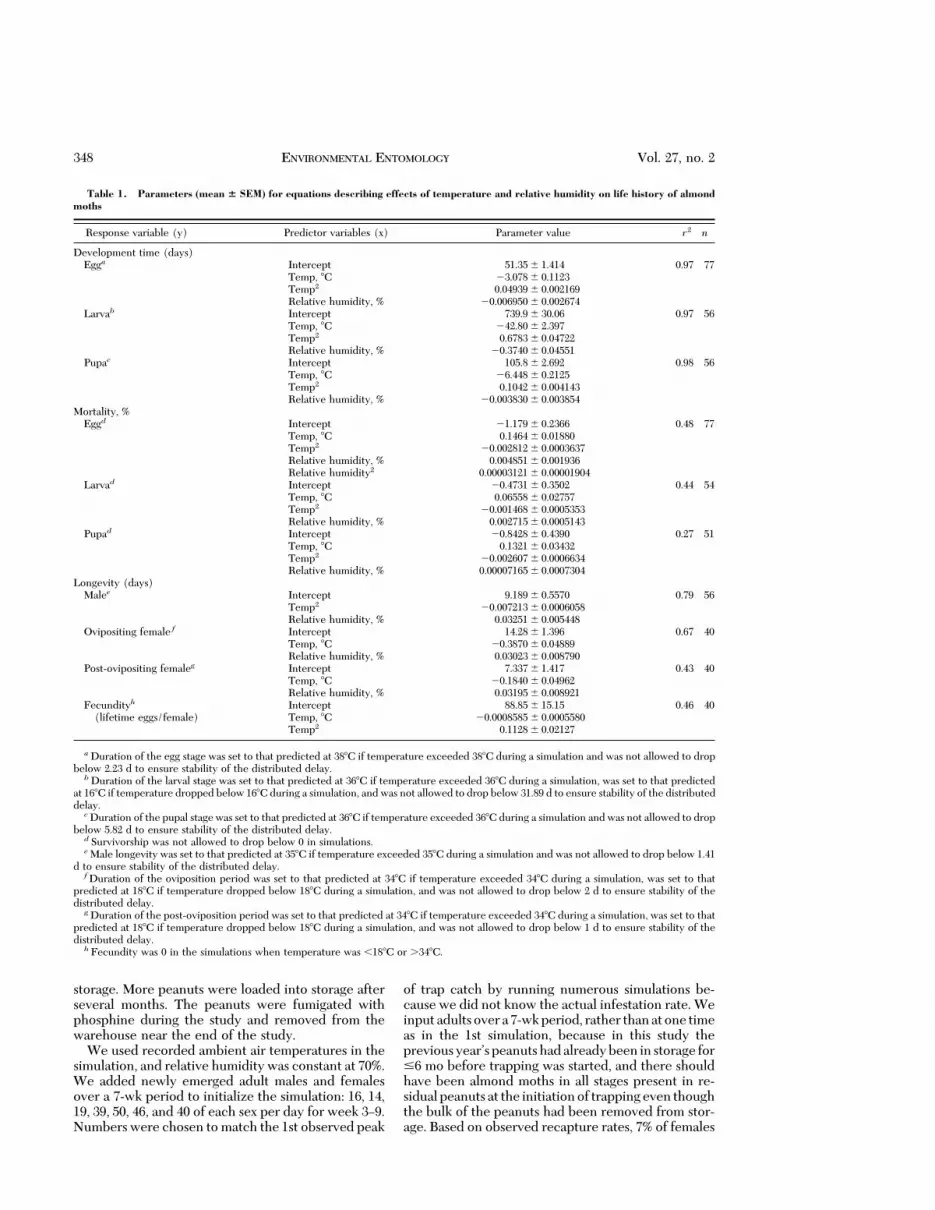
Table 1. Parameters (mean 6 SEM) for equations describing effects of temperature and relative humidity on life history of almondmoths
Response variable (y) Predictor variables (x) Parameter value r2 n
Development time (days)Egga Intercept 51.35 6 1.414 0.97 77
a Duration of the egg stage was set to that predicted at 388C if temperature exceeded 388C during a simulation and was not allowed to dropbelow 2.23 d to ensure stability of the distributed delay.
b Duration of the larval stage was set to that predicted at 368C if temperature exceeded 368C during a simulation, was set to that predictedat 168C if temperature dropped below 168C during a simulation, and was not allowed to drop below 31.89 d to ensure stability of the distributeddelay.
c Duration of the pupal stage was set to that predicted at 368C if temperature exceeded 368C during a simulation and was not allowed to dropbelow 5.82 d to ensure stability of the distributed delay.
d Survivorship was not allowed to drop below 0 in simulations.e Male longevity was set to that predicted at 358C if temperature exceeded 358C during a simulation and was not allowed to drop below 1.41
d to ensure stability of the distributed delay.f Duration of the oviposition period was set to that predicted at 348C if temperature exceeded 348C during a simulation, was set to that
predicted at 188C if temperature dropped below 188C during a simulation, and was not allowed to drop below 2 d to ensure stability of thedistributed delay.
g Duration of the post-oviposition period was set to that predicted at 348C if temperature exceeded 348C during a simulation, was set to thatpredicted at 188C if temperature dropped below 188C during a simulation, and was not allowed to drop below 1 d to ensure stability of thedistributed delay.
h Fecundity was 0 in the simulations when temperature was ,188C or .348C.
348 ENVIRONMENTAL ENTOMOLOGY Vol. 27, no. 2
and 20%ofmaleswere trapped in the unstockedware-house (after the previous yearÕs peanuts were re-moved from storage) in the simulations, and 10% offemales and 31% of males were trapped in the stockedwarehouse.
Peanuts were fumigated with phosphine from day211 to 215 in the simulations, and 90% of adults, 12%of pupae, and 10% of the oldest larvae present at eachtime step were killed. These rates were chosen tomatch the height of observed peaks of trap catch. Wekilled only older larvae in the simulation because theyleave the peanuts to Þnd a pupation site and would beexposed to the fumigant, which had been appliedincorrectly by placing tablets on the surface of thepeanut bulk rather thanbyprobing the tablets into thepeanuts. The fumigant probably would not have pen-etrated the peanut bulk to kill larvae in the peanuts.Over the 5-d fumigation period, these mortality rateswould remove nearly 100% of the older larvae, pupae,and adults. Peanuts were unloaded from day 232 to287, and 1.4% of all insects present were removedalong with the peanuts at each time step. Again, thisremoval rate was chosen to match the height of ob-served peaks because we did not know actual removalrates.
Model Validation on Citrus Pulp. Dried citrus pulpis used as animal feed, providing a market for a by-product of citrus juice production. The pulp is ob-tained shortly after harvesting and processing, thendried, and moved into storage warehouses over a 1- to2-mo period. We used data from Hagstrum and Sharp(1975) to determine whether our model might beuseful for predicting almond moth population dynam-ics on dried citrus pulp. They used artiÞcial pupationsites to monitor the larval population in a warehousecontaining citrus pulp in Florida during 1973.
We ran the model for 8 wk at 258C to develop amixed age structure to start the simulation. We inputadults at the rate of 5, 9, 13, 18, and 10 of each sex perday during each of Þve 3-d periods to match the num-ber of larvae trapped during the 1st peak of trap catch.The temperature regime during loading and the initialnumber of insects input per day were determined byrunning simulations untilwe found a combination thatmatched the 1st peak of trap catch.
We decreased larval developmental time by 21%comparedwith development on peanuts, tomatch thegeneration time observed between the 1st and 2ndpeaks because actual rate of development of almondmoths on dried citrus pulp has not been determinedunder controlled conditions. The larva is the onlystage that feeds on the dried citrus pulp, so we as-sumed that any delays in development caused by foodtype should be applied to the larval stage. Larvaeentered diapause at different times: 1.3% during days1Ð91, 15% during days 92Ð140, 34% during days 141Ð196, and 50% during days 197Ð252 (Hagstrum andSharp 1975). These time periods correspond to the 1stthrough 4th generations, respectively. Nineteen per-cent of diapausing larvae complete diapause eachweek in the simulation. We trapped 0.1% of the lastlarval stage (159 total larval stages) each day, because
we would expect only the older larvae to be trappedas they search for a pupation site.
We included mortality due to Bacillus thuringiensisBerliner, a pathogenic bacterium, starting at 5.5% onday 113 and increasing linearly to 21% on day 182(Hagstrum and Sharp 1975). Mortality remained at21% throughout the rest of the simulation. We as-sumed that the bacterium killed only the 7 youngestlarval stages.
Egg predation by the red ßour beetle, Triboliumcastaneum (Herbst) (Coleoptera: Tenebrionidae),and by the mite Blattisocius tarsalis (Berlese) (Me-sostigmata: Ascidae) also was observed in the citruswarehouse. We simulated egg predation by killing2.4% of eggs daily starting on day 127 and linearlyincreasing mortality to 8.4% by the end of the study.Thesemortality rateswere chosen tomatch theheightof simulated and observed peaks of trap catches.
Model Validation on Corn. We used data reportedby Graham (1970a, b) to determine whether ourmodel could be used to simulate almond moth pop-ulation dynamics on stored corn (Zea mays L.). Heused ßight-interception traps to monitor adult popu-lation levels in a warehouse containing bagged corn inKenya during 1966. The corn was placed into storageinMay1965, fumigated in June andagain inDecemberbecause of an increasing moth population, and thestudy began in January 1966. Moths were presentwhen the study began, despite the fumigation a fewweeks before the study. Egg predation by B. tarsaliswas presumed to be a major factor determining al-mond moth population dynamics.
We started the simulation by running the model for62 d at 238C and 70% RH to give a mixed age structure.This temperature was similar to that at the start of thewarehouse study, and 62 d allowed a generation to becompleted in the simulation before 1 January. Inputwas 7,000; 4,000; 8,000; 20,000; 27,000; 3,000; 3,000;3,000; and 1,500 eggs per day for 9 wk, respectively, tomatch the emergence of the 1st generation moths inthe warehouse. These numbers were obtained by run-ning simulations at varying environmental conditionsand with different numbers and stages of moths.
We used recorded grain temperatures for the sim-ulation and 70% RH. We reduced larval developmen-tal time by 40% (Nawrot 1979b) compared with de-velopment on peanuts. A small proportion (0.1%) ofadults present at the end of each day were trapped, tomatch peaks of trap catches observed in the ware-house. Egg mortality due to predation by B. tarsaliswas 0% on day 80 and increased linearly to 43% eachtime step on day 158, to match peaks of trap catchesobserved in the warehouse.
Results and Discussion
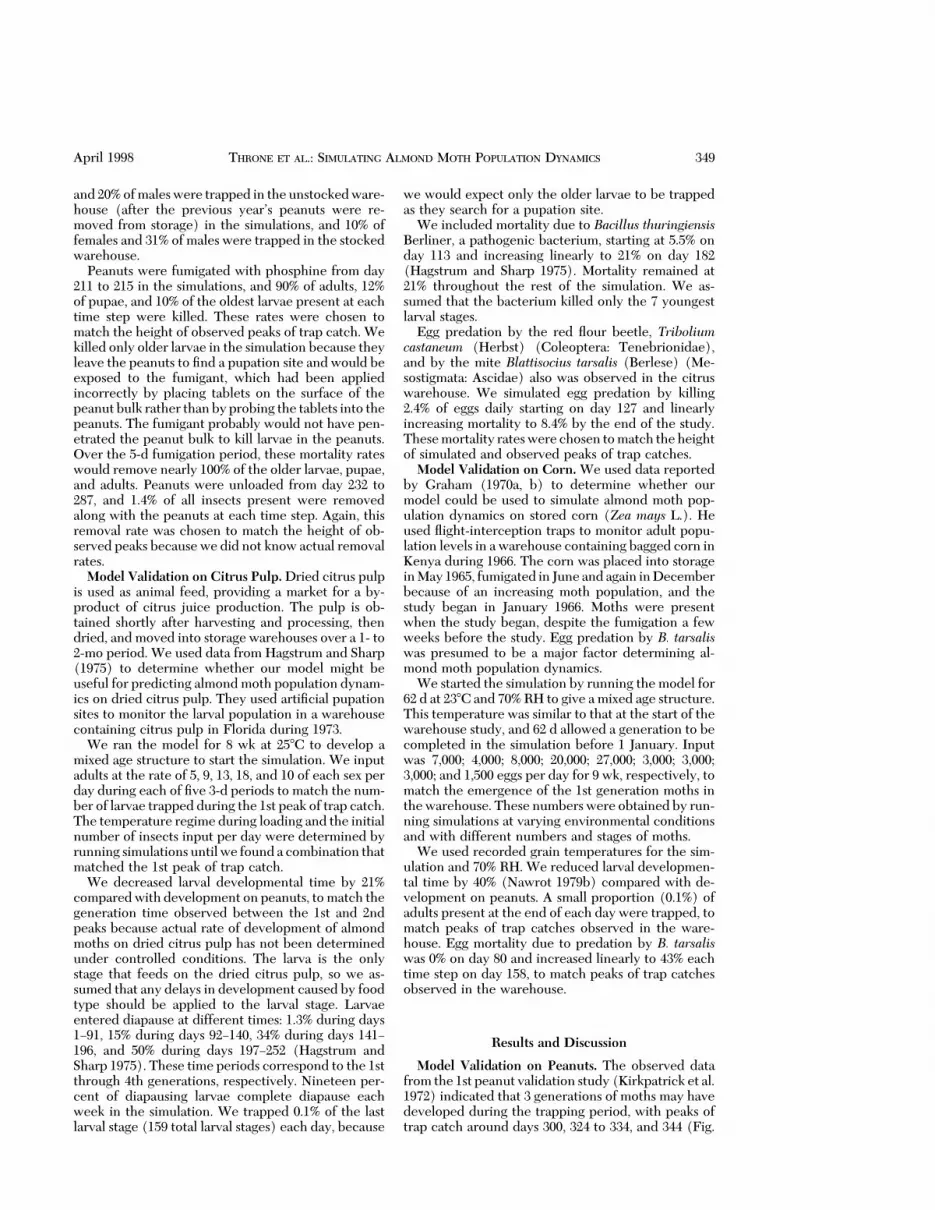
Model Validation on Peanuts. The observed datafrom the 1st peanut validation study (Kirkpatrick et al.1972) indicated that 3 generations of moths may havedeveloped during the trapping period, with peaks oftrap catch around days 300, 324 to 334, and 344 (Fig.
April 1998 THRONE ET AL.: SIMULATING ALMOND MOTH POPULATION DYNAMICS 349
3A). We found that if we started simulations with eggsor ovipositing adults, no adults emerged during thesimulations because of low temperatures during thetrapping period. The model showed that the apparentpeaks were not due to different generations of adultsemerging but were due to changes in emergence ortrapping efÞciency caused by changes in environmen-tal conditions. Thus, not even a single generation wascompleted during the study.
Our initial simulation, which did not include mor-tality due to malathion, overestimated the number ofadults captured during the study (Fig. 3A). However,the timing of observed and simulated maximal andminimal catcheswas similar fromday 327 to 354. Fromdays 300 to 304 (the end of October), trap catchesincreased in the simulations but dropped in the ware-house. This decrease in trap catch indicated that themalathion applications at the end of each month didaffect population development in the trapping studyand would have to be included in the simulations.Addingmalathion-inducedmortality to the simulationresulted in more accurate simulation of numbers ofadults trapped and timing ofmaxima andminima (Fig.3B). During times when the model results deviatedmost from observed trap catch (from day 319 to 328),the greatest variation in observed trap catch also oc-curred. Trapping efÞciency may have varied duringthis time in response toenvironmental ormanagementconditions during the trapping study, whereas trap-ping efÞciency was constant in the simulation duringthis time.
Our model provided a good simulation of almondmoth population development during the trappingstudy, despite some shortcomings in data because thestudyhadnot beendesigned formodel validation. Thedata were reported as mean trap catches from 3 ware-houses, even though environmental conditions wereslightly different for each warehouse. The numbers ofadults trapped were reported as means of the meansof trapcatches fromthe3warehouseswithnomeasureof variance reported. Standard mean and variancerelationships (Taylor 1984) indicate that trappingvariance in this study would have been large; thus,conÞdence limits on trap catch would compensate fortimes when the simulation varied from the observeddata.
The simulation indicated that very large numbers ofadults must have entered the peanut storages duringthe trapping study. Kirkpatrick et al. (1972) found lowlevels of Þeld infestation of the peanuts, yet trapcatches sometimes exceeded 700 adults per day andprobablyonlya small percentageof adultswas trapped(Hagstrum and Stanley 1979). Little is known aboutrates of migration in and out of stored commodities,although largenumbersof stored-product insectshavebeen trapped outside grain storages indicating thepossibility of extensivedispersal into storages (Throneand Cline 1994).
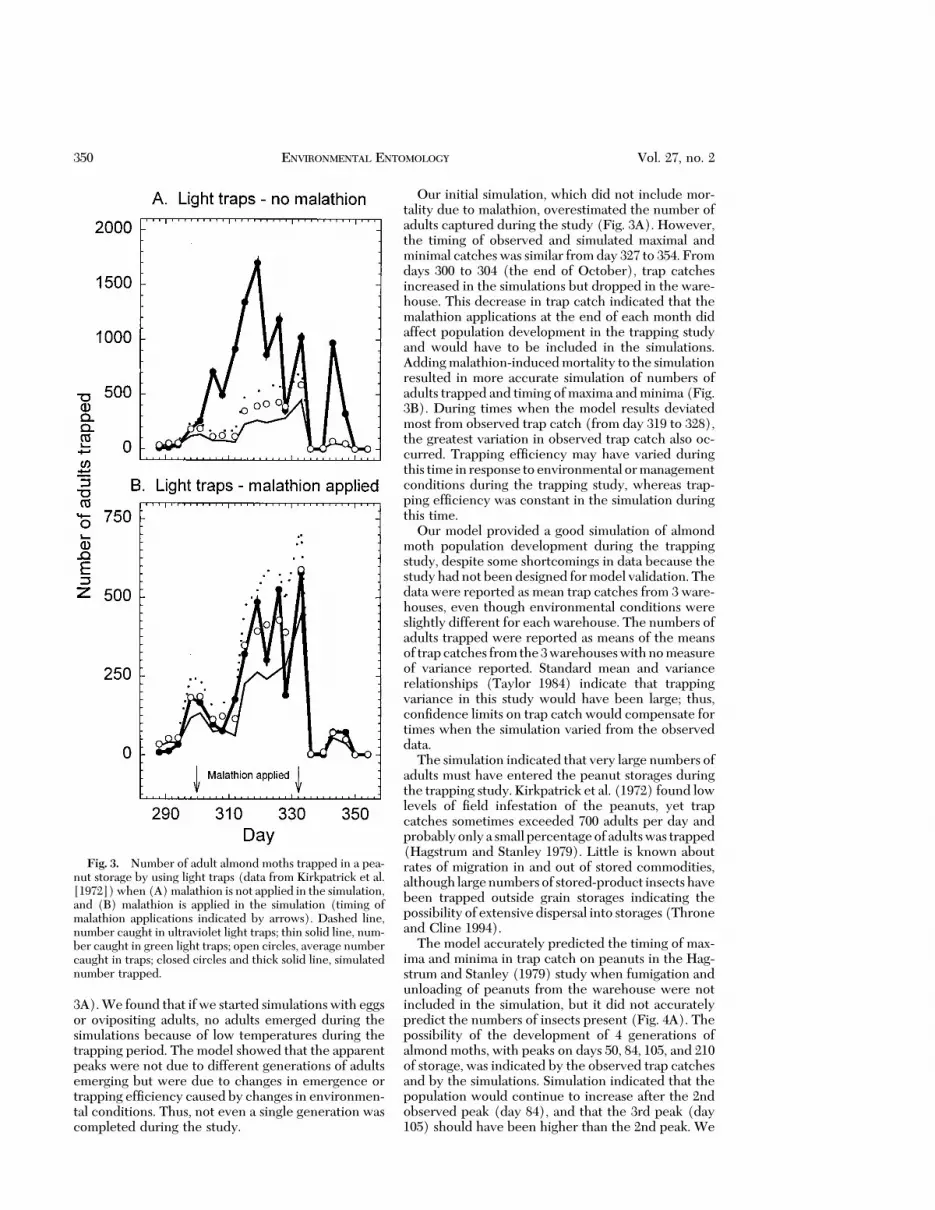
The model accurately predicted the timing of max-ima and minima in trap catch on peanuts in the Hag-strum and Stanley (1979) study when fumigation andunloading of peanuts from the warehouse were notincluded in the simulation, but it did not accuratelypredict the numbers of insects present (Fig. 4A). Thepossibility of the development of 4 generations ofalmond moths, with peaks on days 50, 84, 105, and 210of storage, was indicated by the observed trap catchesand by the simulations. Simulation indicated that thepopulation would continue to increase after the 2ndobserved peak (day 84), and that the 3rd peak (day105) should have been higher than the 2nd peak. We
Fig. 3. Number of adult almond moths trapped in a pea-nut storage by using light traps (data from Kirkpatrick et al.[1972])when (A)malathion is not applied in the simulation,and (B) malathion is applied in the simulation (timing ofmalathion applications indicated by arrows). Dashed line,number caught in ultraviolet light traps; thin solid line, num-ber caught in green light traps; open circles, average numbercaught in traps; closed circles and thick solid line, simulatednumber trapped.
350 ENVIRONMENTAL ENTOMOLOGY Vol. 27, no. 2
suggest that observed trap catch dropped during the2nd peak because traps were moved close to the ceil-ing toprepare for loadingof peanuts in thewarehouse,thus changing trapping efÞciency. We further suggestthat the observed 3rd peak was low because peanutswere being loaded into the warehouse at this time sothat loading activity and dust in the air reduced trapcatch. Thus, the population actually must have beenlarger than the traps indicated during this time, or thehighest peak (day 210) would not have been so large.
Population development in the simulations afterday 210 followed the same pattern as observed withtrapping. However, simulated catches were too high.Peanuts were fumigated in the warehouse on, orabout, day 210, and simulated fumigation resulted in asimilar drop in population size after day 210 (Fig. 4B).However, subsequent population growth was still toorapid. Peanuts were removed from the warehousefrom days 232 to 287, resulting in an initial drop in trapcatches and then an increase after unloading ceased.Unloading would remove insects from the warehousewith the peanuts and interfere with trapping. Inclu-sion of peanut removal in the simulations resulted ina close Þt to observed data (Fig. 4C).
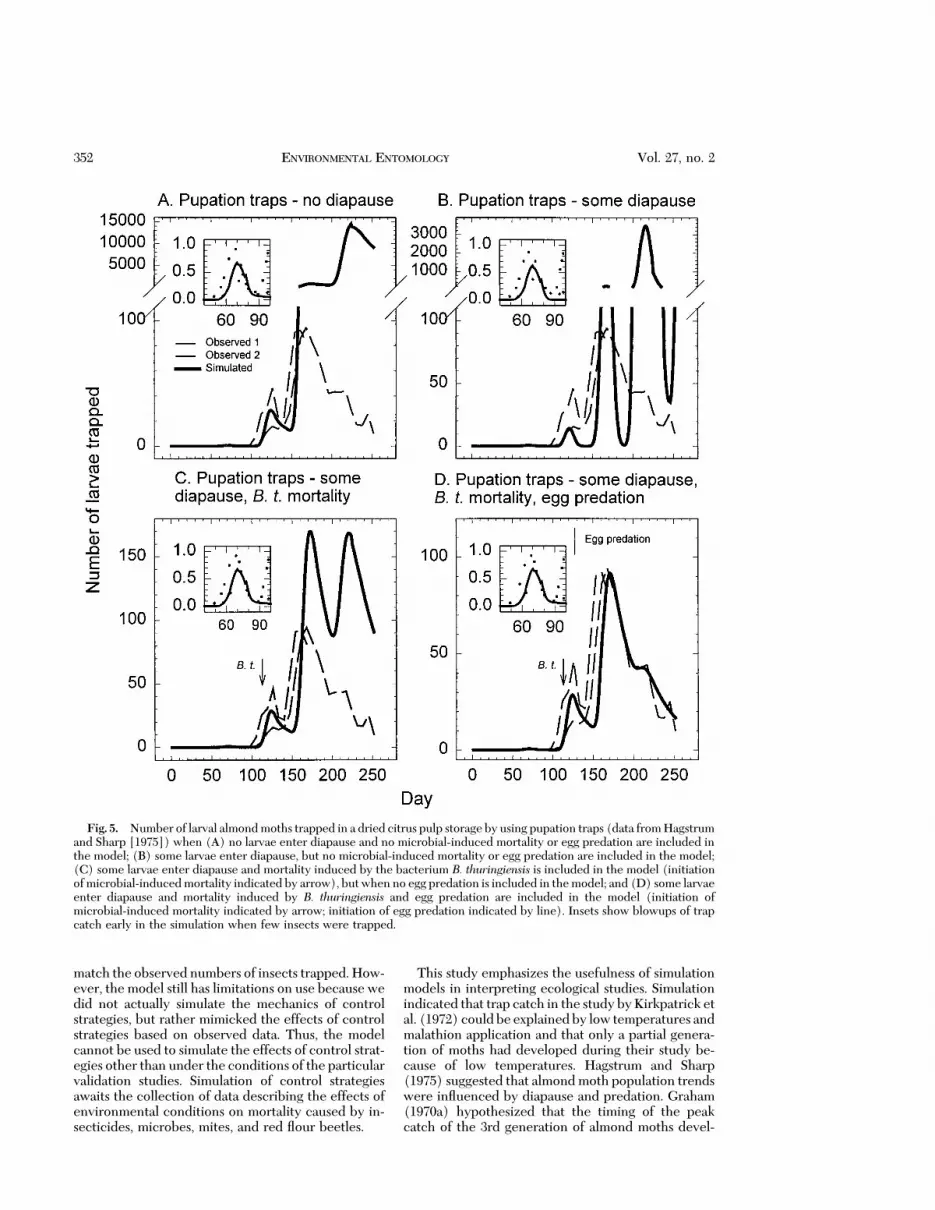
Model Validation on Citrus Pulp. Larval develop-mental time was adjusted to reßect generation timebetween the 1st and 2nd generations, but then themodel accurately predicted timing of peak trap catchof the next 2 generations when diapause, B. thurin-giensis-induced mortality, and egg predation were notincluded in the simulations (Fig. 5A). However, num-bers of adults caught were overestimated in the sim-ulations. Inclusion of diapause in the model improvedthe Þt at peak 2 (day 122), but the height of subse-quent peaks was still overestimated (Fig. 5B). Inclu-sion of B. thuringiensis-induced mortality in the modellowered the height of the last 2 peaks, but they werestill too high (Fig. 5C). Inclusion of egg predation inthe model resulted in a good Þt to observed data (Fig.5D). Hagstrum and Sharp (1975) indicated that theirtrap catches suggested that generation times werefrom 6 to 8 wk during the study. Our simulation cor-roborates this Þnding. Our results indicate that themodel is useful for simulating timing of almond mothpopulation dynamics on dried citrus pulp.
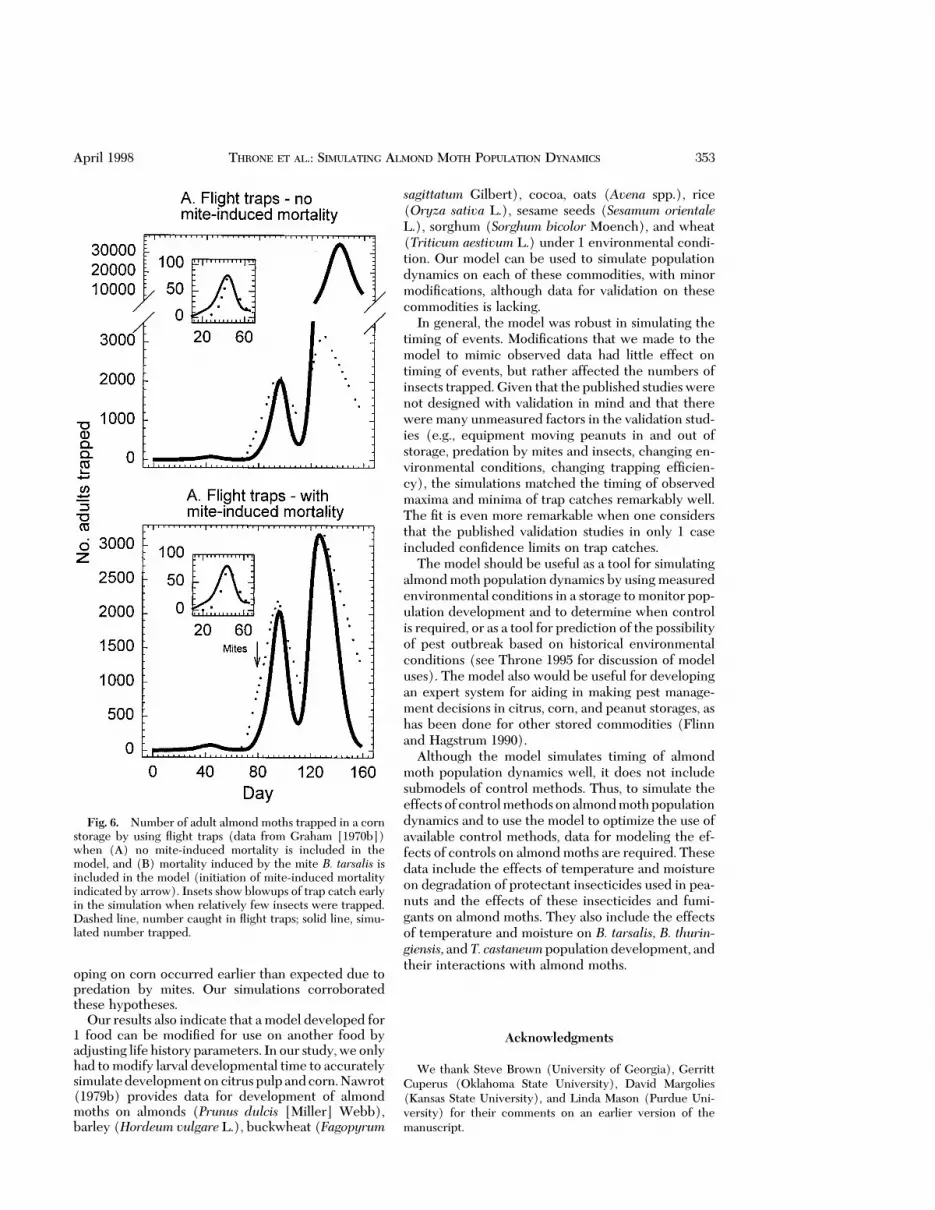
Model Validation on Corn. Simulation of almondmoth population development on corn was accurateuntil the 3rd peak of trap catch when mite-inducedmortality was not included in the simulations (Fig.6A). Timing of the 3rd peak was late in the simulation,and the number of adults trapped was overestimated.Inclusion of mite-induced mortality in the model cor-rected these inaccuracies (Fig. 6B). Graham (1970a)suggested that the timing of the peak catch of the 3rdgeneration was early, due to predation by mites, andour simulation corroborated this hypothesis.
Our model was useful for predicting almond mothpopulation dynamics on several stored commodities.Generally, the timing of events was accurately pre-dicted without modiÞcation to the model, but we hadto include various mortality factors that were appliedor observed in the published studies in the model to
Fig. 4. Number of adult almond moths trapped in a pea-nut storage by using suction traps (data from Hagstrum andStanley [1979]) when (A) no fumigant is applied and nopeanuts are removed from storage; (B) fumigant is applied(timing indicated by arrow) but no peanuts are removedfrom storage; and (C) fumigant is applied (timing indicatedby arrow) and peanuts are removed from storage (start andend of unloading indicated by straight lines).
April 1998 THRONE ET AL.: SIMULATING ALMOND MOTH POPULATION DYNAMICS 351
match the observed numbers of insects trapped.How-ever, the model still has limitations on use because wedid not actually simulate the mechanics of controlstrategies, but rather mimicked the effects of controlstrategies based on observed data. Thus, the modelcannot be used to simulate the effects of control strat-egies other than under the conditions of the particularvalidation studies. Simulation of control strategiesawaits the collection of data describing the effects ofenvironmental conditions on mortality caused by in-secticides, microbes, mites, and red ßour beetles.
This study emphasizes the usefulness of simulationmodels in interpreting ecological studies. Simulationindicated that trap catch in the study byKirkpatrick etal. (1972) couldbe explainedby low temperatures andmalathion application and that only a partial genera-tion of moths had developed during their study be-cause of low temperatures. Hagstrum and Sharp(1975) suggested that almond moth population trendswere inßuenced by diapause and predation. Graham(1970a) hypothesized that the timing of the peakcatch of the 3rd generation of almond moths devel-
Fig. 5. Number of larval almondmoths trapped in a dried citrus pulp storage by using pupation traps (data fromHagstrumand Sharp [1975]) when (A) no larvae enter diapause and no microbial-induced mortality or egg predation are included inthe model; (B) some larvae enter diapause, but no microbial-induced mortality or egg predation are included in the model;(C) some larvae enter diapause and mortality induced by the bacterium B. thuringiensis is included in the model (initiationofmicrobial-inducedmortality indicated by arrow), butwhenno egg predation is included in themodel; and (D) some larvaeenter diapause and mortality induced by B. thuringiensis and egg predation are included in the model (initiation ofmicrobial-induced mortality indicated by arrow; initiation of egg predation indicated by line). Insets show blowups of trapcatch early in the simulation when few insects were trapped.
352 ENVIRONMENTAL ENTOMOLOGY Vol. 27, no. 2
oping on corn occurred earlier than expected due topredation by mites. Our simulations corroboratedthese hypotheses.
Our results also indicate that a model developed for1 food can be modiÞed for use on another food byadjusting life history parameters. In our study,weonlyhad to modify larval developmental time to accuratelysimulatedevelopmentoncitruspulpandcorn.Nawrot(1979b) provides data for development of almondmoths on almonds (Prunus dulcis [Miller] Webb),barley (Hordeum vulgare L.), buckwheat (Fagopyrum
sagittatum Gilbert), cocoa, oats (Avena spp.), rice(Oryza sativa L.), sesame seeds (Sesamum orientaleL.), sorghum (Sorghum bicolor Moench), and wheat(Triticum aestivum L.) under 1 environmental condi-tion. Our model can be used to simulate populationdynamics on each of these commodities, with minormodiÞcations, although data for validation on thesecommodities is lacking.
In general, the model was robust in simulating thetiming of events. ModiÞcations that we made to themodel to mimic observed data had little effect ontiming of events, but rather affected the numbers ofinsects trapped.Given that the published studieswerenot designed with validation in mind and that therewere many unmeasured factors in the validation stud-ies (e.g., equipment moving peanuts in and out ofstorage, predation by mites and insects, changing en-vironmental conditions, changing trapping efÞcien-cy), the simulations matched the timing of observedmaxima and minima of trap catches remarkably well.The Þt is even more remarkable when one considersthat the published validation studies in only 1 caseincluded conÞdence limits on trap catches.
The model should be useful as a tool for simulatingalmond moth population dynamics by using measuredenvironmental conditions in a storage to monitor pop-ulation development and to determine when controlis required, or as a tool for prediction of the possibilityof pest outbreak based on historical environmentalconditions (see Throne 1995 for discussion of modeluses). The model also would be useful for developingan expert system for aiding in making pest manage-ment decisions in citrus, corn, and peanut storages, ashas been done for other stored commodities (Flinnand Hagstrum 1990).
Although the model simulates timing of almondmoth population dynamics well, it does not includesubmodels of control methods. Thus, to simulate theeffectsof controlmethodsonalmondmothpopulationdynamics and to use the model to optimize the use ofavailable control methods, data for modeling the ef-fects of controls on almond moths are required. Thesedata include the effects of temperature and moistureon degradation of protectant insecticides used in pea-nuts and the effects of these insecticides and fumi-gants on almond moths. They also include the effectsof temperature and moisture on B. tarsalis, B. thurin-giensis, andT. castaneumpopulationdevelopment, andtheir interactions with almond moths.
Acknowledgments
We thank Steve Brown (University of Georgia), GerrittCuperus (Oklahoma State University), David Margolies(Kansas State University), and Linda Mason (Purdue Uni-versity) for their comments on an earlier version of themanuscript.
Fig. 6. Number of adult almond moths trapped in a cornstorage by using ßight traps (data from Graham [1970b])when (A) no mite-induced mortality is included in themodel, and (B) mortality induced by the mite B. tarsalis isincluded in the model (initiation of mite-induced mortalityindicated by arrow). Insets show blowups of trap catch earlyin the simulation when relatively few insects were trapped.Dashed line, number caught in ßight traps; solid line, simu-lated number trapped.
April 1998 THRONE ET AL.: SIMULATING ALMOND MOTH POPULATION DYNAMICS 353
References Cited
Amoako-Atta, B., and G. J. Partida. 1976. Sensitivity of al-mond moth pupae to gamma radiation (Lepidoptera:Pyralidae). J. Kans. Entomol. Soc. 49: 133Ð140.
Arbogast, R. T. 1981. Mortality and reproduction of Ephe-stia cautella and Plodia interpunctella exposed as pupae tohigh temperatures. Environ. Entomol. 10: 708Ð711.
Arthur, F. 1989. Pests of stored peanuts: toxicity and per-sistence of chlorpyrifos-methyl. J. Econ. Entomol. 82:660Ð664.
Arthur, F., J. L. Zettler, and W. R. Halliday. 1988. Insecti-cide resistance among populations of almond moth andIndianmeal moth (Lepidoptera: Pyralidae) in stored pea-nuts. J. Econ. Entomol. 81: 1283Ð1287.
de Abreu, J. M., R. N. Williams, and P. A. Rude. 1982. Re-vised bibliography of the almond moth (tropical ware-house moth), Ephestia cautella (Walker) (Lepidoptera:Phycitidae). Trop. Stored Prod. Inf. 44: 15Ð36.
Bowditch, T. G., and J. L. Madden. 1996. Spatial and tem-poral distribution of Ephestia cautella (Walker) (Lepi-doptera: Pyralidae) in a confectionery factory: causalfactors andmanagement implications. J. StoredProd.Res.32: 123Ð130.
Donahaye, E. J., S. Navarro, and M. Rindner. 1995. Lowtemperature as an alternative to fumigation for disinfect-ing dried fruit from three insect species. J. Stored Prod.Res. 31: 63Ð70.
Flinn, P. W., and D. W. Hagstrum. 1990. Stored grain ad-visor: a knowledge-based system for management of in-sect pests of stored grain. AI Appl. Nat. Res. Manage. 4:44Ð52.
Graham, W. M. 1970a. Warehouse ecology studies ofbagged maize in KenyaÐI. The distribution of adult Ephe-stia (Cadra) cautella (Walker) (Lepidoptera, Phyciti-dae). J. Stored Prod. Res. 6: 147Ð155.
1970b. Warehouse ecology studies of bagged maize inKenyaÐII. Ecological observations of an infestation byEphestia (Cadra) cautella (Walker) (Lepidoptera, Phy-citidae). J. Stored Prod. Res. 6: 157Ð167.
Hagstrum, D. W., and P. W. Flinn. 1990. Simulations com-paring insect species differences in response to wheatstorage conditions and management practices. J. Econ.Entomol. 83: 2469Ð2475.
Hagstrum, D. W., and J. E. Sharp. 1975. Population studieson Cadra cautella in a citrus pulp warehouse with par-ticular reference to diapause. J. Econ. Entomol. 68: 11Ð14.
Hagstrum, D. W., and J. M. Stanley. 1979. Release-recap-ture estimates of the population density of Ephestia cau-tella (Walker) in a commercial peanut warehouse. J.Stored Prod. Res. 15: 117Ð122.
Hagstrum, D. W., and J. E. Throne. 1989. Predictability ofstored-wheat insect population trends from life historytraits. Environ. Entomol. 18: 660Ð664.
Keever, D. W., M. A. Mullen, J. W. Press, and R. T. Arbogast.1986. Augmentation of natural enemies for suppressingtwo major insect pests in stored farmers stock peanuts.Environ. Entomol. 15: 767Ð770.
Kirkpatrick, R. L., D. Niffenegger, and D. L. Yancey. 1972.Detecting stored-product moths in a peanut warehouseby using light traps and larval traps. USDAÐARS Market.Res. Rep. 938.
Leesch, J. G., H. B. Gillenwater, and J. O. Woodward. 1974.Methyl bromide fumigation of shelled peanuts in bulkcontainers. J. Econ. Entomol. 67: 769Ð771.
Manetsch, T. J. 1976. Time-varying distributed delays andtheir use in aggregative models of large systems. IEEETrans. Syst. Man Cybern. SMC-6: 547Ð553.
Nawrot, J. 1979a. Effect of temperature and relative humid-ity on population parameters for almond moth (Cadracautella Wlk.) (Lepid. Phycitidae). Prace Nauk. Inst.Ochr. Roslin 21: 41Ð51.
1979b. Population parameters for almond moth (Cadracautella Wlk.) (Lepidoptera: Phycitidae) reared on nat-ural products. Prace Nauk. Inst. Ochr. Roslin 21: 53Ð60.
Prevett, P. F., F. P. Benton, D. R. Hall, R. J. Hodges, andR. dos S. Serodio. 1989. Suppression of mating in Ephe-stia cautella (Walker) (Lepidoptera: Phycitidae) usingmicroencapsulated formulations of synthetic sex phero-mone. J. Stored Prod. Res. 25: 147Ð154.
Rathore, Y. S., A. K. Bhattacharya, and G. C. Sachan. 1980.Use of concept of distance and group constellation forclassifying the susceptibility of sorghumvarieties toEphe-stia cautella (Walker). J. Stored Prod. Res. 16: 39Ð42.
Riley, J. 1957. A survey of the build-up of infestation inbagged cocoa beans in store in western Nigeria. Bull.Entomol. Res. 48: 75Ð78.
Ruesink, W. G. 1976. Status of the systems approach to pestmanagement. Annu. Rev. Entomol. 21: 27Ð44.
Schesser, J. H. 1977. Fumigation of cereal grains and pro-cessed products in transport vehicles with phosphinefrom Detia Ex-Bw. J. Econ. Entomol. 70: 199Ð201.
Storey, C. L. 1975. Mortality of three stored product mothsin atmospheres produced by an exothermic inert atmo-sphere generator. J. Econ. Entomol. 68: 736Ð738.
Subramanyam, B., and D. W. Hagstrum. 1993. Predictingdevelopment times of six stored-product moth species(Lepidoptera: Pyralidae) in relation to temperature, rel-ative humidity, and diet. Eur. J. Entomol. 90: 51Ð64.
Taylor, L. R. 1984. Assessing and interpreting the spatialdistributions of insect populations. Annu. Rev. Entomol.29: 321Ð357.
Throne, J. E. 1989. Effects of noncatastrophic control tech-nologies that alter life history parameters on insect pop-ulation growth: a simulation study. Environ. Entomol. 18:1050Ð1055.
1995. Computer modeling of the population dynamics ofstored-product pests, pp. 169Ð195. In D. S. Jayas, N.D.G.White, and W. E. Muir [eds.], Stored-grain ecosystems.Marcel Dekker, Inc., New York.
Throne, J. E., and L. D. Cline. 1994. Seasonal ßight activityand seasonal abundance of selected stored-product Co-leoptera around grain storages in SouthCarolina. J. Agric.Entomol. 11: 321Ð338.
[USDA] U. S. Department of Agriculture. 1994. Agricul-tural statistics 1994. USDA, National Agricultural Statis-tics Service, Washington, DC.
Vick, K. W., R. W. Mankin, R. R. Cogburn, M. Mullen, J. E.Throne, V. F. Wright, and L. D. Cline. 1990. Review ofpheromone-baited sticky traps for detection of stored-product insects. J. Kans. Entomol. Soc. 63: 526Ð532.
White, N.D.G., R. T. Arbogast, P. G. Fields, R. C. Hillman,S.R.Loschiavo,Bh. Subramanyam, J.E.Throne, andV.F.Wright. 1990. The development and use of pitfall andprobe traps for capturing insects in stored grain. J. Kans.Entomol. Soc. 63: 506Ð525.
Received for publication 24 March 1997; accepted 8December 1997.