***University of Antwerp and North-West University, South Africa****University of Antwerp
*****University of Antwerp and Université Catholique de Louvain******University of Antwerp
In this article, we calculate a market-weighted return index for the largest stocks listed on the BrusselsStock Exchange over the period –, based on a new, unique and high-quality database. We findthat this index captures the most important stylised facts of the value-weighted return of all shares listedon the Brussels Stock Exchange in this period. Our results support the empirical practice of concentratingon just the largest stocks. The indices we construct are based on one of the longest Belgian time seriesavailable. The indices take into account the exact dividends, the timing of the dividend cash flowsand all capital operations. We are therefore able to decompose total returns into capital gain returnsand dividend returns, which is not possible with most historical return series. We show that, to constructa credible return index, it is crucial to fully take into account dividends.
Keywords: stock return indices, Brussels stock exchange, capital gain, dividends
JEL classification: G, G, G
I
When Charles Dow computed the first Dow-Jones Industrial Average Index in ,his goal was to construct an index that could measure changes in market sentiment.His approach was crude by modern standards since he simply took the average ofthe prices of a select number of securities and neglected dividend payments.Nevertheless, this rough measure is still reported in the news headlines on a dailybasis. In a similar vein, nineteenth- and early twentieth-century historians have
1 We acknowledge the constructive suggestions and remarks of two anonymous referees and the editor,Stefano Battilossi. This research would not have been possible without a research grant by the NationalBank of Belgium.
measured stock market trends with a limited number of securities, sometimes withouteven taking the relative importance of companies into account. The concept of amarket portfolio, consisting of a weighted sum of every asset in the market, withweights proportional to their market capitalisation, only gained importance whenequilibrium models such as the Capital Asset Pricing Model were published.Hence, when calculating an index in pre-computer days, no particular attentionwas devoted to weighting schemes (with some notable exceptions, such as inCowles ), nor to the inclusion of dividends. The selected stocks were assumedto represent the economy. One can argue that Dow’s approach merely representsan application of the Pareto principle (also known as the – rule or the law ofthe vital few), which states that, for many events, roughly per cent of the effectsstem from per cent of the causes. The remarkably high correlations often reportedbetween the Dow-Jones Industrial Average Index and broader-based indices such asthe S&P seem to confirm the Pareto principle.In this article, we calculate a market-weighted return index for the largest stocks
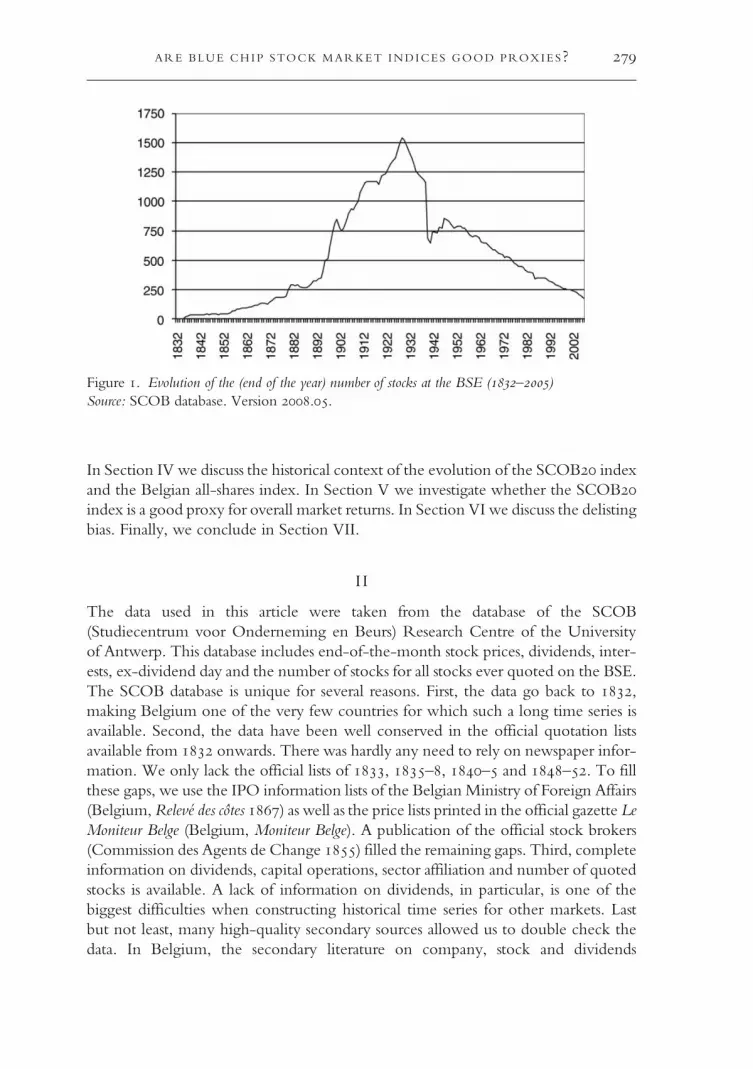
listed on the Brussels Stock Exchange (BSE) over the period –, based on anew, unique and high-quality database. While the importance of the BSE on a worldscale is nowadays negligible, in the past it was among the top ten stock markets of theworld (Neymarck , p. ). The BSE was the most important Belgian stockexchange in the nineteenth and twentieth centuries. It was a very international andopen market, with listed companies from all over the world. This is not surprising,as Belgium was the first country to take part in the Industrial Revolution on theEuropean continent (Bairoch , pp. –). Much foreign capital (largelyFrench and German) flowed to the BSE and was subsequently reinvested abroad(Chlepner ; Maddison ). Before World War I, Belgium was, per capita,among the top foreign direct investors. In the period between the two WorldWars, there were more than companies and more than stocks quoted onthe BSE (see Figure ). Contrary to some other countries where only a few sectorsdeveloped, the Belgian economy was widely diversified with important activitiesranging from railways, tramways, coal mining, steel and glass to banking, telecommu-nications and electricity.We find that a market-weighted return index for the largest stocks, which we
call the SCOB index, captures relatively well the most important stylised facts ofthe value-weighted return of all shares listed on the BSE in this period. Our resultssupport the empirical practice of limiting return indices to just the largest stocks ofan economy. The indices take into account the exact dividends, the timing of thedividend cash flows and all capital operations. We are therefore able to decomposetotal returns into capital gain returns and dividend returns, which is not possiblewith most historical return series. We show that, to construct a credible returnindex, it is crucial to fully take into account dividends. Unfortunately, most countries’historical records do not include precise dividend data for the nineteenth century.The remainder of the article is structured as follows. In Section II we describe our
dataset. In Section III we discuss the methodology used to construct our indices.
JAN ANNAERT ET AL.
In Section IV we discuss the historical context of the evolution of the SCOB indexand the Belgian all-shares index. In Section V we investigate whether the SCOBindex is a good proxy for overall market returns. In Section VI we discuss the delistingbias. Finally, we conclude in Section VII.
I I
The data used in this article were taken from the database of the SCOB(Studiecentrum voor Onderneming en Beurs) Research Centre of the Universityof Antwerp. This database includes end-of-the-month stock prices, dividends, inter-ests, ex-dividend day and the number of stocks for all stocks ever quoted on the BSE.The SCOB database is unique for several reasons. First, the data go back to ,making Belgium one of the very few countries for which such a long time series isavailable. Second, the data have been well conserved in the official quotation listsavailable from onwards. There was hardly any need to rely on newspaper infor-mation. We only lack the official lists of , –, – and –. To fillthese gaps, we use the IPO information lists of the Belgian Ministry of Foreign Affairs(Belgium,Relevé des côtes ) as well as the price lists printed in the official gazette LeMoniteur Belge (Belgium, Moniteur Belge). A publication of the official stock brokers(Commission des Agents de Change ) filled the remaining gaps. Third, completeinformation on dividends, capital operations, sector affiliation and number of quotedstocks is available. A lack of information on dividends, in particular, is one of thebiggest difficulties when constructing historical time series for other markets. Lastbut not least, many high-quality secondary sources allowed us to double check thedata. In Belgium, the secondary literature on company, stock and dividends
Figure . Evolution of the (end of the year) number of stocks at the BSE (–)Source: SCOB database. Version ..
ARE BLUE CHIP STOCK MARKET INDICES GOOD PROXIES?
information is rather abundant and early, occurring in several important publications(Trioen ; Demeur –, –; Courtois –; Van Damme ;Vitu ) in addition to financial newspapers such as Moniteur des Intérêts Matériels(various issues) and Het Handelsblad. The official price lists contain information ondividends from onwards. From , the annual Recueil Financier(–), as well as the monographs by Coppin, provide a wealth of information(Coppin –;Recueil Financier, –). Company information is extractedfrom Frère and Laureyssens (Frère , ; Laureyssens ). For recent decades,information is found in the Memento der Effecten, (internal) Euronext company files(with detailed information on capital operations) and the newspaper Financieel-Economische Tijd (subsequently De Tijd), which has published a detailed survey ofall corporate operations on a monthly basis from until now (Financieel-Economische Tijd; De TIJD; Het Handelsblad; Journal du Commerce d’Anvers; L’Avenir;Memento der Effecten).
I I I
In this section we outline our methodology to construct the SCOB all-shares indexand a narrower (blue chip) SCOB index. After discussing the computational issues,we address some stock selection issues.First, in order to measure the investment performance on the Belgian stock market,
we calculate a Laspeyres market capitalisation–weighted nominal price (capital gainwithout dividends) and a total nominal return (with dividends) index by linkingmonthly returns by the chain method. The index reflects the evolution of thevalue of Belgian Francs (BEF) invested in Belgian-based stocks from the end of on. The indices are constructed as follows:
It ¼ It�1 � 1þXLt�1
i¼1
wi,t�1ri,t
!,
where It is the value of the index at the end of period t, wi,t− is the weight attached tostock i at time t−, Lt− is the number of stocks at the end of month t− and ri,t is theordinary return of stock i, including (excluding) dividends for the total return (price)indices. Dividends are included at the end of the ex-dividend month. We set I equalto at the end of . The weights used are the relative market capitalisations:
wi, t�1 ¼ Pi, t�1Ni, t�1PLt�1
j¼1P j, t�1Nj, t�1
,
where Ni,t− is the number of outstanding shares for stock i at the end of period t−.Of course, adjustments for stock splits and reverse splits, bonus stocks, inscriptionrights and attribution rights are made. We take the geometric average (time-weightedrate of return) as an indicator of the return on investment.
JAN ANNAERT ET AL.
Volatility typically is measured by the standard deviation of returns, which is calcu-lated based on monthly returns in order to capture intra-year volatility. However,when annualising the variance, we adjust for potential autocorrelation ( lags), asthe hypothesis that there is no autocorrelation in the monthly return data is rejectedby the data. The annualised variance is:
s2yearly ¼ 12þ 2�
X11j¼1
(12� j)rj
( )s2monthly,
where rj is the return autocorrelation at lag j.Besides nominal returns, we also compute real returns. The consumer price index
(CPI) is used to deflate the nominal series. For the period beforeWorldWar I, we usedata from Michotte and Van de Velde (Michotte , pp. –; Van de Velde, pp. –). For the period after World War I, we use data from the Ministryof Economics (Belgium, CPI-index –). The biggest problem with respectto estimating inflation is the highly murky price evolution during the two WorldWar periods. We follow the methodology proposed by Van de Velde () forWorld War I by taking the official price index, as this index approximately followedthe real price evolution. ForWorldWar II we compute inflation as aweighted averageof inflation based on the official price index and the index on the black market(National Bank of Belgium , p. , table .). More specifically, we take per cent of the official market rate and per cent of the black market rate.Although somewhat arbitrary, these proportions approximately correspond to whatpeople spent on both markets.Second, we consider stock selection issues. The SCOB database contains various
kinds of stocks (common stock, preferred stock, etc.). We only select commonstocks, and ignore bonds and other instruments with mixed characteristics (Fisherand Lorie , pp. –; , pp. –; ). We also restrict the sample tostocks traded on the spot market. There are several reasons for this. First, stocks thatwere listed on the forward market had to be listed on the spot market, but not viceversa, implying that the spot market had wider coverage. Second, there are no con-tinuous data on the forward market, as it was closed from until due toWorld War II and its aftermath, while spot market data are available for thisperiod. Third, before there was no forward market. Indeed, forward contractswere not officially allowed and were considered a form of gambling (known as excep-tion de jeu). Fourth, between and the forward market was comprised nearlyexclusively of foreign stocks.We only take into account Belgian-based companies, even when they invested
mainly abroad, such as steel producer Société Métallurgique Dniéprovienne duMidi de la Russie (founded in and mainly producing in Russia) and BelgianCongo companies such as Union Minière du Haut Katanga (founded in ).However, no foreign-based companies (‘cross-listings’) are in our sample.
ARE BLUE CHIP STOCK MARKET INDICES GOOD PROXIES?
All data are taken from the SCOB database, which offers end-of-the-month prices,dividends, interests, ex-dividend day and number of stocks from the BSE.Whenever agiven stock does not trade on the last day of a month, the previous price is used. Ingeneral, whenever the default opening price is missing we take either one of the fol-lowing (in order of preference): previous price, bid and ask prices or external prices (asavailable in the Prix Courant published in the LeMoniteur Belge). All stocks ever quotedare available, so selection bias is avoided. We always consider the number of stocksadmitted on the official quotation list. This number can be smaller than the totalnumber of stocks issued.We define the SCOB as an index comprising the common stock of the com-
panies that had the largest market capitalisation on the last day of the previous year.The SCOB therefore does not suffer from survivorship bias, as we select stockswithout any look-ahead knowledge (the same applies to the all-shares index). Asfor the all-shares index, the SCOB index uses market capitalisation weights. Wekeep the composition of the SCOB constant during the year and rebalance atthe end of the year. In the exceptional case that a SCOB company delists, it isonly replaced at the end of December. There was one year in which the twentiethand twenty-first companies had identical market capitalisations; in that case weincluded both of them in the index.
IV
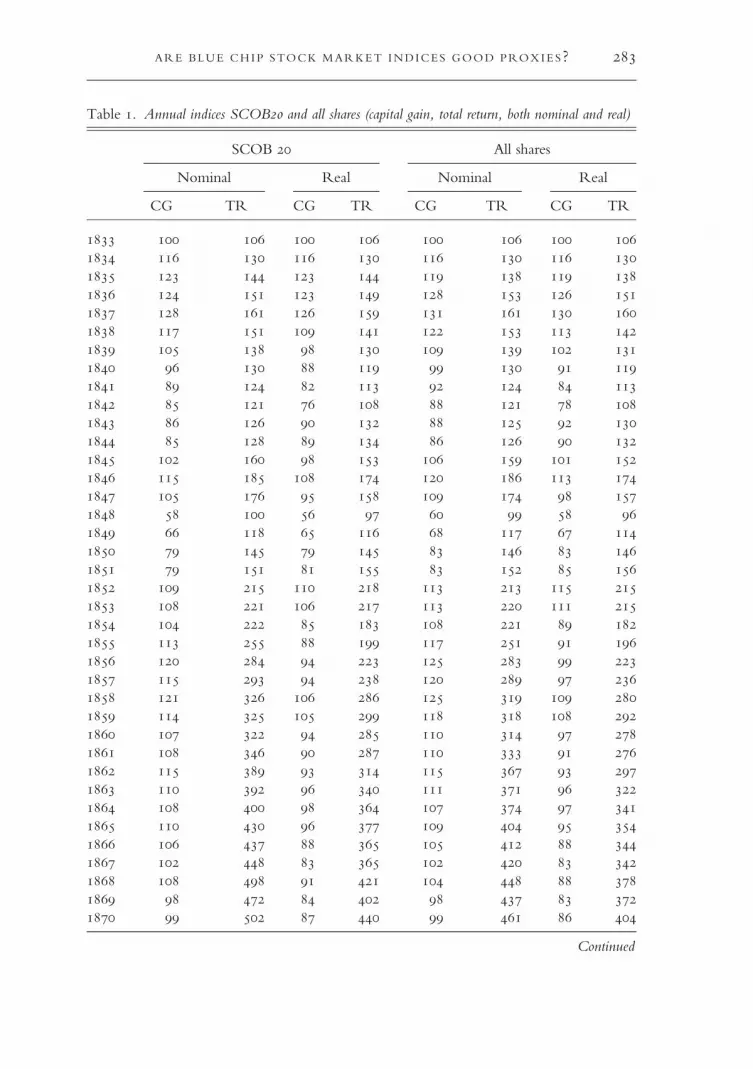
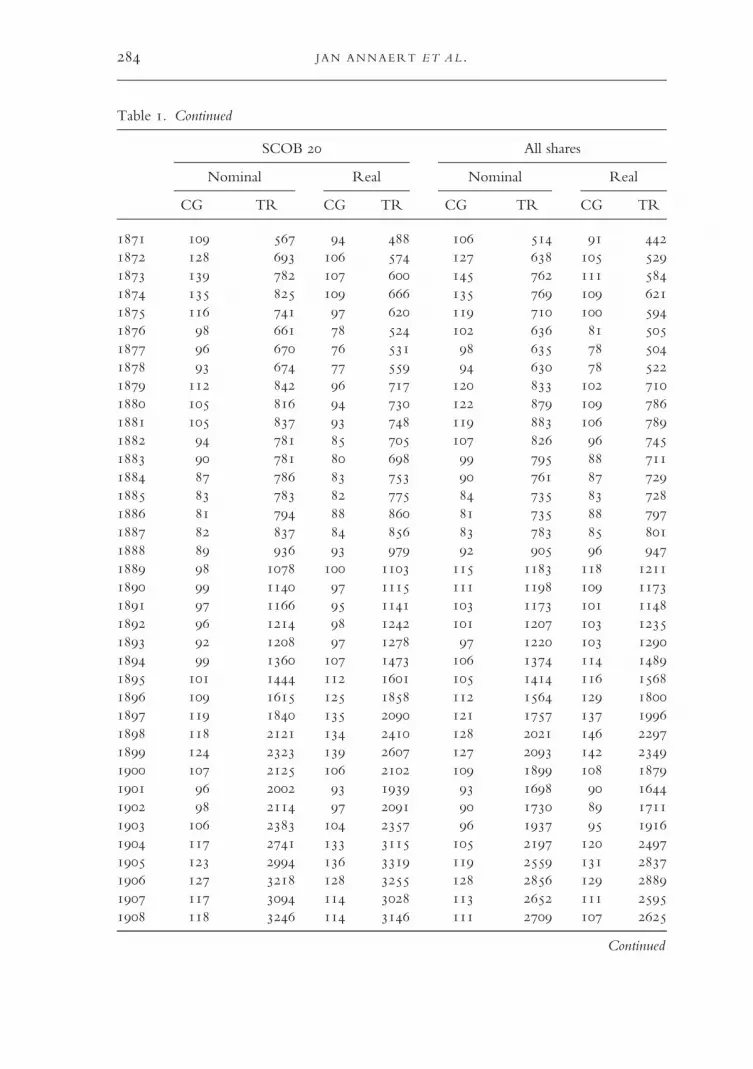
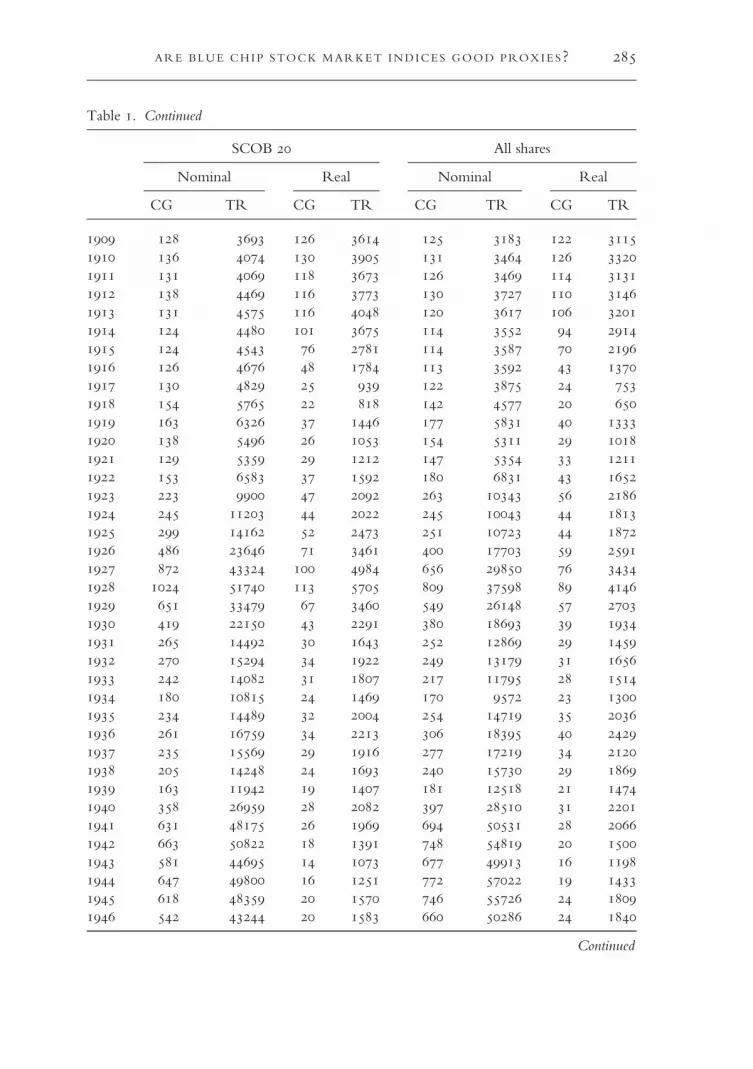
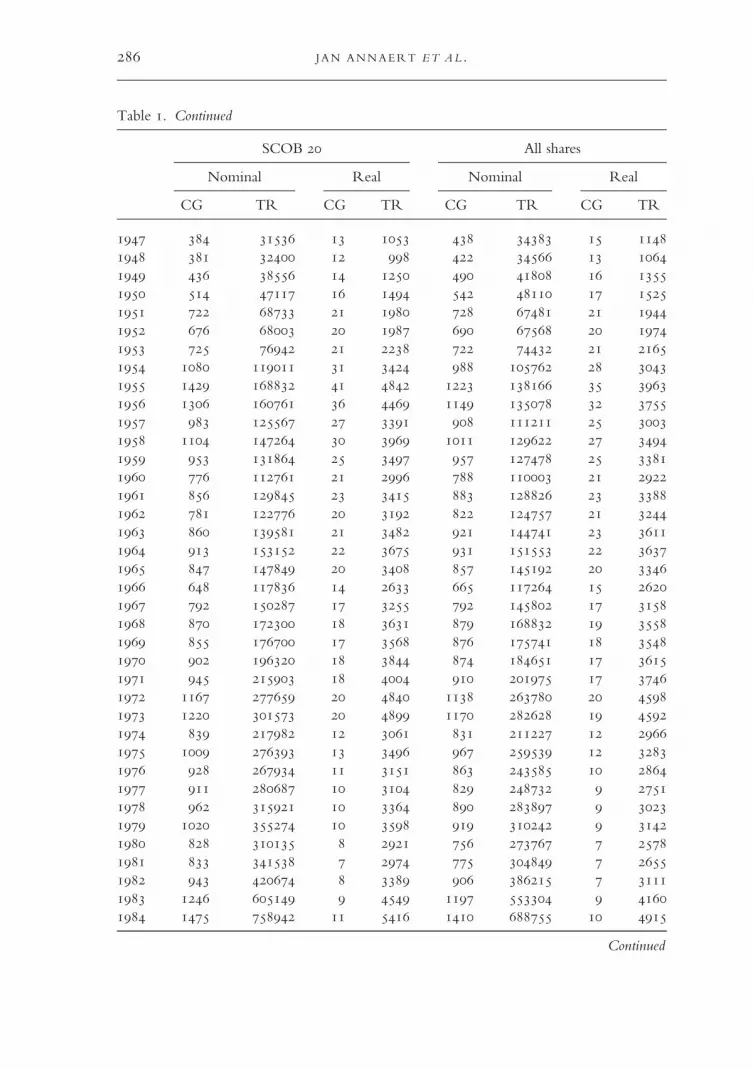
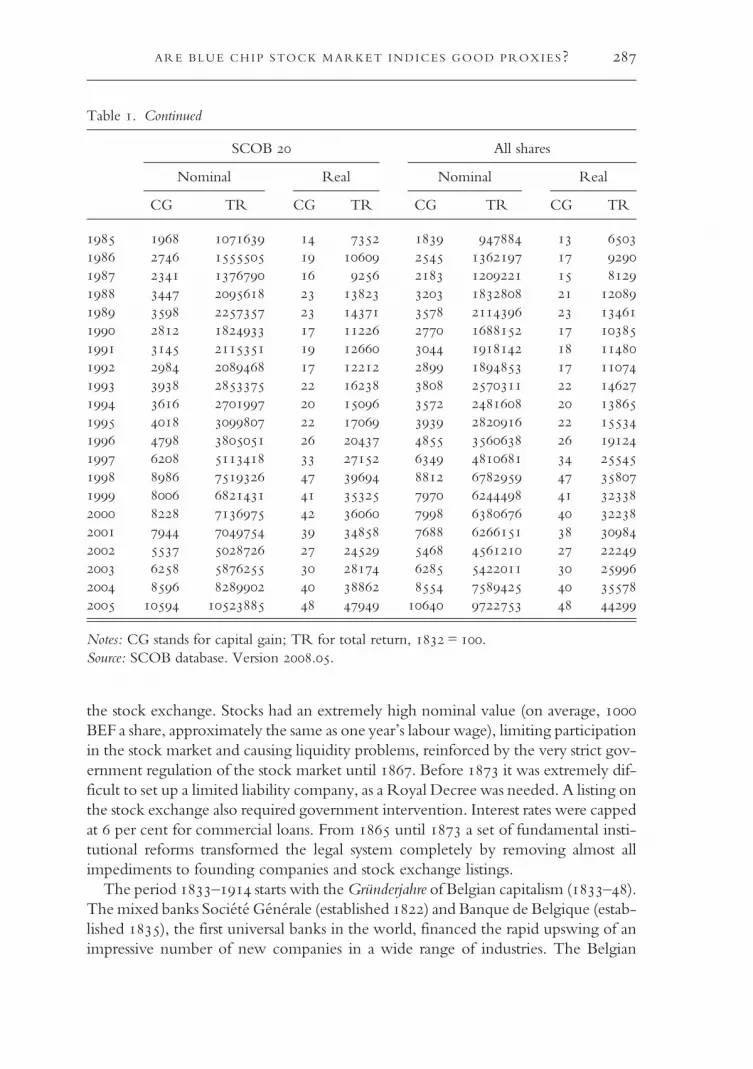
In order to put the realised stock market performance into perspective, in this sectionwe discuss the historical context of the evolution of the SCOB index and theall-shares index (Chlepner ; Van der Wee ; Van de Velde ; Mommen). Yearly nominal and real capital gain and total returns for the SCOB andthe all-shares index are tabulated in Table , while Table reports, for different sub-periods, the geometric average return and volatility for the all-shares return index andthe SCOB index, as well as the CPI. Furthermore, Figures , and show yearlytotal returns and the total real return all-shares index for the periods –,– and –, respectively. At the end of this section, we also discuss themarket constituents of our stock exchange indices. As the performance of the BSEwas, to a large extent, driven by some dominant sectors, a breakdown of the marketconstituents into sectors can help one to understand the evolution of the indices con-sidered in this study.First, we discuss the period –, which was characterised by moderate
inflation and sometimes even deflation; and a rather stable currency: compared tothe period after World War I, the BEF had the same purchasing power in asin . Furthermore, in this period there were no dividend taxes and almost nocompany taxes. It was also a period of ‘capitalism for the few’, with huge disparitiesin income and wealth, extremely low wages, hardly any social protection for theworking class and, on the political side, restricted voting rights for the vast majorityof the population (although more so in the early years). This had consequences for
JAN ANNAERT ET AL.
Table . Annual indices SCOB and all shares (capital gain, total return, both nominal and real)
SCOB All shares
Nominal Real Nominal Real
CG TR CG TR CG TR CG TR
Continued
ARE BLUE CHIP STOCK MARKET INDICES GOOD PROXIES?
Table . Continued
SCOB All shares
Nominal Real Nominal Real
CG TR CG TR CG TR CG TR
Continued
J AN ANNAERT ET AL.
Table . Continued
SCOB All shares
Nominal Real Nominal Real
CG TR CG TR CG TR CG TR
Continued
ARE BLUE CHIP STOCK MARKET INDICES GOOD PROXIES?
Table . Continued
SCOB All shares
Nominal Real Nominal Real
CG TR CG TR CG TR CG TR
Continued
J AN ANNAERT ET AL.
the stock exchange. Stocks had an extremely high nominal value (on average, BEF a share, approximately the same as one year’s labour wage), limiting participationin the stock market and causing liquidity problems, reinforced by the very strict gov-ernment regulation of the stock market until . Before it was extremely dif-ficult to set up a limited liability company, as a Royal Decree was needed. A listing onthe stock exchange also required government intervention. Interest rates were cappedat per cent for commercial loans. From until a set of fundamental insti-tutional reforms transformed the legal system completely by removing almost allimpediments to founding companies and stock exchange listings.The period – starts with theGründerjahre of Belgian capitalism (–).
The mixed banks Société Générale (established ) and Banque de Belgique (estab-lished ), the first universal banks in the world, financed the rapid upswing of animpressive number of new companies in a wide range of industries. The Belgian
Table . Continued
SCOB All shares
Nominal Real Nominal Real
CG TR CG TR CG TR CG TR
Notes: CG stands for capital gain; TR for total return, = .Source: SCOB database. Version ..
ARE BLUE CHIP STOCK MARKET INDICES GOOD PROXIES?
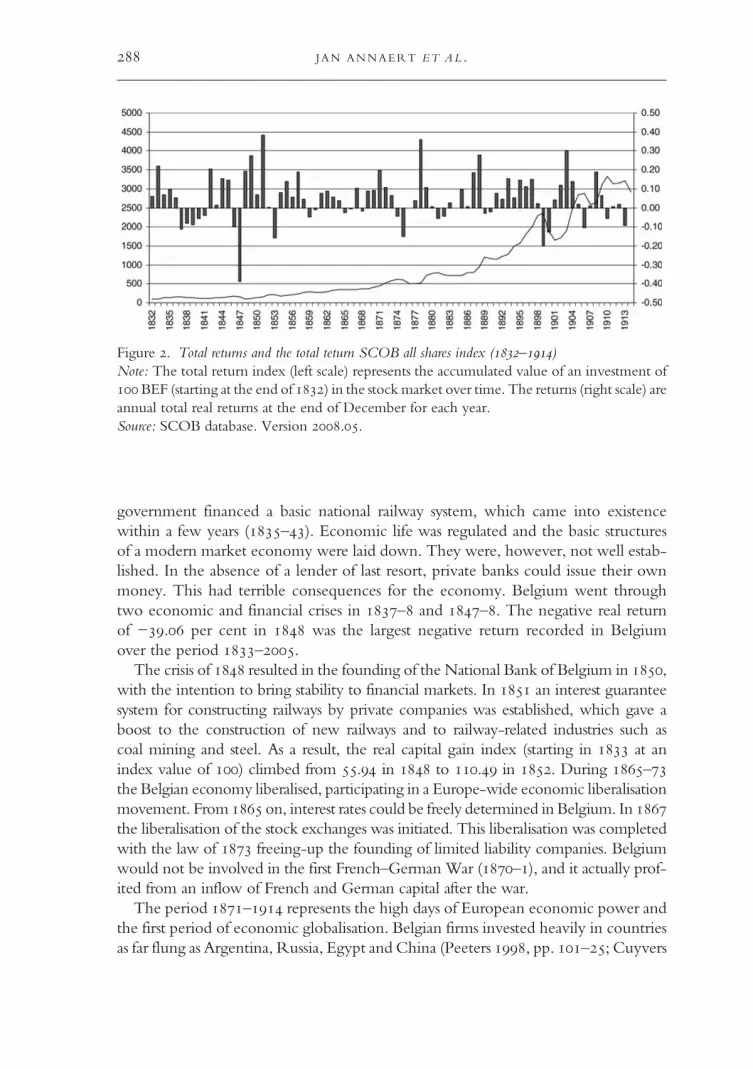
government financed a basic national railway system, which came into existencewithin a few years (–). Economic life was regulated and the basic structuresof a modern market economy were laid down. They were, however, not well estab-lished. In the absence of a lender of last resort, private banks could issue their ownmoney. This had terrible consequences for the economy. Belgium went throughtwo economic and financial crises in – and –. The negative real returnof −. per cent in was the largest negative return recorded in Belgiumover the period –.The crisis of resulted in the founding of the National Bank of Belgium in ,
with the intention to bring stability to financial markets. In an interest guaranteesystem for constructing railways by private companies was established, which gave aboost to the construction of new railways and to railway-related industries such ascoal mining and steel. As a result, the real capital gain index (starting in at anindex value of ) climbed from . in to . in . During –the Belgian economy liberalised, participating in a Europe-wide economic liberalisationmovement. From on, interest rates could be freely determined in Belgium. In the liberalisation of the stock exchanges was initiated. This liberalisation was completedwith the law of freeing-up the founding of limited liability companies. Belgiumwould not be involved in the first French–German War (–), and it actually prof-ited from an inflow of French and German capital after the war.The period – represents the high days of European economic power and
the first period of economic globalisation. Belgian firms invested heavily in countriesas far flung as Argentina, Russia, Egypt and China (Peeters , pp. –; Cuyvers
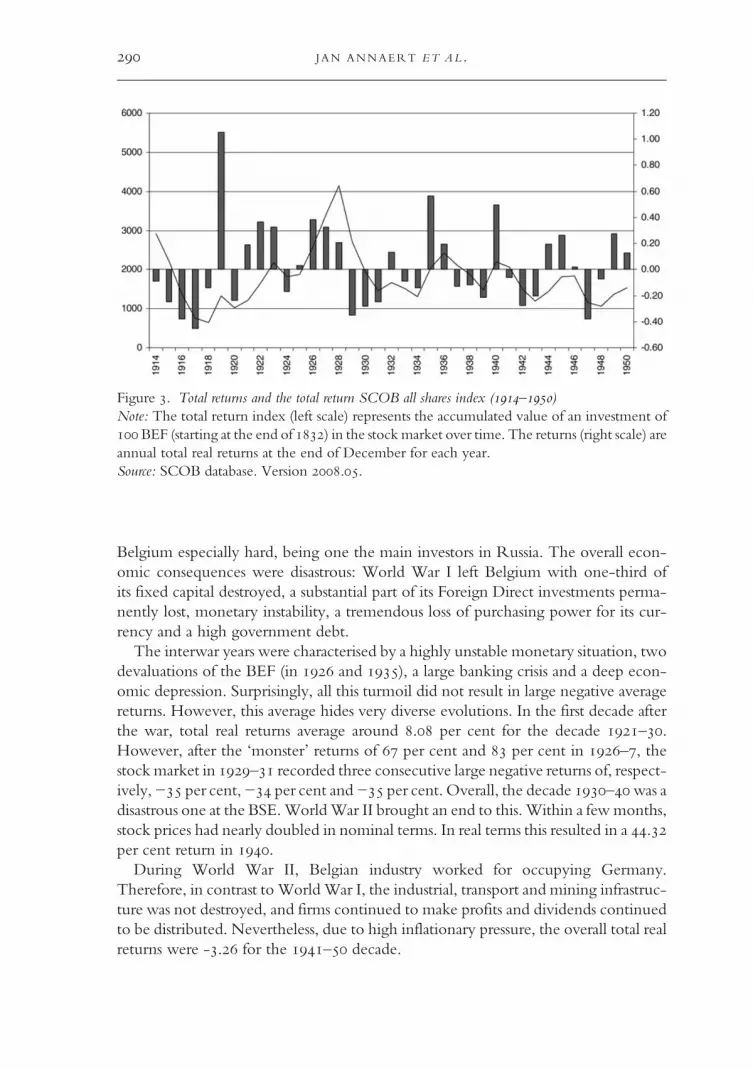
Figure . Total returns and the total teturn SCOB all shares index (–)Note: The total return index (left scale) represents the accumulated value of an investment ofBEF (starting at the end of ) in the stockmarket over time. The returns (right scale) areannual total real returns at the end of December for each year.Source: SCOB database. Version ..
JAN ANNAERT ET AL.
and Van Bets , pp. –). Belgium also colonised the Congo. From the crisisof until the outbreak of World War I, Belgian shareholders were spared fromlarge negative returns. Total real returns climbed as high as . per cent for thedecade – and . per cent for the decade –.World War I would put an end to economic globalisation, to monetary stability
and to relatively peaceful European relations. At the same time it would bring demo-cratisation of the Belgian political system and improve the miserable conditions of theworking class. During World War I, Germany occupied Belgium and exploited theBelgian economy on a tremendous scale. Many firms were completely destroyed,machinery was deported and a lot of money was issued to finance the German warefforts (de Kerckhove de Denterghem ). Moreover, the Russian Revolutionof made Foreign Direct investments in that country worthless, which hit
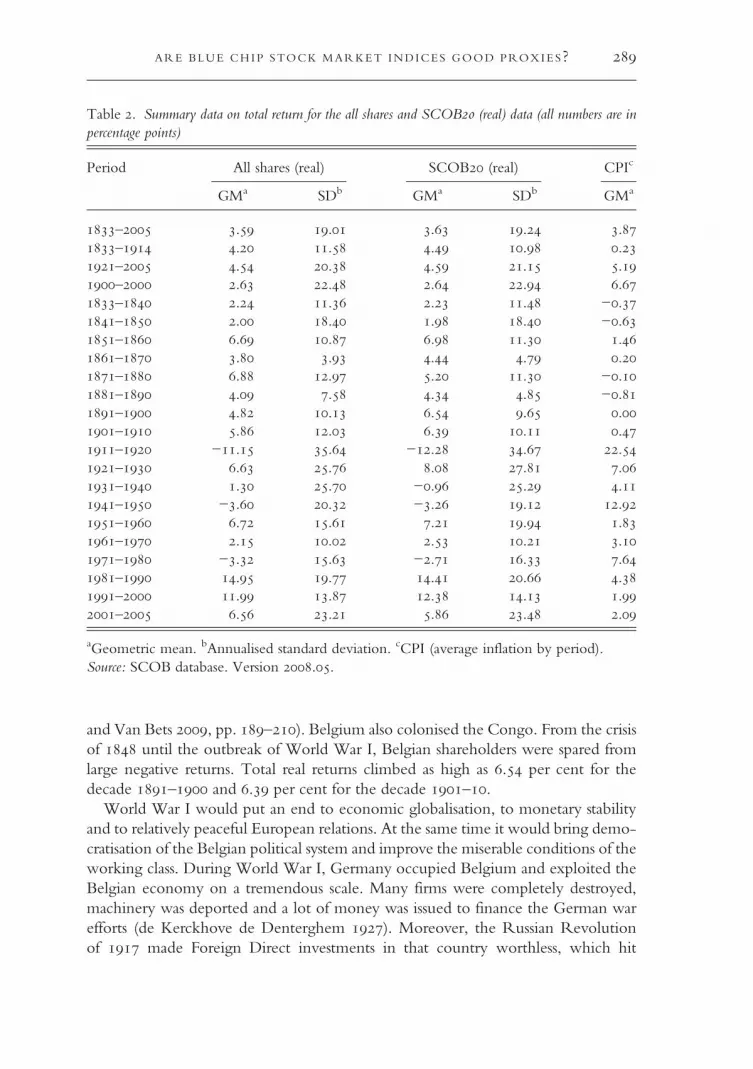
Table . Summary data on total return for the all shares and SCOB (real) data (all numbers are inpercentage points)
aGeometric mean. bAnnualised standard deviation. cCPI (average inflation by period).Source: SCOB database. Version ..
ARE BLUE CHIP STOCK MARKET INDICES GOOD PROXIES?
Belgium especially hard, being one the main investors in Russia. The overall econ-omic consequences were disastrous: World War I left Belgium with one-third ofits fixed capital destroyed, a substantial part of its Foreign Direct investments perma-nently lost, monetary instability, a tremendous loss of purchasing power for its cur-rency and a high government debt.The interwar years were characterised by a highly unstable monetary situation, two
devaluations of the BEF (in and ), a large banking crisis and a deep econ-omic depression. Surprisingly, all this turmoil did not result in large negative averagereturns. However, this average hides very diverse evolutions. In the first decade afterthe war, total real returns average around . per cent for the decade –.However, after the ‘monster’ returns of per cent and per cent in –, thestockmarket in – recorded three consecutive large negative returns of, respect-ively,− per cent,− per cent and− per cent. Overall, the decade –was adisastrous one at the BSE.WorldWar II brought an end to this. Within a fewmonths,stock prices had nearly doubled in nominal terms. In real terms this resulted in a .per cent return in .During World War II, Belgian industry worked for occupying Germany.
Therefore, in contrast toWorldWar I, the industrial, transport and mining infrastruc-ture was not destroyed, and firms continued to make profits and dividends continuedto be distributed. Nevertheless, due to high inflationary pressure, the overall total realreturns were -. for the – decade.
Figure . Total returns and the total return SCOB all shares index (–)Note: The total return index (left scale) represents the accumulated value of an investment ofBEF (starting at the end of ) in the stockmarket over time. The returns (right scale) areannual total real returns at the end of December for each year.Source: SCOB database. Version ..
JAN ANNAERT ET AL.
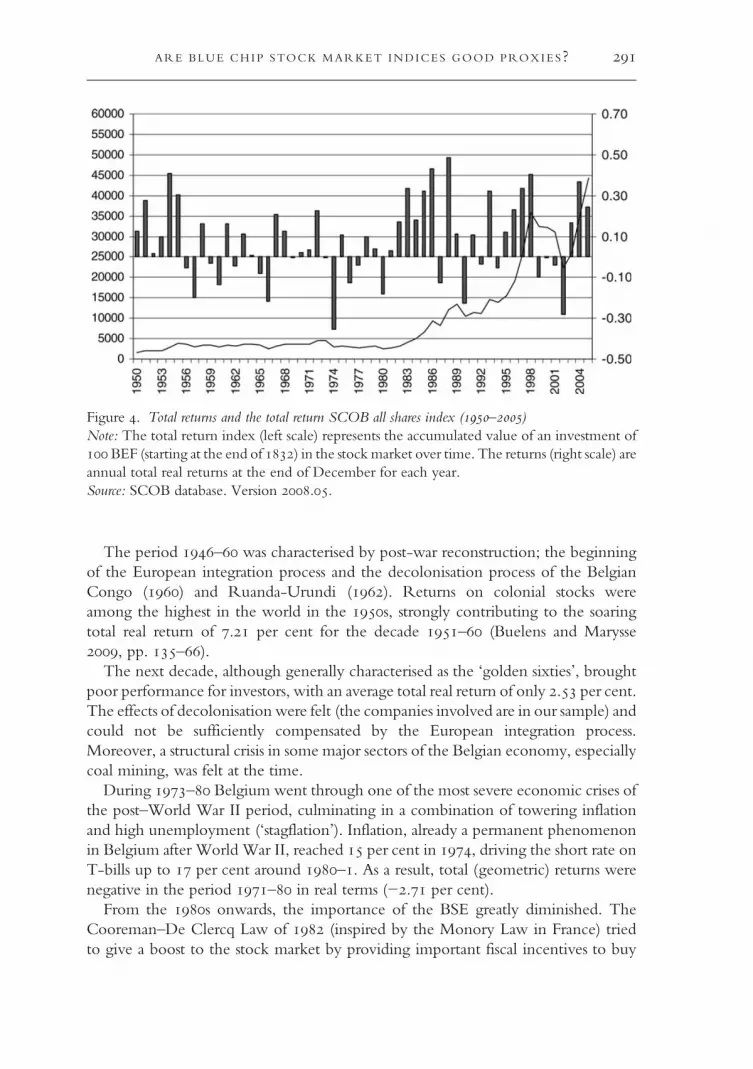
The period – was characterised by post-war reconstruction; the beginningof the European integration process and the decolonisation process of the BelgianCongo () and Ruanda-Urundi (). Returns on colonial stocks wereamong the highest in the world in the s, strongly contributing to the soaringtotal real return of . per cent for the decade – (Buelens and Marysse, pp. –).The next decade, although generally characterised as the ‘golden sixties’, brought
poor performance for investors, with an average total real return of only . per cent.The effects of decolonisation were felt (the companies involved are in our sample) andcould not be sufficiently compensated by the European integration process.Moreover, a structural crisis in some major sectors of the Belgian economy, especiallycoal mining, was felt at the time.During – Belgium went through one of the most severe economic crises of
the post–World War II period, culminating in a combination of towering inflationand high unemployment (‘stagflation’). Inflation, already a permanent phenomenonin Belgium after World War II, reached per cent in , driving the short rate onT-bills up to per cent around –. As a result, total (geometric) returns werenegative in the period – in real terms (−. per cent).From the s onwards, the importance of the BSE greatly diminished. The
Cooreman–De Clercq Law of (inspired by the Monory Law in France) triedto give a boost to the stock market by providing important fiscal incentives to buy
Figure . Total returns and the total return SCOB all shares index (–)Note: The total return index (left scale) represents the accumulated value of an investment ofBEF (starting at the end of ) in the stockmarket over time. The returns (right scale) areannual total real returns at the end of December for each year.Source: SCOB database. Version ..
ARE BLUE CHIP STOCK MARKET INDICES GOOD PROXIES?
stocks. Similar to other countries, the next decades lead to impressive equity returns:. per cent (–) and . per cent (–). But this bull market couldnot hide that the composition of the BSE was rapidly changing: fewer stocks werelisted; fewer Belgian companies survived; and a few sectors, such as financials, cameto dominate the listings. During the s, far-reaching technological and insti-tutional changes took place at the BSE.Various sectors have dominated the BSE throughout its history. We select the most
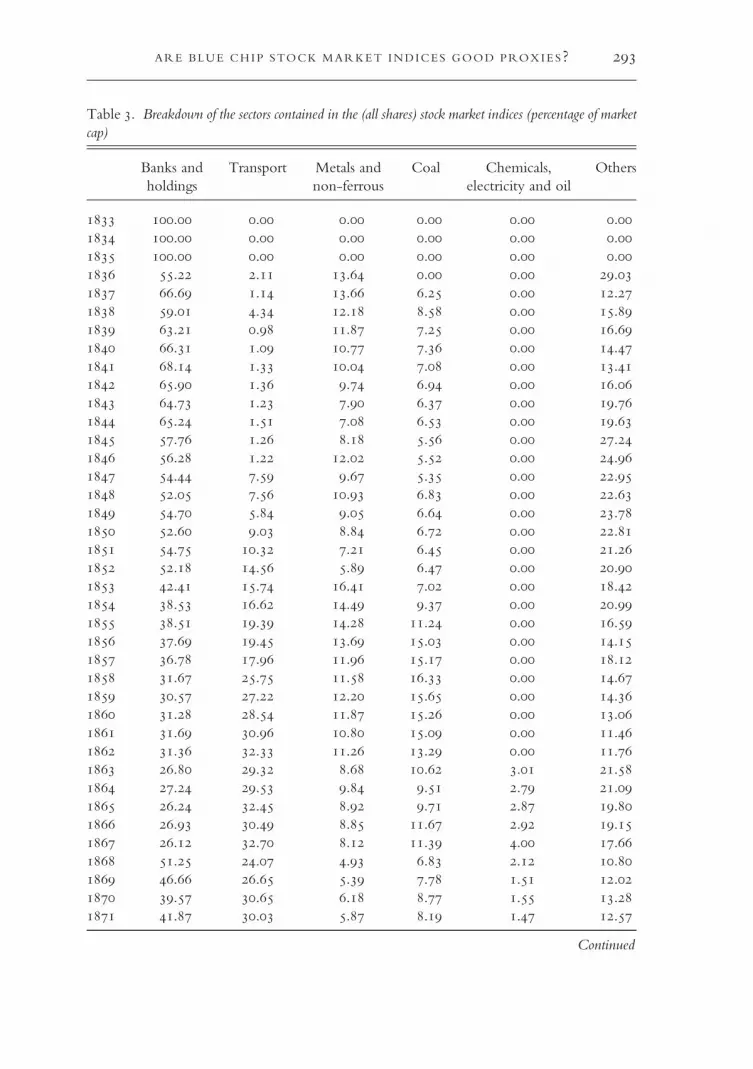
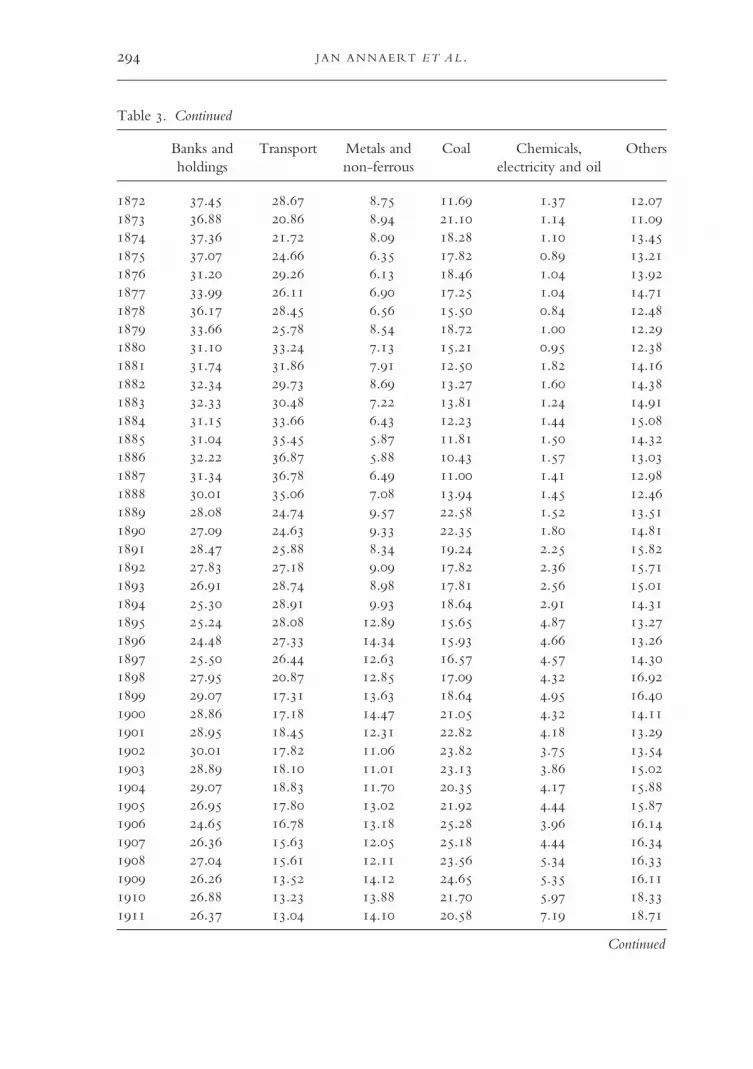
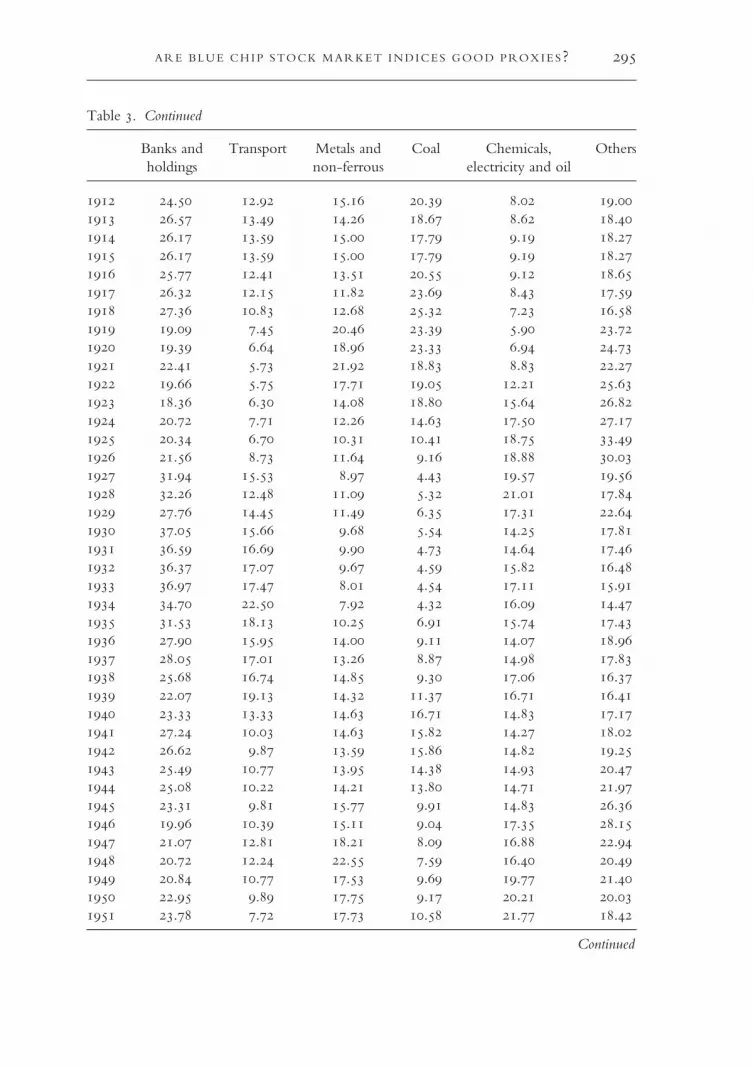
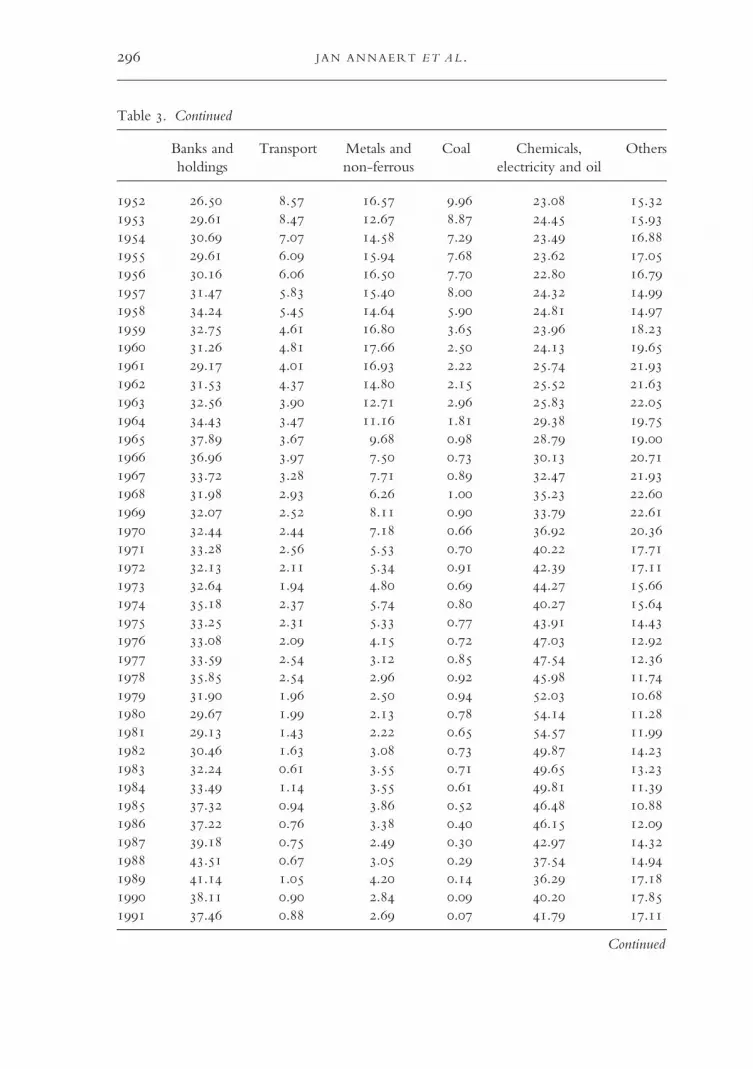
important ones: the financial sector (banks and holding companies); transport (rail-ways and tramways); steel and non-ferrous metal; coal mining; and the sector chemi-cals, oil and electricity. The ‘other’ category is rather diversified, including companiesfrom the following industries: glass, food, breweries, land companies, water, as well asmany others. Table reports the relative importance of these sectors in each year ofthe period –.The financial sector clearly dominated the BSE in the beginning, as the two uni-
versal banks, Société Générale and Banque de Belgique, were of paramount impor-tance to the Belgian economy. Their market share diminished gradually as thetransport sector grew in importance. In transport accounted for . percent of total market cap, compared to . per cent for banks. As in many othercountries, private railway was the most important non-financial industry on theBSE during the nineteenth century. Coal mining companies were also very impor-tant. In the nineteenth century, Belgium was one of Europe’s biggest coal producers.And coal mining became the most important non-financial industry after World WarI, with . per cent of market cap in . However, it was to soon decline to only. per cent by . In the meantime, chemicals, oil and electricity had taken overthe leading position of the non-financial sector, with . per cent of market cap in. It would come to dominate the BSE after WorldWar II, with . per cent ofmarket cap in . From then on, the financial sector made a fast climb, primarilydue to the transformation of many companies into holding companies, but alsodue to the increasing importance of several giant banks (e.g. Fortis and Dexia).Their share of market cap was . per cent in , while chemicals, oil and elec-tricity was second with . per cent.
V
The number of data inputs needed to compute our SCOB is only a fraction of thefull SCOB database. The question remains, however, whether researchers wouldinfer economically and statistically different conclusions when taking a SCOB-like index to proxy for market performance (Le Bris and Hautcoeur , pp.–). Evidently, as the SCOB dataset is composed of a fixed number of compa-nies, it represents a time varying percentage of total market cap (see Figure ).2
2 The composition of the SCOB, company by company, can be consulted at the SCOB website(www.scob.be).
JAN ANNAERT ET AL.
Table . Breakdown of the sectors contained in the (all shares) stock market indices (percentage of marketcap)
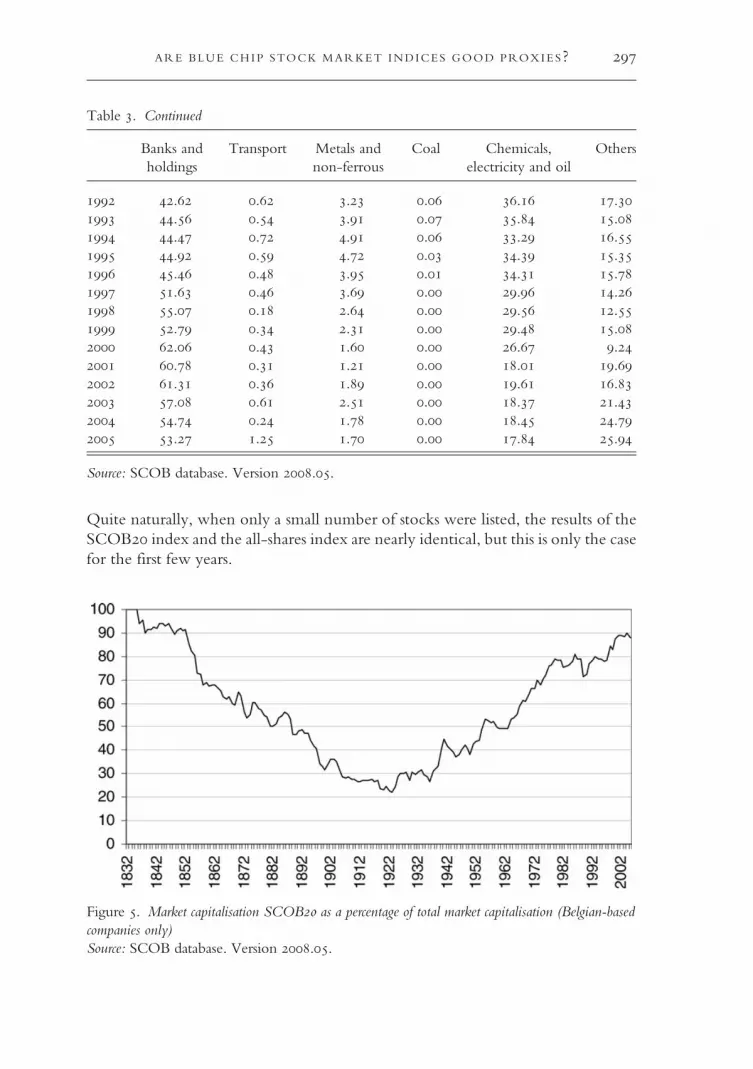
Quite naturally, when only a small number of stocks were listed, the results of theSCOB index and the all-shares index are nearly identical, but this is only the casefor the first few years.
Figure . Market capitalisation SCOB as a percentage of total market capitalisation (Belgian-basedcompanies only)Source: SCOB database. Version ..
ARE BLUE CHIP STOCK MARKET INDICES GOOD PROXIES?
As can be seen in Figure , the evolution of market capitalisation of the SCOB isin line with the number of stocks quoted. In the early days the SCOB included theentire market, but very soon more stocks appeared, resulting in an ever-decreasingshare of the SCOB in total market capitalisation, reaching its lowest level in theearly s. During the s the number of stocks increased even further, but impor-tant merger and acquisition activity took place, resulting in an increasing share of theSCOB (Kurgan-Van Hentenryk , pp. –). After World War II thedecreasing number of Belgian-based firms on the BSE brought an ever-increasingmarket share of the SCOB in the total market capitalisation.Of course, by selecting only stocks out of the investment universe, we are likely
to poorly mimic the industrial composition of the total market with only
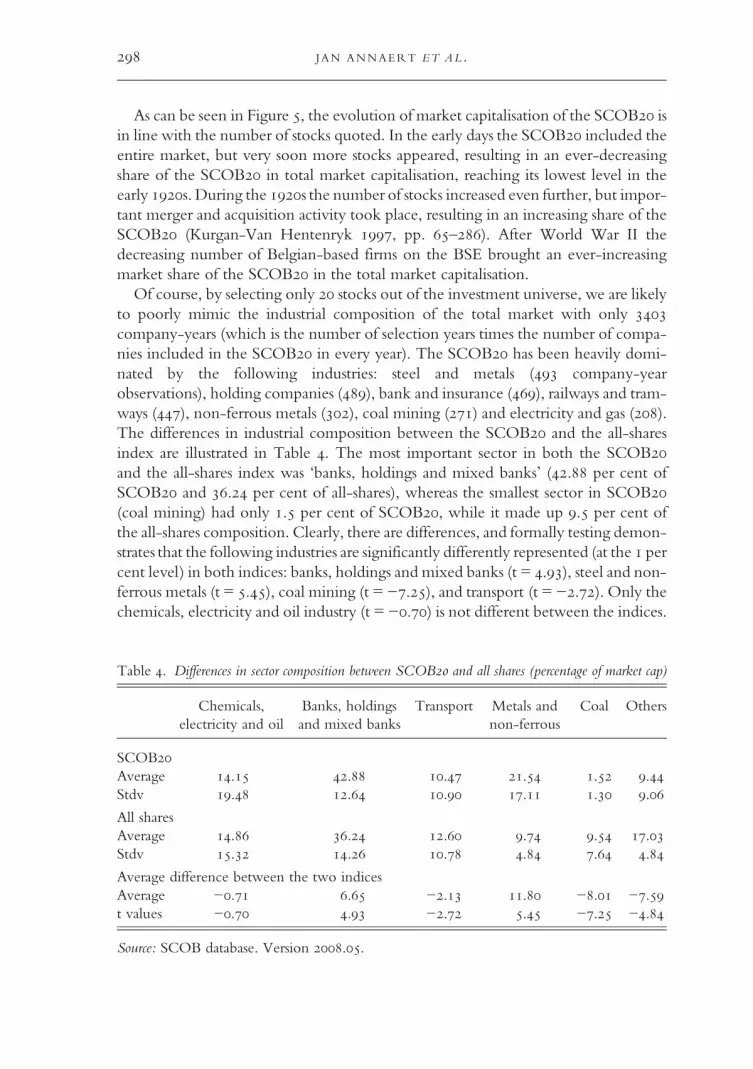
company-years (which is the number of selection years times the number of compa-nies included in the SCOB in every year). The SCOB has been heavily domi-nated by the following industries: steel and metals ( company-yearobservations), holding companies (), bank and insurance (), railways and tram-ways (), non-ferrous metals (), coal mining () and electricity and gas ().The differences in industrial composition between the SCOB and the all-sharesindex are illustrated in Table . The most important sector in both the SCOBand the all-shares index was ‘banks, holdings and mixed banks’ (. per cent ofSCOB and . per cent of all-shares), whereas the smallest sector in SCOB(coal mining) had only . per cent of SCOB, while it made up . per cent ofthe all-shares composition. Clearly, there are differences, and formally testing demon-strates that the following industries are significantly differently represented (at the percent level) in both indices: banks, holdings and mixed banks (t = .), steel and non-ferrous metals (t = .), coal mining (t = −.), and transport (t = −.). Only thechemicals, electricity and oil industry (t = −.) is not different between the indices.
Table . Differences in sector composition between SCOB and all shares (percentage of market cap)
Chemicals,electricity and oil
Banks, holdingsand mixed banks
Transport Metals andnon-ferrous
Coal Others
SCOBAverage . . . . . .Stdv . . . . . .
All sharesAverage . . . . . .Stdv . . . . . .
Average difference between the two indicesAverage −. . −. . −. −.t values −. . −. . −. −.
Source: SCOB database. Version ..
JAN ANNAERT ET AL.
However, since asset pricing does not recognise industries as significant priced factors,we still might be able to ignore these differences and compute risk and returnmeasures on the limited index to proxy for the market.Since we cover a period of over a century, with numerous upswings and down-
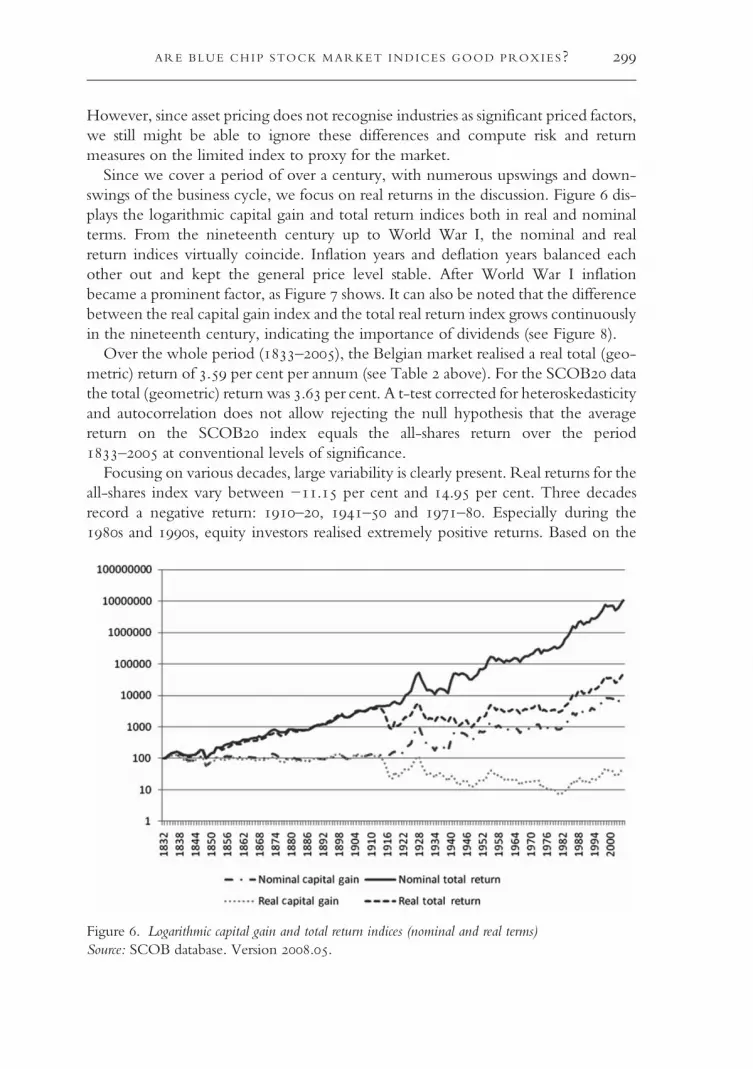
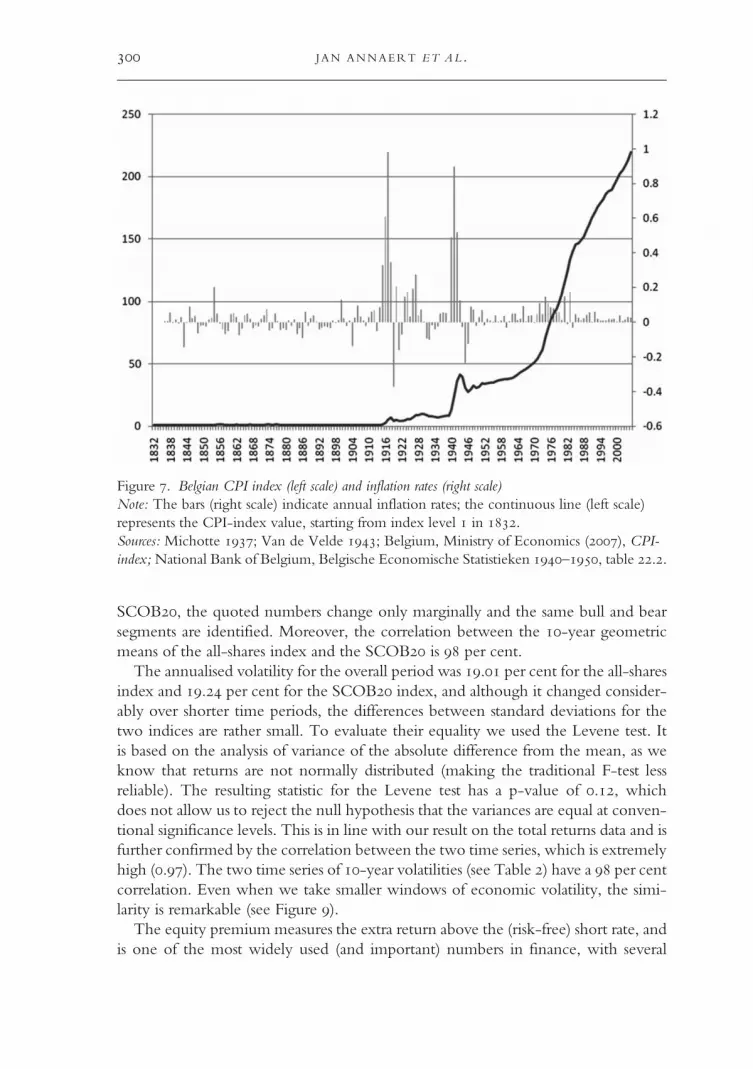
swings of the business cycle, we focus on real returns in the discussion. Figure dis-plays the logarithmic capital gain and total return indices both in real and nominalterms. From the nineteenth century up to World War I, the nominal and realreturn indices virtually coincide. Inflation years and deflation years balanced eachother out and kept the general price level stable. After World War I inflationbecame a prominent factor, as Figure shows. It can also be noted that the differencebetween the real capital gain index and the total real return index grows continuouslyin the nineteenth century, indicating the importance of dividends (see Figure ).Over the whole period (–), the Belgian market realised a real total (geo-
metric) return of . per cent per annum (see Table above). For the SCOB datathe total (geometric) return was . per cent. A t-test corrected for heteroskedasticityand autocorrelation does not allow rejecting the null hypothesis that the averagereturn on the SCOB index equals the all-shares return over the period– at conventional levels of significance.Focusing on various decades, large variability is clearly present. Real returns for the
all-shares index vary between −. per cent and . per cent. Three decadesrecord a negative return: –, – and –. Especially during thes and s, equity investors realised extremely positive returns. Based on the
Figure . Logarithmic capital gain and total return indices (nominal and real terms)Source: SCOB database. Version ..
ARE BLUE CHIP STOCK MARKET INDICES GOOD PROXIES?
SCOB, the quoted numbers change only marginally and the same bull and bearsegments are identified. Moreover, the correlation between the -year geometricmeans of the all-shares index and the SCOB is per cent.The annualised volatility for the overall period was . per cent for the all-shares
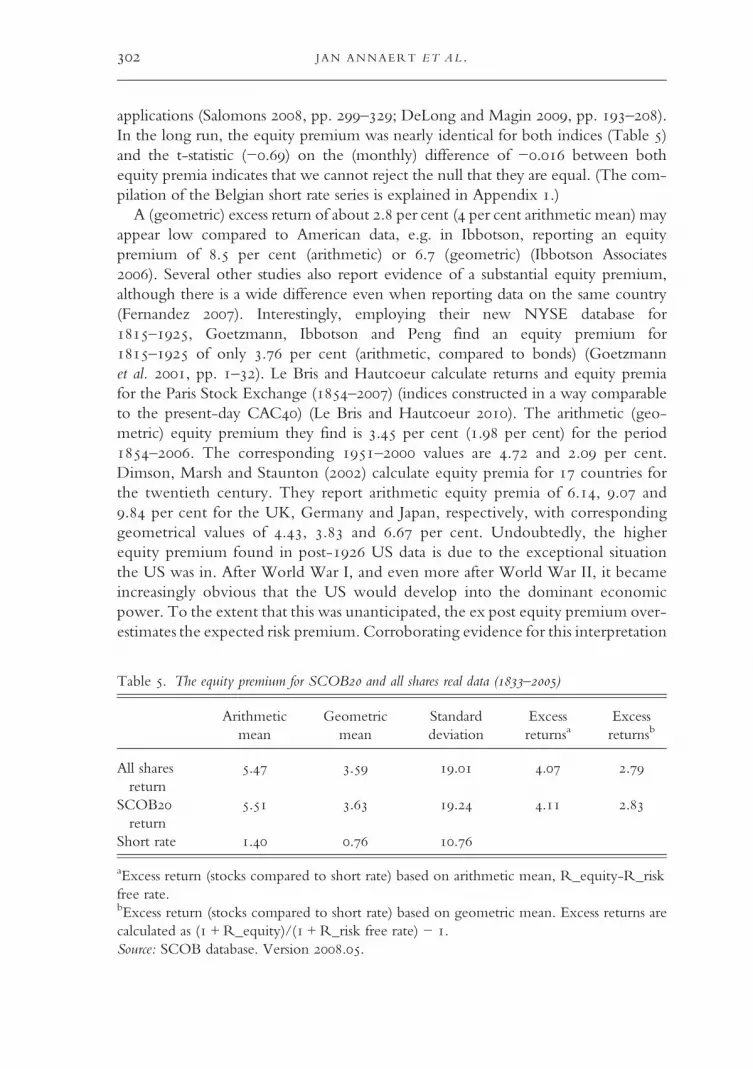
index and . per cent for the SCOB index, and although it changed consider-ably over shorter time periods, the differences between standard deviations for thetwo indices are rather small. To evaluate their equality we used the Levene test. Itis based on the analysis of variance of the absolute difference from the mean, as weknow that returns are not normally distributed (making the traditional F-test lessreliable). The resulting statistic for the Levene test has a p-value of ., whichdoes not allow us to reject the null hypothesis that the variances are equal at conven-tional significance levels. This is in line with our result on the total returns data and isfurther confirmed by the correlation between the two time series, which is extremelyhigh (.). The two time series of -year volatilities (see Table ) have a per centcorrelation. Even when we take smaller windows of economic volatility, the simi-larity is remarkable (see Figure ).The equity premium measures the extra return above the (risk-free) short rate, and
is one of the most widely used (and important) numbers in finance, with several
Figure . Belgian CPI index (left scale) and inflation rates (right scale)Note: The bars (right scale) indicate annual inflation rates; the continuous line (left scale)represents the CPI-index value, starting from index level in .Sources: Michotte ; Van de Velde ; Belgium, Ministry of Economics (), CPI-index;National Bank of Belgium, Belgische Economische Statistieken –, table ..
JAN ANNAERT ET AL.
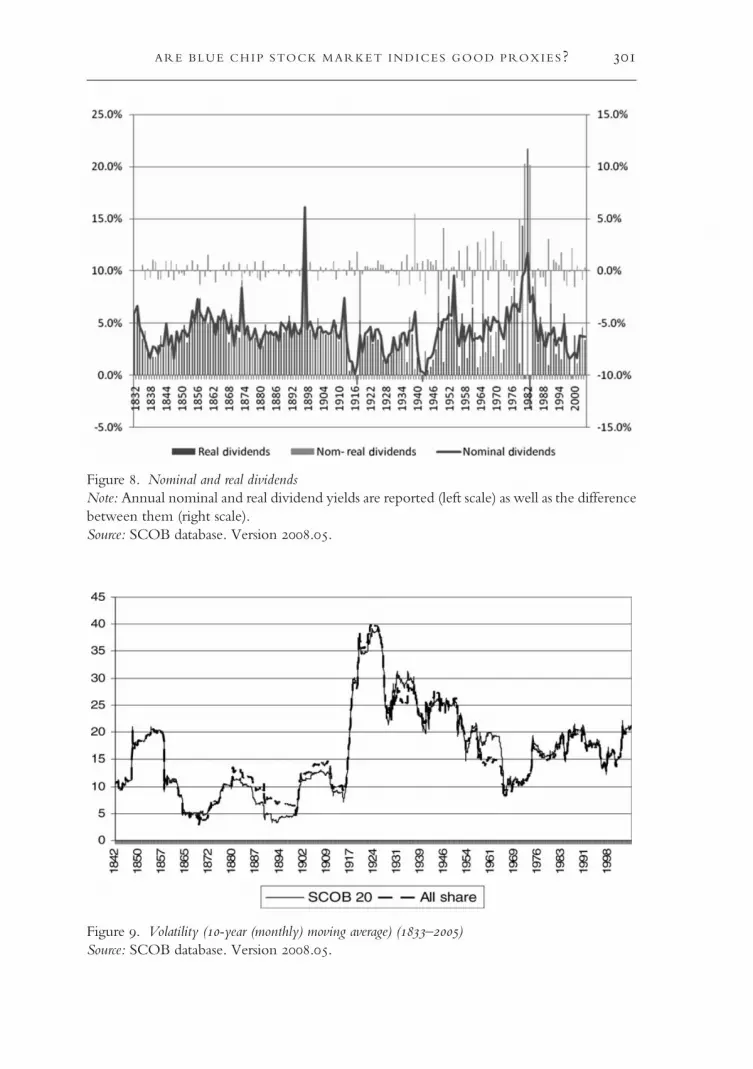
Figure . Nominal and real dividendsNote: Annual nominal and real dividend yields are reported (left scale) as well as the differencebetween them (right scale).Source: SCOB database. Version ..
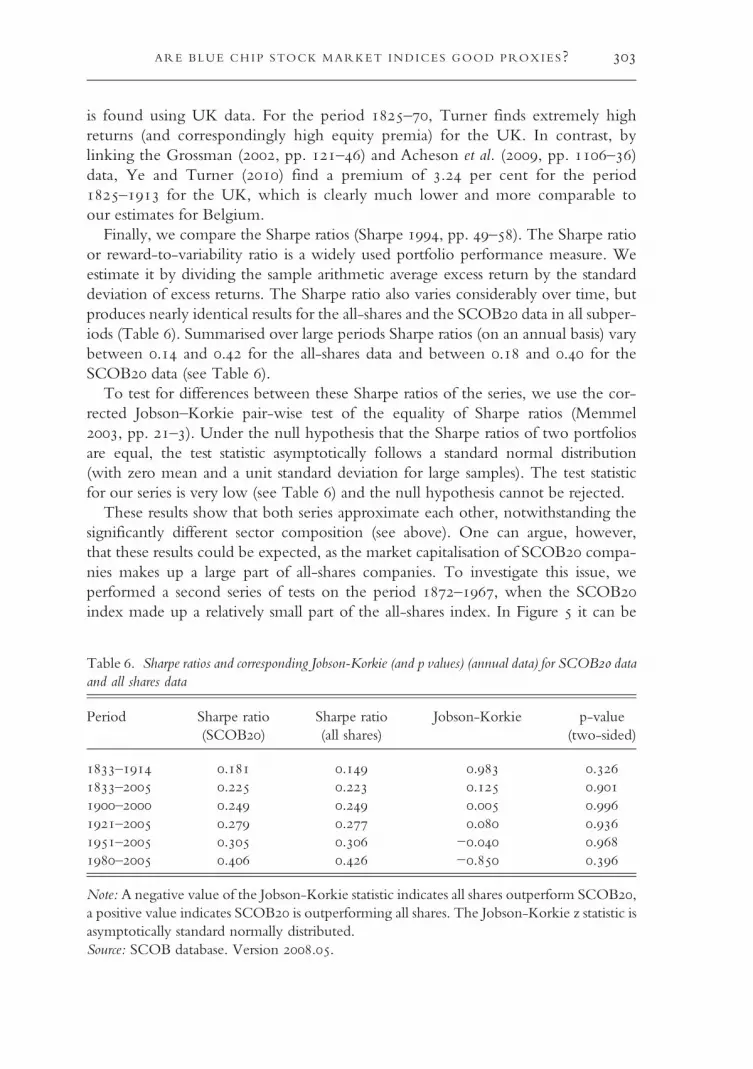
applications (Salomons , pp. –; DeLong and Magin , pp. –).In the long run, the equity premium was nearly identical for both indices (Table )and the t-statistic (−.) on the (monthly) difference of −. between bothequity premia indicates that we cannot reject the null that they are equal. (The com-pilation of the Belgian short rate series is explained in Appendix .)A (geometric) excess return of about . per cent ( per cent arithmetic mean) may
appear low compared to American data, e.g. in Ibbotson, reporting an equitypremium of . per cent (arithmetic) or . (geometric) (Ibbotson Associates). Several other studies also report evidence of a substantial equity premium,although there is a wide difference even when reporting data on the same country(Fernandez ). Interestingly, employing their new NYSE database for–, Goetzmann, Ibbotson and Peng find an equity premium for– of only . per cent (arithmetic, compared to bonds) (Goetzmannet al. , pp. –). Le Bris and Hautcoeur calculate returns and equity premiafor the Paris Stock Exchange (–) (indices constructed in a way comparableto the present-day CAC) (Le Bris and Hautcoeur ). The arithmetic (geo-metric) equity premium they find is . per cent (. per cent) for the period–. The corresponding – values are . and . per cent.Dimson, Marsh and Staunton () calculate equity premia for countries forthe twentieth century. They report arithmetic equity premia of ., . and. per cent for the UK, Germany and Japan, respectively, with correspondinggeometrical values of ., . and . per cent. Undoubtedly, the higherequity premium found in post- US data is due to the exceptional situationthe US was in. After World War I, and even more after World War II, it becameincreasingly obvious that the US would develop into the dominant economicpower. To the extent that this was unanticipated, the ex post equity premium over-estimates the expected risk premium. Corroborating evidence for this interpretation
Table . The equity premium for SCOB and all shares real data (–)
Arithmeticmean
Geometricmean
Standarddeviation
Excessreturnsa
Excessreturnsb
All sharesreturn
. . . . .
SCOBreturn
. . . . .
Short rate . . .
aExcess return (stocks compared to short rate) based on arithmetic mean, R_equity-R_riskfree rate.bExcess return (stocks compared to short rate) based on geometric mean. Excess returns arecalculated as ( +R_equity)/(+R_risk free rate) − .Source: SCOB database. Version ..
JAN ANNAERT ET AL.
is found using UK data. For the period –, Turner finds extremely highreturns (and correspondingly high equity premia) for the UK. In contrast, bylinking the Grossman (, pp. –) and Acheson et al. (, pp. –)data, Ye and Turner () find a premium of . per cent for the period– for the UK, which is clearly much lower and more comparable toour estimates for Belgium.Finally, we compare the Sharpe ratios (Sharpe , pp. –). The Sharpe ratio
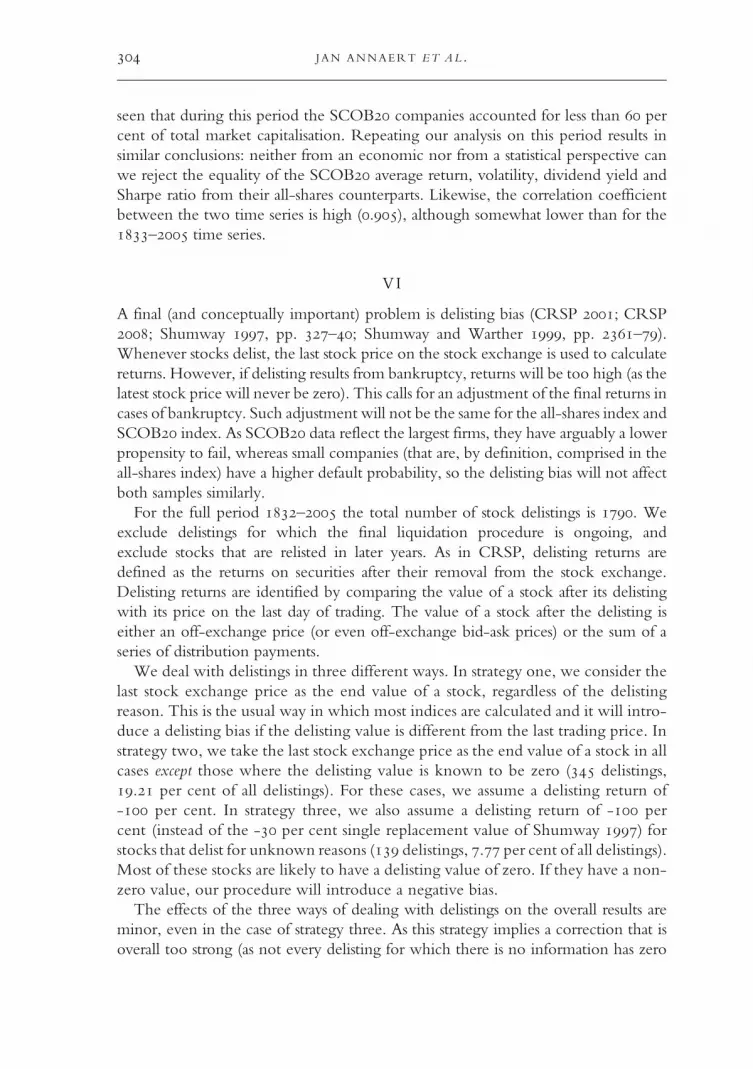
or reward-to-variability ratio is a widely used portfolio performance measure. Weestimate it by dividing the sample arithmetic average excess return by the standarddeviation of excess returns. The Sharpe ratio also varies considerably over time, butproduces nearly identical results for the all-shares and the SCOB data in all subper-iods (Table ). Summarised over large periods Sharpe ratios (on an annual basis) varybetween . and . for the all-shares data and between . and . for theSCOB data (see Table ).To test for differences between these Sharpe ratios of the series, we use the cor-
rected Jobson–Korkie pair-wise test of the equality of Sharpe ratios (Memmel, pp. –). Under the null hypothesis that the Sharpe ratios of two portfoliosare equal, the test statistic asymptotically follows a standard normal distribution(with zero mean and a unit standard deviation for large samples). The test statisticfor our series is very low (see Table ) and the null hypothesis cannot be rejected.These results show that both series approximate each other, notwithstanding the
significantly different sector composition (see above). One can argue, however,that these results could be expected, as the market capitalisation of SCOB compa-nies makes up a large part of all-shares companies. To investigate this issue, weperformed a second series of tests on the period –, when the SCOBindex made up a relatively small part of the all-shares index. In Figure it can be
Table . Sharpe ratios and corresponding Jobson-Korkie (and p values) (annual data) for SCOB dataand all shares data
Note: A negative value of the Jobson-Korkie statistic indicates all shares outperform SCOB,a positive value indicates SCOB is outperforming all shares. The Jobson-Korkie z statistic isasymptotically standard normally distributed.Source: SCOB database. Version ..
ARE BLUE CHIP STOCK MARKET INDICES GOOD PROXIES?
seen that during this period the SCOB companies accounted for less than percent of total market capitalisation. Repeating our analysis on this period results insimilar conclusions: neither from an economic nor from a statistical perspective canwe reject the equality of the SCOB average return, volatility, dividend yield andSharpe ratio from their all-shares counterparts. Likewise, the correlation coefficientbetween the two time series is high (.), although somewhat lower than for the– time series.
VI
A final (and conceptually important) problem is delisting bias (CRSP ; CRSP; Shumway , pp. –; Shumway and Warther , pp. –).Whenever stocks delist, the last stock price on the stock exchange is used to calculatereturns. However, if delisting results from bankruptcy, returns will be too high (as thelatest stock price will never be zero). This calls for an adjustment of the final returns incases of bankruptcy. Such adjustment will not be the same for the all-shares index andSCOB index. As SCOB data reflect the largest firms, they have arguably a lowerpropensity to fail, whereas small companies (that are, by definition, comprised in theall-shares index) have a higher default probability, so the delisting bias will not affectboth samples similarly.For the full period – the total number of stock delistings is . We
exclude delistings for which the final liquidation procedure is ongoing, andexclude stocks that are relisted in later years. As in CRSP, delisting returns aredefined as the returns on securities after their removal from the stock exchange.Delisting returns are identified by comparing the value of a stock after its delistingwith its price on the last day of trading. The value of a stock after the delisting iseither an off-exchange price (or even off-exchange bid-ask prices) or the sum of aseries of distribution payments.We deal with delistings in three different ways. In strategy one, we consider the
last stock exchange price as the end value of a stock, regardless of the delistingreason. This is the usual way in which most indices are calculated and it will intro-duce a delisting bias if the delisting value is different from the last trading price. Instrategy two, we take the last stock exchange price as the end value of a stock in allcases except those where the delisting value is known to be zero ( delistings,. per cent of all delistings). For these cases, we assume a delisting return of- per cent. In strategy three, we also assume a delisting return of - percent (instead of the - per cent single replacement value of Shumway ) forstocks that delist for unknown reasons ( delistings, . per cent of all delistings).Most of these stocks are likely to have a delisting value of zero. If they have a non-zero value, our procedure will introduce a negative bias.The effects of the three ways of dealing with delistings on the overall results are
minor, even in the case of strategy three. As this strategy implies a correction that isoverall too strong (as not every delisting for which there is no information has zero
JAN ANNAERT ET AL.
value), it provides an upper limit to the correction for the delisting bias. In period–, e.g. strategies one and two give a difference in return of only . percent; if we compare strategies one and three the difference is only . per cent.This is in line with the results of CRSP. There is no change in the return for theSCOB. The reason is obvious, as the constituent firms were large companies thatvery rarely went bankrupt because they were excluded from the SCOB beforethe final delisting.The small effect of delistings on overall returns is probably due to two elements: (a)
the rather limited number of delistings; (b) the observation that, if a stock is delisted,almost always a sharp drop in prices could be observed in the months before delisting.
VII
In this article we have introduced new return indices for the BSE over the years–. We constructed these indices using monthly returns for all Belgian-based companies that at any point in time were listed on the BSE. The individualreturns were averaged using market-capitalisation weights, thus obtaining a marketvalue-weighted all-shares return index and a return index for the largest stocks.We documented their risk and return characteristics over the entire period, as wellas over several subperiods. We confirm that the dividend component in stockreturns is of utmost importance to obtain accurate estimates for the total realisedreturn on equity investments. Particularly during the period before World War I,this return component captures the bulk of total equity return, leaving hardly any-thing for the capital appreciation component.By comparing the SCOB index returns to the all-shares return index, we showed
that accurate performance estimates can be made based on limited data. Both returnsare highly correlated. Moreover, both indices produce similar average return and riskestimates and their dividend yields are almost identical. For –, a real total(geometric) return of . per cent per annum was realised by the all-shares index,whereas for the SCOB the total (geometric) return was . per cent; standarddeviations were, respectively, . and . per cent. Our finding that it is possibleto mimic the return on the overall stock market with a limited number of stocks pro-vides evidence that only a small number of (the largest) stocks is needed to get a diver-sified (market cap-weighted) portfolio.
Submitted: 27 April 2010Revised version submitted: 5 April 2011Accepted: 25 May 2011First published online: 27 September 2011
References
ACHESON, G. G., HICKSON, C .R., TURNER, J. D. and YE, Q. (). Rule Britannia! Britishstock market returns, –. Journal of Economic History, (), pp. –.
ARE BLUE CHIP STOCK MARKET INDICES GOOD PROXIES?
BAIROCH, P. (). International industrialization levels from to . Journal of EuropeanEconomic History, , pp. –.
BAUDHUIN, F. (). Histoire Economique de la Belgique –. Brussels: BruylantBUELENS, F. andMARYSSE, S. (). Returns on investments during the colonial era: the case of the
Belgian Congo. The Economic History Review, (S:), pp. –.CHLEPNER, B. S. (). Le marché financier belge depuis ans. Brussels: Falk Fils.COMMISSION DES AGENTS DE CHANGE (). Fluctuations de la Bourse pendant une période de
vingt ans à ou statistique des fonds publiques. Brussels: Van der Auwera.COPPIN, L. (–). Répertoire des Sociétés par actions dont les titres se négocient plus spécialement en
Belgique. Brussels: Librairie de l’Economiste Internationale.COURTOIS, A. (–). Manuel des Fonds Publics et des Sociétés par Actions. Paris: Garnier Frères.COWLES, A. AND ASSOCIATES (). Common Stock Indexes, –. Bloomington: Principia
Press.CRSP (). Data Description Guide: CRSP US Stock and CRSP US Indices Databases. Chicago: CRSP.CRSP (). CRSP Delisting Returns. Chicago: CRSP.CUYVERS, L. and VAN BETS, P. (). De Belgische investeringen in het buitenland en hun
rendement in de periode –: een kwantificering aan de hand van de beurswaarde van deondernemingen. Kwartaalschrift Economie, , pp. –.
DE KERCKHOVE DE DENTERGHEM, C. (). L’industrie Belge pendant l’occupation allemande–. Paris and New Haven.
DELONG, J. B. and MAGIN, K. (). The US equity return premium: past, present, and future.Journal of Economic Perspectives, , pp. –.
DEMEUR, A. (–). Les sociétés anonymes de Belgique, Collection complète des statuts collationnés sur lestextes officiels. Brussels: Chez l’Editeur.
DEMEUR, A. (–). Les sociétés commerciales. Actes et documents. Brussels: Chez l’Editeur (variousissues).
DIMSON, E., MARSH, P. and STAUNTON, M. (). Triumph of the Optimists. Princeton:Princeton University Press.
DUPRIEZ, L. (). Les méthodes d’analyse de la conjoncture économique et leur application à l’économie belgedepuis . Louvain: Librairie universitaire.
FERNANDEZ, P. (). Equity premium: historical, expected, required and implied. Working Paper,Barcelona.
FISHER, L. and LORIE, J. H. (). Rates of return on investments in common stocks. Journal ofBusiness, , pp. –
FISHER, L. and LORIE, J. H. (). Rates of return on investments in common stocks. Journal ofBusiness, , pp. –.
FISHER, L. and LORIE, J. H. ().AHalf Century of Returns on Bonds and Stocks. Chicago: Universityof Chicago Press.
FRÈRE, L. (). Etude historique des sociétés anonymes belges I. Brussels: Desmet-Verteneuil.FRÈRE, L. (). Etude historique des sociétés anonymes belges II. Brussels: Desmet-Verteneuil.GENERALE BANK (). Evolutie van de Belgische rentetarieven sinds de onafhankelijkheid.
Bulletin van de Generale Bank, –, pp. – and pp. –.GÉRARD, M. L. (). Le dernier chapitre de l’assainissement financier de la Belgique. Revue
Economique Internationale, , pp. –.GOETZMANN, W., IBBOTSON, R. and PENG, L. (). A new historical database for the NYSE
to : performance and predictability. Journal of Financial Markets, (), pp. –.GROSSMAN, R. S. (). New indices of British equity prices –. Journal of Economic History,
(), pp. –.HOMER, S. and SYLLA, R. (). A History of Interest Rates. London and New Brunswick: Rutgers
University Press.IBBOTSONASSOCIATES (). Stocks, Bonds, Bills, and Inflation. Yearbook. Chicago: IbbotsonAssociates.IRES (). Evolution des taux de l’intérêt en Belgique depuis la fin de la première guerre mondiale
(–). Bulletin de l’Institut de Recherches Economiques et Sociales, , pp. –.KURGAN-VAN HENTENRYK, G. (). The Société Générale, –. In H. Van der Wee
et al. (eds.), The Generale Bank –. Tielt: Lannoo, pp. –.
J AN ANNAERT ET AL.
LAUREYSSENS, J. (). Industriële naamloze vennootschappen in België –. Louvain: Ed.Nauwelaerts.
LE BRIS, D. and HAUTCOEUR, P. C. (). A challenge to triumphant optimists? A new index ofthe Paris stock exchange (–). Financial History Review, , pp. –.
MADDISON, A. (). Monitoring the World Economy –. Paris: OECD.MEMMEL, C. (). Performance hypothesis testing with the Sharpe ratio. Finance Letters, , pp. –.MICHOTTE, F. (). L’évolution des prix de détail en Belgique de à . Bulletin de l’Institut
des Sciences Economiques, , pp. –.MOMMEN, A. (). The Belgian Economy in the Twentieth Century. London: Routledge.NATIONAL BANK OF BELGIUM (). Statistiques économiques belges –. Bulletin
d’Information et de Documentation, April, pp. –.NATIONAL BANK OF BELGIUM (–). Belgische Economische Statistieken. Brussels: National
Bank of Belgium.NATIONAL BANK OF BELGIUM (). Belgische Economische Statistieken –. Brussels:
National Bank of Belgium.NEYMARCK, A. (). Les finances contemporaines. L’Epargne française et les valeurs mobilières –.
Paris: Félix Alcan.NICOLAI, E. (). Étude historique et critique sur la dette publique en Belgique. Brussels: Lamertin.PEETERS, W. (). Foreign direct investment within a reconstructed balance of payments:
preliminary results for Belgium, –. In V. Bovykin et al. (eds.), Public Debt, Public Finance,Money and Balance of Payments in Debtor Countries –. Seville: IEHC Congress, pp. –.
SALOMONS, R. (). A theoretical and practical perspective on the equity risk premium. Journal ofEconomic Surveys, , pp. –.
SHARPE, W. F. (). The Sharpe ratio. Journal of Portfolio Management, , –.SHUMWAY, T. (). The delisting bias in CRSP data. Journal of Finance, (), pp. –.SHUMWAY, T. and WARTHER, V. A. (). The delisting bias in CRSP’s Nasdaq data and its
implications for the size effect. Journal of Finance, (), pp. –.THIEBUALD, C. (). Comment former une statistique internationale des valeurs mobilières? In
Congrès International d’Expansion Economique Mondial (ed.), Statistique Internationale. Brussels: J.Goemaere.
TRIOEN, L. F. B. ().Collection des statuts de toutes les sociétés anonymes et en commandite par actions de laBelgique. Brussels: Chez l’auteur.
VAN DAMME, E. (). Manuel du Financier des Opérations en Fonds Publics et des Sociétés par Actions enBelgique. Ghent: Verhulst.
VAN DE VELDE, G. (). Le rendement des Placements (–). Louvain: Société d’études morales,sociales et juridiques.
VAN DER WEE, H. (), De Generale Bank. Tielt: Lannoo.VANES, F. R. (). De markt van het schatkistpapier in België. Tijdschrift voor economie, , pp. –.VANHEURCK, J. (). Les finances publiques pendant l’occupation allemande de à . In Institut
Belge de Finances Publiques (ed.), Histoire des Finances Publiques, . Brussels: Bruylant, pp. –.VITU, A. (). Guide financier. Répertoire général des valeurs financières et industrielles cotées sur les bourses
françaises et sur les principaux marchés de l’Europe, de l’Amérique et des Indes. Paris: Hachette.YE, Q. and TURNER, J. D. (). Has the equity premium always been so high? Evidence from the
UK, –.Working Paper, Queen’s University Belfast.
Sources
Belgium.Ministère des Affaires Etrangères,Relevé des côtes autorisées depuis l’arrêté Royal du novembre (Brussels, )
Belgium. Ministry of Economics, CPI-index – (Brussels, ) (www.statbel.fgov.be/indicators/cpi_nl.asp)
Belgium, ‘Prix Courant’, Moniteur Belge (Brussels, various issues)Financieel-Economische Tijd (later on ‘De TIJD’), newspaper, various issuesHet Handelsblad, newspaper, various issuesJournal du Commerce d’Anvers, newspaper, various issues
ARE BLUE CHIP STOCK MARKET INDICES GOOD PROXIES?
L’Avenir, newspaper, various issuesMemento der Effecten, – (yearly issues)Moniteur des Intérêts Matériels, newspaper, various issuesRecueil Financier, – (Brussels, yearly issues)
Appendix : The Belgian short-term interest rate
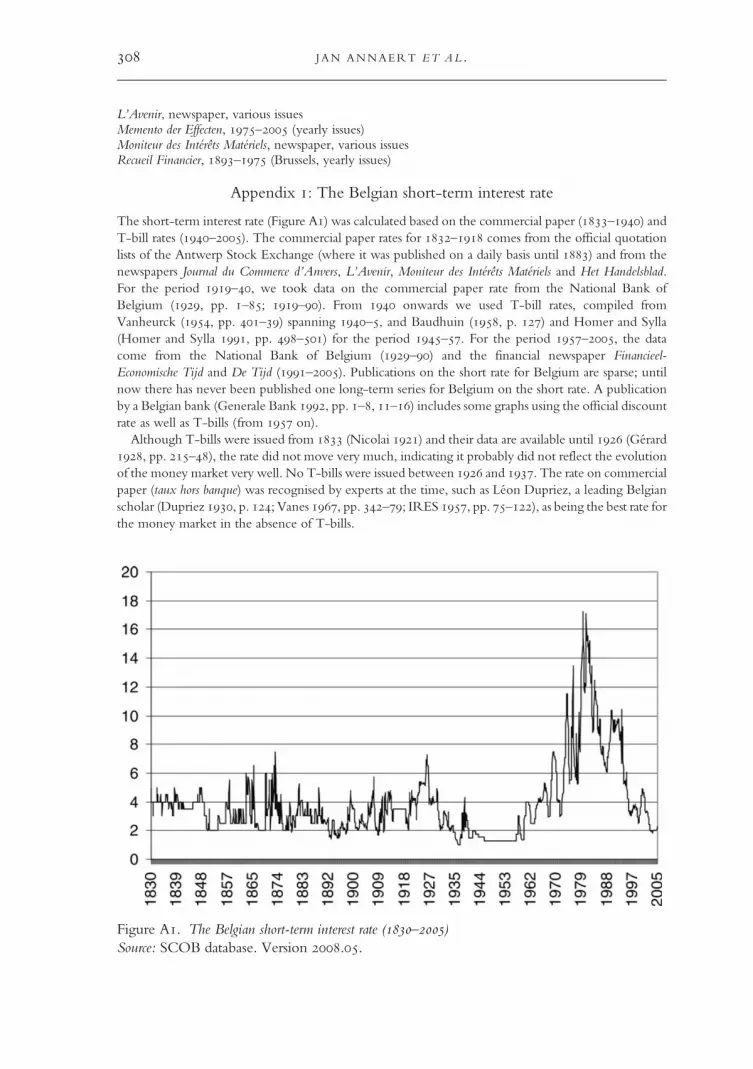
The short-term interest rate (Figure A) was calculated based on the commercial paper (–) andT-bill rates (–). The commercial paper rates for – comes from the official quotationlists of the Antwerp Stock Exchange (where it was published on a daily basis until ) and from thenewspapers Journal du Commerce d’Anvers, L’Avenir, Moniteur des Intérêts Matériels and Het Handelsblad.For the period –, we took data on the commercial paper rate from the National Bank ofBelgium (, pp. –; –). From onwards we used T-bill rates, compiled fromVanheurck (, pp. –) spanning –, and Baudhuin (, p. ) and Homer and Sylla(Homer and Sylla , pp. –) for the period –. For the period –, the datacome from the National Bank of Belgium (–) and the financial newspaper Financieel-Economische Tijd and De Tijd (–). Publications on the short rate for Belgium are sparse; untilnow there has never been published one long-term series for Belgium on the short rate. A publicationby a Belgian bank (Generale Bank , pp. –, –) includes some graphs using the official discountrate as well as T-bills (from on).
Although T-bills were issued from (Nicolai ) and their data are available until (Gérard, pp. –), the rate did not move very much, indicating it probably did not reflect the evolutionof the money market very well. No T-bills were issued between and . The rate on commercialpaper (taux hors banque) was recognised by experts at the time, such as Léon Dupriez, a leading Belgianscholar (Dupriez , p. ; Vanes , pp. –; IRES , pp. –), as being the best rate forthe money market in the absence of T-bills.
Figure A. The Belgian short-term interest rate (–)Source: SCOB database. Version ..