Open AcceResearch articleAcute health effects of the Tasman Spirit oil spill on residents of Karachi, PakistanNaveed Zafar Janjua*1,3, Pashtoon Murtaza Kasi1, Haq Nawaz1, Sadia Zohra Farooqui1, Urooj Bakht Khuwaja1, Najam-ul-Hassan1, Syed Nadim Jafri1, Shahid Ali Lutfi2, Muhammad Masood Kadir1 and Nalini Sathiakumar3
Address: 1Department of Community Health Sciences, the Aga Khan University, Karachi, Pakistan, 2Sindh Environmental Protection Agency, Karachi, Pakistan and 3Department of Epidemiology, School of Public Health, University of Alabama at Birmingham, Birmingham, AL, USA
AbstractBackground: On July 27 2003, a ship carrying crude oil run aground near Karachi and after two weeks released37,000 tons of its cargo into the sea. Oil on the coastal areas and fumes in air raised health concerns amongpeople. We assessed the immediate health impact of oil spill from the tanker Tasman Spirit on residents of theaffected coastline in Karachi, Pakistan.
Methods: We conducted a study consisting of an exposed group including adults living in houses on the affectedshoreline and two control groups (A and B) who lived at the distance of 2 km and 20 km away from the sea,respectively. We selected households through systematic sampling and interviewed an adult male and female ineach household about symptoms relating to eyes, respiratory tract, skin and nervous system, smoking, allergies,beliefs about the effect on their health and anxiety about the health effects. We used logistic regressionprocedures to model each symptom as an outcome and the exposure status as an independent variable whileadjusting for confounders. We also used linear regression procedure to assess the relationship exposure statuswith symptoms score; calculated by summation of all symptoms.
Results: Overall 400 subjects were interviewed (exposed, n = 216; group A, n = 83; and group B, n = 101). Theexposed group reported a higher occurrence of one or more symptoms compared to either of the control groups(exposed, 96% vs. group A, 70%, group B 85%; P < 0.001). Mean summary symptom scores were higher amongthe exposed group (14.5) than control group A (4.5) and control group B (3.8, P < 0.001). Logistic regressionmodels indicated that there were statistically significant, moderate-to-strong associations (Prevalence ORs (POR)ranging from 2.3 to 37.0) between the exposed group and the symptoms. There was a trend of decreasingsymptom-specific PORs with increase in distance from the spill site. Multiple linear regression model revealedstrong relationship of exposure status with the symptoms score (β = 8.24, 95% CI: 6.37 – 10.12).
Conclusion: Results suggest that the occurrence of increased symptoms among the exposed group is more likelyto be due to exposure to the crude oil spill.
Published: 03 April 2006
BMC Public Health 2006, 6:84 doi:10.1186/1471-2458-6-84
Received: 08 October 2005Accepted: 03 April 2006
This article is available from: http://www.biomedcentral.com/1471-2458/6/84
BMC Public Health 2006, 6:84 http://www.biomedcentral.com/1471-2458/6/84
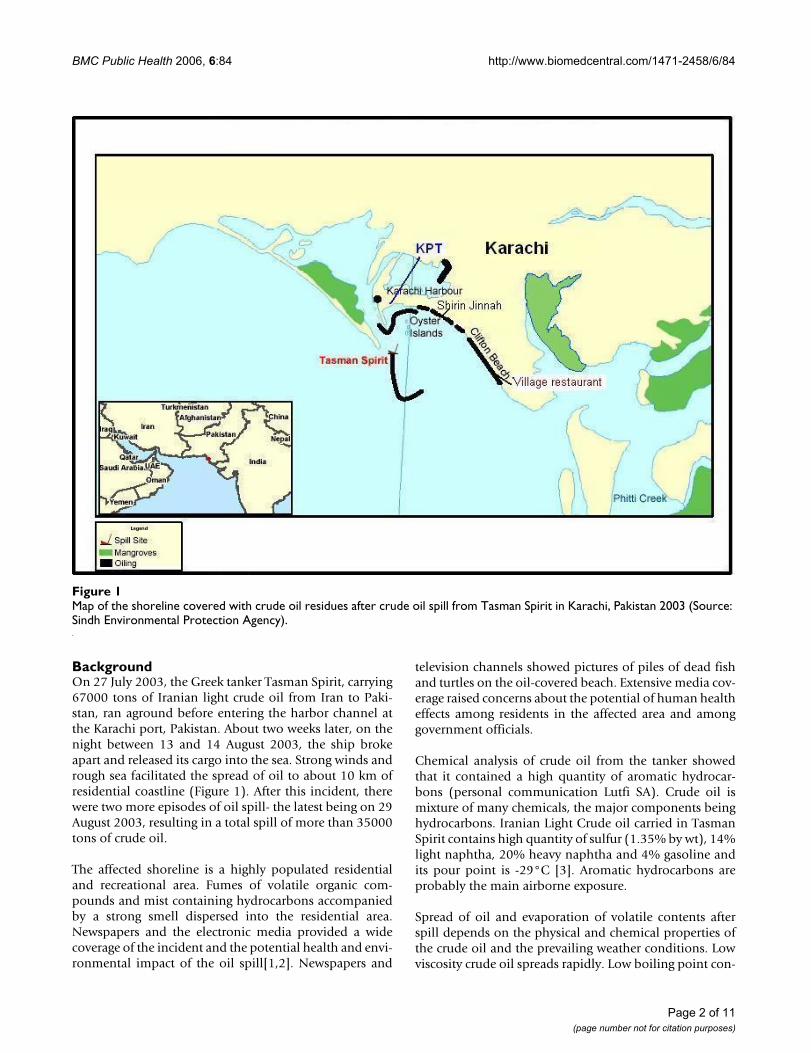
BackgroundOn 27 July 2003, the Greek tanker Tasman Spirit, carrying67000 tons of Iranian light crude oil from Iran to Paki-stan, ran aground before entering the harbor channel atthe Karachi port, Pakistan. About two weeks later, on thenight between 13 and 14 August 2003, the ship brokeapart and released its cargo into the sea. Strong winds andrough sea facilitated the spread of oil to about 10 km ofresidential coastline (Figure 1). After this incident, therewere two more episodes of oil spill- the latest being on 29August 2003, resulting in a total spill of more than 35000tons of crude oil.
The affected shoreline is a highly populated residentialand recreational area. Fumes of volatile organic com-pounds and mist containing hydrocarbons accompaniedby a strong smell dispersed into the residential area.Newspapers and the electronic media provided a widecoverage of the incident and the potential health and envi-ronmental impact of the oil spill[1,2]. Newspapers and
television channels showed pictures of piles of dead fishand turtles on the oil-covered beach. Extensive media cov-erage raised concerns about the potential of human healtheffects among residents in the affected area and amonggovernment officials.
Chemical analysis of crude oil from the tanker showedthat it contained a high quantity of aromatic hydrocar-bons (personal communication Lutfi SA). Crude oil ismixture of many chemicals, the major components beinghydrocarbons. Iranian Light Crude oil carried in TasmanSpirit contains high quantity of sulfur (1.35% by wt), 14%light naphtha, 20% heavy naphtha and 4% gasoline andits pour point is -29°C [3]. Aromatic hydrocarbons areprobably the main airborne exposure.
Spread of oil and evaporation of volatile contents afterspill depends on the physical and chemical properties ofthe crude oil and the prevailing weather conditions. Lowviscosity crude oil spreads rapidly. Low boiling point con-
Map of the shoreline covered with crude oil residues after crude oil spill from Tasman Spirit in Karachi, Pakistan 2003 (Source: Sindh Environmental Protection Agency)Figure 1Map of the shoreline covered with crude oil residues after crude oil spill from Tasman Spirit in Karachi, Pakistan 2003 (Source: Sindh Environmental Protection Agency).
Page 2 of 11(page number not for citation purposes)
BMC Public Health 2006, 6:84 http://www.biomedcentral.com/1471-2458/6/84
tents of crude oil evaporate within hours of the spill andif volatile contents are high then evaporation is more.High temperature, high speed wind and strong waveaction increase the spread and evaporation of the volatilecontents [4]. During August 10th to August 30th, 2003 theaverage maximum temperature in Karachi was 31°Cwhile average minimum temperature was 27°C with theaverage mean of 29°C [5]. July and August is a rough seaseason in Pakistan with strong waves. Moderately hightemperature, strong waves and high speed wind [2]moved oil from sea to shoreline and winds carried vaporsfrom sea to land. Initial assessment suggested that about11,000 tones of volatile organic compounds entered theair after the spill. Assessment of the air revealed that onAugust 20, VOCs in the polluted air ranged from 44 ppmat Shireen Jinnah Colony to 179 ppm at Village Restau-rant.
Residents living in this area were exposed to the high levelof volatile organic compounds for at least 15 to 20 days.The level of pollutants gradually tapered off from 8 to 10ppm of volatile organic compounds on August 30. Thepungent smell was perceptible till September 5 at the dis-tance of about 1 km from the sea [6]. These levels suggesthigh exposure of population to crude oil contents duringspill days.
Previous investigations of the Sea Empress, the Nakhodkaand the Shetland oil tankers' spills found an increasedoccurrence of upper respiratory tract irritation, exacerba-tion of asthma, vertigo, headache, and back and leg painsand psychological ailments among persons living inexposed areas and clean-up workers [7-9].
Studies on acute health effects of exposure to an oil spillare few. This paper is first of such report from a developingcountry. To address the concerns regarding potentialhealth effects, we undertook an epidemiologic investiga-tion to determine if exposure to the oil spill had resultedin increased acute ill health among the exposed residentpopulation.
MethodsDesign and study baseThe study began on September 1st 2003, three weeks afterfirst spill and three days after the last spill. The exact pop-ulation size of the shoreline is not available; however, it isestimated that about 700,000 people live in this beachtown. The beach in this area was covered with thick layerof oil and there were fumes and a mist of oil in the air. Thepublic was prohibited from visiting the beach after spill.However, residents were not asked to evacuate. Exposurewas assigned on the basis of geographic location. Wedefined the exposed group as adults resident in apart-ments/houses on a 10 km long affected shoreline that
extended from Shirin Jinnah colony (near the harbor) toVillage restaurant (end of the residential area) and whodid not migrate after the oil spill on August 13th, 2003. Weselected two control groups: control group A living at adistance of 2 km from the affected coastal area and controlgroup B living at a distance of 20 km from the affectedshoreline. The distance of 2 km and 20 km were chosenarbitrarily to assess if symptoms depended on the distancefrom the shoreline. We obtained distance measurementsfrom City District Government of Karachi which provideda list of residential areas at 2 and 20 km, taking the shore-line as a reference point.
Subject selectionMost of the residential dwellings in both the exposed andcontrol areas were 4 to 10-storeyed buildings with apart-ments. No official listing of buildings was availablethrough which we could have developed a list of onlythose buildings that were on the shoreline. There wereapproximately 100–150 buildings on the shoreline. Weselected every 4th building on the shoreline facing towardsthe beach starting from the Shirin Jinnah colony to theVillage restaurant, a total of 25 buildings. From eachbuilding we randomly selected one household per floor toassess the effect of elevation on exposure to oil fumes.From each apartment, we selected the first adult male andfemale we met in the home for interview. Both males andfemales were included, because of the likelihood of differ-ences in their daily activities and resulting exposure. Typ-ically, men spend more time outdoors and women spendmore time indoors. We used the same sampling procedureto select buildings (control group A, 12 building; controlgroup B, 12 buildings), apartment and subjects in controlgroups. Of 410 persons initially approached, 400 (98%)participated in the study. Of the 400 persons, 216 were inthe exposed groups, 83 in control group A and 101 in con-trol group B.
Interviews and questionnaireA research team (4 sub-teams comprising of 2 interviewersin each) consisting of physicians and final year medicalstudents conducted face to face interview of participantsduring household visits. We had an in-office training ofthe research team on aspects of sampling, consent process,questionnaire and conducting the interviews. We field-tested the questionnaire before actual field work andrevised the content as deemed necessary. We developed aquestionnaire that included a symptom check list of theknown health effects of hydrocarbon exposure based onprevious investigations [7,8], adapted from the symptomchecklist developed for the Nakhodka oil spill. We specif-ically asked respondents to report symptoms (as yes/no)that occurred after the first major spill on August 13th,2003. However, we did not ask to specify the exact date ofstart of a symptom nor when it became better. Major cat-
Page 3 of 11(page number not for citation purposes)
BMC Public Health 2006, 6:84 http://www.biomedcentral.com/1471-2458/6/84
egories of symptoms included ocular (sore, itchy, wateryand red eyes), dermal (itchy skin and skin irritation)upper and lower respiratory tract (scratchy throat, sorethroat, cough, breathing difficulties, wheeze), gastrointes-tinal (nausea/vomiting, loss of appetite), central nervoussystem (headache, dizziness, irritability) and constitu-tional symptoms (general fatigue, weakness and fever).Besides the detailed symptom list, the questionnaireincluded information on socio-demographic characteris-tics, location of house, presence of windows towards sea,active and passive smoking, allergies to chemicals, dustand pollen, course of illness, care sought, and effects ondaily life. It also included questions regarding perceptionabout the role of oil spill in producing ill health, percep-tion that if it had affected respondents' health and anx-iousness about the effects of oil spill on health [SeeAdditional file 1]. Before the start of interview weobtained a verbal informed consent that included infor-mation on the purpose of study, the procedures, confiden-tiality, risk and benefits and right to withdraw from studyany time. We gave a copy of consent from to participantsthat included phone number and mailing address of prin-cipal investigator for additional information and clarifica-tion. Study was reviewed by Sindh EnvironmentalProtection Agency and the Department of CommunityHealth Sciences at the Aga Khan University review com-mittee. On returning from the field every day, we assessedthe filled questionnaires for completeness. Any vague orinconsistent responses were clarified from the respond-ents and edited in the questionnaire.
Statistical analysisWe entered data in MS Access database and analysed itusing Statistical Package for Social Sciences (SPSS) version11. We compared the socio-demographic characteristicsof exposed group with the two control groups by the chi-square test for categorical variables and ANOVA for con-tinuous variables. We computed a symptoms score forsymptoms relating to oil spill; if a symptom was presentwe gave a score of "1"otherwise "0" and by summing 48different symptoms we obtained symptoms score for eachsubject. We compared symptoms scores among groupsusing ANOVA. We compared the proportion of symptomsbetween the exposed and control groups using the preva-lence odds ratio (POR) with its corresponding 95% confi-dence interval (CI). We present results for symptoms withprevalence greater than 30% among the exposed or thosehave been reported in previous studies to enhance theinformativeness of the results. We used logistic regressionprocedures to adjust for other risk factors. We included apotential risk factor other than crude oil exposure in alogistic regression model if its P value was less than 0.20or if it was biologically meaningful. We assessed the asso-ciation of exposure status with selected symptoms as out-come variable while adjusting for confounding effect of
age, sex, education, history of chemical allergy, dustallergy, active and passive smoking, house on the mainroad as proxy for exposure to vehicle smoke and anxietyabout effect of spill on health. For some variables thenumbers in either control group A or B were small, hencewe decided not to present adjusted estimates for symp-toms with number less than 8 in any of the cell. Goodnessof fit of the logistics regression model was assessed usingthe Hosmer and Lemshow test.
We conducted a subgroup analysis on the exposed groupto evaluate the relationship between demographic charac-teristics and symptoms through logistic regression mode-ling. The evaluated factors included geographic locationson the basis of residence, age, sex, presence of windowstowards sea and house on the main road. Goodness of fitof the logistics regression models was assessed by Hosmerand Lemshow test.
We performed multiple linear regression to assess the rela-tionship between exposure status and the symptoms scorewhile adjusting for age, gender, education, smoking, dustallergy, chemical allergy, and anxiousness about healtheffect of oil spill. However, only chemical allergy and anx-iousness about health effect of oil spill were significant inthe final model, hence model included only these two var-iables beside exposure status. Model assumptions forgoodness of fit were assessed using residual analysis thatrevealed good fit.
ResultsOf the overall 400 participants, 225 (57%) were womenand 175 (43%) were men. There were statistically signifi-cant differences in the distribution of age, years of educa-tion, location of house, self-reported health impact andthe number of affected household members between thethree groups. The mean age of subjects in control group A(46 years) was higher than the other two groups (exposedgroup, 35 years; control group B, 31 years) due to a higherproportion of subjects in the > 50 age group and a smallerproportion in the 15–30 age group. Control group B sub-jects had higher mean years of schooling (12.7 years) thanthe exposed group (10.3 years) and control group A (11.0years). A higher proportion of the exposed group (53%)lived in houses on the main road compared to controlgroup A (22%) or B (18%). A higher proportion of theexposed group (78%), a lower proportion of controlgroup A (53%) and a still lower proportion of controlgroup B (24%) reported that they were worried about thepossible effects of the oil spill on their health. A higherproportion of exposed group (81%) believed that oil spillhad affected their health, while a lower proportion ofunexposed group A (23%) and still lower proportion ofunexposed group B (3%) believed the same. Differencesin smoking habits, passive smoking status, past history of
Page 4 of 11(page number not for citation purposes)
BMC Public Health 2006, 6:84 http://www.biomedcentral.com/1471-2458/6/84
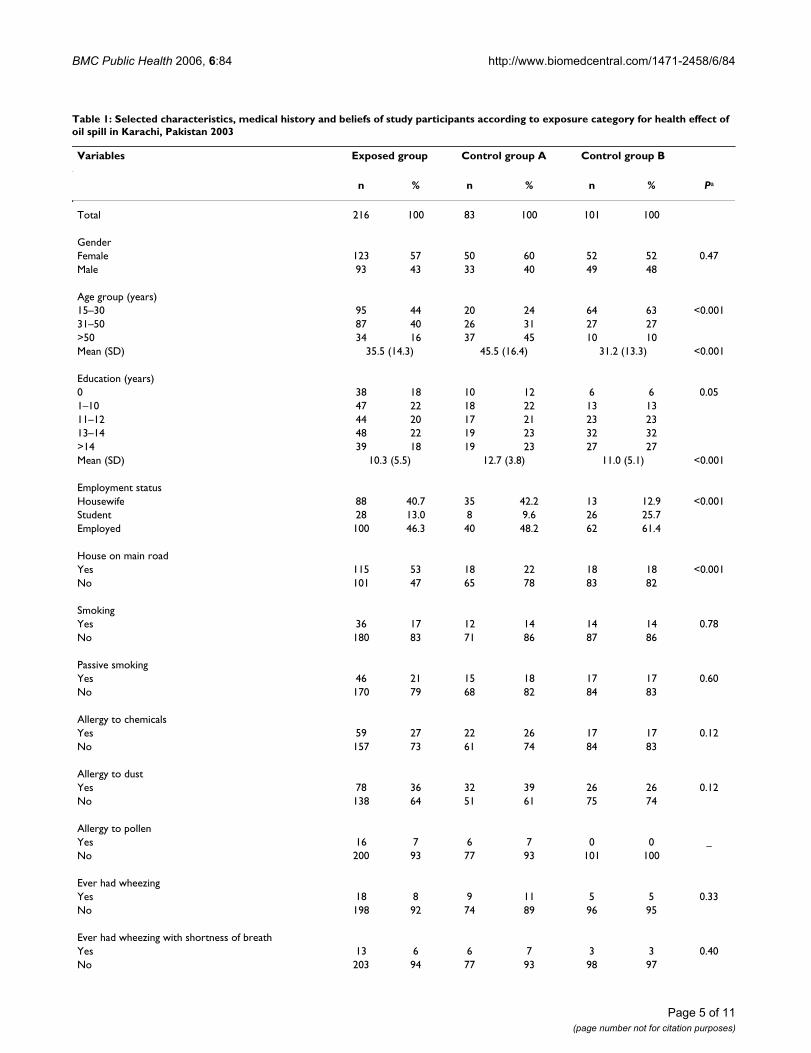
Table 1: Selected characteristics, medical history and beliefs of study participants according to exposure category for health effect of oil spill in Karachi, Pakistan 2003
Variables Exposed group Control group A Control group B
Ever had wheezing with shortness of breathYes 13 6 6 7 3 3 0.40No 203 94 77 93 98 97
Page 5 of 11(page number not for citation purposes)
BMC Public Health 2006, 6:84 http://www.biomedcentral.com/1471-2458/6/84
allergy to chemicals, dust and pollen, and past history ofwheezing and asthma between the groups were not signif-icantly different (table 1).
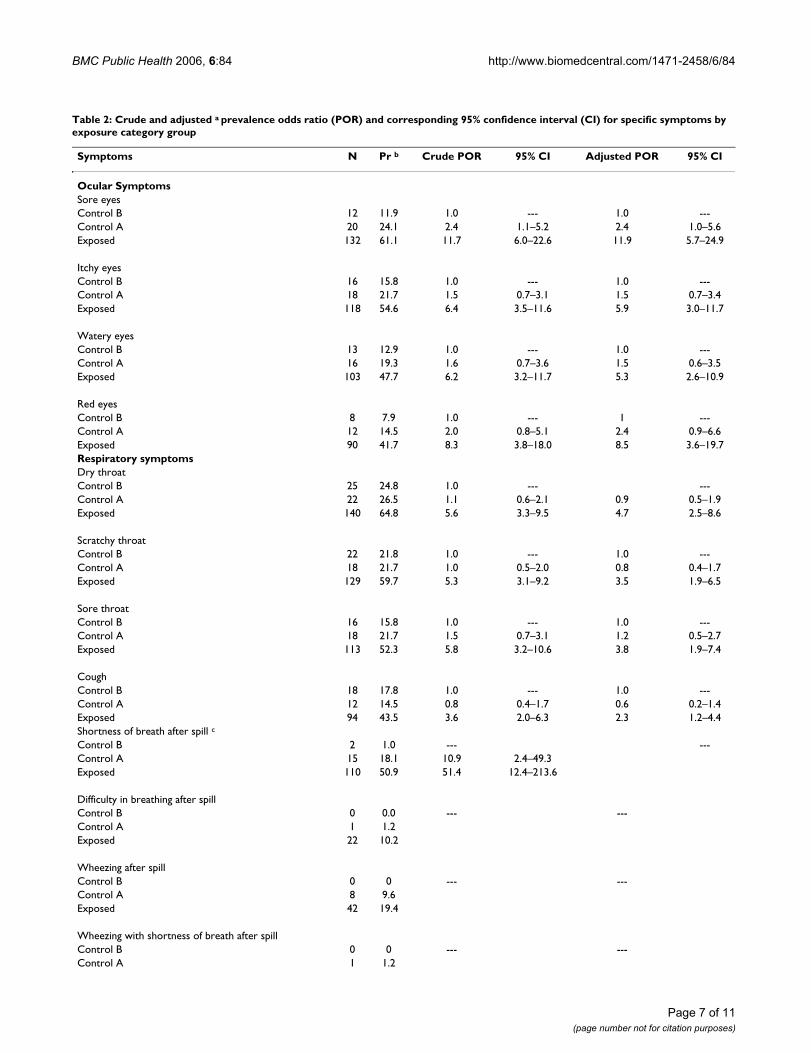
Ninety-six percent of the exposed group (207/216), 70%(58/83) of control group A and 85% (86/101) of controlgroup B reported one or more symptoms (P < 0.001).Mean symptoms score based on the presence of 48 symp-toms in a particular subject were higher among theexposed group (14.1) compared to control A (4.4) or con-trol B (3.8). Further, mean score for each sub-group ofsymptoms were higher among exposed as compared tocontrol groups. Mean score from nine ocular symptomsamong exposed group were 3.4 as compared to1.1 and 0.7for control groups A and B respectively. Mean score fromseven upper respiratory tract symptoms among exposedwere 3.1 as compared to 1.1 among each of control groupA and B. Mean score from the five skin related symptomswere 1.0 for exposed and 0.1 and 0.1 for each of controlgroup A and B. Mean score from 17 nervous systemrelated symptoms was 4.3 for exposed as compared to 1.2and 1.3 for control group A and B respectively.
We compared the proportion of each self-reported symp-tom among the exposed and the control groups, andfound that they were highest for the exposed grouplocated closest to the spill, followed by control group Aand then B. Proportion of those who reported ever havingwheezing was not different among the exposed 8.3% (18/204), the control group A 10.3% (9/84) and the controlgroup B 5% (5/101; P = 0.329). Further, exposed 13/204(6.0 %) who ever had episodes of wheezing that madethem short of breath before the spill was not significantlydifferent from control group A 7.2% (6/84) and controlgroup B 3.0% (3/101, P = 0.400). After the spill, 6% (13/204) had wheezing with shortness of breath among theexposed while only 1.2% (1/82) among the control A andno one in control B.
Only 32.9 % (68/207) of symptomatic subjects in theexposed group and 29.6% (16/54) of control group A,and 19.0% (16/84) of subjects in control group B con-sulted a health care provider for the symptoms. Sixty-sixpercent (45/68) of those who consulted a health care pro-vider in the exposed group reported only one visit. Major-ity (67%) of the symptomatic subjects in the exposedgroup reported that they had recovered completely orwere recovering, whereas the remaining 33% reportedthat their illness was persistent.
Logistic regression model adjusted for the effect of age,gender, education, smoking, dust allergy, chemicalallergy, house on the main road, and anxiousness abouthealth effect of oil spill indicated that there was statisti-cally significant moderate -to-strong associations (PORsranging from 2.3 to 37.0) between the exposed group andthe symptoms listed above and also reported in table 2.There was a trend of decreasing symptom-specific PORswith decrease in exposure (Table 2).
To assess those who were more affected among theexposed, we constructed logistic regression models foreach symptom as dependent variable and included age,sex, building of residence, floor of apartment, house onthe main road, and presence of windows towards sea asindependent variables. We found that for itchy eyes,scratchy throat, sore throat, nausea/vomiting, headachefemales were more likely to experience symptoms as com-pared to males.
Multiple linear regression model revealed strong relation-ship of exposure with the symptoms score (β = 8.24, 95%CI: 6.37 – 10.12, Table 3).
A higher proportion of those who had symptoms amongthe exposed group 54.1% (112/207) reported interferenceof symptoms with their daily routines as compared to
Belief that oil fumes can cause illnessYes 195 90 69 83 94 93 0.28No 15 7 10 12 5 5Don't know 6 3 4 5 2 2
Worried about effect of oil spill on healthYes 168 78 44 53 24 24 <0.001No 48 22 39 47 77 76
Mean number of ill household members (SD) 2.5 (2.2) 0.9 (1.9) 0.3 (0.8) <0.001
aP, chi-square test comparing proportion between the groups or ANOVA (F test) comparing the means between the groups.
Table 1: Selected characteristics, medical history and beliefs of study participants according to exposure category for health effect of oil spill in Karachi, Pakistan 2003 (Continued)
Page 6 of 11(page number not for citation purposes)
BMC Public Health 2006, 6:84 http://www.biomedcentral.com/1471-2458/6/84
Table 2: Crude and adjusted a prevalence odds ratio (POR) and corresponding 95% confidence interval (CI) for specific symptoms by exposure category group
Symptoms N Pr b Crude POR 95% CI Adjusted POR 95% CI
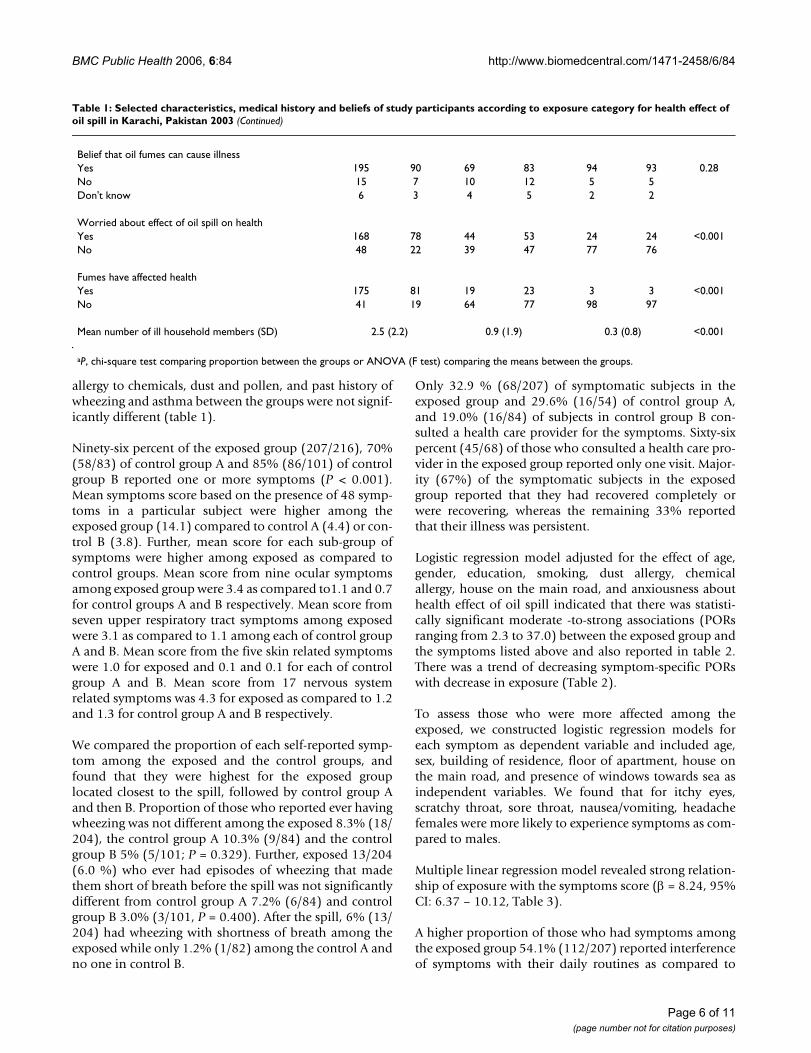
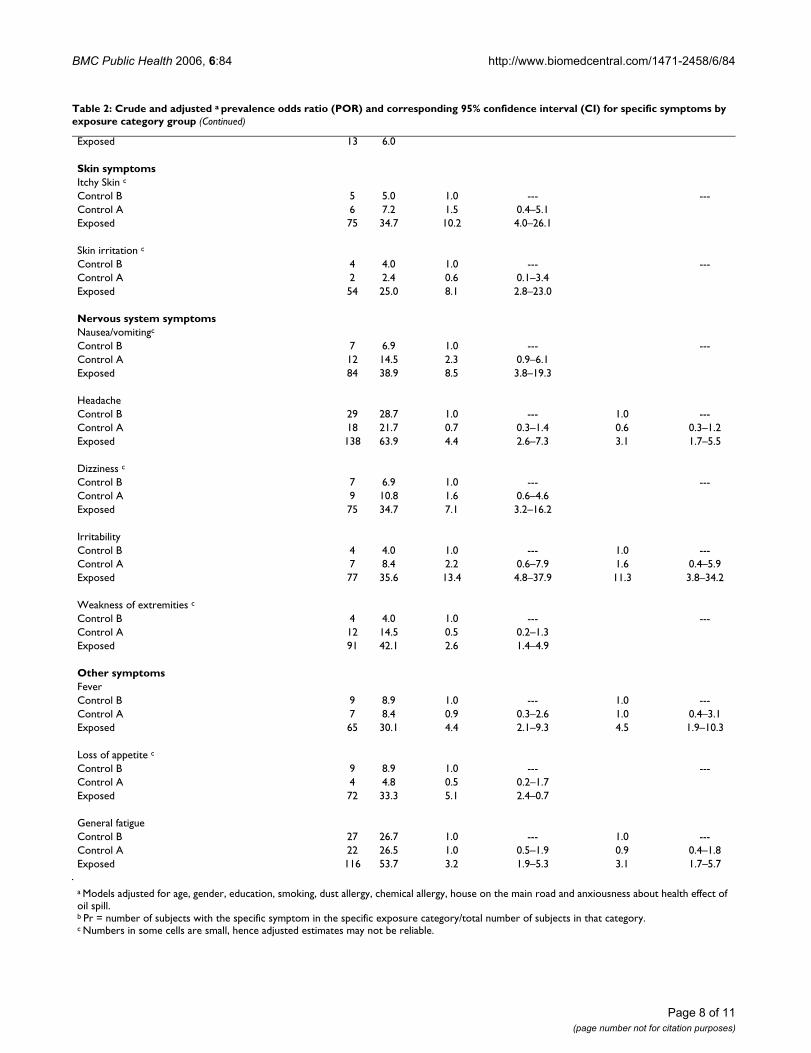
Control B 4 4.0 1.0 --- ---Control A 12 14.5 0.5 0.2–1.3Exposed 91 42.1 2.6 1.4–4.9
Other symptomsFeverControl B 9 8.9 1.0 --- 1.0 ---Control A 7 8.4 0.9 0.3–2.6 1.0 0.4–3.1Exposed 65 30.1 4.4 2.1–9.3 4.5 1.9–10.3
Loss of appetite c
Control B 9 8.9 1.0 --- ---Control A 4 4.8 0.5 0.2–1.7Exposed 72 33.3 5.1 2.4–0.7
General fatigueControl B 27 26.7 1.0 --- 1.0 ---Control A 22 26.5 1.0 0.5–1.9 0.9 0.4–1.8Exposed 116 53.7 3.2 1.9–5.3 3.1 1.7–5.7
a Models adjusted for age, gender, education, smoking, dust allergy, chemical allergy, house on the main road and anxiousness about health effect of oil spill.b Pr = number of subjects with the specific symptom in the specific exposure category/total number of subjects in that category.c Numbers in some cells are small, hence adjusted estimates may not be reliable.
Table 2: Crude and adjusted a prevalence odds ratio (POR) and corresponding 95% confidence interval (CI) for specific symptoms by exposure category group (Continued)
Page 8 of 11(page number not for citation purposes)
BMC Public Health 2006, 6:84 http://www.biomedcentral.com/1471-2458/6/84
26.8% (15/56) in control group A or 3.5% (3/86) in con-trol group B. The average number of days that the symp-tomatic subjects were not able to work was significantlyhigher among exposed group (2.9 ± 6.3) than control A(1.0 ± 3.4) or control B (0.2 ± 1.5, P < 0.001).
DiscussionThis study evaluated the acute health effects of a large oilspill on a large urban population. Subjects in the exposedarea had a higher occurrence in symptoms than otherareas in the vicinity. There was a clear pattern of decreas-ing symptoms with increasing distance from the incidentsite. Symptoms involving eyes, throat, skin, headachesand general malaise were some of the commonly reportedsymptoms.
Knowledge on the health effects of hydrocarbon expo-sures mainly comes from studies conducted in occupa-tional settings. Contact with petroleum or exposure to itscomponents may result in skin irritation and stinging orredness of eyes, sore throat, breathlessness, nausea, vom-iting headache, dizziness or drowsiness [10]. These are thesimilar symptoms as found in present study. Major hydro-carbons of toxicological interest are benzene, xylene andtoulene. Moderately high concentration of these chemi-cals irritate mucus membranes particularly the eyes [11].Sulfur containing components of crude oil may cause res-piratory difficulty [12].
High environmental level of pollutants and increasedoccurrence of headache nausea vomiting, eyes symptoms,respiratory difficulties among the exposed as compared tothe control groups suggests the role of pollutants in occur-rence of these symptoms.
The proportion of those who developed wheezing withshortness of breath was higher among the exposed ascompared to the control groups. Previous studies con-ducted to assess the health effects of oil spill reported anincrease in occurrence of sore eyes, sore throat, headache,skin itching and rash, nausea, vomiting and breathing dif-ficulties among those exposed to the vapors of crude oil[7-9,13]. The results of our study are consistent with theseresults; exposed subjects had increased frequency of soreeyes, sore throat, headache, nausea/vomiting, as com-
pared to the non-exposed group. Breathing difficultiesalso increased among the exposed group. Before oils pillthe proportion of those who ever had wheezing withshortness of breath was not different among the exposedand the control groups. Further, wheezing accompaniedwith shortness of breath is an acute condition that occursin bouts after exposure to certain substances which triggerit off. These substances in this particular casewere thecrude oil vapors. This further suggest role of exposure inoccurrence of asthmatic symptoms.
Self reported disturbance in daily routine due to symp-toms further substantiate evidence about the severity ofsymptoms that was higher among the exposed as com-pared to the non-exposed groups.
We used distance to assess the degree of exposure byselecting the exposed group form the houses located onthe shoreline, control group A at 2 km from the source ofexposure and control group B at about 20 km from thesource. The frequency of exposure as well as strength ofassociations for many symptoms decreased with theincrease in distance. The presence of dose response alsosuggests a relationship between occurrence of symptomsand exposure.
Those who were exposed for a longer period of time likewomen among the exposed group, were more likely todevelop nausea, vomiting, headache, itchy eyes, scratchythroat and sore throat as compared to men. Women spentmost of their time at homes as most of them are house-wives, while men were away during the day at their jobs,resulting in an increased exposure to women. These symp-toms occurred after exposure to hydrocarbons [10,11]. Inother studies those who were exposed for longer period oftime experienced more symptoms as compared to thosewho were exposed for lesser duration [7].
We analyzed data using two different approaches- multi-ple linear regression using symptoms score as dependentvariable and logistic regression using individual symptomas dependent variable. Both of these approaches revealedstrong association of exposure with the symptoms. Thisprovides additional strength to evidence of relationshipbetween exposure to oil spill and ill health.
Strengths and limitationsStrengths include the first study on oil spill health effectsto be reported from a developing country, the high partic-ipation rate, and collection information on confoundersand use of analytical procedure to control the effect ofconfounders.
Oil spills and other environmental disasters have beenreported to increase anxiety, distress and depression
Table 3: Multiple linear regression model of relationship between exposure status and the symptoms score
Variables β 95% CI for β
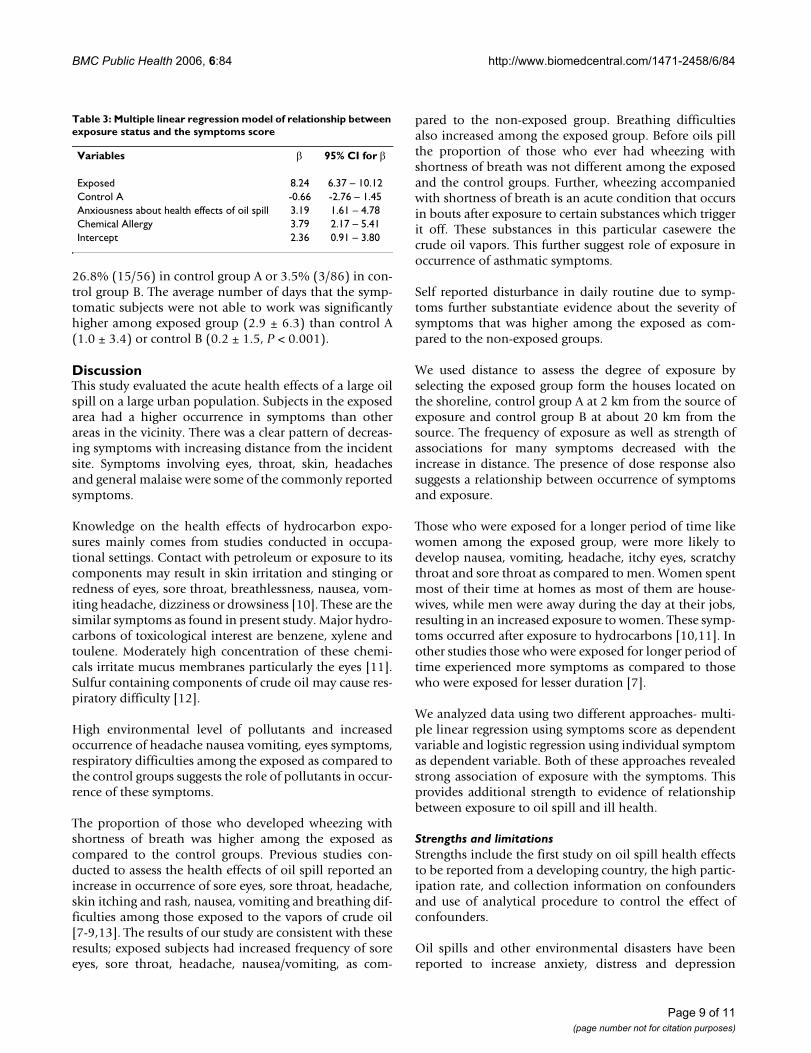
Exposed 8.24 6.37 – 10.12Control A -0.66 -2.76 – 1.45Anxiousness about health effects of oil spill 3.19 1.61 – 4.78Chemical Allergy 3.79 2.17 – 5.41Intercept 2.36 0.91 – 3.80
Page 9 of 11(page number not for citation purposes)
BMC Public Health 2006, 6:84 http://www.biomedcentral.com/1471-2458/6/84
among the exposed [14,15]. However this also dependson level of coverage by the media, concern among thepopulation and availability of means that create aware-ness and concern among the population. The populationaffected in current spill has higher educational level thanrest of Pakistan but strong civil society organizations thatcreate concerns/awareness are not present. Therefore,level of anxiety may be lesser than that have beenreportedfrom developed countries. We did not have a validatedquestionnaire to capture anxiety. However, we accountedfor anxiety using a single question on anxiousness abouteffect of oil spill on health.
Since information was based on questionnaires adminis-tered at one point in time, there is a likelihood of symp-toms being present before the spill occurred. This is theproblem due to nature of design used in such studies.However, we addressed this possibility by attempting todetermine the occurrence of symptoms related to the spe-cific date of incident. The short recall and correlation ofsymptoms with a specific exposure facilitated the accuracyof the information. Further, there was the potential forrecall bias and over-reporting of symptoms by theexposed group because exposed group may become anx-ious about their health and work. We addressed thepotential problem of differential recall by eliciting infor-mation on anxiousness about health due to oil spill andadjusting for this in analysis.
Sample size was based on the availability of funds for con-ducting this investigation rather than statistical considera-tions. This has resulted in smaller number of participantsin the study that is reflected in our results with small num-bers for some variables and resulting wide confidenceintervals.
We used three different geographic locations to representdistance form the source of exposure to assign exposurestatus; this is a crude exposure measurement. Environ-mental levels of pollutants or biomonitoring could haveprovided better exposure assessment. However, sinceexposure was only from one source; distance from thesource represents adequate proxy for exposure.
ConclusionThis study shows a possible relationship between the oilspill and acute symptoms among residents near the spill,indicating an adverse effect on their health. Efforts shouldbe devoted to prevent future occurrence of such incidentsthrough instituting an emergency response and prepared-ness system. Long term health impact of the crude oil spillexposure should be investigated.
Competing interestsThe author(s) declare that they have no competing inter-ests.
Authors' contributionsNZJ conceived the idea, designed the study, did analysisand prepared the manuscript. PMK, HN, SZF, UBK, NH,SNJ, SL and MMK contributed in design and conduct ofstudy. PMK, MMK, NS contributed in manuscript prepara-tion and revisions. All authors read and approved the finalversion of manuscript.
Additional material
AcknowledgementsThe authors gratefully acknowledge the enthusiasm and cooperation of par-ticipants. The funds for this investigation came from the Community Health Sciences department, Aga Khan University and by International Training and Research in Environmental and Occupational Health grant # 5D43TW05750 from the Fogarty International Centre at the National Institute of Health. Shahid Lutfi is LEAD associate under Cohort 10 of LEAD Associate Programme.
References1. Pakistan tackles huge oil spill BBC World Edition [http://
news.bbc.co.uk/2/hi/south_asia/3153071.stm].2. Bhattacharya S: Wind worsens Pakistan oil spill. Internet [http:/
/www.newscientist.com/news/news.jsp?id=ns99994077].3. Centre ET: Spills Technology Databases , Oil Properties Data-
base. Environmental Technology Centre, Enviornment Canada;2005.
4. The International Tanker Owners Pollution Federation Limited: Fateof marine oil spills. In Technical Information Paper London , TheInternational Tanker Owners Pollution Federation Limited; 2002.
5. The Weather Underground I: History for weather in Karachi,Pakistan. The Weather Underground, Inc.; 2003.
7. Morita A, Kusaka Y, Deguchi Y, Moriuchi A, Nakanaga Y, Iki M, Miya-zaki S, Kawahara K: Acute health problems among the peopleengaged in the cleanup of the Nakhodka oil spill. Environ Res1999, 81(3):185-194.
8. Lyons RA, Temple JM, Evans D, Fone DL, Palmer SR: Acute healtheffects of the Sea Empress oil spill. J Epidemiol Community Health1999, 53(5):306-310.
9. Campbell D, Cox D, Crum J, Foster K, Christie P, Brewster D: Initialeffects of the grounding of the tanker Braer on health inShetland. The Shetland Health Study Group. Bmj 1993,307(6914):1251-1255.
10. Park JMHMG: Occupational health aspect of marine oil spill.Pure Appl Chem 1999, 71(1):113-133.
11. MacFarland HN: Toxicology of petroleum hydrocarbons. OccupMed; State Art Reviews 1988, 3:445-454.
12. Mehlman MA: Dangerous and cancer causing properties ofproducts and chemicals in oil refining and petrochemical
Additional File 1The file contain questionnaire in MS word format used in the study to col-lect information from the study participants.Click here for file[http://www.biomedcentral.com/content/supplementary/1471-2458-6-84-S1.doc]
Page 10 of 11(page number not for citation purposes)
BMC Public Health 2006, 6:84 http://www.biomedcentral.com/1471-2458/6/84
Publish with BioMed Central and every scientist can read your work free of charge
"BioMed Central will be the most significant development for disseminating the results of biomedical research in our lifetime."
Sir Paul Nurse, Cancer Research UK
Your research papers will be:
available free of charge to the entire biomedical community
peer reviewed and published immediately upon acceptance
cited in PubMed and archived on PubMed Central
yours — you keep the copyright
Submit your manuscript here:http://www.biomedcentral.com/info/publishing_adv.asp
BioMedcentral
industry. Part VII. Adverse health effects and toxic manifes-tations caused by exposure to hydrogen sulfide, a compo-nent of crude oil. In Hazards and Riska in oil Refining Induatry,Advances in Modern Environmental Txicology Volume XXIII. Edited by:Mehlman MAUA. Princeton, NJ , Princeton Scientific Publishing Co.;1994:321-340.
13. Crum JE: Peak expiratory flow rate in schoolchildren livingclose to Braer oil spill. Bmj 1993, 307(6895):23-24.
14. Dayal HH, Baranowski T, Li YH, Morris R: Hazardous chemicals:psychological dimensions of the health sequelae of a commu-nity exposure in Texas. J Epidemiol Community Health 1994,48(6):560-568.
15. Palinkas LA, Petterson JS, Russell J, Downs MA: Community pat-terns of psychiatric disorders after the Exxon Valdez oil spill.Am J Psychiatry 1993, 150(10):1517-1523.
Pre-publication historyThe pre-publication history for this paper can be accessedhere: