Page 1
Energy Procedia 65 ( 2015 ) 170 – 179
Available online at www.sciencedirect.com
ScienceDirect
1876-6102 © 2015 The Authors. Published by Elsevier Ltd. This is an open access article under the CC BY-NC-ND license
(http://creativecommons.org/licenses/by-nc-nd/4.0/).
Peer-review under responsibility of the Scientific Committee of EBTKE ConEx 2014
doi: 10.1016/j.egypro.2015.01.054
Conference and Exhibition Indonesia - New, Renewable Energy and Energy Conservation
(The 3rd
Indo-EBTKE ConEx 2014)
A Comparison of Life Cycle Assessment on Oil Palm
(Elaeis guineensis Jacq.) and Physic nut (Jatropha curcas Linn.) as
Feedstock for Biodiesel Production in Indonesia
Kiman Siregara, Armansyah H.Tambunan
b*,Abdul K.Irwanto
c,
Soni S.Wirawand, Tetsuya Araki
e
aDepartment of Agricultural Engineering of Syiah Kuala University, Jl.Tgk.Hasan Krueng Kalee No.3 Kopelma, Banda Aceh 23111, Indonesia bGraduate School of Agricultural Engineering of Bogor Agricultural University, Po Box 220 Kampus Darmaga, Bogor 16002, Indonesia
cGraduate School of Management of Bogor Agricultural University, Kampus Darmaga 16002, Indonesia dEnergy Technology Centre-BPPT, Kawasan Puspitek Serpong Gd.620/B2TE Setu 15314, Tangerang Selatan, Indonesia
eGraduate School of Agriculture and Life Science of The University of Tokyo,1-1-1 Yayoi Bunkyo Ward Tokyo 113-8657, Japan
Abstract
The objective of this study was to perform and compare LCA of biodiesel production from crude palm oil and crude Jatropha
curcas oil. The system boundary for LCA study from cradle to gate. The produced palm oil biodiesel has higher GWP value than
Jatropha curcas biodiesel. Utilization of agrochemical, in form of fertilizer and plant protection, generate significant contribution
to environmental impact of biodiesel production i.e. 50.46 % and 33.51 % for palm oil and Jatropha curcas oil, respectively.
GWP emission up to five years of plantation is 1 695.36 kg-CO2eq./t-BDF and 740.90 kg-CO2eq./t-BDF for palm oil and
Jatropha curcas, respectively. After production stabilised, CO2 emission of diesel fuel decreases up to 37.83 % and 63.61 % for
BDF-CPO and BDF-CJCO, respectively.
© 2015 K.Siregar, A.H.Tambunan, A.K.Irwanto, S.S.Wirawan, T.Araki. Published by Elsevier Ltd.
Peer-review under responsibility of the Scientific Committee of EBTKE ConEx 2014.
Keywords: Crude palm oil, crude Jatropha curcas oil, life cycle assessment, biodiesel fuel, Elaeis guineensis Jacq.
* Corresponding author. Tel.: +62 813 9909 6367; fax: +62 251 862 3026.
E-mail address: [email protected]
© 2015 The Authors. Published by Elsevier Ltd. This is an open access article under the CC BY-NC-ND license
(http://creativecommons.org/licenses/by-nc-nd/4.0/).
Peer-review under responsibility of the Scientific Committee of EBTKE ConEx 2014
Page 2
Kiman Siregar et al. / Energy Procedia 65 ( 2015 ) 170 – 179 171
Nomenclature
BDF biodiesel fuel LCA life cycle assessment
CPO crude palm oil LCI life cycle inventory
CJCO crude Jatropha curcas oil LCIA life cycle impact assessment
FU functional unit L litre
FFA free fatty acid mo month
GWP global warming potential t ton, 1 t = 103 kg
GHG green house gas y year
1. Introduction
As an agrarian country and the world's largest producer of palm oil, Indonesia has huge potential to utilize
renewable energy as their energy resource, particularly biodiesel. Energy security is a very important condition to be
taken into consideration for any country, including Indonesia. This condition is important to ascertain a sustainable
development. Although biodiesel is claimed as a renewable energy, along the process chain it often uses
agrochemical materials and other non-renewable resources. This condition may resulted in pollution during
biodiesel production process.
Life cycle assessment (LCA) is a systematic tool to assess the environmental impacts associated with any
products, processes and activities [1,2], which is standardized in ISO 14000 series. Life cycle inventory (LCI) is one
of the four steps in the LCA, which plays a very important role in conducting the assessment. The result of LCA is
highly influenced by the reliability and sufficiency of data inventory of the assessed object. In Indonesia case, data
accessibility which will be used in LCA is still very limited. Data collection process is the main focus in inventory
analysis and the most time-consuming process of all LCA process [3]. A number of LCA studies on biodiesel
production using feedstock from Indonesia has been conducted. However, results discrepancy generated in the
studies are due to inconsistency of the data used. With regard to this, continuous studies are still needed to identify
and approach existing condition of palm oil and jatropha curcas plantation in Indonesia.
The main feedstock for biodiesel production in Indonesia is oil palm (Elaeis guineensis Jacq.), since Indonesia is
the main producer of palm oil in the world. However, the Indonesian government has identified that physic nut can
be utilized for biodiesel feedstock as well. Physic nut (Jatropha curcas Linn.) is a non-edible industrial crop for
biodiesel fuel production. As such, it is considered as an alternative source of energy or fuel [4]. Although edible oil
crops are the main feedstock for biodiesel fuel, the possibility of non-edible crops should be further investigated to
avoid conflicts between crops utilization for food or biodiesel fuel. The objective of this study is to perform and
compare life cycle assessment of biodiesel production from crude palm oil (CPO) and crude Jatropha curcas oil
(CJCO).
2. Material and method
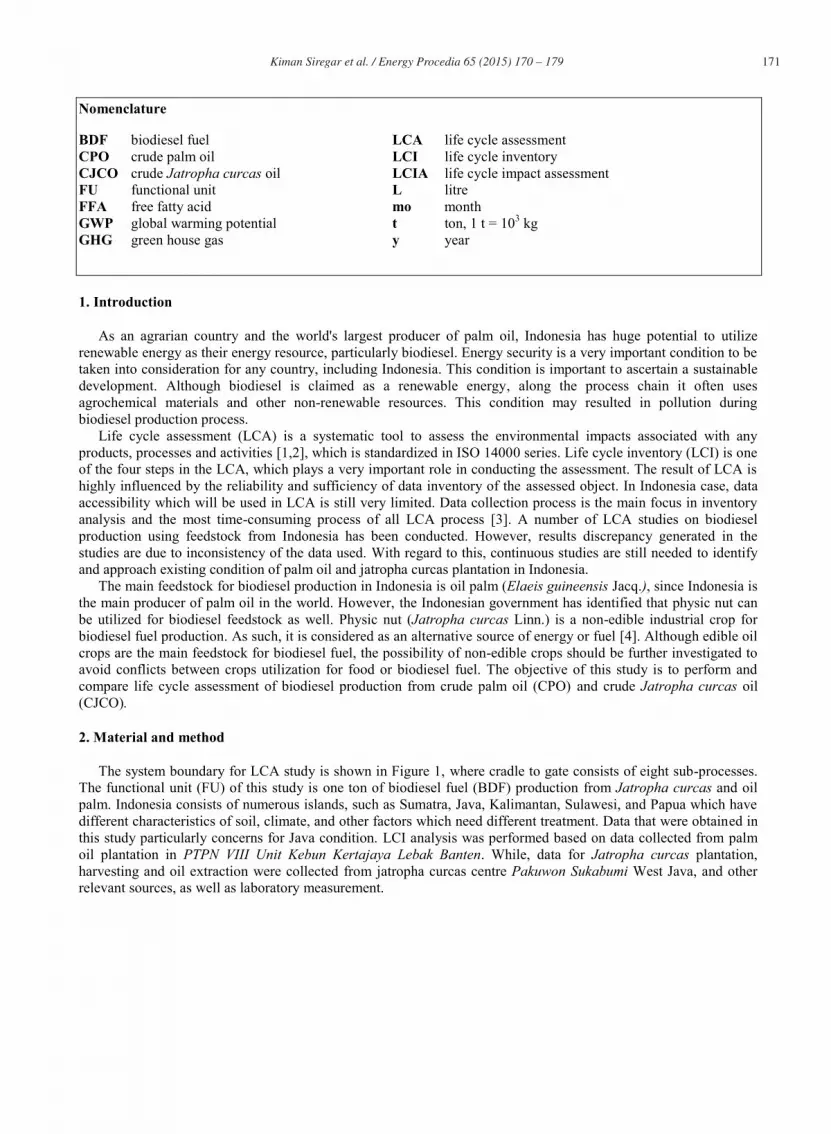
The system boundary for LCA study is shown in Figure 1, where cradle to gate consists of eight sub-processes.
The functional unit (FU) of this study is one ton of biodiesel fuel (BDF) production from Jatropha curcas and oil
palm. Indonesia consists of numerous islands, such as Sumatra, Java, Kalimantan, Sulawesi, and Papua which have
different characteristics of soil, climate, and other factors which need different treatment. Data that were obtained in
this study particularly concerns for Java condition. LCI analysis was performed based on data collected from palm
oil plantation in PTPN VIII Unit Kebun Kertajaya Lebak Banten. While, data for Jatropha curcas plantation,
harvesting and oil extraction were collected from jatropha curcas centre Pakuwon Sukabumi West Java, and other
relevant sources, as well as laboratory measurement.
Page 3
172 Kiman Siregar et al. / Energy Procedia 65 ( 2015 ) 170 – 179
Cradle to gate
Land
preparationPlanting Harvesting
Palm oil
mills/
Extraction
biodiesel
plant 1 ton
BDF
kernel
CPO/
CJCOFFB/ fruit
of jatropha
shell
empty fruit bunches/
empaty branch
fibers/skin fruit
Palm ready
to harvest
Seedling
Land ready
to planted
Se
ed
Fertilizing
Protection
fert
ilize
r
Pe
sticid
es
&H
erb
icid
es
Emision (E) (E) (E) (E) (E)
(E)
(E)
(E)
Mass, energy
Tra
ns
po
rta
tio
n(T
)
TT
T
T
Mass, energy Mass, energy
Mass, energy
Mass, energy Mass, energyMass, energy Mass, energy
Fig.1. The system boundary of this study
Life cycle inventory analysis was performed on the material and energy inputs, air emission, waterborne
emission, and solid wastes involved in biodiesel production. Each stage of analysis and calculations was carried out
before and after plants yield. Based on field survey, it can be assumed that oil palm and Jatropha curcas will have
stable productivity from the 5th
y onward. The first production of oil palm occurs at 30 mo old while Jatropha
curcas at 4 mo.
Transportation from seedling to plantation area, plantation to palm oil mills, palm oil mills to biodiesel plant was
also considered in this study. The distance of transportation (a central point at the palm oil mills at Kertajaya Lebak
Banten and central of Jatropha curcas center Pakuwon Sukabumi), the capacity and diesel fuel ratio of each path are
as follow: i) from nurseries to land: 30 km, 5 t per truck, 1: 5 (1 L for 5 km); ii) from harvesting to palm oil mills:
150 km, 10 t per truck, 1: 7; iii) from palm oil mils to biodiesel mill (at Bekasi): 200 km, 10 t per truck.
3. Result and discussion
3.1. Life cycle inventory
The result analysis of LCI consists of input-output mass and energy as shown in Figure 1. The description of
eight sub-processes involved in LCI for oil palm and Jatropha curcas is shown in Table 1. Comparison of material
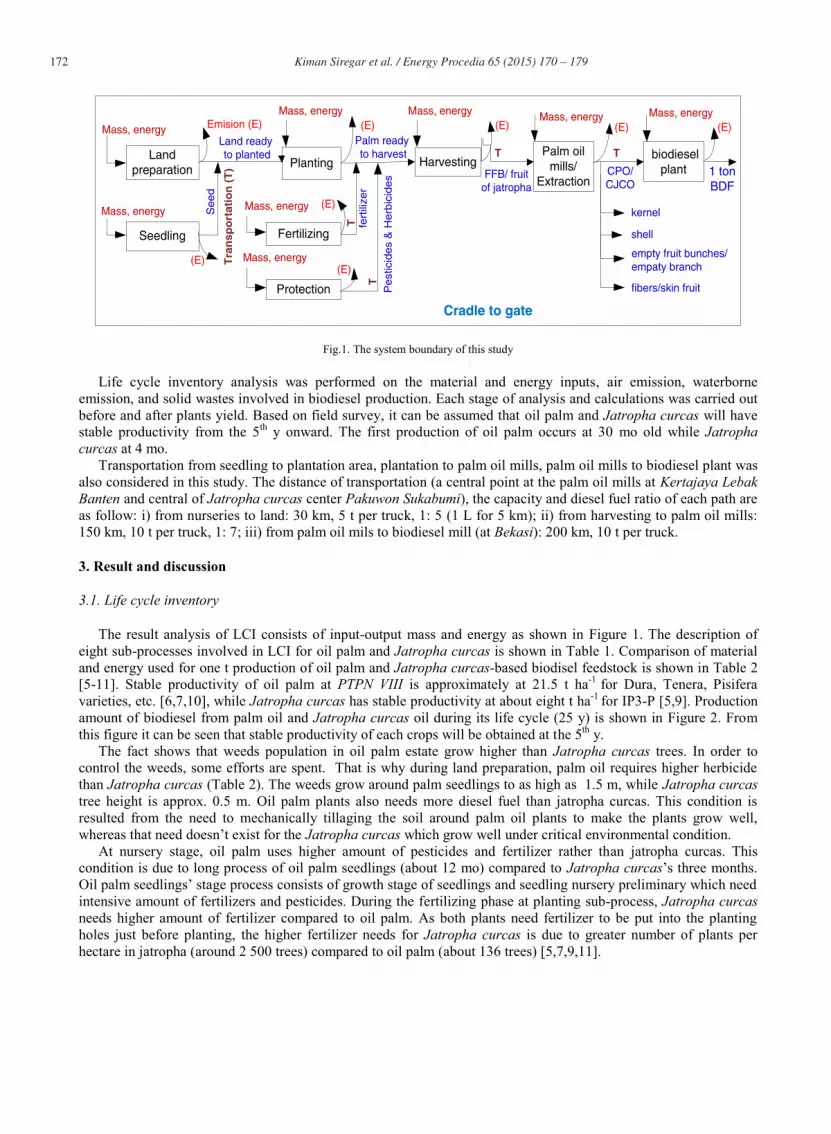
and energy used for one t production of oil palm and Jatropha curcas-based biodisel feedstock is shown in Table 2
[5-11]. Stable productivity of oil palm at PTPN VIII is approximately at 21.5 t ha-1
for Dura, Tenera, Pisifera
varieties, etc. [6,7,10], while Jatropha curcas has stable productivity at about eight t ha-1
for IP3-P [5,9]. Production
amount of biodiesel from palm oil and Jatropha curcas oil during its life cycle (25 y) is shown in Figure 2. From
this figure it can be seen that stable productivity of each crops will be obtained at the 5th
y.
The fact shows that weeds population in oil palm estate grow higher than Jatropha curcas trees. In order to
control the weeds, some efforts are spent. That is why during land preparation, palm oil requires higher herbicide
than Jatropha curcas (Table 2). The weeds grow around palm seedlings to as high as 1.5 m, while Jatropha curcas
tree height is approx. 0.5 m. Oil palm plants also needs more diesel fuel than jatropha curcas. This condition is
resulted from the need to mechanically tillaging the soil around palm oil plants to make the plants grow well,
whereas that need doesn’t exist for the Jatropha curcas which grow well under critical environmental condition.
At nursery stage, oil palm uses higher amount of pesticides and fertilizer rather than jatropha curcas. This
condition is due to long process of oil palm seedlings (about 12 mo) compared to Jatropha curcas’s three months.
Oil palm seedlings’ stage process consists of growth stage of seedlings and seedling nursery preliminary which need
intensive amount of fertilizers and pesticides. During the fertilizing phase at planting sub-process, Jatropha curcas
needs higher amount of fertilizer compared to oil palm. As both plants need fertilizer to be put into the planting
holes just before planting, the higher fertilizer needs for Jatropha curcas is due to greater number of plants per
hectare in jatropha (around 2 500 trees) compared to oil palm (about 136 trees) [5,7,9,11].
Page 4
Kiman Siregar et al. / Energy Procedia 65 ( 2015 ) 170 – 179 173
Table 1. The comparison of biodiesel production from CPO and CJCO with boundary cradle to gate
Input activities Component Oil palm Jatropha curcas
(1) Land preparation
Early land uses Prime forest Coarse grass forest
Soil fertility Fertile Less fertile
Tree, diameter > 60 cm 26 to100 trees ha-1 No trees Tree, diameter > 30 cm Approx. 2 500 trees ha-1 Approx. 500 trees ha-1
Coarse grass (10 to 30) groups m-2 (10 to 30) groups m-2
Soil tillage Effective soil depth (50 to 150) cm Effective soil depth (20 to 30) cm Plant above the soil surface Nuts No plants, usually
(2) Seedling Seedling time 12 mo 3 mo
Seedling source Seed Seed, steck
(3) Planting Plants width space 9 m × 9 m × 9 m 2 m × 2 m × 2 m Number of plants 136 ha-1 2 500 ha-1
Number of hole 50 cm × 40 cm × 40 cm 40 cm × 40 cm × 40 cm
(4) Fertilizing Fertilizer compound N,P,K,Mg,B, organic fertilizer N,P,K, organic fertilizer
Intensity Very intensive Scarcely conducted
(5) Protection Plant pest Many kinds of pest presents Almost not present
(6) Harvesting
Start to produce 30 mo 4 mo
Production on stable productivity 8 t.seed ha-1 21.5 t.FFB ha-1 Edible/non-edible Edible Non-edible
(7) Palm oil
mills or
Extraction oil
Production of crude oil By milling By extraction
Value of FFA < 2 > 2
Produced biomass Empty bunch, fruit fiber, shell, palm kernel Kernel pulp, shell, jatropha oil cake
(8) Biodiesel
production
Reaction of biodiesel production Transesterification Esterification and transesterification
Ratio of crude oil to BDF 92 % 91 %
Biodiesel source Pulp, kernel Kernel Catalyst Alkali Acid and alkali
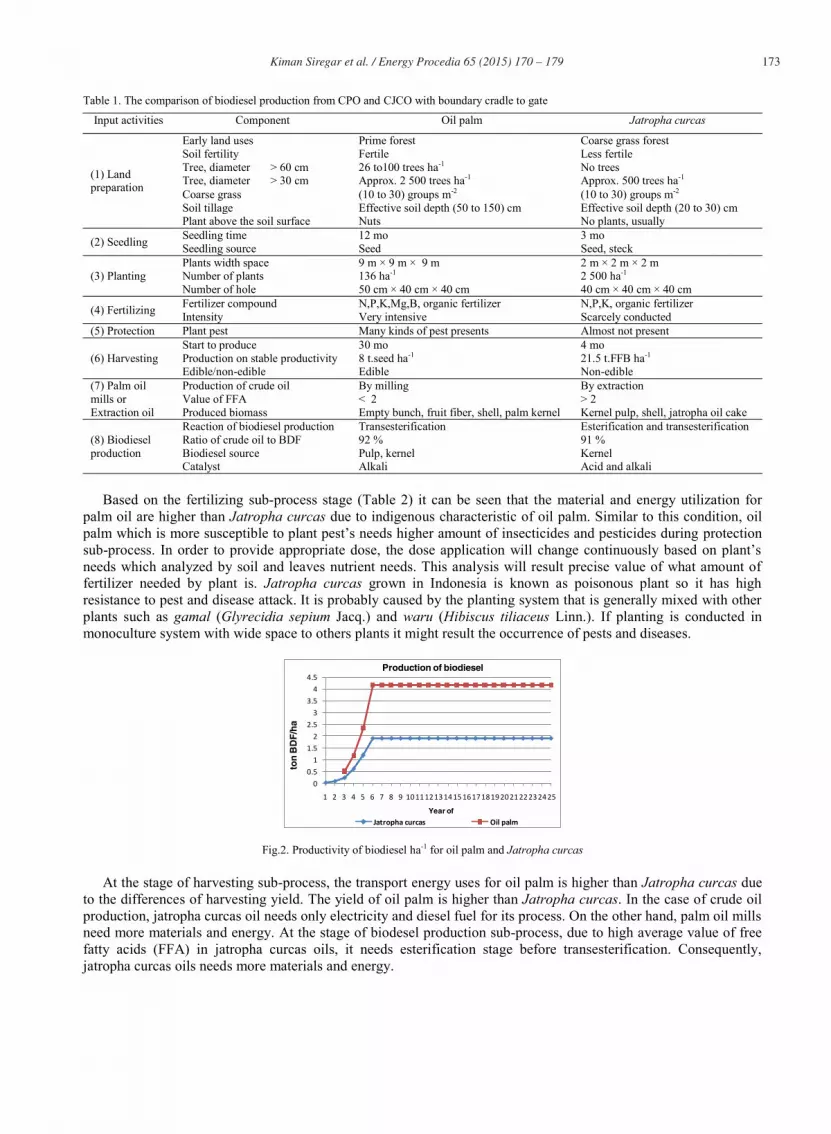
Based on the fertilizing sub-process stage (Table 2) it can be seen that the material and energy utilization for
palm oil are higher than Jatropha curcas due to indigenous characteristic of oil palm. Similar to this condition, oil
palm which is more susceptible to plant pest’s needs higher amount of insecticides and pesticides during protection
sub-process. In order to provide appropriate dose, the dose application will change continuously based on plant’s
needs which analyzed by soil and leaves nutrient needs. This analysis will result precise value of what amount of
fertilizer needed by plant is. Jatropha curcas grown in Indonesia is known as poisonous plant so it has high
resistance to pest and disease attack. It is probably caused by the planting system that is generally mixed with other
plants such as gamal (Glyrecidia sepium Jacq.) and waru (Hibiscus tiliaceus Linn.). If planting is conducted in
monoculture system with wide space to others plants it might result the occurrence of pests and diseases.
0
0.5
1
1.5
2
2.5
3
3.5
4
4.5
1 2 3 4 5 6 7 8 9 10 111213 1415 1617 1819 2021 222324 25
Jatropha curcas Oil palm
ton
BD
F/h
a
Production of biodiesel
Year of
Fig.2. Productivity of biodiesel ha-1 for oil palm and Jatropha curcas
At the stage of harvesting sub-process, the transport energy uses for oil palm is higher than Jatropha curcas due
to the differences of harvesting yield. The yield of oil palm is higher than Jatropha curcas. In the case of crude oil
production, jatropha curcas oil needs only electricity and diesel fuel for its process. On the other hand, palm oil mills
need more materials and energy. At the stage of biodesel production sub-process, due to high average value of free
fatty acids (FFA) in jatropha curcas oils, it needs esterification stage before transesterification. Consequently,
jatropha curcas oils needs more materials and energy.
Page 5
174 Kiman Siregar et al. / Energy Procedia 65 ( 2015 ) 170 – 179
Table 2. Materials and energy for 1 t BDF from Jatropha curcas and oil palm
Input activities Input names Unit Oil palm Jatropha curcas
(1) Land preparation
Herbicide kg 0.86 0.63
Diesel fuel for toppling and clearing L 0.703 1.21
(2) Seedling
Fungicides kg - 0.85
Insecticides kg 2.0 × 10⁻⁴ 0.006 Chemical fertilizer Urea 0.2 % kg 4.9 × 10⁻⁴ -
Organic fertilizer kg 8.37 9.38
Kieserite (MgSO4) kg 2.01 - Urea kg 7.0 × 10⁻⁵ -
Herbicide kg 0.97 -
Dolomite kg 2.95 - Compound fertilizer kg 4.69 -
Electricity for Pump Water kWh 0.44 -
Pesticides kg 0.004 -
Transportation Diesel fuel for truck 5 t L 1.004 1.19
(3) Planting
TSP/SP36 kg 13.39 79.56
Organic fertilizer kg - 994.52 Rock Phosphate kg 22.39 -
KCl kg - 15.91
(4) Fertilizing for five years
Compound fertilizer kg 9.84
Rock Phosphate kg 252.49 ZA/Urea kg 279.46 87.52
HGF Borate kg 6.68
TSP/SP36 kg 117.14 278.47 MOP/KCl kg 245.99 95.47
Kieserit kg 184.08 Organic fertilizer kg - 994.52
(5) Protection for five years
Herbicides kg 56.317
Insecticides (liquid and powder) kg 1.323
Pesticides kg 0.81 2.96
Diesel for power sprayer and fogging L 0.554
(6) Harvesting (Transportation) Diesel fuel for truck 10 t L 5.03 2.47
(7) Palm oil mills vs Oil extraction
Electricity kWh 34.39 14.83
Steam consumption kg 1 325.39 - Water consumption m3 3.97 -
PAC kg 0.13 -
Flokulon kg 5.0 × 10⁻⁴ - NaOH kg 0.107 -
H2SO4/HCl kg 0.109 -
Tanin Consentrate kg 0.045 - Poly Perse BWT 302 kg 0.045 -
Alkaly BWT 402 kg 0.043 -
Shell consumption kg 133.86 - Transportation Diesel fuel for truck 10 t L 2.54 1.89
(8) Biodiesel production Methanol t - 0.45
Esterification H2SO4 t - 0.03 Electricity kWh - 1.29
Transesterification
Methanol t 0.27 -
Electricity kWh 15.65 15.65 NaOH t 0.08 0.08
Water consumption L 1 700.68 1 719.18
Diesel fuel for Boiler L 14.00 16.00
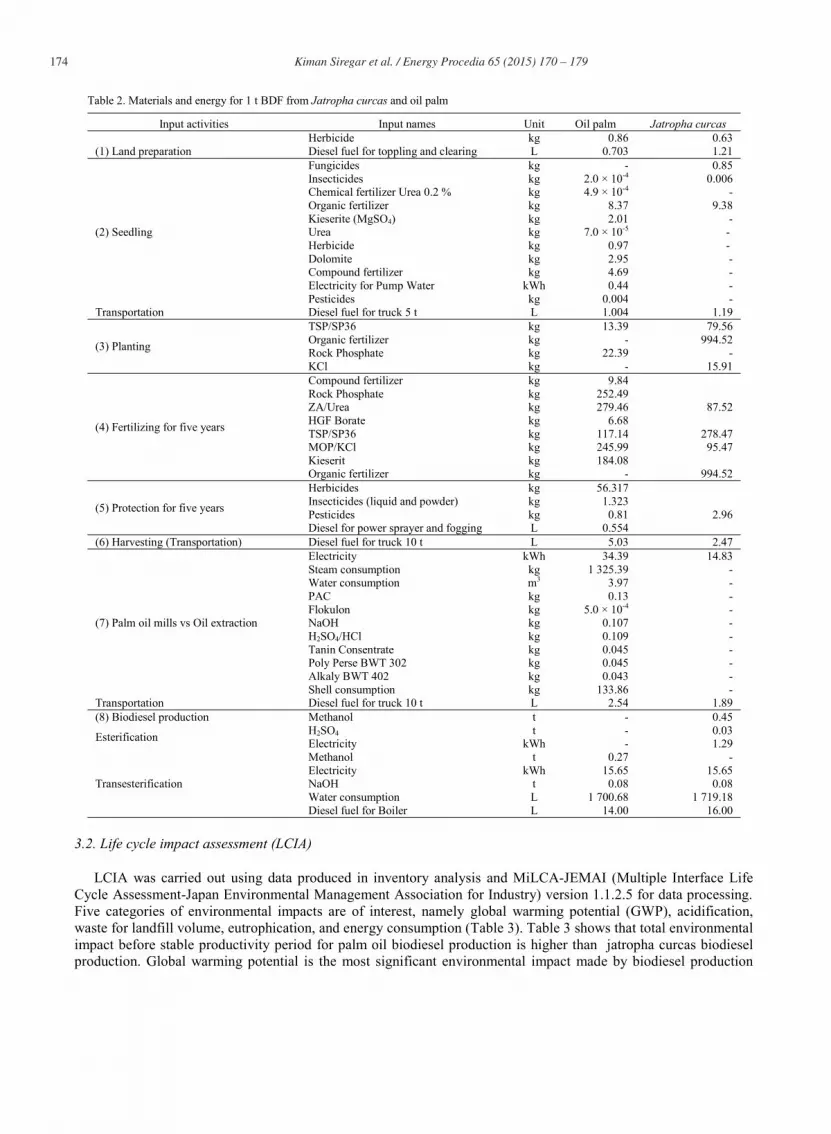
3.2. Life cycle impact assessment (LCIA)
LCIA was carried out using data produced in inventory analysis and MiLCA-JEMAI (Multiple Interface Life
Cycle Assessment-Japan Environmental Management Association for Industry) version 1.1.2.5 for data processing.
Five categories of environmental impacts are of interest, namely global warming potential (GWP), acidification,
waste for landfill volume, eutrophication, and energy consumption (Table 3). Table 3 shows that total environmental
impact before stable productivity period for palm oil biodiesel production is higher than jatropha curcas biodiesel
production. Global warming potential is the most significant environmental impact made by biodiesel production
Page 6
Kiman Siregar et al. / Energy Procedia 65 ( 2015 ) 170 – 179 175
10.9 12.8
204.4
511.3
69.68.3 18.6
897.8
0
100
200
300
400
500
600
700
800
900
1000
Global Warming Potential
100-year GWP (IPCC,2007) of Jatropha curcas
Land
preparation
Seedling
Planting
Fertilizing
Protection
Harvesting
Palm oil
mills
Biodiesel
production
kg
-CO
2eq
./to
nB
DF
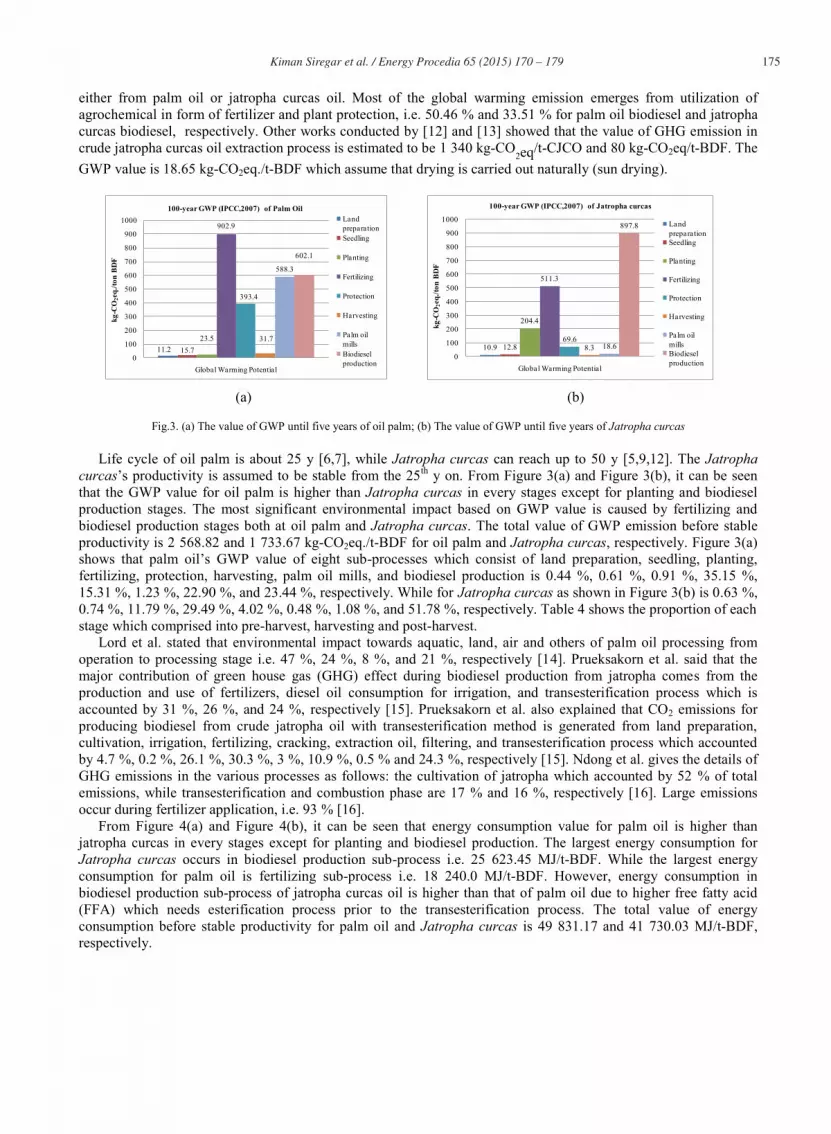
either from palm oil or jatropha curcas oil. Most of the global warming emission emerges from utilization of
agrochemical in form of fertilizer and plant protection, i.e. 50.46 % and 33.51 % for palm oil biodiesel and jatropha
curcas biodiesel, respectively. Other works conducted by [12] and [13] showed that the value of GHG emission in
crude jatropha curcas oil extraction process is estimated to be 1 340 kg-CO2eq/t-CJCO and 80 kg-CO2eq/t-BDF. The
GWP value is 18.65 kg-CO2eq./t-BDF which assume that drying is carried out naturally (sun drying).
11.2 15.7
23.5
902.9
393.4
31.7
588.3
602.1
0
100
200
300
400
500
600
700
800
900
1000
Global Warming Potential
100-year GWP (IPCC,2007) of Palm Oil
Land
preparation
Seedling
Planting
Fertilizing
Protection
Harvesting
Palm oil
mills
Biodiesel
production
kg
-CO
2eq
./to
nB
DF
(a) (b)
Fig.3. (a) The value of GWP until five years of oil palm; (b) The value of GWP until five years of Jatropha curcas
Life cycle of oil palm is about 25 y [6,7], while Jatropha curcas can reach up to 50 y [5,9,12]. The Jatropha
curcas’s productivity is assumed to be stable from the 25th
y on. From Figure 3(a) and Figure 3(b), it can be seen
that the GWP value for oil palm is higher than Jatropha curcas in every stages except for planting and biodiesel
production stages. The most significant environmental impact based on GWP value is caused by fertilizing and
biodiesel production stages both at oil palm and Jatropha curcas. The total value of GWP emission before stable
productivity is 2 568.82 and 1 733.67 kg-CO2eq./t-BDF for oil palm and Jatropha curcas, respectively. Figure 3(a)
shows that palm oil’s GWP value of eight sub-processes which consist of land preparation, seedling, planting,
fertilizing, protection, harvesting, palm oil mills, and biodiesel production is 0.44 %, 0.61 %, 0.91 %, 35.15 %,
15.31 %, 1.23 %, 22.90 %, and 23.44 %, respectively. While for Jatropha curcas as shown in Figure 3(b) is 0.63 %,
0.74 %, 11.79 %, 29.49 %, 4.02 %, 0.48 %, 1.08 %, and 51.78 %, respectively. Table 4 shows the proportion of each
stage which comprised into pre-harvest, harvesting and post-harvest.
Lord et al. stated that environmental impact towards aquatic, land, air and others of palm oil processing from
operation to processing stage i.e. 47 %, 24 %, 8 %, and 21 %, respectively [14]. Prueksakorn et al. said that the
major contribution of green house gas (GHG) effect during biodiesel production from jatropha comes from the
production and use of fertilizers, diesel oil consumption for irrigation, and transesterification process which is
accounted by 31 %, 26 %, and 24 %, respectively [15]. Prueksakorn et al. also explained that CO2 emissions for
producing biodiesel from crude jatropha oil with transesterification method is generated from land preparation,
cultivation, irrigation, fertilizing, cracking, extraction oil, filtering, and transesterification process which accounted
by 4.7 %, 0.2 %, 26.1 %, 30.3 %, 3 %, 10.9 %, 0.5 % and 24.3 %, respectively [15]. Ndong et al. gives the details of
GHG emissions in the various processes as follows: the cultivation of jatropha which accounted by 52 % of total
emissions, while transesterification and combustion phase are 17 % and 16 %, respectively [16]. Large emissions
occur during fertilizer application, i.e. 93 % [16].
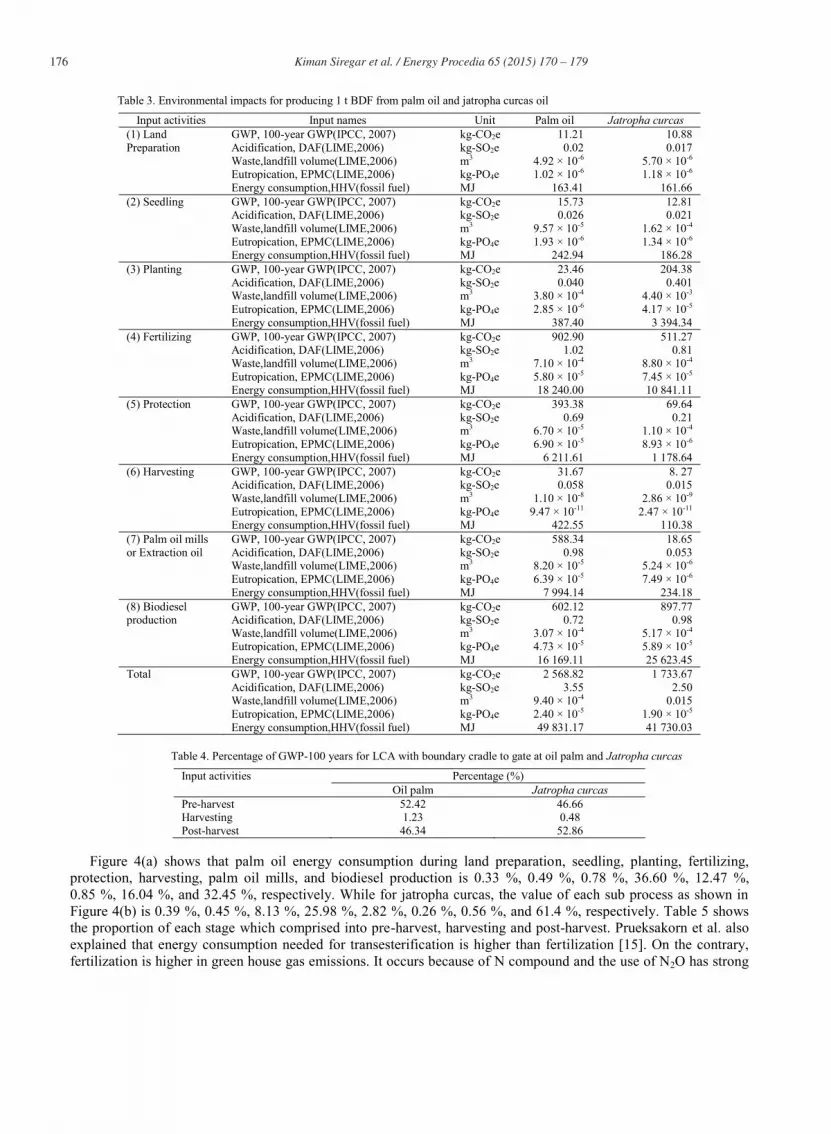
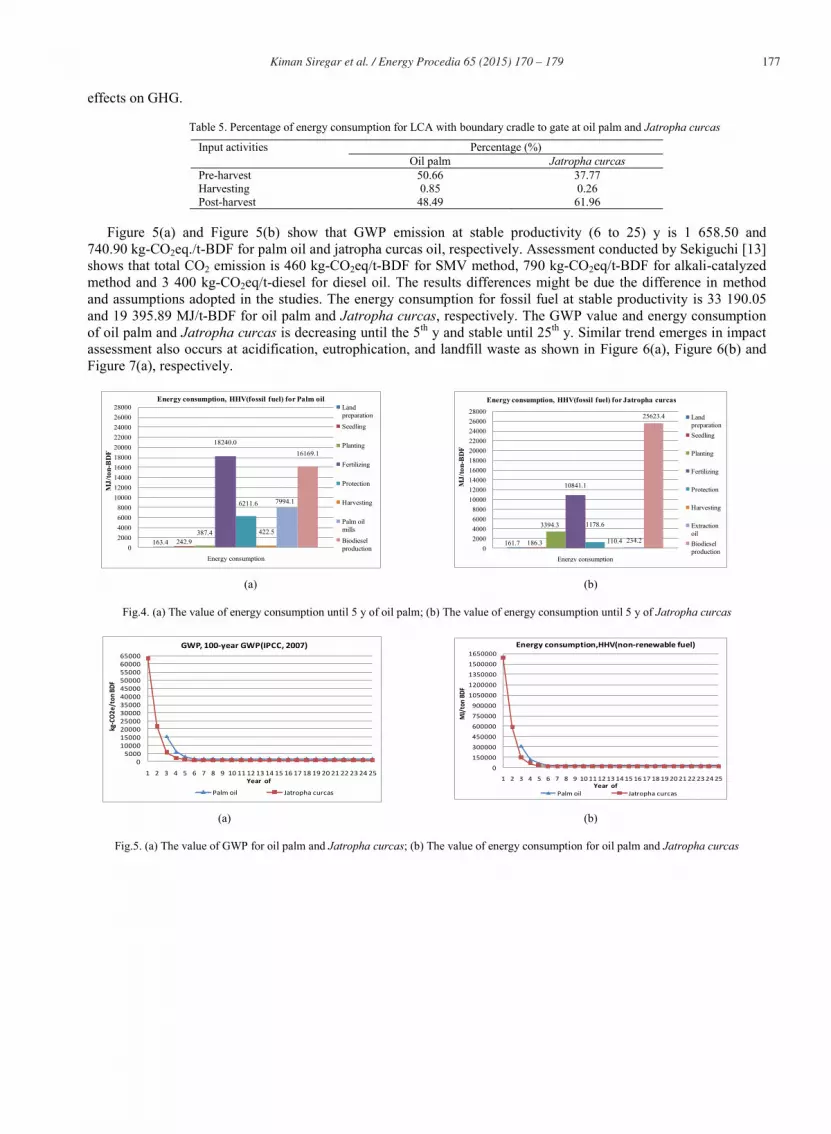
From Figure 4(a) and Figure 4(b), it can be seen that energy consumption value for palm oil is higher than
jatropha curcas in every stages except for planting and biodiesel production. The largest energy consumption for
Jatropha curcas occurs in biodiesel production sub-process i.e. 25 623.45 MJ/t-BDF. While the largest energy
consumption for palm oil is fertilizing sub-process i.e. 18 240.0 MJ/t-BDF. However, energy consumption in
biodiesel production sub-process of jatropha curcas oil is higher than that of palm oil due to higher free fatty acid
(FFA) which needs esterification process prior to the transesterification process. The total value of energy
consumption before stable productivity for palm oil and Jatropha curcas is 49 831.17 and 41 730.03 MJ/t-BDF,
respectively.
Page 7
176 Kiman Siregar et al. / Energy Procedia 65 ( 2015 ) 170 – 179
Table 3. Environmental impacts for producing 1 t BDF from palm oil and jatropha curcas oil
Input activities Input names Unit Palm oil Jatropha curcas
(1) Land
Preparation
GWP, 100-year GWP(IPCC, 2007) kg-CO2e 11.21 10.88
Acidification, DAF(LIME,2006) kg-SO2e 0.02 0.017
Waste,landfill volume(LIME,2006) m3 4.92 × 10⁻⁶ 5.70 × 10⁻⁶ Eutropication, EPMC(LIME,2006) kg-PO4e 1.02 × 10⁻⁶ 1.18 × 10⁻⁶
Energy consumption,HHV(fossil fuel) MJ 163.41 161.66
(2) Seedling GWP, 100-year GWP(IPCC, 2007) kg-CO2e 15.73 12.81 Acidification, DAF(LIME,2006) kg-SO2e 0.026 0.021
Waste,landfill volume(LIME,2006) m3 9.57 × 10⁻⁵ 1.62 × 10⁻⁴
Eutropication, EPMC(LIME,2006) kg-PO4e 1.93 × 10⁻⁶ 1.34 × 10⁻⁶ Energy consumption,HHV(fossil fuel) MJ 242.94 186.28
(3) Planting GWP, 100-year GWP(IPCC, 2007) kg-CO2e 23.46 204.38
Acidification, DAF(LIME,2006) kg-SO2e 0.040 0.401 Waste,landfill volume(LIME,2006) m3 3.80 × 10⁻⁴ 4.40 × 10⁻³
Eutropication, EPMC(LIME,2006) kg-PO4e 2.85 × 10⁻⁶ 4.17 × 10⁻⁵
Energy consumption,HHV(fossil fuel) MJ 387.40 3 394.34
(4) Fertilizing GWP, 100-year GWP(IPCC, 2007) kg-CO2e 902.90 511.27 Acidification, DAF(LIME,2006) kg-SO2e 1.02 0.81
Waste,landfill volume(LIME,2006) m3 7.10 × 10⁻⁴ 8.80 × 10⁻⁴
Eutropication, EPMC(LIME,2006) kg-PO4e 5.80 × 10⁻⁵ 7.45 × 10⁻⁵ Energy consumption,HHV(fossil fuel) MJ 18 240.00 10 841.11
(5) Protection GWP, 100-year GWP(IPCC, 2007) kg-CO2e 393.38 69.64
Acidification, DAF(LIME,2006) kg-SO2e 0.69 0.21 Waste,landfill volume(LIME,2006) m3 6.70 × 10⁻⁵ 1.10 × 10⁻⁴
Eutropication, EPMC(LIME,2006) kg-PO4e 6.90 × 10⁻⁵ 8.93 × 10⁻⁶
Energy consumption,HHV(fossil fuel) MJ 6 211.61 1 178.64
(6) Harvesting GWP, 100-year GWP(IPCC, 2007) kg-CO2e 31.67 8. 27 only diesel oil Acidification, DAF(LIME,2006) kg-SO2e 0.058 0.015
Waste,landfill volume(LIME,2006) m3 1.10 × 10⁻⁸ 2.86 × 10⁻⁹
Eutropication, EPMC(LIME,2006) kg-PO4e 9.47 × 10⁻¹¹ 2.47 × 10⁻¹¹
Energy consumption,HHV(fossil fuel) MJ 422.55 110.38
(7) Palm oil mills
or Extraction oil
GWP, 100-year GWP(IPCC, 2007) kg-CO2e 588.34 18.65
Acidification, DAF(LIME,2006) kg-SO2e 0.98 0.053 Waste,landfill volume(LIME,2006) m3 8.20 × 10⁻⁵ 5.24 × 10⁻⁶
Eutropication, EPMC(LIME,2006) kg-PO4e 6.39 × 10⁻⁵ 7.49 × 10⁻⁶
Energy consumption,HHV(fossil fuel) MJ 7 994.14 234.18
(8) Biodiesel production
GWP, 100-year GWP(IPCC, 2007) kg-CO2e 602.12 897.77 Acidification, DAF(LIME,2006) kg-SO2e 0.72 0.98
Waste,landfill volume(LIME,2006) m3 3.07 × 10⁻⁴ 5.17 × 10⁻⁴ Eutropication, EPMC(LIME,2006) kg-PO4e 4.73 × 10⁻⁵ 5.89 × 10⁻⁵
Energy consumption,HHV(fossil fuel) MJ 16 169.11 25 623.45
Total GWP, 100-year GWP(IPCC, 2007) kg-CO2e 2 568.82 1 733.67
Acidification, DAF(LIME,2006) kg-SO2e 3.55 2.50 Waste,landfill volume(LIME,2006) m3 9.40 × 10⁻⁴ 0.015
Eutropication, EPMC(LIME,2006) kg-PO4e 2.40 × 10⁻⁵ 1.90 × 10⁻⁵
Energy consumption,HHV(fossil fuel) MJ 49 831.17 41 730.03
Table 4. Percentage of GWP-100 years for LCA with boundary cradle to gate at oil palm and Jatropha curcas
Input activities Percentage (%)
Oil palm Jatropha curcas
Pre-harvest 52.42 46.66 Harvesting 1.23 0.48
Post-harvest 46.34 52.86
Figure 4(a) shows that palm oil energy consumption during land preparation, seedling, planting, fertilizing,
protection, harvesting, palm oil mills, and biodiesel production is 0.33 %, 0.49 %, 0.78 %, 36.60 %, 12.47 %,
0.85 %, 16.04 %, and 32.45 %, respectively. While for jatropha curcas, the value of each sub process as shown in
Figure 4(b) is 0.39 %, 0.45 %, 8.13 %, 25.98 %, 2.82 %, 0.26 %, 0.56 %, and 61.4 %, respectively. Table 5 shows
the proportion of each stage which comprised into pre-harvest, harvesting and post-harvest. Prueksakorn et al. also
explained that energy consumption needed for transesterification is higher than fertilization [15]. On the contrary,
fertilization is higher in green house gas emissions. It occurs because of N compound and the use of N2O has strong
Page 8
Kiman Siregar et al. / Energy Procedia 65 ( 2015 ) 170 – 179 177
161.7 186.3
3394.3
10841.1
1178.6
110.4 234.2
25623.4
0
2000
4000
6000
8000
10000
12000
14000
16000
18000
20000
22000
24000
26000
28000
Energy consumption
Energy consumption, HHV(fossil fuel) for Jatropha curcas
Land
preparation
Seedling
Planting
Fertilizing
Protection
Harvesting
Extraction
oil
Biodiesel
production
MJ
/to
n-B
DF
0
150000
300000
450000
600000
750000
900000
1050000
1200000
1350000
1500000
1650000
1 2 3 4 5 6 7 8 9 10 11 12 13 14 15 16 17 18 19 20 21 22 23 24 25
MJ/
ton
BD
F
Year of
Energy consumption,HHV(non-renewable fuel)
Palm oil Jatropha curcas
effects on GHG.
Table 5. Percentage of energy consumption for LCA with boundary cradle to gate at oil palm and Jatropha curcas
Input activities Percentage (%)
Oil palm Jatropha curcas
Pre-harvest 50.66 37.77
Harvesting 0.85 0.26
Post-harvest 48.49 61.96
Figure 5(a) and Figure 5(b) show that GWP emission at stable productivity (6 to 25) y is 1 658.50 and
740.90 kg-CO2eq./t-BDF for palm oil and jatropha curcas oil, respectively. Assessment conducted by Sekiguchi [13]
shows that total CO2 emission is 460 kg-CO2eq/t-BDF for SMV method, 790 kg-CO2eq/t-BDF for alkali-catalyzed
method and 3 400 kg-CO2eq/t-diesel for diesel oil. The results differences might be due the difference in method
and assumptions adopted in the studies. The energy consumption for fossil fuel at stable productivity is 33 190.05
and 19 395.89 MJ/t-BDF for oil palm and Jatropha curcas, respectively. The GWP value and energy consumption
of oil palm and Jatropha curcas is decreasing until the 5th
y and stable until 25th
y. Similar trend emerges in impact
assessment also occurs at acidification, eutrophication, and landfill waste as shown in Figure 6(a), Figure 6(b) and
Figure 7(a), respectively.
163.4 242.9
387.4
18240.0
6211.6
422.5
7994.1
16169.1
0
2000
4000
6000
8000
10000
12000
14000
16000
18000
20000
22000
24000
26000
28000
Energy consumption
Energy consumption, HHV(fossil fuel) for Palm oilLand
preparation
Seedling
Planting
Fertilizing
Protection
Harvesting
Palm oil
mills
Biodiesel
production
MJ
/to
n-B
DF
(a) (b)
Fig.4. (a) The value of energy consumption until 5 y of oil palm; (b) The value of energy consumption until 5 y of Jatropha curcas
0
5000
10000
15000
20000
25000
30000
35000
40000
45000
50000
55000
60000
65000
1 2 3 4 5 6 7 8 9 10 11 12 13 14 15 16 17 18 19 20 21 22 23 24 25
kg-C
O2
e/t
on
BD
F
Year of
GWP, 100-year GWP(IPCC, 2007)
Palm oil Jatropha curcas
(a) (b)
Fig.5. (a) The value of GWP for oil palm and Jatropha curcas; (b) The value of energy consumption for oil palm and Jatropha curcas
Page 9
178 Kiman Siregar et al. / Energy Procedia 65 ( 2015 ) 170 – 179
0.000
0.001
0.002
0.003
0.004
0.005
0.006
0.007
1 2 3 4 5 6 7 8 9 10 11 12 13 14 15 16 17 18 19 20 21 22 23 24 25
kg-P
O4
e/t
on
BD
F
Year of
Eutropication, EPMC(LIME,2006)
Palm oil Jatropha curcas
3.400
2.569
1.734
0.0
0.5
1.0
1.5
2.0
2.5
3.0
3.5
4.0
Fuel source
CO2 emissions reduction value of the fossil fuel
Diesel oil BDF-Palm oil BDF-Jatropha curcas
kg
-CO
2/k
g
24.45 %
reduction49.01 %
reduction
3.400
2.114
1.237
0.0
0.5
1.0
1.5
2.0
2.5
3.0
3.5
4.0
Fuel source
CO2 emissions reduction value of the fossil fuel
Diesel oil BDF-Palm oil BDF-Jatropha curcas
kg
-CO
2/k
g
37.83 %
reduction63.61 %
reduction
0
10
20
30
40
50
60
70
80
90
1 2 3 4 5 6 7 8 9 10 11 12 13 14 15 16 17 18 19 20 21 22 23 24 25
kg-S
O2
e/t
on
BD
F
Year of
Acidification, DAF(LIME,2006)
Palm oil Jatropha curcas
(a) (b)
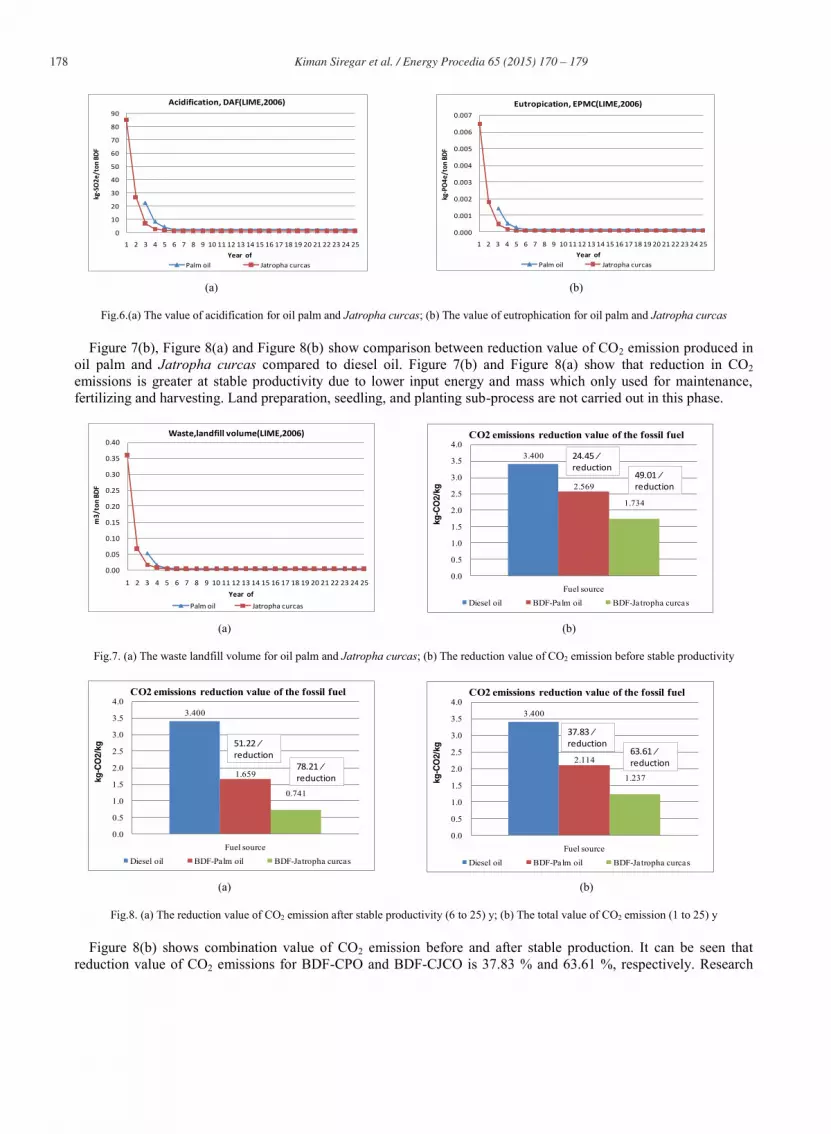
Fig.6.(a) The value of acidification for oil palm and Jatropha curcas; (b) The value of eutrophication for oil palm and Jatropha curcas
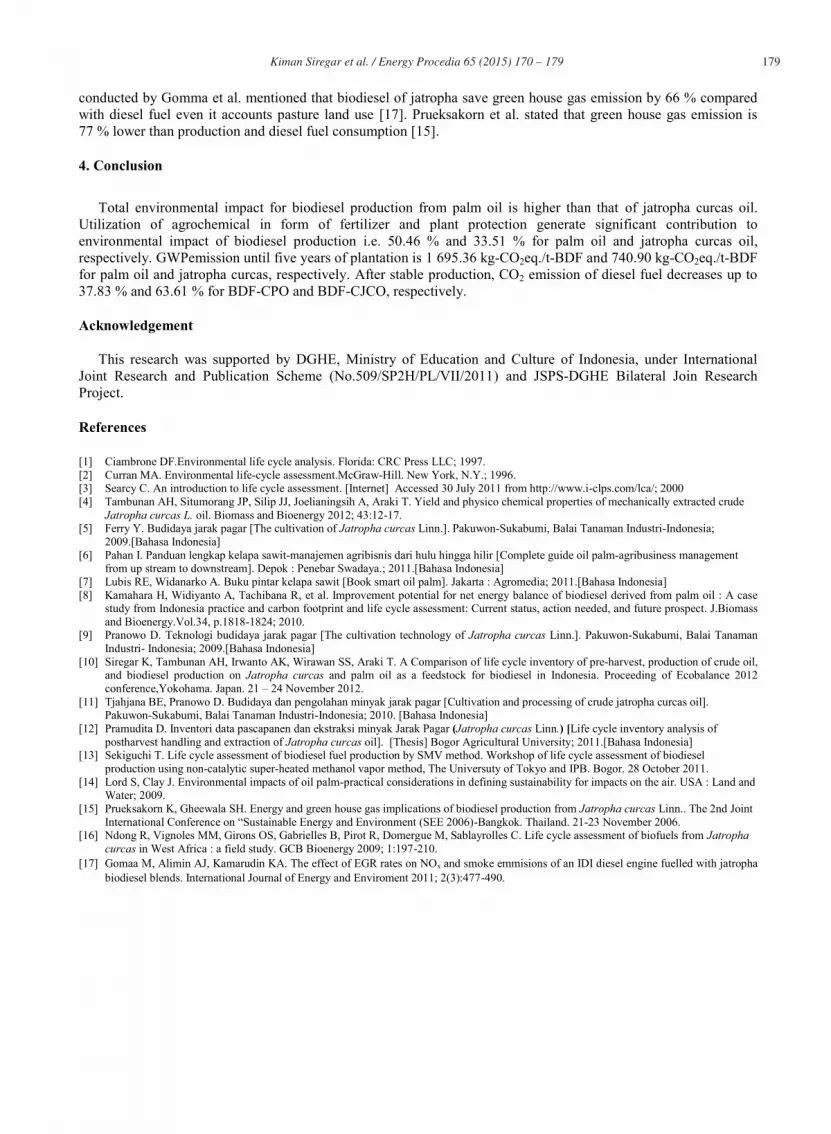
Figure 7(b), Figure 8(a) and Figure 8(b) show comparison between reduction value of CO2 emission produced in
oil palm and Jatropha curcas compared to diesel oil. Figure 7(b) and Figure 8(a) show that reduction in CO2
emissions is greater at stable productivity due to lower input energy and mass which only used for maintenance,
fertilizing and harvesting. Land preparation, seedling, and planting sub-process are not carried out in this phase.
0.00
0.05
0.10
0.15
0.20
0.25
0.30
0.35
0.40
1 2 3 4 5 6 7 8 9 10 11 12 13 14 15 16 17 18 19 20 21 22 23 24 25
m3
/to
n B
DF
Year of
Waste,landfill volume(LIME,2006)
Palm oil Jatropha curcas
(a) (b)
Fig.7. (a) The waste landfill volume for oil palm and Jatropha curcas; (b) The reduction value of CO2 emission before stable productivity
3.400
1.659
0.741
0.0
0.5
1.0
1.5
2.0
2.5
3.0
3.5
4.0
Fuel source
CO2 emissions reduction value of the fossil fuel
Diesel oil BDF-Palm oil BDF-Jatropha curcas
kg
-CO
2/k
g 51.22 %
reduction
78.21 %
reduction
(a) (b)
Fig.8. (a) The reduction value of CO2 emission after stable productivity (6 to 25) y; (b) The total value of CO2 emission (1 to 25) y
Figure 8(b) shows combination value of CO2 emission before and after stable production. It can be seen that
reduction value of CO2 emissions for BDF-CPO and BDF-CJCO is 37.83 % and 63.61 %, respectively. Research
Page 10
Kiman Siregar et al. / Energy Procedia 65 ( 2015 ) 170 – 179 179
conducted by Gomma et al. mentioned that biodiesel of jatropha save green house gas emission by 66 % compared
with diesel fuel even it accounts pasture land use [17]. Prueksakorn et al. stated that green house gas emission is
77 % lower than production and diesel fuel consumption [15].
4. Conclusion
Total environmental impact for biodiesel production from palm oil is higher than that of jatropha curcas oil.
Utilization of agrochemical in form of fertilizer and plant protection generate significant contribution to
environmental impact of biodiesel production i.e. 50.46 % and 33.51 % for palm oil and jatropha curcas oil,
respectively. GWPemission until five years of plantation is 1 695.36 kg-CO2eq./t-BDF and 740.90 kg-CO2eq./t-BDF
for palm oil and jatropha curcas, respectively. After stable production, CO2 emission of diesel fuel decreases up to
37.83 % and 63.61 % for BDF-CPO and BDF-CJCO, respectively.
Acknowledgement
This research was supported by DGHE, Ministry of Education and Culture of Indonesia, under International
Joint Research and Publication Scheme (No.509/SP2H/PL/VII/2011) and JSPS-DGHE Bilateral Join Research
Project.
References
[1] Ciambrone DF.Environmental life cycle analysis. Florida: CRC Press LLC; 1997.
[2] Curran MA. Environmental life-cycle assessment.McGraw-Hill. New York, N.Y.; 1996. [3] Searcy C. An introduction to life cycle assessment. [Internet] Accessed 30 July 2011 from http://www.i-clps.com/lca/; 2000
[4] Tambunan AH, Situmorang JP, Silip JJ, Joelianingsih A, Araki T. Yield and physico chemical properties of mechanically extracted crude
Jatropha curcas L. oil. Biomass and Bioenergy 2012; 43:12-17. [5] Ferry Y. Budidaya jarak pagar [The cultivation of Jatropha curcas Linn.]. Pakuwon-Sukabumi, Balai Tanaman Industri-Indonesia;
2009.[Bahasa Indonesia]
[6] Pahan I. Panduan lengkap kelapa sawit-manajemen agribisnis dari hulu hingga hilir [Complete guide oil palm-agribusiness management from up stream to downstream]. Depok : Penebar Swadaya.; 2011.[Bahasa Indonesia]
[7] Lubis RE, Widanarko A. Buku pintar kelapa sawit [Book smart oil palm]. Jakarta : Agromedia; 2011.[Bahasa Indonesia]
[8] Kamahara H, Widiyanto A, Tachibana R, et al. Improvement potential for net energy balance of biodiesel derived from palm oil : A case study from Indonesia practice and carbon footprint and life cycle assessment: Current status, action needed, and future prospect. J.Biomass
and Bioenergy.Vol.34, p.1818-1824; 2010. [9] Pranowo D. Teknologi budidaya jarak pagar [The cultivation technology of Jatropha curcas Linn.]. Pakuwon-Sukabumi, Balai Tanaman
Industri- Indonesia; 2009.[Bahasa Indonesia]
[10] Siregar K, Tambunan AH, Irwanto AK, Wirawan SS, Araki T. A Comparison of life cycle inventory of pre-harvest, production of crude oil, and biodiesel production on Jatropha curcas and palm oil as a feedstock for biodiesel in Indonesia. Proceeding of Ecobalance 2012
conference,Yokohama. Japan. 21 – 24 November 2012.
[11] Tjahjana BE, Pranowo D. Budidaya dan pengolahan minyak jarak pagar [Cultivation and processing of crude jatropha curcas oil]. Pakuwon-Sukabumi, Balai Tanaman Industri-Indonesia; 2010. [Bahasa Indonesia]
[12] Pramudita D. Inventori data pascapanen dan ekstraksi minyak Jarak Pagar (Jatropha curcas Linn.) [Life cycle inventory analysis of
postharvest handling and extraction of Jatropha curcas oil]. [Thesis] Bogor Agricultural University; 2011.[Bahasa Indonesia] [13] Sekiguchi T. Life cycle assessment of biodiesel fuel production by SMV method. Workshop of life cycle assessment of biodiesel
production using non-catalytic super-heated methanol vapor method, The Universuty of Tokyo and IPB. Bogor. 28 October 2011.
[14] Lord S, Clay J. Environmental impacts of oil palm-practical considerations in defining sustainability for impacts on the air. USA : Land and Water; 2009.
[15] Prueksakorn K, Gheewala SH. Energy and green house gas implications of biodiesel production from Jatropha curcas Linn.. The 2nd Joint
International Conference on “Sustainable Energy and Environment (SEE 2006)-Bangkok. Thailand. 21-23 November 2006. [16] Ndong R, Vignoles MM, Girons OS, Gabrielles B, Pirot R, Domergue M, Sablayrolles C. Life cycle assessment of biofuels from Jatropha
curcas in West Africa : a field study. GCB Bioenergy 2009; 1:197-210.
[17] Gomaa M, Alimin AJ, Kamarudin KA. The effect of EGR rates on NOx and smoke emmisions of an IDI diesel engine fuelled with jatropha
biodiesel blends. International Journal of Energy and Enviroment 2011; 2(3):477-490.