
Seediscussions,stats,andauthorprofilesforthispublicationat:https://www.researchgate.net/publication/51968322
VortexTubesofTurbulentSolarConvection
ARTICLEinPHYSICASCRIPTA·DECEMBER2011
ImpactFactor:1.13·DOI:10.1088/0031-8949/86/01/018403·Source:arXiv
CITATIONS
13
READS
39
5AUTHORS,INCLUDING:
NeveenMansour
water&wastewatercompany
99PUBLICATIONS1,563CITATIONS
SEEPROFILE
AlanA.Wray
NASA
127PUBLICATIONS2,623CITATIONS
SEEPROFILE
Availablefrom:AlanA.Wray
Retrievedon:04February2016
arX
iv:1
112.
5925
v2 [
astr
o-ph
.SR
] 1
2 Ja
n 20
12
Vortex Tubes of Turbulent Solar Convection
I.N. Kitiashvili1−4, A.G. Kosovichev1, N.N. Mansour5,
S. K. Lele2,6 and A.A. Wray5
1 W.W. Hansen Experimental Physics Laboratory, Stanford University, Stanford, CA
94305, USA2Center for Turbulence Research, Stanford University, Stanford, CA 94305, USA3 NORDITA, Stockholm, SE-10691, Sweden4 Kazan Federal University, Kazan, 420008, Russia5 NASA Ames Research Center, Moffett Field, Mountain View, CA 94040, USA6Department of Mechanical Engineering, Stanford University, Stanford, CA 94305,
USA
E-mail: [email protected]
Abstract. Investigation of the turbulent properties of solar convection is extremely
important for understanding the multi-scale dynamics observed on the solar surface.
In particular, recent high-resolution observations have revealed ubiquitous vortical
structures, and numerical simulations have demonstrated links between vortex tube
dynamics and magnetic field organization and have shown the importance of vortex
tube interactions in the mechanisms of acoustic wave excitation on the Sun. In
this paper we investigate the mechanisms of the formation of vortex tubes in
highly-turbulent convective flows near the solar surface by using realistic radiative
hydrodynamic LES simulations. Analysis of data from the simulations indicates two
basic processes of vortex tube formation: 1) development of small-scale convective
instability inside convective granules, and 2) a Kelvin-Helmholtz type instability of
shearing flows in intergranular lanes. Our analysis shows that vortex stretching during
these processes is a primary source of generation of small-scale vorticity on the Sun.
Vortex Tubes of Turbulent Solar Convection 2
1. Introduction
Turbulent convection is a source of various phenomena observed on the Sun, such as
coronal mass ejections, self-organized magnetic structures (that appear on the surface
as sunspots and pores), and other non-linear multi-scale dynamical structures and
phenomena. Modern realistic numerical simulations of solar turbulent phenomena are
based on physical first principles and take into account the real-gas equation of state,
radiative transfer, chemical composition, and the effects of magnetic fields. Realistic 3D
numerical simulations have reproduced and explained many observed effects in sunspots
and magnetic active regions [1, 2, 3, 4] and in quiet-Sun regions [5, 6, 7]. Thus, numerical
simulations provide important insights into the physical mechanisms of solar phenomena.
Vorticity is one of the basic properties of turbulent flows. Therefore it is not
surprising that swirling motions are found in observations of the highly-turbulent solar
magnetoconvection. Large-scale vortical behavior, once evidenced by sunspot rotation,
was first observed on the Sun by Secchi (1857). Later, vortex flows in the photosphere
(∼ 3 Mm in diameter) were detected by Brandt et al. [8], and small-scale swirling flows
(∼ 0.5 Mm) were observed by Wang et al. [9].
Observations have shown that vortices are ubiquitous in non-magnetic quiet-
Sun regions [10, 11, 12] and are associated with intergranular lanes. Such swirling
motions correspond to vertically oriented vortex tube structures that have been found
in numerical simulations [5, 7, 13]. The numerical simulations have demonstrated
important links between vortex tube dynamics and processes of magnetic self-
organization [2] and also with acoustic wave excitation [7] and have shown that vortex
tubes play a fundamental role in solar magnetic flux dynamics. Also, small-scale
horizontal vortex tubes located along granule edges were found both in numerical
simulations and in observations with the balloon observatory SUNRISE [6]. Recently,
vortical motions were observed inside granules by the NST/BBSO telescope (P. Goode,
private communication). However, even the highest resolution observations are not
capable of resolving the internal structure of the vortex tubes. Thus, it is important
to investigate in detail the mechanism of vortex formation and dynamics using high-
resolution numerical simulations.
Vortex tube formation can occur due to different processes. According to our
numerical simulations, generation of vortex tubes on the Sun can be driven by the
development of convective instabilities, accompanied by emergence of small-scale plumes
inside granules or granule splitting, and also by Kelvin-Helmholtz instability of shearing
flows in the intergranular lanes. Both vertical and horizontal vortex tubes are generated,
but the vertical tubes predominate, as the horizontal tubes are often dragged into
intergranular lanes where they become vertical due to surrounding downflows.

Vortex Tubes of Turbulent Solar Convection 3
2. Computational setup
For this investigation of vortical structures in the turbulent convective near-surface
boundary layer of the Sun we use the 3D radiative MHD ‘SolarBox’ code developed at the
NASA/Ames Research Center and the Stanford Center for Turbulence Research by Alan
Wray and his colleagues [14]. The code takes into account fluid flow compressibility in a
highly stratified medium, the real-gas equation of state, the standard model of the solar
interior [15], and the OPAL opacity tables. Radiative transfer between fluid elements
is calculated using a 3D multi-spectral-bin method assuming local thermodynamic
equilibrium. The physical description of the dynamical properties of solar convection was
improved through implementation of subgrid-scale turbulence models, which effectively
increases the Reynolds number and provides representation of small-scale motions
closer to the reality. This approach, based on Large-Eddy Simulation (LES) models
of turbulence, has demonstrated good agreement between numerical modeling and
observations [14].
For the current study, the simulation results have been obtained for two different
computational domains: 6.4 × 6.4 × 5.5 Mm3 (with a 1 Mm layer of the atmosphere)
and 3.2× 3.2× 7.5 Mm3 (with a 2 Mm atmospheric layer), and various grid resolutions:
12.5 km and 6.25 km in the horizontal direction, and 10 km and 6 km in the vertical
direction. The lateral boundary conditions are periodic. The top boundary is open to
mass, momentum and energy transfers, and also to radiative flux. The bottom boundary
is open only for radiation and simulates energy input from the interior of the Sun. These
high-resolution simulations reveal details of vortex tube formation and dynamics in solar
granular convection, as described in the following sections.
3. Vortex tubes formation by convective granular instability
Subsurface layers of the Sun are highly turbulent and inhomogeneous. According to
observations, the location of swirling motions (interpreted as vertical vortex tubes) is
mostly associated with the intergranular lanes [10, 11]. Similar association was found in
numerical simulations [5, 7, 16]. The numerical simulations presented in this paper show
that vertical vortex tubes can also be formed inside granules because of a local instability
caused by small-scale upflowing plumes. Also, splitting of granules due to convective
instability can produce “cookie cutter” structures at granular edges, which perturb flows
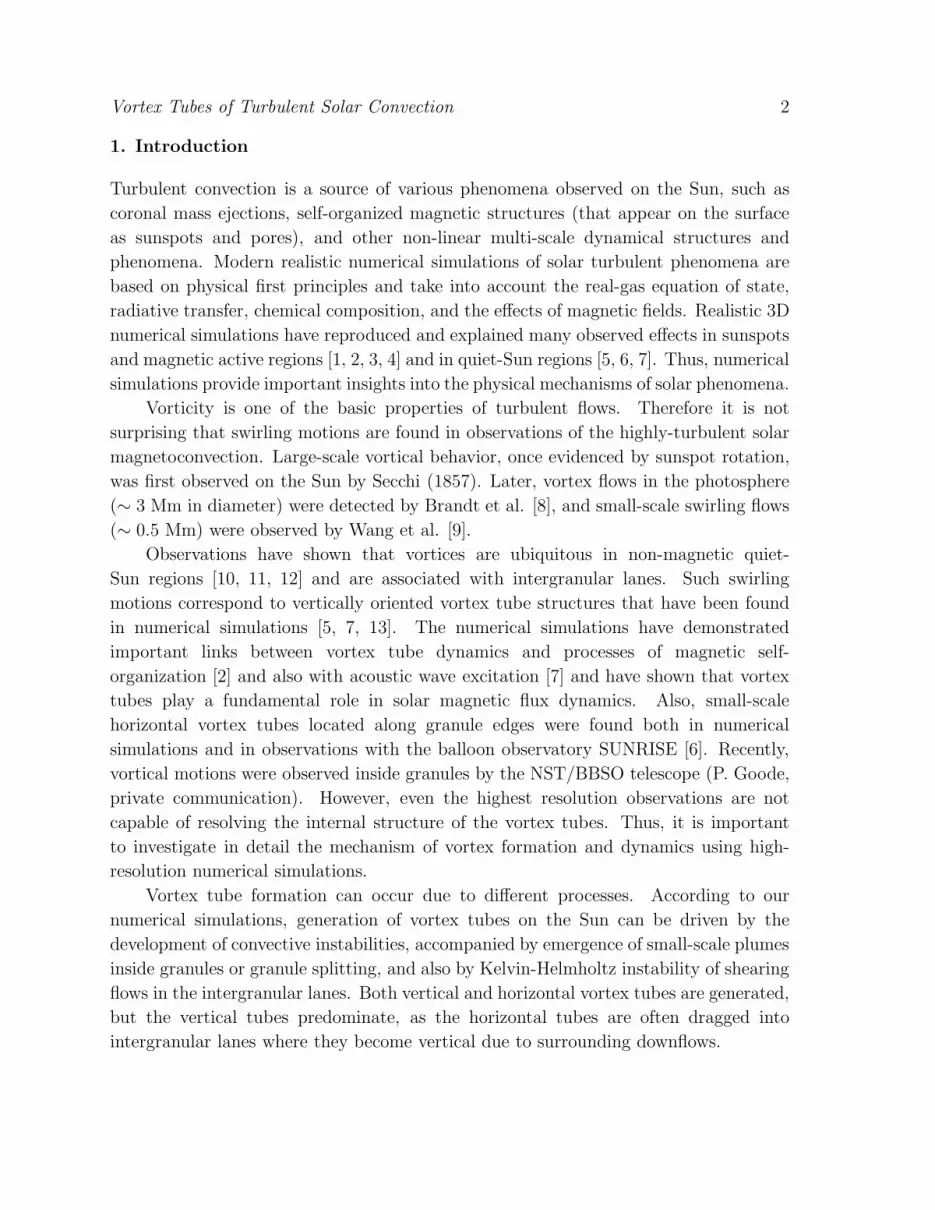
at the granule top boundary and can produce vortices. In Fig. 1 we show a snapshot
of the solar surface properties obtained in the simulations: vertical velocity (panel a),
temperature (b), density (c), and enstrophy (panel d). The vortex tube structures are
best visible in the density distribution (Fig. 1c) as low-density (dark) points in the
intergranular lanes. For a detailed analysis we selected two small subregions, marked
‘A’ and ‘B’, to illustrate the typical vortex formation process.
Vortex Tubes of Turbulent Solar Convection 4
Figure 1. Snapshots of a surface layer illustrate distributions of (a) vertical velocity,
(b) temperature, (c) density, and (d) enstrophy. The rectangular regions indicate places
of formation of a vortex tube from the granular instabilities due to 1) a local upflow
in region ‘A’ (solid rectangle; this region is shown in detail Fig. 2, 3); and 2) splitting
of granule, region ‘B’ (dashed rectangle; analyzed in detail in Fig. 5, 6).
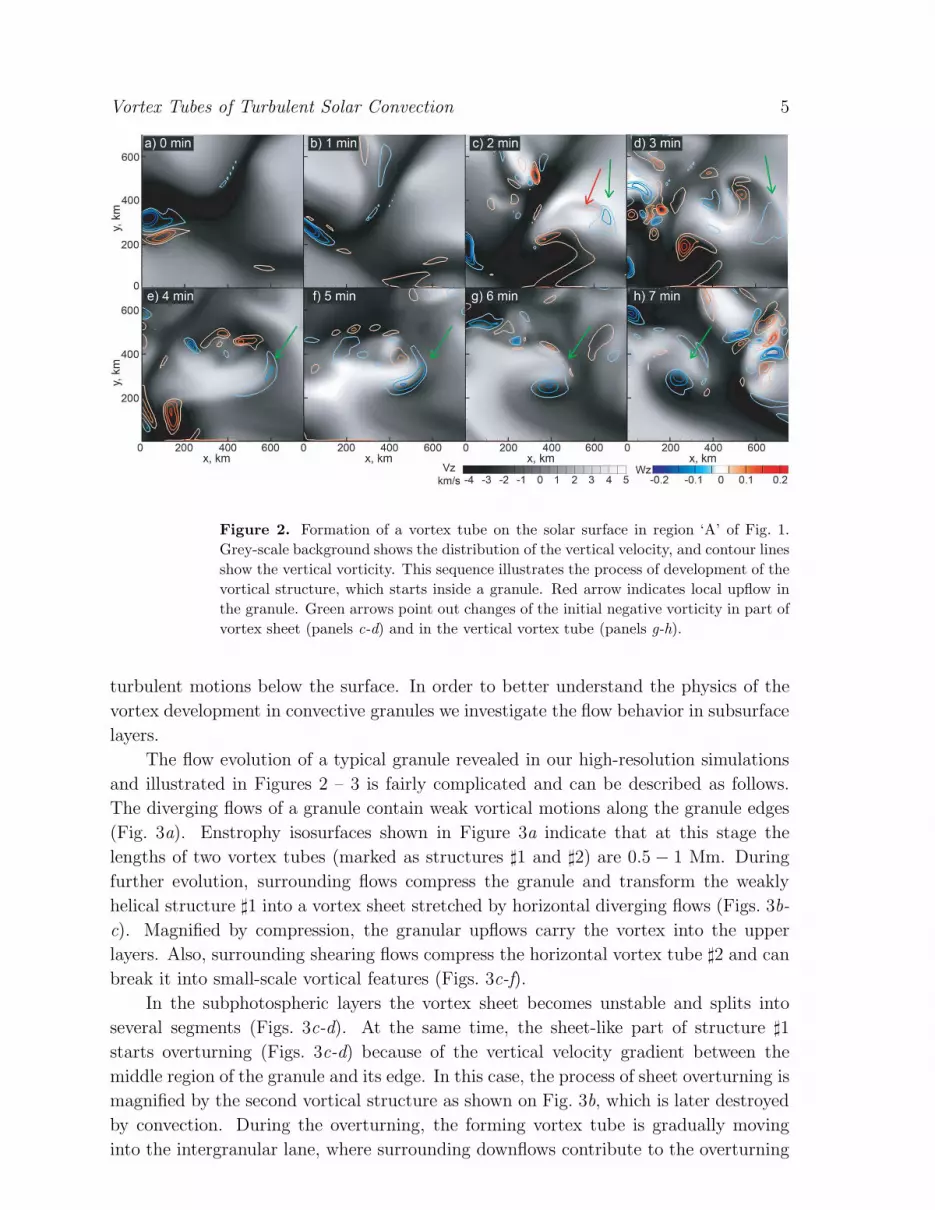
3.1. Upflow plumes inside granular eddies
Vortex tube formation inside granules is a result of a complicated interaction of turbulent
flows. In the surface layer, the development of convective instability initially represents
a localized upflow in a granule (red arrow in Fig. 2a), which is accompanied by a mixture
of weak vortical motions on the surface (the vertical vorticity distribution in region ‘A’
is shown by contour lines in Fig. 2a-c). Overturning of this upflow plume increases the
instability region and destroys the granule (Fig. 2d-e). Finally, the overturning vortical
motions form a compact and relatively stable vortex tube (Fig. 2d-h). The formation of
the vortex tube and its development on the solar surface indicated by the green arrow.
However, the vortical flows observed on the surface are only a part of complicated
Vortex Tubes of Turbulent Solar Convection 5
Figure 2. Formation of a vortex tube on the solar surface in region ‘A’ of Fig. 1.
Grey-scale background shows the distribution of the vertical velocity, and contour lines
show the vertical vorticity. This sequence illustrates the process of development of the
vortical structure, which starts inside a granule. Red arrow indicates local upflow in
the granule. Green arrows point out changes of the initial negative vorticity in part of
vortex sheet (panels c-d) and in the vertical vortex tube (panels g-h).
turbulent motions below the surface. In order to better understand the physics of the
vortex development in convective granules we investigate the flow behavior in subsurface
layers.
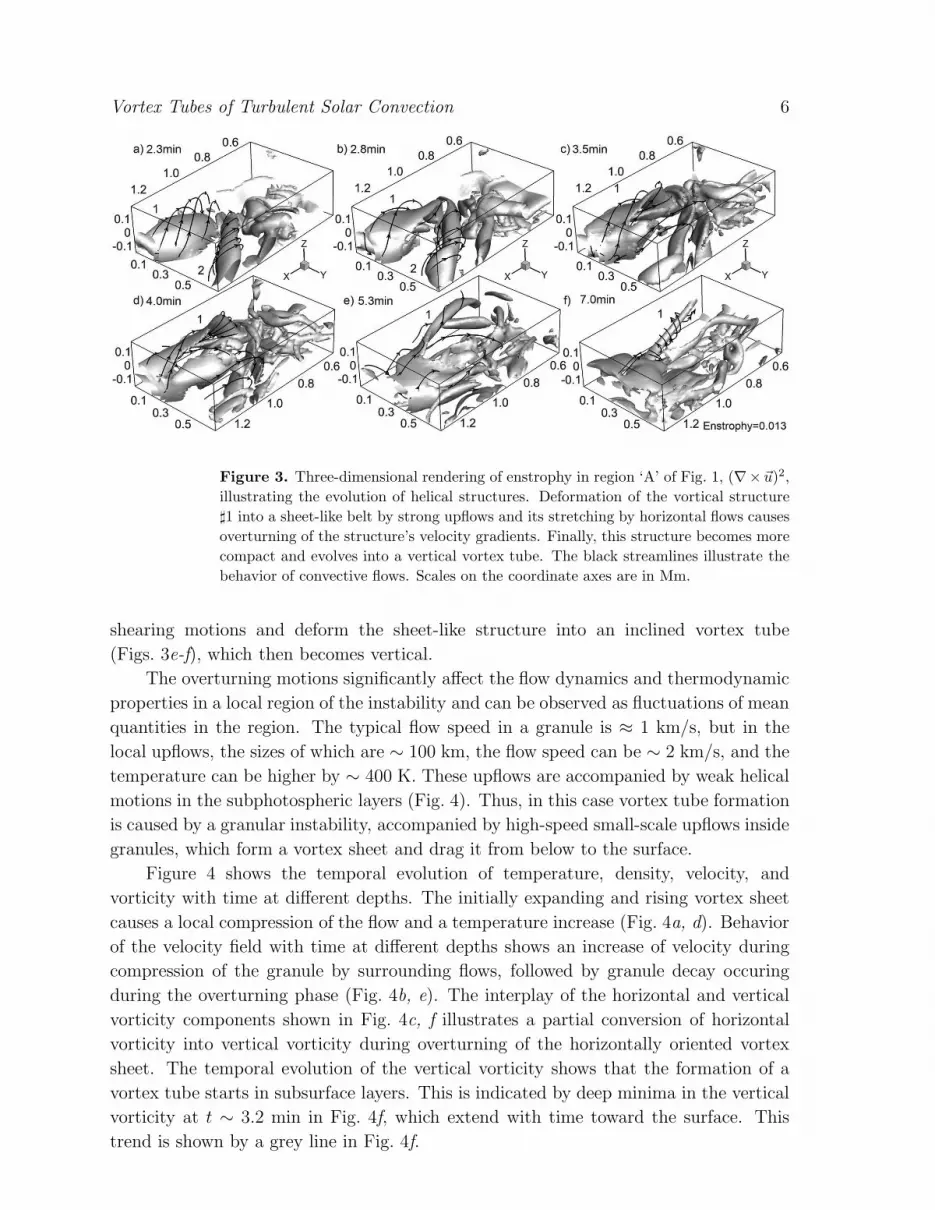
The flow evolution of a typical granule revealed in our high-resolution simulations
and illustrated in Figures 2 – 3 is fairly complicated and can be described as follows.
The diverging flows of a granule contain weak vortical motions along the granule edges
(Fig. 3a). Enstrophy isosurfaces shown in Figure 3a indicate that at this stage the
lengths of two vortex tubes (marked as structures ♯1 and ♯2) are 0.5 − 1 Mm. During
further evolution, surrounding flows compress the granule and transform the weakly
helical structure ♯1 into a vortex sheet stretched by horizontal diverging flows (Figs. 3b-
c). Magnified by compression, the granular upflows carry the vortex into the upper
layers. Also, surrounding shearing flows compress the horizontal vortex tube ♯2 and can
break it into small-scale vortical features (Figs. 3c-f).
In the subphotospheric layers the vortex sheet becomes unstable and splits into
several segments (Figs. 3c-d). At the same time, the sheet-like part of structure ♯1
starts overturning (Figs. 3c-d) because of the vertical velocity gradient between the
middle region of the granule and its edge. In this case, the process of sheet overturning is
magnified by the second vortical structure as shown on Fig. 3b, which is later destroyed
by convection. During the overturning, the forming vortex tube is gradually moving
into the intergranular lane, where surrounding downflows contribute to the overturning
Vortex Tubes of Turbulent Solar Convection 6
Figure 3. Three-dimensional rendering of enstrophy in region ‘A’ of Fig. 1, (∇× ~u)2,
illustrating the evolution of helical structures. Deformation of the vortical structure
♯1 into a sheet-like belt by strong upflows and its stretching by horizontal flows causes
overturning of the structure’s velocity gradients. Finally, this structure becomes more
compact and evolves into a vertical vortex tube. The black streamlines illustrate the
behavior of convective flows. Scales on the coordinate axes are in Mm.
shearing motions and deform the sheet-like structure into an inclined vortex tube
(Figs. 3e-f), which then becomes vertical.
The overturning motions significantly affect the flow dynamics and thermodynamic
properties in a local region of the instability and can be observed as fluctuations of mean
quantities in the region. The typical flow speed in a granule is ≈ 1 km/s, but in the
local upflows, the sizes of which are ∼ 100 km, the flow speed can be ∼ 2 km/s, and the
temperature can be higher by ∼ 400 K. These upflows are accompanied by weak helical
motions in the subphotospheric layers (Fig. 4). Thus, in this case vortex tube formation
is caused by a granular instability, accompanied by high-speed small-scale upflows inside
granules, which form a vortex sheet and drag it from below to the surface.
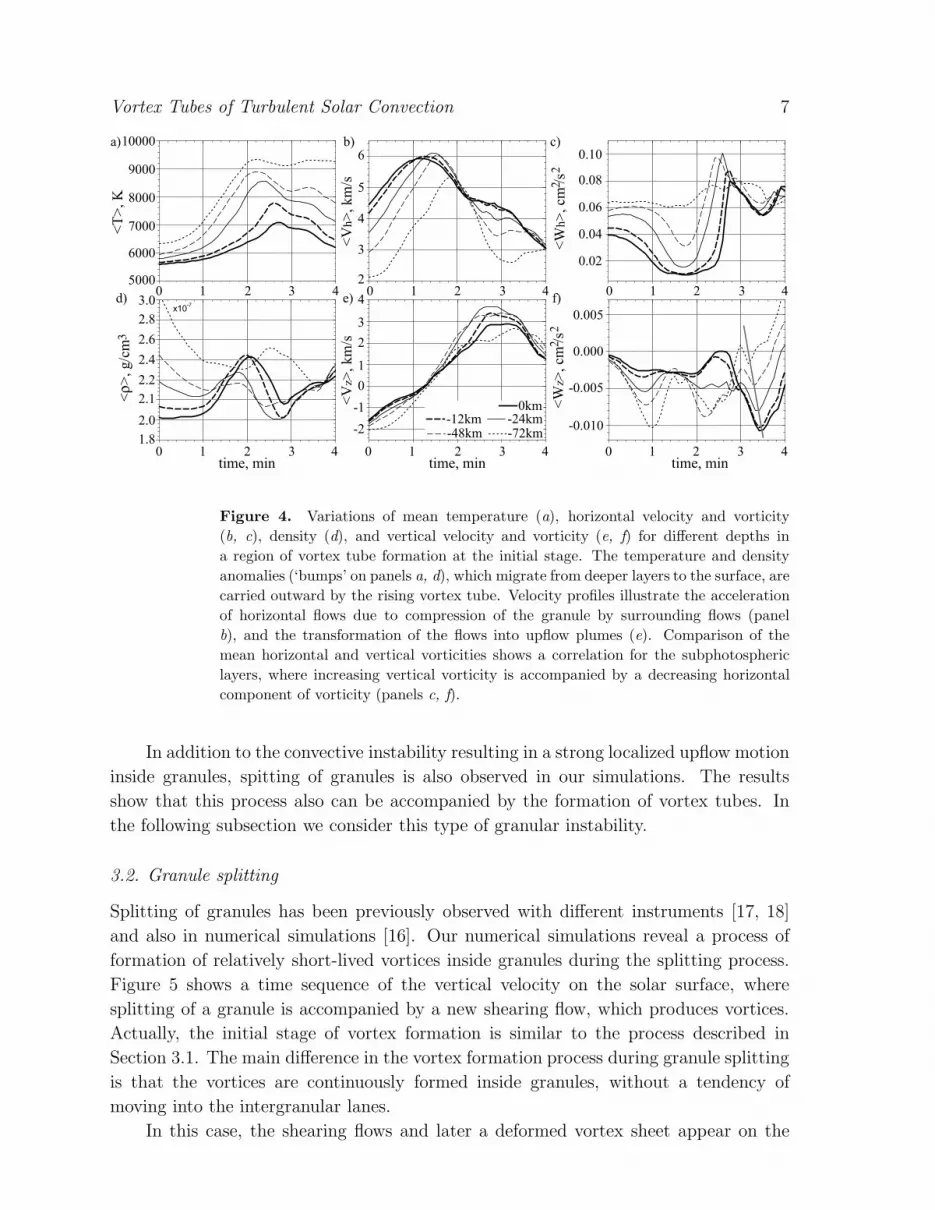
Figure 4 shows the temporal evolution of temperature, density, velocity, and
vorticity with time at different depths. The initially expanding and rising vortex sheet
causes a local compression of the flow and a temperature increase (Fig. 4a, d). Behavior
of the velocity field with time at different depths shows an increase of velocity during
compression of the granule by surrounding flows, followed by granule decay occuring
during the overturning phase (Fig. 4b, e). The interplay of the horizontal and vertical
vorticity components shown in Fig. 4c, f illustrates a partial conversion of horizontal
vorticity into vertical vorticity during overturning of the horizontally oriented vortex
sheet. The temporal evolution of the vertical vorticity shows that the formation of a
vortex tube starts in subsurface layers. This is indicated by deep minima in the vertical
vorticity at t ∼ 3.2 min in Fig. 4f, which extend with time toward the surface. This
trend is shown by a grey line in Fig. 4f.
Vortex Tubes of Turbulent Solar Convection 7
a) b) c)
0 1 2 3 4 0 1 2 3 4 0 1 2 3 4
0 1 2 3 4 0 1 2 3 4 0 1 2 3 4
10000
9000
8000
7000
6000
5000
<T
>, K
<ρ
>, g/c
m
<V
h>
, km
/s<
Vz>
, km
/s
<W
h>
, cm
/s
3
3.0
2.8
2.6
2.4
2.2
2.1
2.0
1.8
6
5
4
3
2
4
3
2
1
0
-1
-2
d) e) f)
22
22
0.10
0.08
0.06
0.04
0.02
0.005
0.000
-0.005
-0.010
<W
z>, cm
/s
time, min time, min time, min
0km-12km -24km-48km -72km
Figure 4. Variations of mean temperature (a), horizontal velocity and vorticity
(b, c), density (d), and vertical velocity and vorticity (e, f) for different depths in
a region of vortex tube formation at the initial stage. The temperature and density
anomalies (‘bumps’ on panels a, d), which migrate from deeper layers to the surface, are
carried outward by the rising vortex tube. Velocity profiles illustrate the acceleration
of horizontal flows due to compression of the granule by surrounding flows (panel
b), and the transformation of the flows into upflow plumes (e). Comparison of the
mean horizontal and vertical vorticities shows a correlation for the subphotospheric
layers, where increasing vertical vorticity is accompanied by a decreasing horizontal
component of vorticity (panels c, f).
In addition to the convective instability resulting in a strong localized upflow motion
inside granules, spitting of granules is also observed in our simulations. The results
show that this process also can be accompanied by the formation of vortex tubes. In
the following subsection we consider this type of granular instability.
3.2. Granule splitting
Splitting of granules has been previously observed with different instruments [17, 18]
and also in numerical simulations [16]. Our numerical simulations reveal a process of
formation of relatively short-lived vortices inside granules during the splitting process.
Figure 5 shows a time sequence of the vertical velocity on the solar surface, where
splitting of a granule is accompanied by a new shearing flow, which produces vortices.
Actually, the initial stage of vortex formation is similar to the process described in
Section 3.1. The main difference in the vortex formation process during granule splitting
is that the vortices are continuously formed inside granules, without a tendency of
moving into the intergranular lanes.
In this case, the shearing flows and later a deformed vortex sheet appear on the
Vortex Tubes of Turbulent Solar Convection 8
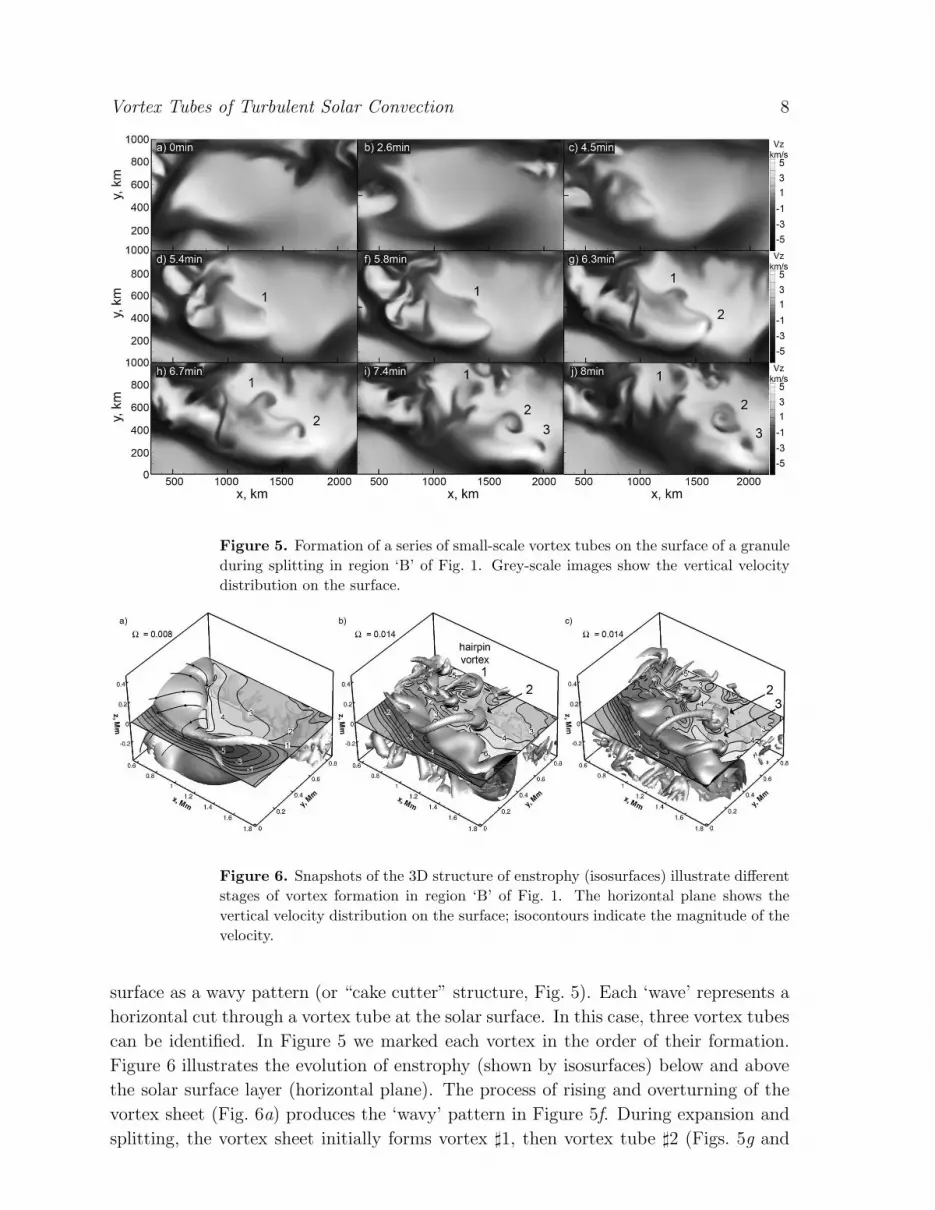
Figure 5. Formation of a series of small-scale vortex tubes on the surface of a granule
during splitting in region ‘B’ of Fig. 1. Grey-scale images show the vertical velocity
distribution on the surface.
Figure 6. Snapshots of the 3D structure of enstrophy (isosurfaces) illustrate different
stages of vortex formation in region ‘B’ of Fig. 1. The horizontal plane shows the
vertical velocity distribution on the surface; isocontours indicate the magnitude of the
velocity.
surface as a wavy pattern (or “cake cutter” structure, Fig. 5). Each ‘wave’ represents a
horizontal cut through a vortex tube at the solar surface. In this case, three vortex tubes
can be identified. In Figure 5 we marked each vortex in the order of their formation.
Figure 6 illustrates the evolution of enstrophy (shown by isosurfaces) below and above
the solar surface layer (horizontal plane). The process of rising and overturning of the
vortex sheet (Fig. 6a) produces the ‘wavy’ pattern in Figure 5f. During expansion and
splitting, the vortex sheet initially forms vortex ♯1, then vortex tube ♯2 (Figs. 5g and
Vortex Tubes of Turbulent Solar Convection 9
6b), and, finally, vortex ♯3 (Figs. 5j and 6c).
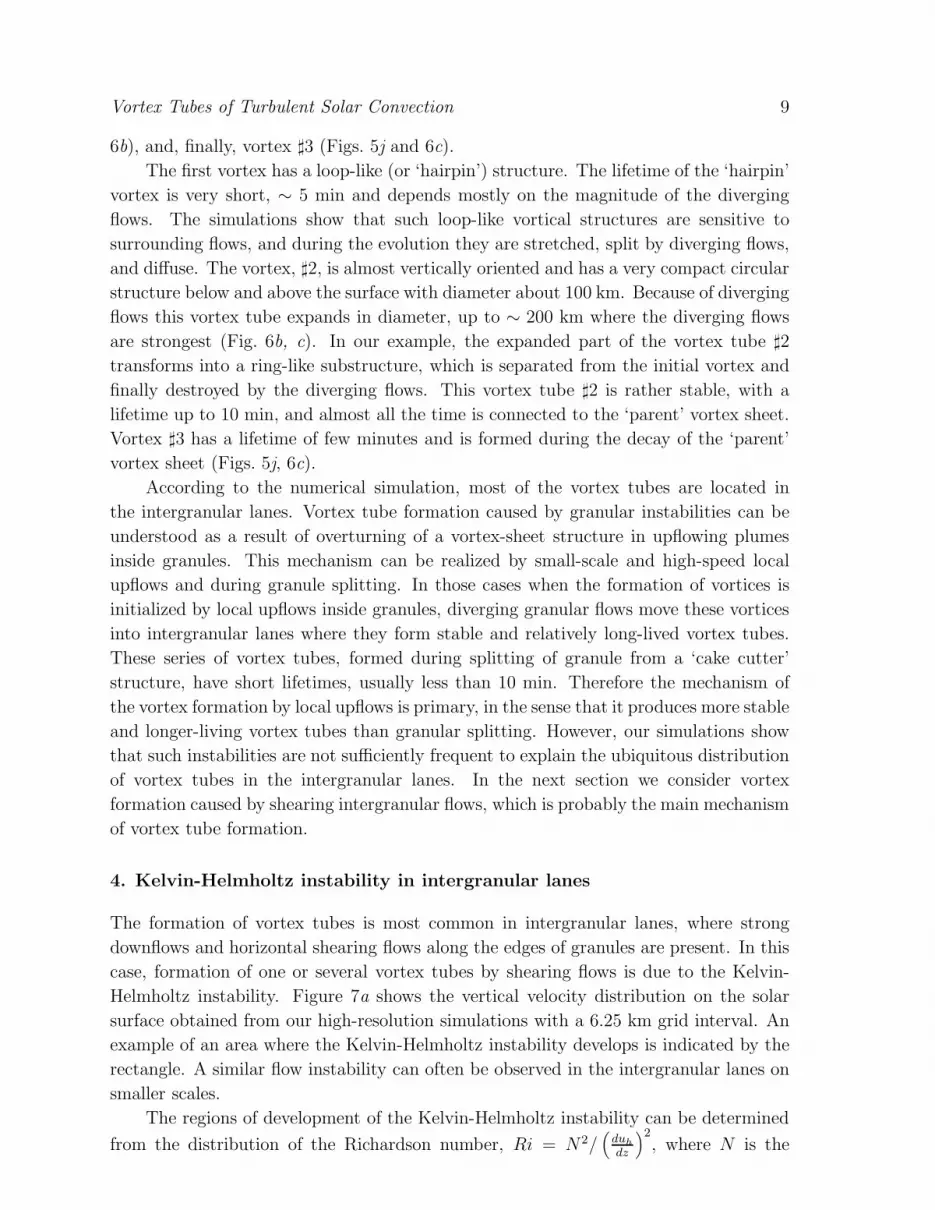
The first vortex has a loop-like (or ‘hairpin’) structure. The lifetime of the ‘hairpin’
vortex is very short, ∼ 5 min and depends mostly on the magnitude of the diverging
flows. The simulations show that such loop-like vortical structures are sensitive to
surrounding flows, and during the evolution they are stretched, split by diverging flows,
and diffuse. The vortex, ♯2, is almost vertically oriented and has a very compact circular
structure below and above the surface with diameter about 100 km. Because of diverging
flows this vortex tube expands in diameter, up to ∼ 200 km where the diverging flows
are strongest (Fig. 6b, c). In our example, the expanded part of the vortex tube ♯2
transforms into a ring-like substructure, which is separated from the initial vortex and
finally destroyed by the diverging flows. This vortex tube ♯2 is rather stable, with a
lifetime up to 10 min, and almost all the time is connected to the ‘parent’ vortex sheet.
Vortex ♯3 has a lifetime of few minutes and is formed during the decay of the ‘parent’
vortex sheet (Figs. 5j, 6c).
According to the numerical simulation, most of the vortex tubes are located in
the intergranular lanes. Vortex tube formation caused by granular instabilities can be
understood as a result of overturning of a vortex-sheet structure in upflowing plumes
inside granules. This mechanism can be realized by small-scale and high-speed local
upflows and during granule splitting. In those cases when the formation of vortices is
initialized by local upflows inside granules, diverging granular flows move these vortices
into intergranular lanes where they form stable and relatively long-lived vortex tubes.
These series of vortex tubes, formed during splitting of granule from a ‘cake cutter’
structure, have short lifetimes, usually less than 10 min. Therefore the mechanism of
the vortex formation by local upflows is primary, in the sense that it produces more stable
and longer-living vortex tubes than granular splitting. However, our simulations show
that such instabilities are not sufficiently frequent to explain the ubiquitous distribution
of vortex tubes in the intergranular lanes. In the next section we consider vortex
formation caused by shearing intergranular flows, which is probably the main mechanism
of vortex tube formation.
4. Kelvin-Helmholtz instability in intergranular lanes
The formation of vortex tubes is most common in intergranular lanes, where strong
downflows and horizontal shearing flows along the edges of granules are present. In this
case, formation of one or several vortex tubes by shearing flows is due to the Kelvin-
Helmholtz instability. Figure 7a shows the vertical velocity distribution on the solar
surface obtained from our high-resolution simulations with a 6.25 km grid interval. An
example of an area where the Kelvin-Helmholtz instability develops is indicated by the
rectangle. A similar flow instability can often be observed in the intergranular lanes on
smaller scales.
The regions of development of the Kelvin-Helmholtz instability can be determined
from the distribution of the Richardson number, Ri = N2/(
duh
dz
)2
, where N is the
Vortex Tubes of Turbulent Solar Convection 10
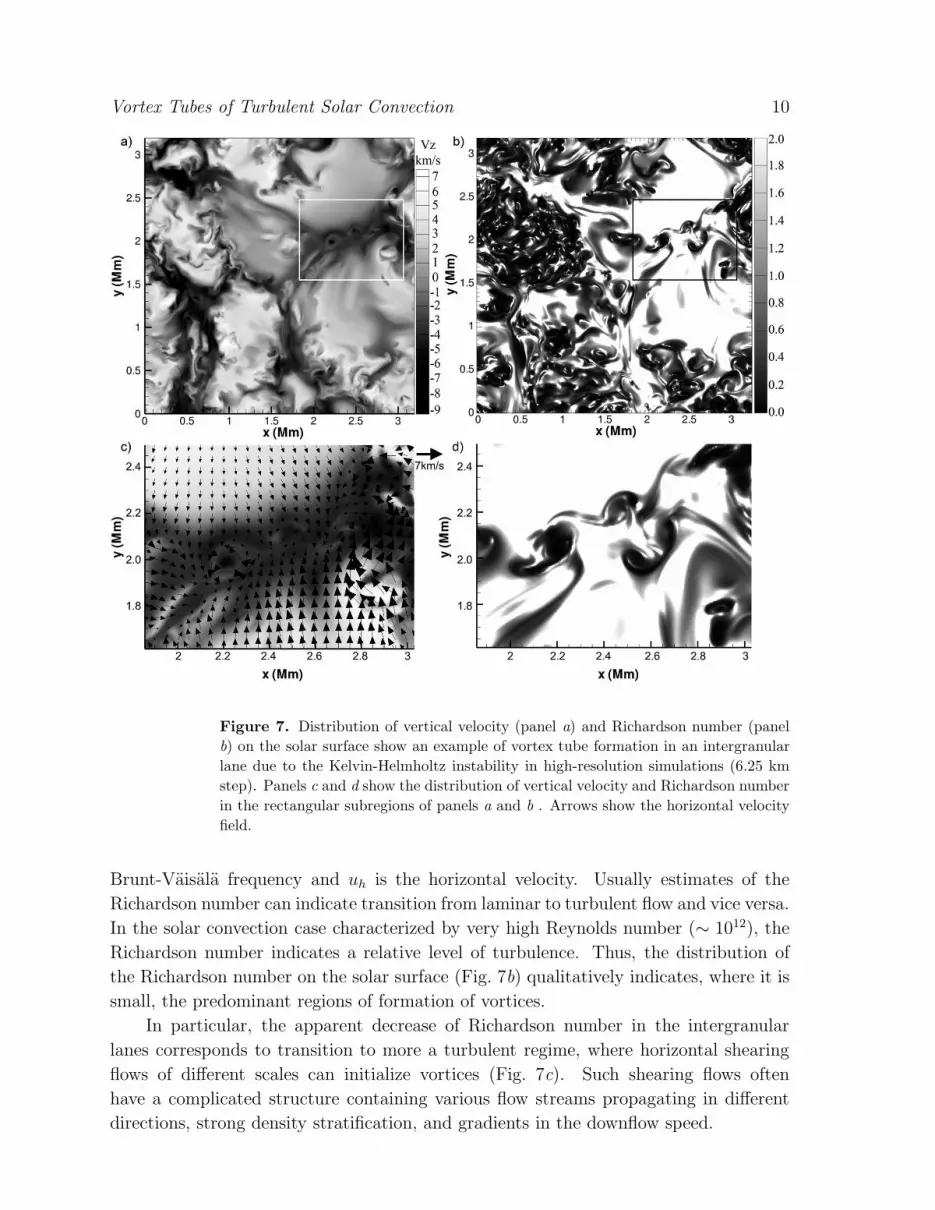
Figure 7. Distribution of vertical velocity (panel a) and Richardson number (panel
b) on the solar surface show an example of vortex tube formation in an intergranular
lane due to the Kelvin-Helmholtz instability in high-resolution simulations (6.25 km
step). Panels c and d show the distribution of vertical velocity and Richardson number
in the rectangular subregions of panels a and b . Arrows show the horizontal velocity
field.
Brunt-Vaisala frequency and uh is the horizontal velocity. Usually estimates of the
Richardson number can indicate transition from laminar to turbulent flow and vice versa.
In the solar convection case characterized by very high Reynolds number (∼ 1012), the
Richardson number indicates a relative level of turbulence. Thus, the distribution of
the Richardson number on the solar surface (Fig. 7b) qualitatively indicates, where it is
small, the predominant regions of formation of vortices.
In particular, the apparent decrease of Richardson number in the intergranular
lanes corresponds to transition to more a turbulent regime, where horizontal shearing
flows of different scales can initialize vortices (Fig. 7c). Such shearing flows often
have a complicated structure containing various flow streams propagating in different
directions, strong density stratification, and gradients in the downflow speed.
Vortex Tubes of Turbulent Solar Convection 11
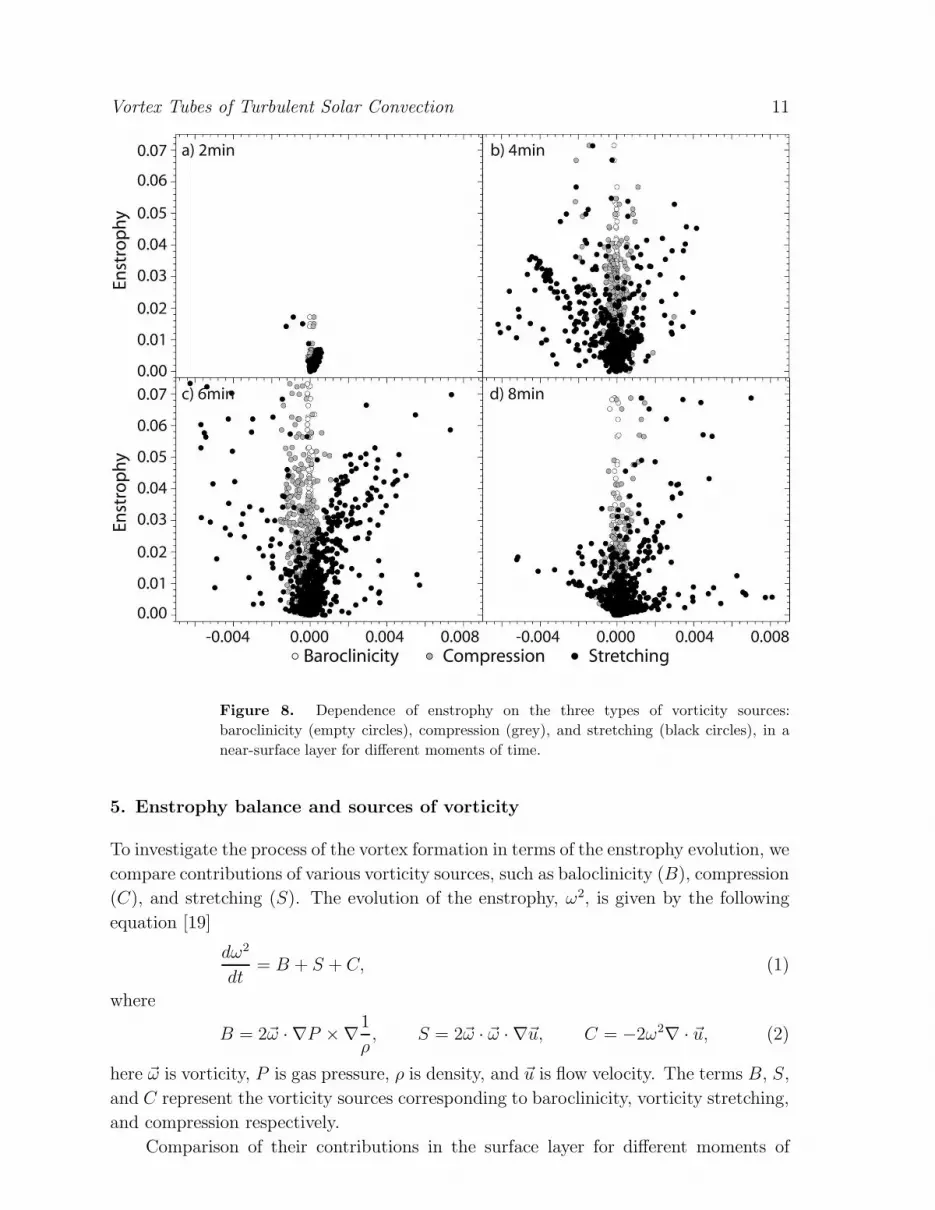
Figure 8. Dependence of enstrophy on the three types of vorticity sources:
baroclinicity (empty circles), compression (grey), and stretching (black circles), in a
near-surface layer for different moments of time.
5. Enstrophy balance and sources of vorticity
To investigate the process of the vortex formation in terms of the enstrophy evolution, we
compare contributions of various vorticity sources, such as baloclinicity (B), compression
(C), and stretching (S). The evolution of the enstrophy, ω2, is given by the following
equation [19]
dω2
dt= B + S + C, (1)
where
B = 2~ω · ∇P ×∇1
ρ, S = 2~ω · ~ω · ∇~u, C = −2ω2
∇ · ~u, (2)
here ~ω is vorticity, P is gas pressure, ρ is density, and ~u is flow velocity. The terms B, S,
and C represent the vorticity sources corresponding to baroclinicity, vorticity stretching,
and compression respectively.
Comparison of their contributions in the surface layer for different moments of
Vortex Tubes of Turbulent Solar Convection 12
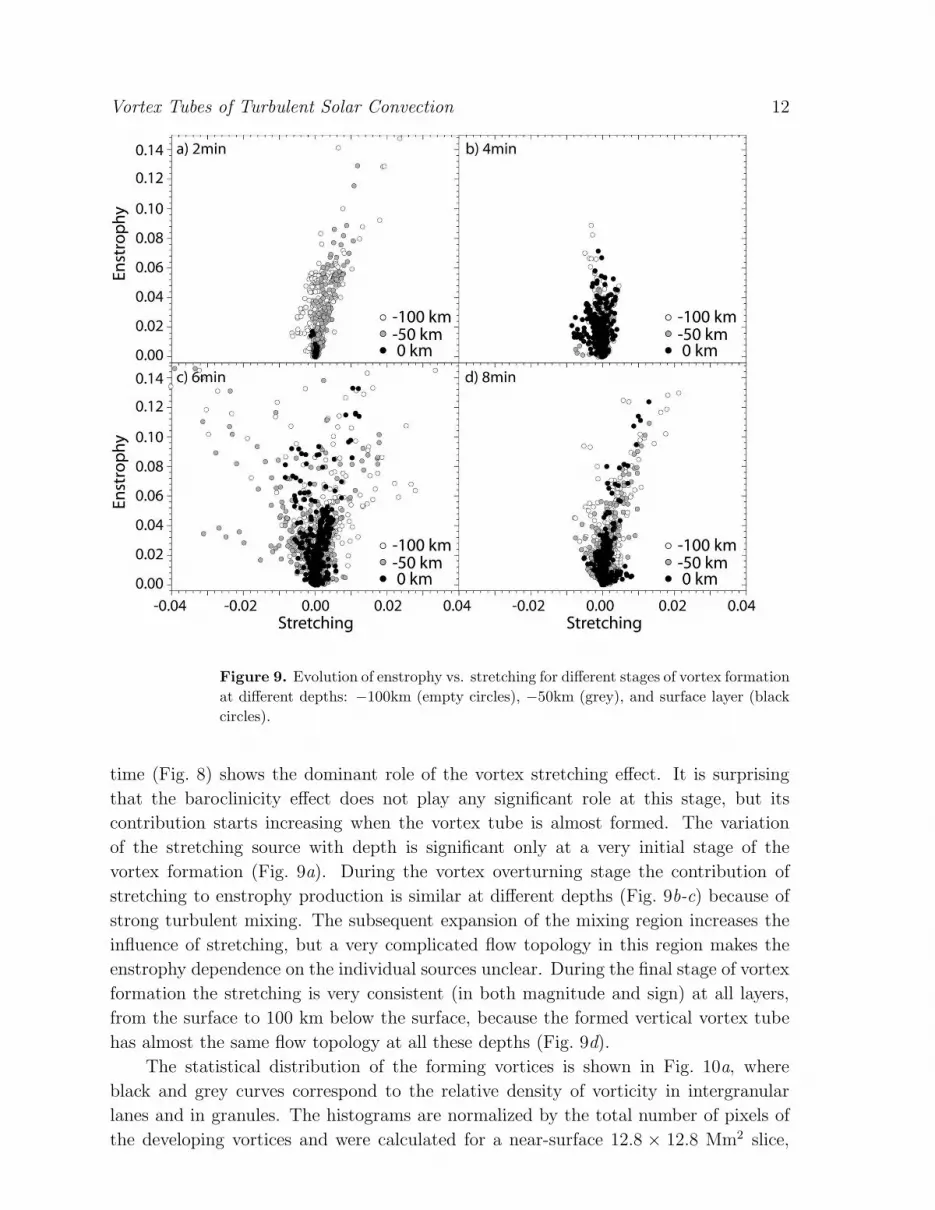
Figure 9. Evolution of enstrophy vs. stretching for different stages of vortex formation
at different depths: −100km (empty circles), −50km (grey), and surface layer (black
circles).
time (Fig. 8) shows the dominant role of the vortex stretching effect. It is surprising
that the baroclinicity effect does not play any significant role at this stage, but its
contribution starts increasing when the vortex tube is almost formed. The variation
of the stretching source with depth is significant only at a very initial stage of the
vortex formation (Fig. 9a). During the vortex overturning stage the contribution of
stretching to enstrophy production is similar at different depths (Fig. 9b-c) because of
strong turbulent mixing. The subsequent expansion of the mixing region increases the
influence of stretching, but a very complicated flow topology in this region makes the
enstrophy dependence on the individual sources unclear. During the final stage of vortex
formation the stretching is very consistent (in both magnitude and sign) at all layers,
from the surface to 100 km below the surface, because the formed vertical vortex tube
has almost the same flow topology at all these depths (Fig. 9d).
The statistical distribution of the forming vortices is shown in Fig. 10a, where
black and grey curves correspond to the relative density of vorticity in intergranular
lanes and in granules. The histograms are normalized by the total number of pixels of
the developing vortices and were calculated for a near-surface 12.8 × 12.8 Mm2 slice,
Vortex Tubes of Turbulent Solar Convection 13
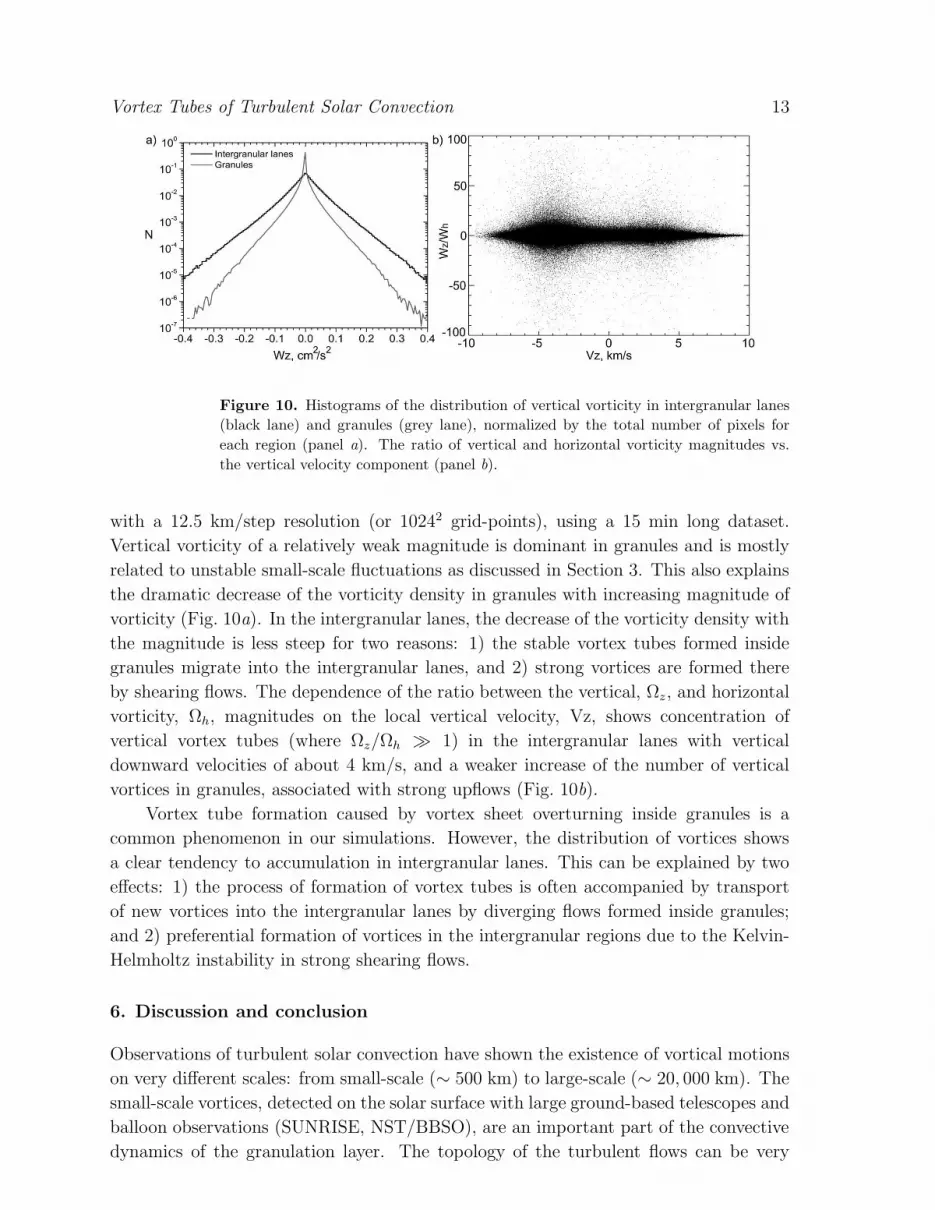
Figure 10. Histograms of the distribution of vertical vorticity in intergranular lanes
(black lane) and granules (grey lane), normalized by the total number of pixels for
each region (panel a). The ratio of vertical and horizontal vorticity magnitudes vs.
the vertical velocity component (panel b).
with a 12.5 km/step resolution (or 10242 grid-points), using a 15 min long dataset.
Vertical vorticity of a relatively weak magnitude is dominant in granules and is mostly
related to unstable small-scale fluctuations as discussed in Section 3. This also explains
the dramatic decrease of the vorticity density in granules with increasing magnitude of
vorticity (Fig. 10a). In the intergranular lanes, the decrease of the vorticity density with
the magnitude is less steep for two reasons: 1) the stable vortex tubes formed inside
granules migrate into the intergranular lanes, and 2) strong vortices are formed there
by shearing flows. The dependence of the ratio between the vertical, Ωz, and horizontal
vorticity, Ωh, magnitudes on the local vertical velocity, Vz, shows concentration of
vertical vortex tubes (where Ωz/Ωh ≫ 1) in the intergranular lanes with vertical
downward velocities of about 4 km/s, and a weaker increase of the number of vertical
vortices in granules, associated with strong upflows (Fig. 10b).
Vortex tube formation caused by vortex sheet overturning inside granules is a
common phenomenon in our simulations. However, the distribution of vortices shows
a clear tendency to accumulation in intergranular lanes. This can be explained by two
effects: 1) the process of formation of vortex tubes is often accompanied by transport
of new vortices into the intergranular lanes by diverging flows formed inside granules;
and 2) preferential formation of vortices in the intergranular regions due to the Kelvin-
Helmholtz instability in strong shearing flows.
6. Discussion and conclusion
Observations of turbulent solar convection have shown the existence of vortical motions
on very different scales: from small-scale (∼ 500 km) to large-scale (∼ 20, 000 km). The
small-scale vortices, detected on the solar surface with large ground-based telescopes and
balloon observations (SUNRISE, NST/BBSO), are an important part of the convective
dynamics of the granulation layer. The topology of the turbulent flows can be very
Vortex Tubes of Turbulent Solar Convection 14
complicated and is often accompanied by arc-like vortical structures above the surface
(Fig. 6c), which link the convective subsurface layers with the atmosphere. Therefore,
a division of vortical structures into different types, e.g. horizontal and vertical vortex
tubes, vortex sheets, etc., is only a simplification of the real picture of the turbulent
flow.
For this initial investigation we concentrated on purely hydrodynamic turbulent
effects, although magnetic fields undoubtedly play a very important role in vortex tube
formation. The simulation results have shown that vortex tubes are mostly concentrated
in the intergranular lanes, but they are also formed inside the convective granules
(Fig. 1). Vortex tube formation can be initiated by two basic processes: 1) small-scale
convective instability leading to localized upflows inside granules, and 2) the Kelvin-
Helmholtz instability of shearing flows in the intergranular lanes.
The convective granular instability usually results in small-scale local upflows inside
granules, which initially form vortex sheets. Flow overturning in these sheets and their
simultaneous advection into intergranular lanes produce vertically oriented vortex tubes
(Figs. 3, 6). It is interesting that a similar process occurring during splitting of granules
can be a source of a series of different types of vortices (Fig. 5). The mechanism of
vortex tube formation due to the Kelvin-Helmholtz instability (Fig. 7a) works mostly
in the intergranular lanes, where horizontal shearing flows are the strongest. The
3D topological structure of the shearing flows determines the dynamical properties of
the vortices and their extension into the interior. The simulations reveal that vortex
formation is a very common process on small scales not yet resolved in solar observations.
Acknowledgments
This work was partially supported by the NASA grant NNX10AC55G, the International
Space Science Institute (Bern) and Nordita (Stockholm). The authors thank Douglas
Gough, Phil Goode, Vasyl Yurchshin, Valentyna Abramenko, and participants of the
Nordita and ISSI teams for interesting discussions and useful suggestions.
References
[1] Kitiashvili, I. N., Kosovichev, A. G., Wray, A. A. & Mansour, N. N. 2009, ApJ, 700, L178.
[2] Kitiashvili I N, Kosovichev A G, Wray A A and Mansour N N 2010 ApJ 719 307.
[3] Rempel, M. 2011, ApJ, 740, 15.
[4] Stein, R. F., Lagerfjard, A., Nordlund, A& Georgobiani, D. 2011, Solar Physics, 268, 271.
[5] Stein, R. F. & Nordlund, A. 2000, Annals of the New York Academy of Sciences, 898, 21. doi:
10.1111/j.1749-6632.2000.tb06161.x
[6] Steiner O, Franz M, Bello Gonzlez N, Nutto Ch, Rezaei R, Martnez Pillet V, Bonet Navarro J A,
del Toro Iniesta J C, Domingo V, Solanki S K, Knolker M, Schmidt W, Barthol P and Gandorfer
A. 2010 ApJ 723 L180.
[7] Kitiashvili I N, Kosovichev A G, Mansour N N and Wray A A 2011 ApJ 727 L50
[8] Brandt, P. N., Scharmer, G. B., Ferguson, S., Shine, R. A., Tarbell, T. D. & Title, A. M. 1988,
Nature, 335, 238.
[9] Wang Y, Noyes R W, Tarbell T D and Title A M 1995 ApJ 447 419.
Vortex Tubes of Turbulent Solar Convection 15
[10] Potzi W and Brandt P N 2005 Hvar Obs. Bull. 29 61.
[11] Bonet J A, Marquez I, Sanchez Almeida J, Cabello, I and Domingo V 2008 ApJ 687 L131.
[12] Bonet, J. A., Marquez, I., Sanchez Almeida, J., Palacios, J., Martinez Pillet, V., Solanki, S. K.,
del Toro Iniesta, J. C., Domingo, V., Berkefeld, T., Schmidt, W., Gandorfer, A., Barthol, P. &
Knoelker, M. 2010, ApJ, 723, L139.
[13] Brandenburg, A., Jennings, R.L., Nordlund, A., Rieutord, M., Stein, R.F. & Tuominen, I. 1996,
J. Fluid Mech., 306, 325.
[14] Jacoutot, L., Kosovichev, A. G., Wray, A. A. & Mansour, N. N. 2008, ApJ, 682, 1386.
[15] Christensen-Dalsgaard, J., Dppen, W., Ajukov, S. V., Anderson, E. R., Antia, H. M., Basu,
S., Baturin, V. A., Berthomieu, G., Chaboyer, B., Chitre, S. M., Cox, A. N., Demarque, P.,
Donatowicz, J., Dziembowski, W. A., Gabriel, M., Gough, D. O., Guenther, D. B., Guzik, J.
A., Harvey, J. W., Hill, F., Houdek, G., Iglesias, C. A., Kosovichev, A. G., Leibacher, J. W.,
Morel, P., Proffitt, C. R., Provost, J., Reiter, J., Rhodes Jr., E. J., Rogers, F. J., Roxburgh, I.
W., Thompson, M. J.& Ulrich, R. K. 1996, Science, 272, 1286.
[16] Stein, R. F. & Nordlund, A. 1998 ApJ, 499, 914.
[17] Kitai, R. & Kawaguchi, I. 1979, Solar Physics, 64, 3.
[18] Roudier, Th. Lignieres, F., Rieutord, M., Brandt, P.N. & Malherbe, J. M. 2003, A&A, 409, 299.
[19] Porter, D. H. & Woodward, P. R. 2000, ApJ Suppl. Ser., 127, 159.

![Calix[4]tubes: An Approach to Functionalization](https://static.documents.page/doc/80x56/634ce6ef7b55c75a3406c83f/calix4tubes-an-approach-to-functionalization.jpg)


