
Atmospheric Environment Vol. 22, No. 5, pp. 907-916, 1988. 0004~981/88 $3.00+0.00 Printed in Great Britain. © 1988 Pergamon Press plc
SEASONAL A N D TEMPORAL CHANGES OF ORGANIC C O M P O U N D S IN RAIN A N D SNOW
JEAN CZUCZWA*, CHRISTIAN LEUENBERGER~" and WALTER GIGER~ Swiss Federal Institute of Water Resources and Water Pollution Control (EAWAG) and Federal
Institute of Technology, CH-8600 Diibendorf, Switzerland
(First received 25 February 1987 and received for publication 14 October 1987)
Abstract--Alkylbenzenes, polycyclic aromatic hydrocarbons and chlorinated hydrocarbons were de- termined in rain and snow collected during 1985 at an urban site in Switzerland. Although great variations in concentrations were found for each season and type of precipitation event, concentrations and wet depositions of the investigated compounds were significantly lower in summer than in winter precipitation. Snow contained the highest concentrations of alkylbenzenes, i.e. total concentrations of up to 10/~g/-~. Non-polar organic chemicals, measured sequentially during three rain events, exhibited a variety of temporal trends which can best be explained by changing sources and moving air masses.
Key word index: Organic compounds, alk~'lbenzenes, polycyclic aromatic hydrocarbons, chlorinated hydrocarbons, hexachlorocyclohexane, tetrachloroethene, rain, snow.
I N T R O D U C T I O N
One important process affecting the fate of organic compounds in the atmosphere is their removal by precipitation. The resulting input into the aquatic and terrestrial ecosystems has some important impacts on their quality. The deposition of pollutants, for in- stance, to natural waters can negatively affect the quality of the raw waters used for drinking water. The wet and dry deposition of phytotoxic organic com- pounds to plant surfaces may also contribute to the causes of forest decline (Leuenberger et al., 1988a).
The wet removal of organic chemicals, which de- pends on the properties of the compound and the type of precipitation, has been reviewed by Scott (198 l) and Eisenreich et al. (1981). These authors have proposed that wet removal of gaseous organic compounds (OC) is an equilibrium process between the gas and aqueous phases and follows Henry's Law. Pankow et al. (1984) and Ligocki et al. (1985a) have determined gas scav- enging ratios (Wg) for non-polar organic compounds (NPOC) by concurrent rain and air sampling at ground level.
C rain, dissolved
W g -- C air, g as (I)
The presence of equilibrium was verified by use of the following equation:
¢t = R T / H = R T S / P = W g (2)
* Present address: Battelle Columbus Division, 505 King Avenue, Columbus, OH 43201, U.S.A.
t Present address: Gesundheitsinspektorat der Stadt Ziirich, Walchestrasse 33, CH-8035 Zfirich, Switzerland.
~. To whom correspondence should be addressed.
where R is the gas constant (8.2 x 10 -5 m 3 arm mol - ~ K - 1), T is the absolute temperature (K), H is the Henry's constant (m 3 atm mol- 1), S is the water solubility of the pure compound (mol m- 3) and P is its vapour pressure (atm). For several compounds agree- ment was found between measured (Wg) and calcu- lated scavenging ratios (c 0. For NPOC such as tri- and tctrachloroethene (H ~ 10-2), chlorobenzenes (H ~ l0 -3) and alkylbenzenes (AB; H ~ 10-s), gas scavenging by rain should not be large (Wg ~ 10). However, more polar compounds, such as phenols (H
10 -~) should be well scavenged (W s ~ 104-105). Scavenging of gaseous compounds by snow is not well understood. The solubility of gases in ice is negligible, but gaseous compounds may be incorporated by water droplets which subsequently freeze (Pruppacher and Klett, 1981) or by organic films (Gill et al., 1983).
Although much of the previous work has been on inorganic chemicals, organic compounds have recently been widely measured in rain and snow. Among those compounds reported are volatile NPOC (Kawamura and Kaplan, 1983; Pankow et al., 1984; Ligocki et al.,
1985a), polycyclic aromatic hydrocarbons (PAH) (Lunde et al., 1977; Ligocki et al., 1985a, b; Kawamura and Kaplan, 1983, 1986a,b; van Noort and Wondergem, 1985; Leuenberger et al., 1988b), phenols (Leuenberger et al., 1985, 1988a; Kawamura and Kaplan, 1983), chlorinated hydrocarbons (Eisenreich et al., 1981; Strachan and Huneauit, 1984; Leuenberger et al., 1985; Ligocki et al., 1985a), n-alkanes and long- and short-chain organic acids (Lunde et al., 1977; Meyers and Hites, 1982; Ligocki et al., 1985a, b; Kawamura and Kaplan, 1983, 1984, 1986a).
We report here seasonal and temporal changes in the concentration of dissolved-phase NPOC, which are present in the gaseous phase in the atmosphere, in
907
9118 JtAN ( z t (/V~A et ai
prec ip i ta t ion at an u r b a n site in Switzer land.
C o n c e n t r a t i o n da ta for N P O C assoc ia ted with sus-
p e n d e d par t ic les in ra in are p resen ted in a c o m p a n i o n
pape r ( L e u e n b e r g e r et al., 1988b). T he first par t o f this
pape r c o n c e r n s s easona l d i f ferences a n d the role o f
p rec ip i ta t ion type, a d d r e s s i n g the ques t i on o f w h e t h e r
s n o w or ra in scavenge o rgan ic p o l l u t a n t s m o r e ef-
ficiently. We a lso p re sen t c h a n g e s f o u n d in N P O C in
p rec ip i ta t ion col lected over a s ingle week in F e b r u a r y
1985 t two rain a n d two s n o w events l to inves t iga te
s h o r t - t e r m changes . In a th i rd part , we d i scuss shor t -
t e rm va r i a t ions o f N P O C m e a s u r e d d u r i n g ind iv idua l
rain events .
EXPERIMENt AL
trations of NPOC are corrected for recovery, which averaged 95 ",,. However, Lindane recovery was ~ 70",,.
In addition, sequential rain samples were collected using the 0.9 m 2 funnel of the rain sampler in 1 / amber bottles II0-90 min sample t) which were stored without headspace at 4 C until analysis (0-3 days). Volatile NPOC were measured using the closed-loop gaseous stripping analysis ICLSA) method developed by Grob and Z~rcher 11976) and HRGC/FID (using a 55 m column coated with an OV-tT01 liquid phase of 1.2 iLm thicknessj. Quality assurance pro- cedures included blanks, replicates (S = _+ 5 ",,) and recovery ( > 90 ",,~, however the results reported are not corrected for recovery. Blanks showed levels of volatile NPOC of 5 24 n g / ~ for both methods used. The reported values are not corrected for the blank levels.
Information on air temperature and precipitation amounts was obtained from a monitoring station of the Swiss Meteorological Institute close to our field sampling site and is also given in Table 1.
The sampling location was adjacent to the EAWAG building in Diibendorf (near Z/irich), Switzerland. The dates of sampling and corresponding meteorological information are given in Table 1. The sampling procedures are described in detail elsewhere (Leuenberger, 1988b). Briefly, a 0.9 m 2 wet- only rain sampler, designed by Pankow et al. (1984), was used for the on-line collection of both particulate and filterable OC in rain and snow by use of a 0.2/~m silver filter and Tenax GC cartridges, respectively. After chromatographic clean-up, NPOC in the filterable and particulate fractions were quanti- tated by H R G C / M S (Leuenberger et al., 1988b). The concen-
RESULTS ANt) DISCUSSION
S e a s o n a l var ia t ions
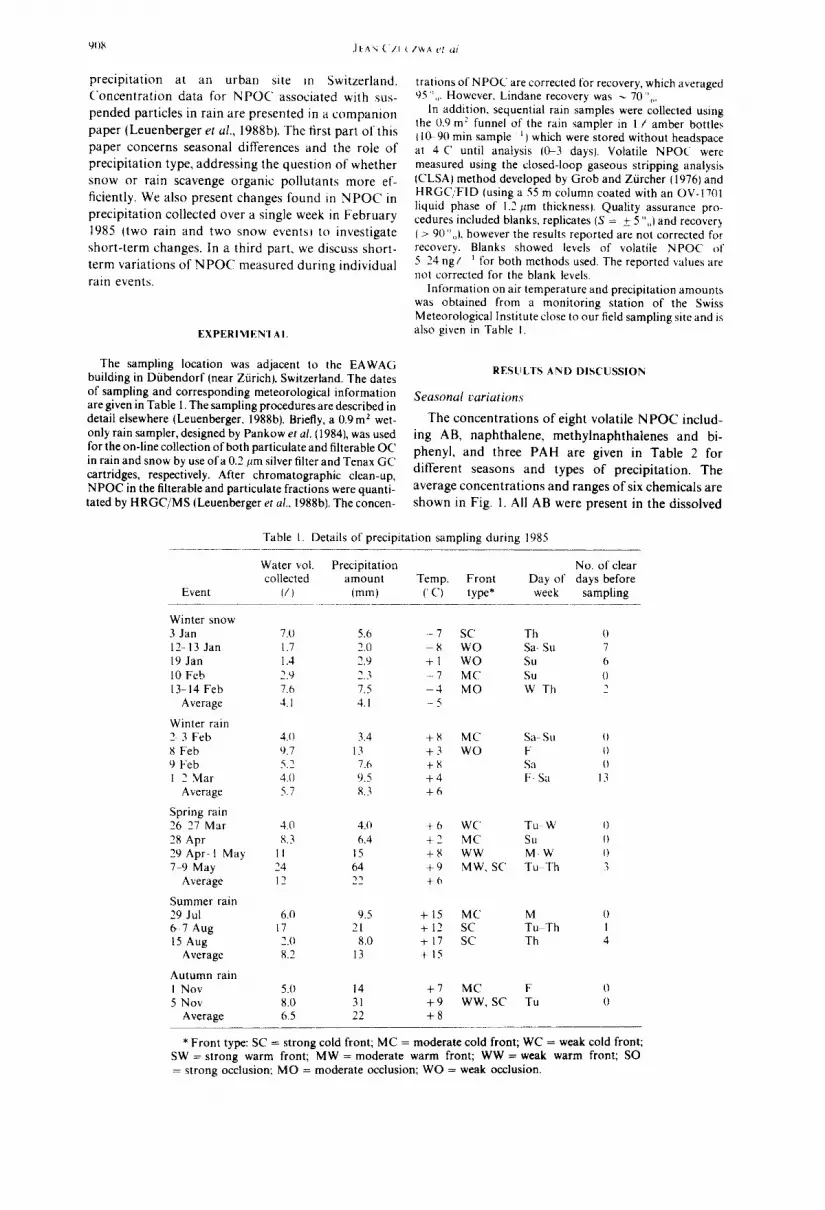
T h e c o n c e n t r a t i o n s o f e ight volat i le N P O C inc lud-
ing AB, n a p h t h a l e n e , m e t h y l n a p h t h a l e n e s a n d bi-
phenyl , a n d three P A H are given in Tab le 2 for
d i f ferent s e a s o n s a n d types o f p rec ip i ta t ion . T h e
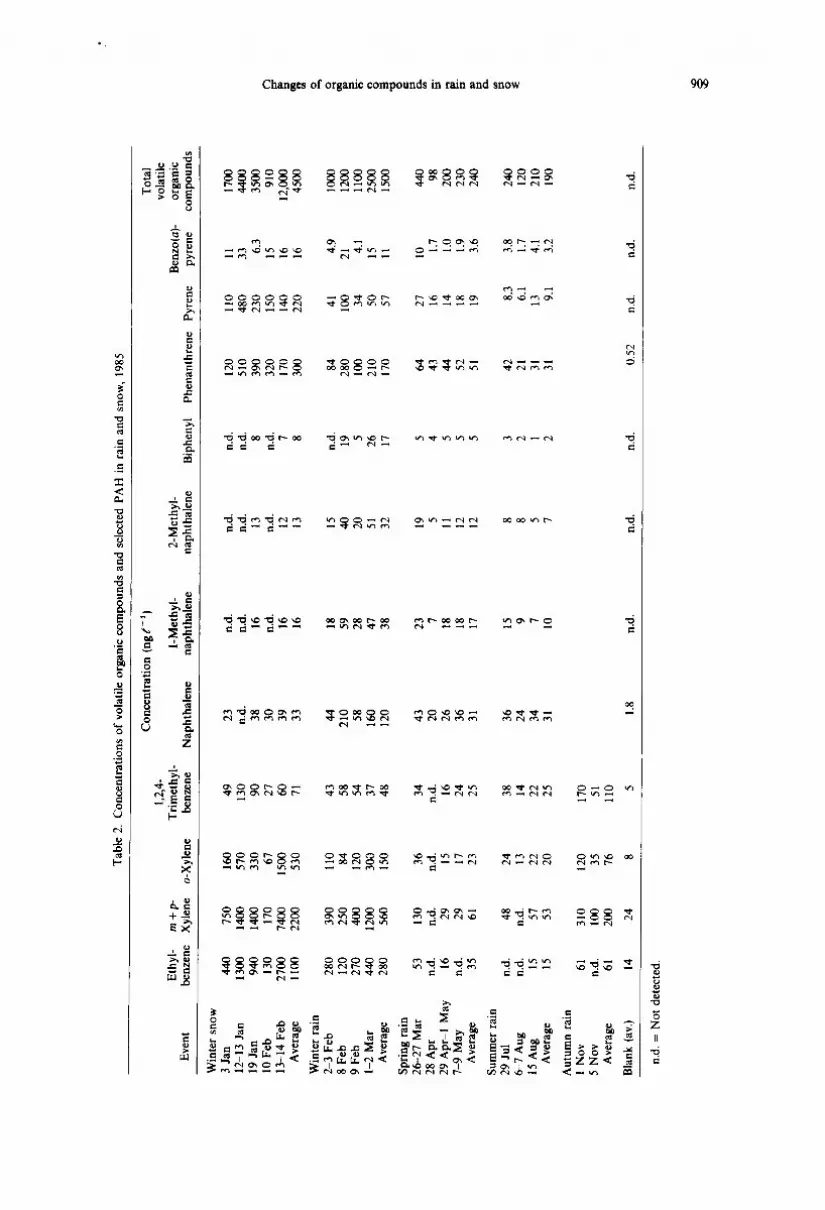
average c o n c e n t r a t i o n s a n d r anges o f six chemica l s a re
s h o w n in Fig. 1. All AB were p re sen t in the d isso lved
Table 1. Details of precipitation sampling during 1985
Event
Water vol. Precipitation No. of clear collected amount Temp. Front Day of days before
(/) (mm) (' C) type* week sampling
Winter snow 3 Jan 7.0 12-13Jan 1.7 19 Jan 1.4 10 Feb 2.9 13 14 Feb 7.6
Average 4.1
Winter rain 2 3 Feb 4.0 8 Feb 9.7 9 Feb 5.2 1 2 Mar 4.0
Average 5.7
Spring rain 26 27 Mar 4.0 28 Apr 8.3 29Apr 1 May 11 7 9 May 24
Average 12
Summer rain 29 Jul 6.0 6~7 Aug 17 15 Aug 2.0
Average 8.2
Autumn rain 1 Nov 5.0 5 Nov 8.0
Average 6.5
5.6 - 7 SC Th 0 2.0 8 WO Sa- Su 7 2.9 + 1 WO Su 6 2.3 - 7 MC Su 0 7.5 - 4 MO W Th 2 4.1 - 5
3.4 + 8 MC Sa Su () 13 + 3 WO F {)
7.6 + 8 Sa 0 9.5 + 4 F Sa 13 8.3 + 6
4.1) + 6 W(" Tu W 0 6.4 + 2 MC Su 0
15 +8 WW M W 0 64 + 9 MW, SC Tu Th 3 22 + 6
9.5 + 15 MC M 0 21 + 12 SC Tu Th 1
8.0 + 17 SC Th 4 13 +15
14 + 7 MC F 0 31 + 9 WW, SC Tu 0 22 + 8
* Front type: SC = strong cold front; MC = moderate cold front; WC = weak cold front; SW = strong warm front; MW = moderate warm front; WW = weak warm front; SO = strong occlusion; M O = moderate occlusion; WO = weak occlusion.
.°
Tab
le 2
. C
once
ntra
tion
s of
vol
atil
e or
gani
c co
mp
ou
nd
s an
d se
lect
ed P
AH
in
rain
and
sno
w,
1985
Eth
yl-
m +
p-
Eve
nt
benz
ene
Xyl
ene
Con
cent
rati
on (
ng
t- '
) 1,
2,4-
T
rim
ethy
l-
l-M
ethy
l-
2-M
ethy
l-
o-X
ylen
e be
nzen
e N
apht
hale
ne
naph
thal
ene
naph
thal
ene
Bip
heny
l P
hena
nthr
ene
Pyr
ene
Benz
o(a)
- py
rene
Tot
al
vola
tile
or
gani
c co
mp
ou
nd
s
Win
ter
snow
3
Jan
440
750
12-1
3 Ja
n 13
00
1400
19
Jan
94
0 14
00
10 F
eb
130
170
13-1
4 F
eb
2700
74
00
Ave
rage
11
00
2200
Win
ter
rain
2-
3 F
eb
280
390
8 F
eb
120
250
9F
eb
270
400
1-2
Mar
44
0 12
00
Ave
rage
28
0 56
0
Spr
ing
rain
2
6-2
7M
ar
53
130
28
Ap
r n.
d.
n.d.
2
9A
pr-
I M
ay
16
29
7-9
May
n.
d.
29
Ave
rage
35
61
Sum
mer
rai
n 29
Jul
n.
d.
48
6-7
Aug
n.
d.
n.d.
15
Aug
15
57
A
vera
ge
15
53
Au
tum
n r
ain
1 N
ov
61
310
5 N
ov
n.d.
10
0 A
vera
ge
61
200
Bla
nk (
av.)
14
24
160
49
23
n.d.
n.
d.
n.d.
12
0 11
0 57
0 13
0 n.
d.
n.d.
n.
d.
n.d.
51
0 48
0 33
0 90
38
16
13
8
390
230
67
27
30
n.d.
n.
d.
n.d.
32
0 15
0 15
00
60
39
16
12
7 17
0 14
0 53
0 71
33
16
13
8
300
220
110
43
44
18
15
n.d.
84
41
84
58
21
0 59
40
19
28
0 10
0 12
0 54
58
28
20
5
100
34
300
37
160
47
51
26
210
50
150
48
120
38
32
17
170
57
36
34
43
23
19
5 64
27
n.
d,
n.d.
20
7
5 4
43
16
15
16
26
18
11
5 44
14
17
24
36
18
12
5
52
18
23
25
31
17
12
5 51
19
24
38
36
15
8 3
42
8.3
13
14
24
9 8
2 21
6.
1 22
22
34
7
5 1
31
13
20
25
31
10
7 2
31
9.1
120
170
35
51
76
110
8 5
1.8
n.d.
n.
d.
n.d.
0.
52
n,d.
11
33 6.3
15
16
16 4.9
21 4.1
15
11
10 1.7
1.0
1.9
3.6
3.8
1.7
4.1
3.2
n.d.
1700
44
0O
3500
91
0 12
,000
45
00
1000
12
00
1100
25
00
1500
440 98
20
0 23
0 24
0
240
120
210
190
n.d.
t'3
~r o O 8 3.
O
n.d.
= N
ot d
etec
ted.
~D
9]() JEAN CZt:('ZWA et al.
T ;/' 2~oo i i l
i
2000j
1500
o
10001 c : a. ,
3
u
snow I rain/ winter
[ ] ethylbenzene [ ] m+p-xylene [ ] o-xytene [ ] naphthatene [ ] pyrene [ ] benzoIa ] pyrene ]~ range
1 rain/ J rain/ I rain/ I sprlnq summer autumn
Fig. 1. Concentrations of organic compounds in rain and snow (average values and ranges in ng/ - l).
phase, i.e. extracted by the Tenax cartridges, suggesting that these compounds are scavenged as gases. Phenanthrene, pyrene and benzo(a)pyrene were as- sociated to some degree with the particles (averages of 10, 30 and > 80'~o, respectively for rain samples), indicating the effects of both particle and gas scaveng- ing. A detailed discussion of filterable and particulate phase distributions of n-alkanes and PAH is presented by Leuenberger et al. (1988b).
Alkylbenzenes were the dominant volatile organic component showing differences in the concentrations between seasons and type of precipitation. We ob- served the following concentration sequence (con- firmed by rank order statistics):
snow and winter rain > autumn rain > spring and summer rain.
Surprisingly, snow contained the highest observed AB concentrations, with total AB up to 10/~g/ 1.
It is not clear why AB were so abundant in snow samples• These compounds may be incorporated into snow when subcooled water droplets (containing their load of alkylbenzenes) become attached to snow- flakes. However this process would occur primarily in clouds Cat higher altitudes) and would require air concentrations of AB similar to or higher than those found at ground-level. A second possibility is that organic films, which may be present on snowflakes (Gill et al., 1983), collect gaseous compounds. This second possibility seems less likely, since the diffusion of gases into organic films would be slower than into water (Gill et al., 1983)•
In Table 2, one notes a large variation of concentra- tions of volatile organics within each season/type of
precipitation (e.g., ethylbenzene concentrations in snow ranged from 120 to 2600 n g f - ~). The variation of AB concentrations could not be explained by the number of previous days without precipitation or by the type of weather front, and, unlike the findings of Kawamura and Kaplan (1986a), the concentrations were not inversely proportional to the amount of wet precipitation. The latter point suggests that the AB are washed-out continuously during an entire precipi- tation event rather than at an early stage.
Despite the large variation within each season/type of precipitation, the mean concentrations of AB in winter precipitation (snow and rain) were significantly greater than those in spring and summer precipitation. Indeed, some spring and summer samples had concen- trations not significantly different from those in the blanks.
The major sources of AB were probably car traffic, aircraft take-off and landing (the sampling site is very close to two major airports), fuel handling and indus- trial solvent use. Because the sampling site was located close to major sources (e.g. highways, major roads and industry), one would expect large short-term vari- ations• However, these sources should be, on average, of equal magnitude throughout the year.
The lower concentrations of AB in spring and summer precipitation can be only partly explained by temperature differences (H decreases by a factor of approximately two for every decrease in temperature of 10°C). A second explanation may be increased atmospheric mixing heights in summer, resulting in a dilution of atmospheric concentrations of these com- pounds. A third explanation could be higher atmos- pheric reactivities, and thus lower air concentrations of
Changes of organic compounds in rain and snow 911
these compounds during summer months. In fact, using Equation (1), and a-values from Mackay and Shiu ( 1981), for m- + p-xylene ~ = 3.5 (averaged) and o- xylene ~ = 4.8, we can estimate the average equilib- rium air concentration of these compounds during the rain events (see Table 3).
Possible increased sinks for AB during summer would be increased photoreactivity or reactivity with OH radicals (Atkinson et al., 1979), thought to be more abundant in summer according to modeling studies by Hewitt and Harrison (1985). In addition, the reaction of AB with OH radicals could also occur in raindrops (Graedel and Goldberg, 1983) and would also be expected to be highest in summer.
Naphthalene and methylnaphthalenes were also present in the precipitation samples (see Table 2 and Fig. 1). The parent compound, naphthalene, was always present at a higher concentration than the methyinaphthalenes, suggesting combustion sources of these compounds (assuming similar scavenging behaviour). There was a seasonal trend for naph- thalenes in rain, with higher concentrations in winter,
Table 3. Measured rain concentrations (ng/ ~1 and estimated air concentrations
(/~g m 3) of xylenes
Concentration m + p-Xylene o-Xylene
Event Rain Air Rain Air
Winter 560 160 150 31 Spring 61 17 23 4.8 Summer 53 15 20 4.2 Autumn 200 57 76 16
however concentrations in snow were lower than in winter rain.
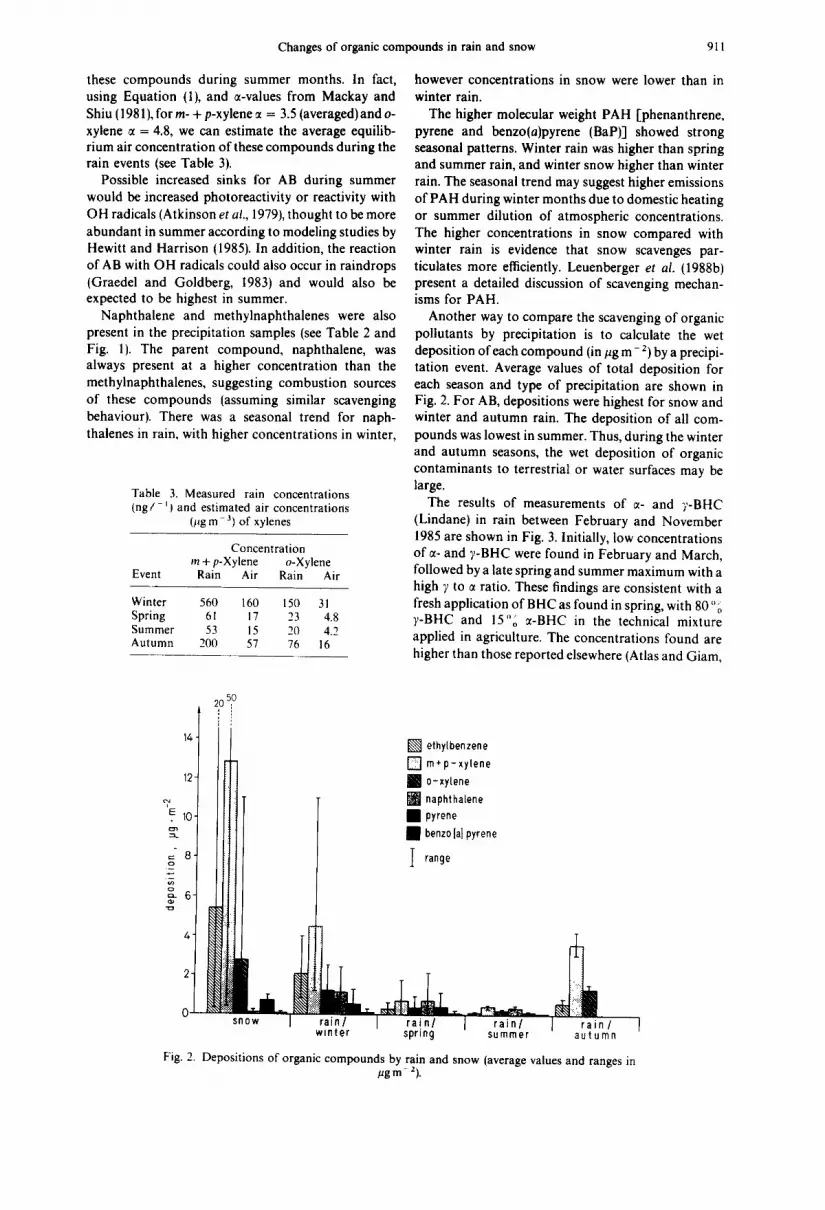
The higher molecular weight PAH [phenanthrene, pyrene and benzo(a)pyrene (BaP)] showed strong seasonal patterns. Winter rain was higher than spring and summer rain, and winter snow higher than winter rain. The seasonal trend may suggest higher emissions of PAH during winter months due to domestic heating or summer dilution of atmospheric concentrations. The higher concentrations in snow compared with winter rain is evidence that snow scavenges par- ticulates more efficiently. Leuenberger et al. (1988b) present a detailed discussion of scavenging mechan- isms for PAH.
Another way to compare the scavenging of organic pollutants by precipitation is to calculate the wet deposition of each compound (in/~g m - 2) by a precipi- tation event. Average values of total deposition for each season and type of precipitation are shown in Fig. 2. For AB, depositions were highest for snow and winter and autumn rain. The deposition of all com- pounds was lowest in summer. Thus, during the winter and autumn seasons, the wet deposition of organic contaminants to terrestrial or water surfaces may be large.
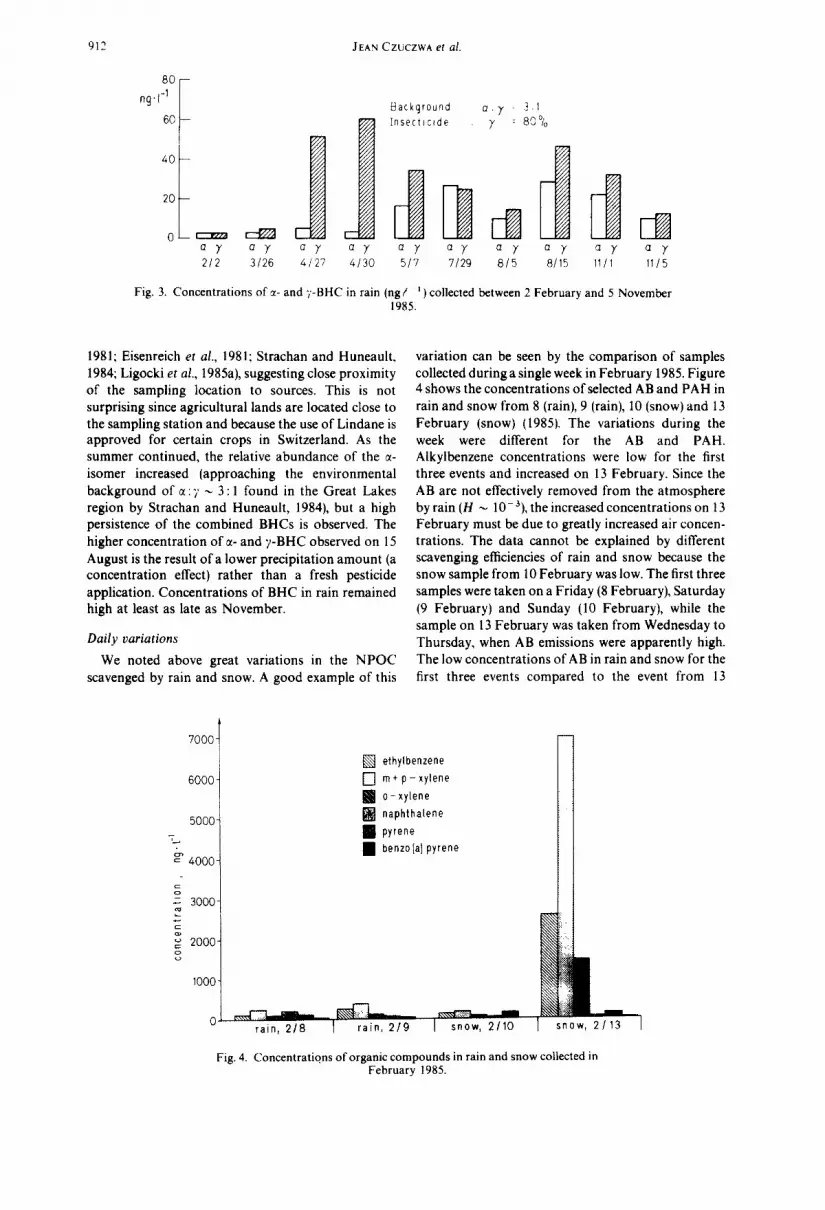
The results of measurements of ~- and )'-BHC (Lindane) in rain between February and November 1985 are shown in Fig. 3. Initially, low concentrations of co- and 7-BHC were found in February and March, followed by a late spring and summer maximum with a high 7 to a ratio. These findings are consistent with a fresh application of B HC as found in spring, with 80 "o 7-BHC and 15"o ~-BHC in the technical mixture applied in agriculture. The concentrations found are higher than those reported elsewhere (Atlas and Giam,
20 ~=o
14 [ ] ethylbenzene [ ]m*p-xy lene
12 • o-xytene [ ] naphthalene
'.E 10 • pyrene • benzo [a] pyrene
o= 8 I range
¢n o
snow I rain/ I rain/ I rain/ winter spring summer
I rain/ autumn
Fig. 2. Depositions of organic compounds by rain and snow (average values and ranges in ,ug m-2).
912 JEAN CZUCZWA et al.
ng'l-1 Background a. 7 - 3,1 60 ~ Insecticide 7 : 80%
40 z/z
20
a 7 a 7 a 7 a 7 e 7 a 7 a 7 e 7 a 7 212 3/26 4/27 4•30 5/7 7/29 8/5 8/15 11/1
7000-
Fig. 3. Concentrations of ct- and 7-BHC in rain (ng/ ~ ) collected between 2 February and 5 November 1985.
1981; Eisenreich et al., 1981; Strachan and Huneault, 1984; Ligocki et al., 1985a), suggesting close proximity of the sampling location to sources. This is not surprising since agricultural lands are located close to the sampling station and because the use of Lindane is approved for certain crops in Switzerland. As the summer continued, the relative abundance of the or- isomer increased (approaching the environmental background of ct : 7 ~ 3 : 1 found in the Great Lakes region by Strachan and Huneault, 1984), but a high persistence of the combined BHCs is observed. The higher concentration of 7- and 7-BHC observed on 15 August is the result of a lower precipitation amount (a concentration effect) rather than a fresh pesticide application. Concentrations of BHC in rain remained high at least as late as November.
Daily variat ions
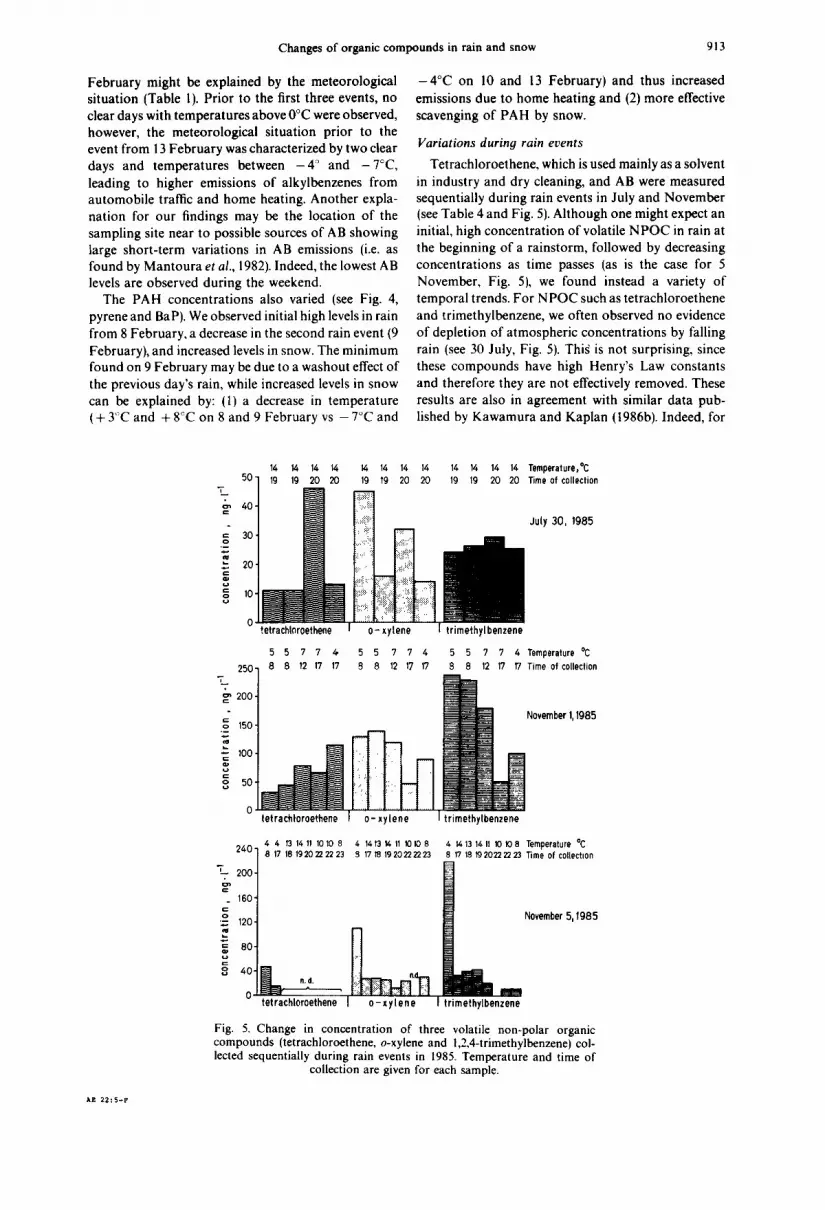
We noted above great variations in the NPOC scavenged by rain and snow. A good example of this
variation can be seen by the comparison of samples collected during a single week in February 1985. Figure 4 shows the concentrations of selected A B and PA H in rain and snow from 8 (rain), 9 (rain), 10 (snow) and 13 February (snow) (19851. The variations during the week were different for the AB and PAH. Alkylbenzene concentrations were low for the first three events and increased on 13 February. Since the AB are not effectively removed from the atmosphere by rain (H ~ 10 3), the increased concentrations on 13 February must be due to greatly increased air concen- trations. The data cannot be explained by different scavenging efficiencies of rain and snow because the snow sample from 10 February was low. The first three samples were taken on a Friday (8 February), Saturday (9 February) and Sunday (10 February), while the sample on 13 February was taken from Wednesday to Thursday, when AB emissions were apparently high. The low concentrations of AB in rain and snow for the first three events compared to the event from 13
6000
5000
= 4000
,Z : 3000
Z "' 2000- o
1000-
~ ~ ~ 1 rain, 218 I rain, 219 I snow, 2110
[ ] ethylbenzene [ ] m+p-×ylene • o- xylene [ ] naphthalene • pyrene • benzola] pyrene
1
I snow, 2113
ct 7 11/5
Fig. 4. Concentrations of organic compounds in rain and snow collected in February 1985.
Changes of organic compounds in rain and snow 913
February might be explained by the meteorological situation (Table 1). Prior to the first three events, no clear days with temperatures above 0°C were observed, however, the meteorological situation prior to the event from i 3 February was characterized by two clear days and temperatures between - 4 ° and -7°C, leading to higher emissions of alkylbenzenes from automobile traffic and home heating. Another expla- nation for our findings may be the location of the sampling site near to possible sources of AB showing large short-term variations in AB emissions (i.e. as found by Mantoura et al., 1982). Indeed, the lowest AB levels are observed during the weekend.
The PAH concentrations also varied (see Fig. 4, pyrene and BaP). We observed initial high levels in rain from 8 February, a decrease in the second rain event (9 February), and increased levels in snow. The minimum found on 9 February may be due to a washout effect of the previous day's rain, while increased levels in snow can be explained by: (1) a decrease in temperature (+ 3°C and + 8°C on 8 and 9 February vs - 7°C and
- 4 ° C on 10 and 13 February) and thus increased emissions due to home heating and (2) more effective scavenging of PAH by snow.
Variations during rain events
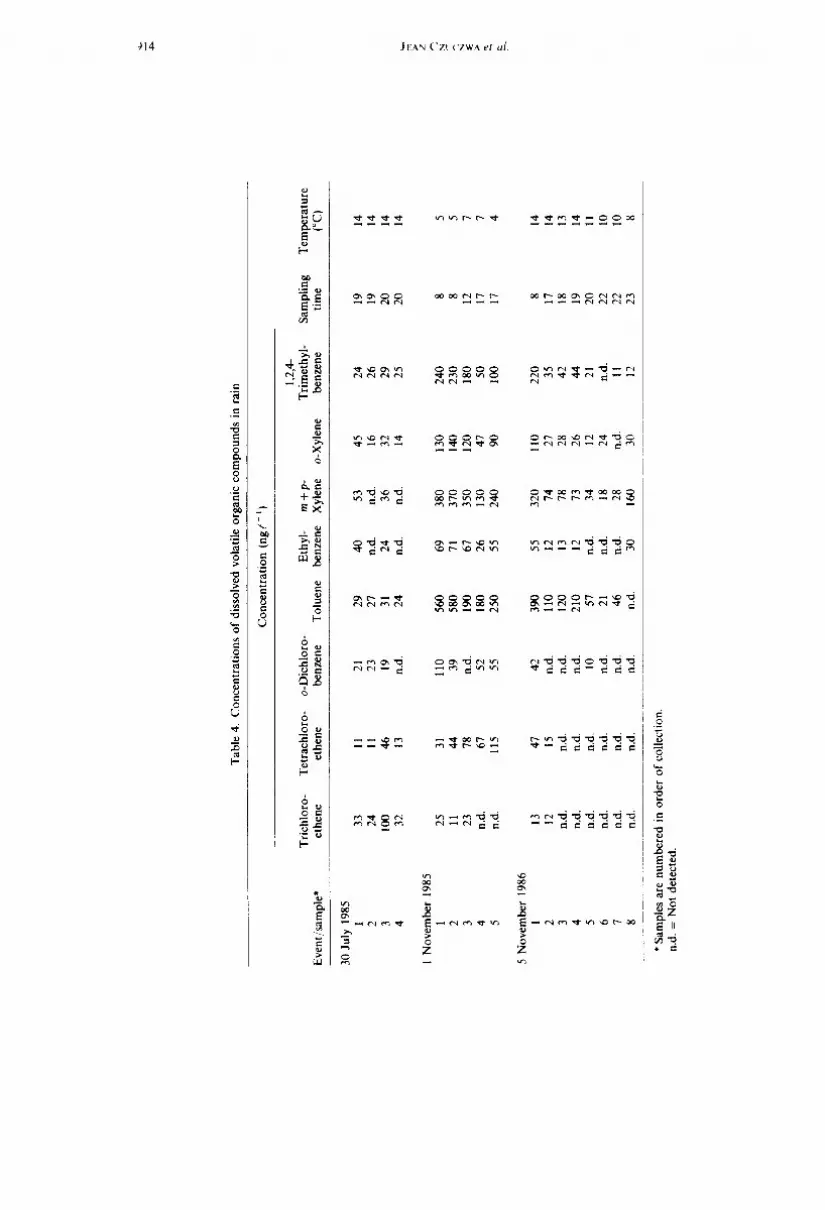
Tetrachloroethene, which is used mainly as a solvent in industry and dry cleaning, and AB were measured sequentially during rain events in July and November (see Table 4 and Fig. 5). Although one might expect an initial, high concentration of volatile NPOC in rain at the beginning of a rainstorm, followed by decreasing concentrations as time passes (as is the case for 5 November, Fig. 51, we found instead a variety of temporal trends. For NPOC such as tetrachloroethene and trimethylbenzene, we often observed no evidence of depletion of atmospheric concentrations by falling rain (see 30 July, Fig. 5). Thig is not surprising, since these compounds have high Henry's Law constants and therefore they are not effectively removed. These results are also in agreement with similar data pub- lished by Kawamura and Kaplan (1986b). Indeed, for
14 14 14 ~4 14 14 14 14 14 14 14 14 Temperature,°C 50 19 19 20 20 19 19 20 20 19 Ig 20 20 Time of collection
'" iil.l, o- xylene
250 ]
7_
m'~ 200
o ~ t~0
-- 100
§ 50
July 30, 1985
2 4 0 '
7__ 200,
. 160'
= 120.
~, 80. ~J
~ 40.
I trimethylbenzene
5 5 7 7 4, 5 5 7 7 4 5 5 7 7 4 Temperature °C 8 8 12 17 17 8 8 12 17 17 S 8 12 17 17 Time of collection
4 4 13 14 It 10 tO 8 4 t413 14 I1 I0 I0 8 4 14 13 t4 II 10 10 8 8 17 18 1920222223 S 17 t8 1920222223 8 17 1~ 1920222223
tet rachloroethene
November l, 1985
Temperature *C Time of collechon
November 5,1985
Fig. 5. Change in concentration of three volatile non-polar organic compounds (tetrachloroethene, o-xylene and 1,2,4-trimethylbenzene) col- lected sequentially during rain events in 1985. Temperature and time of
collection are given for each sample.
AE 22:5-F
4~
Tab
le 4
. C
on
cen
trat
ion
s o
f di
ssol
ved
vola
tile
org
anic
co
mp
ou
nd
s in
rai
n
Tri
chlo
ro-
Eve
nt/s
ampl
e*
ethe
ne
Co
nce
ntr
atio
n (
ng
f ~)
1,2,
4-
Tet
rach
loro
- o
-Dic
hlo
ro-
Eth
yl-
m+
p-
Tri
met
hyl-
S
amp
lin
g
Tem
per
atu
re
ethe
ne
benz
ene
Tol
uene
be
nzen
e X
ylen
e o-
Xyl
ene
benz
ene
tim
e (°
C)
30 J
uly
1985
i
33
2 24
3
100
4 32
11
21
29
40
53
45
24
19
14
11
23
27
n.d.
n.
d.
16
26
19
14
46
19
31
24
36
32
29
20
14
13
n.d.
24
n.
d.
n.d.
14
25
20
14
1 N
ov
emb
er 1
985
1 25
31
2
11
44
3 23
78
4
n.d.
67
5
n.d.
11
5
5 N
ov
emb
er 1
986
1 13
47
2
12
15
3 n.
d.
n.d.
4
n.d.
n.
d.
5 n.
d.
n.d.
6
n.d.
n.
d.
7 n.
d.
n.d.
8
n.d.
n.
d.
110
560
69
380
130
240
8 5
39
580
71
370
140
230
8 5
n.d.
19
0 67
35
0 12
0 18
0 12
7
52
180
26
130
47
50
17
7 55
25
0 55
24
0 90
10
0 17
4
42
390
55
320
110
220
8 14
n.
d.
110
12
74
27
35
17
14
n.d.
12
0 13
78
28
42
18
13
n.
d.
210
12
73
26
44
19
14
10
57
n.d.
34
12
21
20
11
n.
d.
21
n.d.
18
24
n.
d.
22
10
n.d.
46
n.
d.
28
n.d.
11
22
10
n.
d.
n.d.
30
16
0 30
12
23
8
z N 7-
2
* S
ampl
es a
re n
um
ber
ed i
n o
rder
of
coll
ecti
on.
n.d.
= N
ot
dete
cted
.
Changes of organic compounds in rain and snow 915
volatile N P O C not strongly scavenged by precipi- tation, atmospheric concentrations may not be signifi- cantly affected by falling rain.
The temporal changes can be partly explained by temperature differences. For example, on 5 November, the sample collected at 8 a.m. at an air temperature of 5°C contained higher.concentrations of AB than those collected later. However, most of the variations noted were probably due to temporal variations in the sources and moving air masses. The results show that rain concentrations (and thus atmospheric concen- trations) of these compounds changed over relatively short time scales, suggesting that we were sampling close to major sources.
It is interesting to note that on 1 November, o-xylene and trimethylbenzene followed similar temporal trends, while tetrachloroethene trends were different. This indicates that the sources of o-xylene and tri- methylbenzene were the same on this day (automobile traffic), but were separate and distinct from the source of tetrachloroethene (industrial).
SUMMARY AND CONCLUSIONS
A variety of organic compounds including AB, PAH and chlorinated hydrocarbons were measured in rain and snow samples. Large seasonal and short-term variations in concentrations were observed suggesting that the concentrations of these organic compounds in precipitation are determined by a complex interaction of emissions and meteorological conditions such as type of precipitation and air mass movements. For example, the large variations in AB observed during a single week were not expected. The results imply large short-term differences in air concentrations of the organic compounds, perhaps due to the proximity to sources. This could be tested by making concurrent air measurements and by determining organic com- pounds in rain at more remote sites.
We observed some interesting trends for the concen- trations of AB in precipitation. Although we expected relatively uniform emissions of AB during the year, we found evidence of lower summertime concentrations which might be caused by chemical reactions and physical effects.
For volatile pollutants such as AB in rain falling on land surfaces (but not water surfaces) there is a possibility of re-emission after deposition (Scott, 1981). The magnitudes of such re-emissions are un- known but would be less likely for non-volatile and particulate-bound compounds. Since volatile NPOC such as AB and tetrachloroethene are not efficiently scavenged by precipitation, and that which is deposited may be readily re-emitted, the net atmospheric losses of these compounds due to wet deposition seem to be minor.
Acknowledgments--We thank C. Schaffner for technical assistance and E. Heyerdahl for assistance in preparing the
manuscript. The authors express their appreciation to R. P. Schwarzcnbach and C. Munz for helpful comments. This work was partly fundecl by the Swiss National Science Foundation (Nationales Forschungsprogramm-14, research project on "Organic Compounds in Atmospheric Depositions").
REFERENCES
Atkinson R., Darnall K. R., Lloyd A. C., Winer A. M. and Pitts J. N. (1979) Kinetics and mechanisms of the reactions of hydroxyl radicals with organic compounds in the gas phase. Adv. Photochem. 1 I, 375-488.
Atlas E. and Giam C. S. (1981) Global transport of organic pollutants: ambient concentrations in the remote marine atmosphere. Science, Wash. 211, 163-165.
Eisenreich S. J., Looney B. B. and Thornton J. D. (1981) Airborne organic contaminants in the Great Lakes eco- system. Envir. Sci. Technol. 15, 30-38.
Gill P. S., Graedel T. E. and Weschler C. J. (1983) Organic films on atmospheric aerosol particles, fog droplets, cloud droplets, raindrops, and snowflakes. Rev. Geophys. Space Phys. 21,903-920.
Graedel T. E. and Goidberg K. I. (1983) Kinetic studies of raindrop chemistry--1. Inorganic and organic processed. J. geophys. Res. 88, 10,865-10,882.
Grob K. and Ztircher F. (1976) Stripping of trace organic substances from water. Equipment and procedure. J. Chromatogr. 117, 285-294.
Hewitt C. N. and Harrison R. M. (1985) Tropospheric concentrations of the hydroxyl radical--a review. Atmospheric Environment 19, 545-554.
Kawamura K. and Kaplan I. R. (1983) Organic compounds in the rainwater of Los Angeles. Envir. Sci. Technol. 17, 497-501.
Kawamura K. and Kaplan I. R. (1984) Capillary gas chromat- ography determination of volatile organic acids in rain and fog samples. Analyt. Chem. 56, 1616-1620.
Kawamura K. and Kaplan I. R. (1986a) Biogenic and anthropogenic organic compounds in rain and snow samples collected in Southern California. Atmospheric Environment 20, 115-124.
Kawamura K. and Kaplan I. R. (1986b) Compositional change of organic matter during precipitation events. Atmospheric Environment 20, 527-535.
Leuenberger C., Czuczwa J., Tremp J. and Giger W. (1988a) Nitrated phenols in rain: atmospheric occurrence of phyto- toxic pollutants. Chemosphere, (in press).
Leuenberger C., Czuczwa J., Heyerdahl E. and Giger W. (1988b) Hydrophobic organic compounds in urban rain, snow and fog: Origins, concentrations, seasonal variations and distributions between the dissolved and particulate phases. Atmospheric Environment 22, 695-705.
Leuenberger C., Ligocki M. P. and Pankow J. F. (1985) Trace organic compounds in r a i n ~ . Identities, concen- trations, and scavenging mechanisms for phenols in urban air and rain. Envir. Sci. Technol. 19, 1053-1058.
Ligocki M. E., Leuenberger C. and Pankow J. F. (1985a) Trace organic compounds in rain--II. Gas scavenging of neutral organic compounds. Atmospheric Environment 19, 1609-1617.
Ligocki M. E., Leuenberger C. and Pankow J. F. (1985b) Trace organic compounds in rain--III. Particle scavenging of neutral organic compounds. Atmospheric Environment 19, 1619-1626.
Lunde G., Gether J., Gjas N. and Lande M. S. (1977) Organic micropollutants in precipitation in Norway. Atmospheric Environment 11, 1007-1014.
Mackay D. and Shiu W. Y. (1981) A critical review of Henry's Law constants for chemicals of environmental interest. J. Phys. Chem. Ref. Data 10, 1175-1199.

916 JEAN CZt~CZWA et al.
Mantoura R. F. C., Gschwend P. M., Zafiriou O. C. and Clarke K. R. ~1982) Volatile organic compounds at a coastal site 2. Short-term variations. Em'ir. Sci. Technol. 16, 38~45.
Meyers P. A. and Hites R. A. (1982) Extractable organic compounds in midwest rain and snow. Atmospheric Environment 16, 2169 2175.
Pankow J. F., lsabelle L. M. and Asher W, E. 11984) Trace organic compounds in rain 1. Sampler design and analy- sis by adsorption/thermal desorption (ATD). Ent'ir. Sci. Technol. 18, 310-318.
Pruppacher H. R. and Klett J. D. (1981) Mierophysws oj Clouds and Precipitation. D. Reidel, Dordrecht, Holland.
Scott B. C. (1981) Modeling wet deposition. In Atmospheric" Pollutants in Natural Waters (edited by Eisenreich S. J.), pp. 3--21. Ann Arbor Science, Ann Arbor, Mi.
Strachan W. J. M. and Huneault H. (1984) Automated rain sampler for trace organic substances. Ent'ir. Sct. Techm)l 18, 127 130.
van Noort P. C. M. and Wondergem E. (1985) Scavenging of airborne polycyclic aromatic hydrocarbons by rain. Envir. Sci. Technol. 19, 1044 1048.


