
1
Board ownership and corporate governance indices
Sanjai Bhagat & Brian Bolton University of Colorado at Boulder
September 2006
Abstract
How is corporate governance measured? What is the relation between corporate
governance and performance? This paper sheds light on these questions while taking into account
the endogeneity of the relations among corporate governance, management turnover, corporate
performance, corporate capital structure, and corporate ownership structure. We propose
corporate board ownership as a new measure of corporate governance, and find this measure
more appropriate than measures used in the extant literature including those suggested by
Gompers, Ishii, and Metrick (GIM, 2003) and Bebchuk, Cohen and Ferrell (BCF, 2004).
1. Introduction
In an important and oft-cited paper, Gompers, Ishii, and Metrick (GIM, 2003) study the
impact of corporate governance on firm performance during the 1990s. They find that stock
returns of firms with strong shareholder rights outperform, on a risk-adjusted basis, returns of
firms with weak shareholder rights by 8.5 percent per year during this decade. Given this result,
serious concerns can be raised about the efficient market hypothesis, since these portfolios could
be constructed with publicly available data. On the policy domain, corporate governance
proponents have prominently cited this result as evidence that good governance (as measured by
GIM) has a positive impact on corporate performance.
There are three alternative ways of interpreting the superior return performance of
companies with strong shareholder rights. First, these results could be sample-period specific;
hence companies with strong shareholder rights during the current decade of 2000s may not have
exhibited superior return performance. In fact, in a very recent paper, Core, Guay and Rusticus
2
(2005) carefully document that in the current decade share returns of companies with strong
shareholder rights do not outperform those with weak shareholder rights. Second, the risk-
adjustment might not have been done properly; in other words, the governance factor might be
correlated with some unobservable risk factor(s). Third, the relation between corporate
governance and performance might be endogenous raising doubts about the causality explanation.
There is a significant body of theoretical and empirical literature in corporate finance that
considers the relations among corporate governance, management turnover, corporate
performance, corporate capital structure, and corporate ownership structure. Hence, from an
econometric viewpoint, to study the relationship between any two of these variables one would
need to formulate a system of simultaneous equations that specifies the relationships among these
variables.
What if after accounting for sample period specificity, risk-adjustment, and endogeneity,
the data indicates that share returns of companies with strong shareholder rights are similar to
those with weak shareholder rights? What might we infer about the impact of corporate
governance on performance from this result? It is still possible that governance might have a
positive impact on performance, but that good governance, as measured by GIM, might not be the
appropriate corporate governance metric.
An impressive set of recent papers have considered alternative measures of corporate
governance, and studied the impact of these governance measures on firm performance. GIM’s
governance measure is an equally-weighted index of 24 corporate governance provisions
compiled by the Investor Responsibility Research Center (IRRC), such as, poison pills, golden
parachutes, classified boards, cumulative voting, and supermajority rules to approve mergers.
Bebchuk, Cohen and Ferrell (BCF, 2004) recognize that some of these 24 provisions might
matter more than others and that some of these provisions may be correlated. Accordingly, they
create an “entrenchment index” comprising of six provisions – four provisions that limit
shareholder rights and two that make potential hostile takeovers more difficult. They find that
3
increases in this index (that is, higher entrenchment) are associated with reductions in Tobin’s Q
and lower abnormal returns during 1990-2003. Further, they find that the other eighteen IRRC
provisions excluded from their index are unrelated to changes in firm value or stock returns.
Thus, they conclude that indices with a small number of the most relevant factors are likely to be
the most appropriate measures of corporate governance.
While the above noted studies use IRRC data, Brown and Caylor (2004) use Institutional
Shareholder Services (ISS) data to create their governance index. This index considers 52
corporate governance features such as board structure and processes, corporate charter issues
such as poison pills, management and director compensation and stock ownership.
There is a related strand of the literature that considers corporate board characteristics as
important determinants of corporate governance: board independence (see Hermalin and
Weisbach (1998, 2003)), stock ownership of board members (see Bhagat, Carey, and Elson
(1999)), and whether the Chairman and CEO positions are occupied by the same or two different
individuals (see Brickley, Coles, and Jarrell (1997)). Can a single board characteristic be as
effective a measure of corporate governance as indices that consider 52 (as in Brown and Caylor),
24 (as in GIM) or other multiple measures of corporate charter provisions, and board
characteristics? While, ultimately, this is an empirical question, on both economic and
econometric grounds it is possible for a single board characteristic to be as effective a measure of
corporate governance. Corporate boards have the power to make, or at least, ratify all important
decisions including decisions about investment policy, management compensation policy, and
board governance itself. It is plausible that an independent board or board members with
appropriate stock ownership will have the incentive to provide effective monitoring and oversight
of important corporate decisions noted above; hence board independence or ownership can be a
good proxy for overall good governance. Furthermore, the measurement error in measuring board
independence or board ownership can be less than the total measurement error in measuring a
multitude of board processes, compensation structure, and charter provisions. Finally, while
4
board characteristics, corporate charter provisions, and management compensation features do
characterize a company’s governance, construction of a governance index requires that the above
variables be weighted. The weights a particular index assigns to individual board characteristics,
charter provisions, etc. is important. If the weights are not consistent with the weights used by
informed market participants in assessing the relation between governance and firm performance,
then incorrect inferences would be made regarding the relation between governance and firm
performance.
Our primary contribution to the literature is a comprehensive and econometrically
defensible analysis of the relation between corporate governance and performance. We take into
account the endogenous nature of the relation between governance and performance. Also, with
the help of a simultaneous equations framework we take into account the relations among
corporate governance, performance, capital structure, and ownership structure. We make four
additional contributions to the literature:
First, instead of considering just a single measure of governance (as prior studies in the
literature have done), we consider seven different governance measures. We find that better
governance as measured by the GIM and BCF indices, stock ownership of board members, and
CEO-Chair separation is significantly positively correlated with better contemporaneous and
subsequent operating performance. Additionally, better governance as measured by Brown and
Caylor, and The Corporate Library is not significantly correlated with better contemporaneous or
subsequent operating performance.1 Also, interestingly, board independence is negatively
correlated with contemporaneous and subsequent operating performance. This is especially
relevant in light of the prominence that board independence has received in the recent NYSE and
1 The Corporate Library (TCL) is a commercial vendor that uses a proprietary weighting scheme to include over a hundred variables concerning board characteristics, management compensation policy, and antitakeover measures in constructing a corporate governance index.
5
NASDAQ corporate governance listing requirements.2 We conduct a battery of robustness checks
including alternative estimates of the standard errors of our model’s estimated coefficients. These
robustness checks provide consistent results and increase our confidence in the performance-
governance relation as noted above. Finally, and contrary to claims in GIM and BCF, none of the
governance measures are correlated with future stock market performance.3
Second, in several instances our inferences regarding the performance-governance
relation do depend on whether or not one takes into account the endogenous nature of the relation
between governance and performance. For example, the OLS estimate indicates a significantly
negative relation between the GIM index and next year’s Tobin’s Q, and the GIM index and next
two years’ Tobin’s Q. However, after taking into account the endogenous nature of the relation
between governance and performance, we find a positive but statistically insignificant relation
between the GIM index and the one year Tobin’s Q, and again positive but statistically
insignificant relation for the two years’ Tobin’s Q.
Third, given poor firm performance, the probability of disciplinary management turnover
is positively correlated with stock ownership of board members, and with board independence.
However, given poor firm performance, the probability of disciplinary management turnover is
negatively correlated with better governance measures as proposed by GIM and BCF. In other
words, so called “better governed firms” as measured by the GIM and BCF indices are less likely
to experience disciplinary management turnover in spite of their poor performance.
Fourth, we contribute to the growing literature on the relation between corporate
governance and accounting, corporate finance and law variables. Ashbaugh-Skaife, Collins, and
Lafond (2006) investigate the relation between corporate governance and credit ratings. They
consider the GIM index and various board characteristics including board independence and
2 See SEC ruling “NASD and NYSE Rulemaking Relating to Corporate Governance,” in http://www.sec.gov/rules/sro/34-48745.htm, and http://www.sec.gov/rules/sro/nyse/34-50625.pdf. 3 The BCF index has become popular with industry experts giving advice to institutional investors on investments and proxy voting; for example, see Hermes Pensions Management (2005), and www.glasslewis.com.
6
compensation as separate governance measures. Bushman, Chen, Engel and Smith (2004) focus
on the relation between governance and the timeliness of accounting earnings; they consider
various outside blockholder and director ownership characteristics as separate measures of
governance. Defond, Hann and Hu (2005) consider the cross-sectional relation between the
market’s response to the appointment of an accounting expert on the board and its corporate
governance; they construct a governance index that gives equal weight to six variables including
board independence, the GIM index, and audit committee structure. Bowen, Rajgopal, and
Venkatachalam (2005) analyze the relation between corporate governance, accounting discretion
and firm performance; they consider several board characteristics and the GIM index as separate
measures of governance.4 Even this brief review of the literature on the relation between
governance and accounting and finance variables suggests lack of an agreed upon measure of
governance. This study proposes a governance measure, namely, dollar ownership of the board
members, that is simple, intuitive, less prone to measurement error, and not subject to the
problem of weighting a multitude of governance provisions in constructing a governance index.
Consideration of this governance measure by future accounting and finance researchers would
enhance the comparability of research findings.
The above findings have important implications for researchers, senior policy makers,
and corporate boards: Efforts to improve corporate governance should focus on stock ownership
of board members – since it is positively related to both future operating performance, and to the
probability of disciplinary management turnover in poorly performing firms. Proponents of board
independence should note with caution the negative relation between board independence and
future operating performance. Hence, if the purpose of board independence is to improve
4 Given space constraints we are unable to review the vast and growing literature on the relation between governance and accounting, finance, and corporate law variables; our apologies to the authors we have not cited here. In addition to the papers noted above, we refer the reader to Erickson, Hanlon, and Maydew (2006), Anderson, Mansi and Reeb (2004), Marquardt and Wiedman (2005), Rajan and Wulf (2006), Bergstresser and Philippon (2006), Gillan (2006), Yermack (2006), Cremers and Nair (2005), and Bebchuk and Cohen (2005).
7
performance, then such efforts might be misguided. However, if the purpose of board
independence is to discipline management of poorly performing firms, then board independence
has merit. Finally, even though the GIM and BCF good governance indices are positively related
to future performance, policy makers and corporate boards should be cautious in their emphasis
on the components of these indices since this might exacerbate the problem of entrenched
management, especially in those situations where management should be disciplined, that is, in
poorly performing firms.5
The remainder of the paper is organized as follows. The next section briefly reviews the
literature on the relationship among corporate ownership structure, governance, performance and
capital structure. Section 3 notes the sample and data, and discusses the estimation procedure.
Section 4 presents the results on the relation between governance and performance. Section 5
focuses on the impact of governance in disciplining management in poorly performing
companies. The final section concludes with a summary.
2. Corporate ownership structure, corporate governance, firm performance, and capital structure
Some governance features may be motivated by incentive-based economic models of
managerial behavior. Broadly speaking, these models fall into two categories. In agency models,
a divergence in the interests of managers and shareholders causes managers to take actions that
are costly to shareholders. Contracts cannot preclude this activity if shareholders are unable to
observe managerial behavior directly, but ownership by the manager may be used to induce
managers to act in a manner that is consistent with the interest of shareholders. Grossman and
Hart (1983) describe this problem.
5 There is considerable interest among senior policy makers and corporate boards in understanding the determinants of good corporate governance, for example, see New York Times, April 10, 2005, page 3.6, “Fundamentally;” Wall Street Journal, October 12, 2004, page B.8, “Career Journal;” Financial Times FT.com, September 21, 2003, page 1 “Virtue Rewarded.”
8
Adverse selection models are motivated by the hypothesis of differential ability that
cannot be observed by shareholders. In this setting, ownership may be used to induce revelation
of the manager's private information about cash flow or her ability to generate cash flow, which
cannot be observed directly by shareholders. A general treatment is provided by Myerson (1987).
In the above scenarios, some features of corporate governance may be interpreted as a
characteristic of the contract that governs relations between shareholders and managers.
Governance is affected by the same unobservable features of managerial behavior or ability that
are linked to ownership and performance.
At least since Berle and Means (1932), economists have emphasized the costs of diffused
share-ownership; that is, the impact of ownership structure on performance. However, Demsetz
(1983) argues that since we observe many successful public companies with diffused share-
ownership, clearly there must be offsetting benefits, for example, better risk-bearing.6 Also, for
reasons related to performance-based compensation and insider information, firm performance
could be a determinant of ownership. For example, superior firm performance leads to an increase
in the value of stock options owned by management which, if exercised, would increase their
share ownership. Also, if there are serious divergences between insider and market expectations
of future firm performance then insiders have an incentive to adjust their ownership in relation to
the expected future performance. Himmelberg, Hubbard and Palia (1999) argue that the
ownership structure of the firm may be endogenously determined by the firm’s contracting
environment which differs across firms in observable and unobservable ways. For example, if the
scope for perquisite consumption is low in a firm then a low level of management ownership may
be the optimal incentive contract.7
6 Investors preference for liquidity would lead to smaller blockholdings given that larger blocks are less liquid in the secondary market. Also, as highlighted by Black (1990) and Roe (1994), the public policy bias in the U.S. towards protecting minority shareholder rights increases the costs of holding large blocks. 7 The endogeneity of management ownership has also been noted by Jensen and Warner (1988): “A caveat to the alignment/entrenchment interpretation of the cross-sectional evidence, however, is that it treats ownership as exogenous, and does not address the issue of what determines ownership concentration for a
9
In a seminal paper, Grossman and Hart (1983) considered the ex ante efficiency
perspective to derive predictions about a firm’s financing decisions in an agency setting. Novaes
and Zingales (1999) show that the optimal choice of debt from the viewpoint of shareholders
differs from the optimal choice of debt from the viewpoint of managers.8 While the above focuses
on capital structure and managerial entrenchment, a different strand of the literature has focused
on the relation between capital structure and ownership structure; for example, see Grossman and
Hart (1986) and Hart and Moore (1990).
This brief review of the inter-relationships among corporate governance, management
turnover, corporate performance, corporate capital structure, and corporate ownership structure
suggests that, from an econometric viewpoint, to study the relationship between corporate
governance and performance, one would need to formulate a system of simultaneous equations
that specifies the relationships among the abovementioned variables. We specify the following
system of four simultaneous equations:
Performance = f1(Ownership, Governance, Capital Structure, Z1, ε1), (1a)
Governance = f2(Performance, Ownership, Capital Structure, Z2, ε 2), (1b)
Ownership = f3(Governance, Performance, Capital Structure, Z3, ε 3), (1c)
Capital Structure = f4(Governance, Performance, Ownership, Z4, ε 4), (1d)
where the Zi are vectors of control variables and instruments influencing the dependent variables
and the ε i are the error terms associated with exogenous noise and the unobservable features of
given firm or why concentration would not be chosen to maximize firm value. Managers and shareholders have incentives to avoid inside ownership stakes in the range where their interests are not aligned, although managerial wealth constraints and benefits from entrenchment could make such holdings efficient for managers.” 8 The conflict of interest between managers and shareholders over financing policy arises because of three reasons. First, shareholders are much better diversified than managers who besides having stock and stock options on the firm have their human capital tied to the firm (Fama (1980)). Second, as suggested by Jensen (1986), a larger level of debt pre-commits the manager to working harder to generate and pay off the firm’s cash flows to outside investors. Third, Harris and Raviv (1988) and Stulz (1988) argue that managers may increase leverage beyond what might be implied by some “optimal capital structure” in order to increase the voting power of their equity stakes, and reduce the likelihood of a takeover and the resulting possible loss of job-tenure.
10
managerial behavior or ability that explain cross-sectional variation in performance, ownership,
capital structure and governance. The estimation issues for the above equations are discussed in
the next section.
3. Data and estimation issues
3.1 Data
In this section we discuss the data sources for board variables, performance, leverage and
instrumental variables. All variables including governance measures are described in Table 1.
Board Variables: We obtain data on board independence, board ownership, and CEO-Chair
duality from IRRC and TCL. We also obtain board size, median director ownership, median
director age and median director tenure from these sources. The stock ownership variable does
not include options. We consider the dollar value of stock ownership of the median director as the
measure of stock ownership of board members. Our focus on the median director’s ownership,
instead of the average ownership, is motivated by the political economy literature on the median
voter; see Shleifer and Murphy (2004), and Milavonic (2004). Also, directors, as economic
agents, are more likely to focus on the impact on the dollar value of their holdings in the company
rather than on the percentage ownership.
Performance Variables: We use Compustat and Center for Research in Security Prices (CRSP)
data for our performance variables. We use the annual accounting data from Compustat for
calculating return-on-assets (“ROA”) and Tobin’s Q. Following Barber and Lyon (1996), we
calculate ROA as operating income before depreciation divided by total assets. For robustness,
we also consider operating income after depreciation divided by total assets. Similar to GIM, we
calculate Tobin’s Q as (total assets + market value of equity – book value of equity – deferred
taxes) divided by total assets. We use the CRSP monthly stock file to calculate monthly and
annual stock returns. We calculate industry performance measures by taking the four-digit SIC
code average (excluding the sample firm) performance for the specific time period.
11
Leverage: Consistent with Bebchuk, Cohen and Ferrell (2004), Graham, Lang, and Shackleford
(2004), and Khanna and Tice (2005) we compute leverage as (long term debt + current portion of
long term debt) divided by total assets. For robustness, we also consider alternative definitions of
leverage as suggested by Baker and Wurgler (2002).
Instrumental Variables: The choice of instrumental variables is critical to the consistent
estimation of (1a), (1b), (1c), and (1d).9 Our choice of instrumental variables is motivated by the
extant literature; additionally, all of our analyses involving instrumental variables include tests
for weak instruments as suggested by Stock and Yogo (2004), and the Hausman (1978) test for
endogeneity. This is discussed later in this section. We identify the following variables as
instruments for ownership, performance, governance, and capital structure.
CEO Tenure-to-Age: A CEO that has had five years of tenure at age 65 is likely to be of
different quality and have a different equity ownership than a CEO that has had five years of
tenure at age 50. These CEOs likely have different incentive, reputation, and career concerns.
Gibbons and Murphy (1992) provide evidence on this. Therefore, we use the ratio of CEO tenure
to CEO age as a measure of CEO quality, which will serve as an instrument for CEO ownership.
Treasury Stock: Palia (2001) suggests that a firm is most likely to buy back its stock
when it believes the stock to underpriced relative to where the managers think the price should
be. Thus, the level of treasury stock should be correlated with firm performance and firm value.
We expect this measure to be exogenous in the governance and ownership equations. We use the
ratio of the treasury stock to total assets as the instrument for performance.10
Currently Active CEOs on Board: Hallock (1997) and Westphal and Khanna (2003)
emphasize the role of networks among CEOs that serve on boards, and the adverse impact on the
9 The choice of appropriate instruments while never easy, is especially challenging in the context of this study. Almost any instrument variable identified for a particular endogenous variable in equation (1) will plausibly (based on extant theory and/or empirical evidence) be related to at least another, and possibly more, endogenous variable(s) in (1). Ashbaugh-Skaife, Collins, and Lafond (2006) make a similar point. 10 We consider the sum of share repurchases during the past three years (as a fraction of total assets) as an alternative instrumental variable. The results are robust to this alternative specification.
12
governance of such firms. Ex ante, there is no reason to believe that this variable will be
correlated with firm performance. We consider the percentage of directors who are currently
active CEOs as an instrument for governance.
Capital Structure instrument: We use the modified Altman’s Z-score (1968) suggested in
MacKie-Mason (1990) as the instrument for leverage. This measure is a proxy for financial
distress; the lower the Z-score, the greater the probability of financial distress. We expect this
variable to be positively correlated with leverage.11
Table 2 presents the descriptive statistics and sample sizes for the variables for all
available years and for just 2002. Table 3 presents the parametric and non-parametric correlation
coefficients among the performance and governance variables.
3.2 Estimation issues
The instruments for performance, governance, ownership and capital structure in
equations (1a), (1b), (1c) and (1d) have been discussed above. Regarding the control variables:
Prior literature, for example, Core, Holthausen and Larcker (1999), Gillan, Hartzell and Starks
(2003), and Core, Guay and Rusticus (2005), suggests that industry performance, return volatility,
growth opportunities and firm size are important determinants of firm performance. Yermack
(1996) documents a relation between board size and performance. Demsetz (1983) suggests that
small firms are more-likely to be closely-held suggesting a different governance structure than
large firms. Firms with greater growth opportunities are likely to have different ownership and
governance structures than firms with fewer growth opportunities; see, for example, Smith and
Watts (1992), and Gillan, Hartzell and Starks (2003). Demsetz and Lehn (1985), among others,
suggest a relation between information uncertainty about the firm as proxied by return volatility
and its ownership and governance structures.
11 We also considered Graham’s (1996) marginal tax rate as an instrument for leverage. The Stock and Yago (2004) test indicates that this is a weak instrument.
13
Given the abovementioned findings in the literature, in equation (1a), the control
variables include industry performance, log of assets, R&D and advertising expenses to assets,
board size, standard deviation of stock return over the prior five years, and the instrument is
treasury stock to assets. In equation (1b), the control variables include R&D and advertising
expenses to assets, board size, standard deviation of stock return over the prior five years, and the
instruments is percentage of directors who are active CEOs. In equation (1c), the control
variables include log of assets, R&D and advertising expenses to assets, board size, standard
deviation of stock return over the prior five years, and the instrument is CEO tenure to CEO age.
In equation (1d), the control variables include industry leverage, log of assets, R&D and
advertising expenses to assets, standard deviation of stock return over the prior five years, and the
instrument is Altman’s modified Z-score.
We estimate this system using ordinary least squares (OLS), two-stage least squares
(2SLS) to allow for potential endogeneity, and three-stage least squares (3SLS) to allow for
potential endogeneity and cross-correlation between the equations. If any of the right-hand side
regressors are endogenously determined, OLS estimates of (1) are inconsistent.12 Properly
specified instrumental variables (IV) estimates such as the two stage least squares (2SLS) are
consistent. The problem is which instruments to use, and how many instruments to use.
Regarding the number of instruments, we know we must include at least as many instruments as
we have endogenous variables. The asymptotic efficiency of the estimation improves as the
number of instruments increases, but so does the finite-sample bias (Johnston and DiNardo 1997).
Choosing “weak instruments” can lead to problems of inference in the estimation.
12 This point is made in most econometric textbooks; for example, Johnston and DiNardo (1997, page 153) state, “Under the classical assumptions OLS estimators are best linear unbiased. One of the major underpinning assumptions is the independence of regressors from the disturbance term. If this condition does not hold, OLS estimators are biased and inconsistent.” Kennedy (2003, page 180) notes, “ In a system of simultaneous equations, all the endogenous variables are random variables – a change in any disturbance term changes all the endogenous variables since they are determined simultaneously…As a consequence, the OLS estimator is biased, even asymptotically.” Maddala (1992, page 383) observes, “…the simultaneity problem results in inconsistent estimators of the parameters, when the structural equations are estimated by ordinary least squares (OLS).”
14
An instrument is “weak” if the correlation between the instruments and the endogenous
variable is small. Nelson and Startz (1990) and Bound, Jaeger and Baker (1995) were among the
first to discuss how instrumental variables estimation can perform poorly if the instruments are
weak. Nelson and Startz show that the true distribution of the instrumental variables estimator
may look nothing like the asymptotic distribution. Bound, Jaeger and Baker focus on two related
problems. First, if the instruments and the endogenous variables are weakly correlated, then even
a weak correlation between the instruments and the error in the original structural equation
(which should be zero) can lead to large inconsistencies in the IV estimates; this is known as the
“bias” issue related to weak instruments. Second, finite sample results can differ substantially
from asymptotic theory. Specifically, IV estimates are generally biased in the same direction as
OLS estimates, with the magnitude of this bias increasing as the R2 of the first-stage regression
between the instruments and the endogenous variable approaches zero; this is known as the “size”
issue related to weak instruments.
More recently, Stock and Yogo (2004) formalize the definitions and provide tests to
determine if instruments are weak. They introduce two alternative definitions of weak
instruments. First, a set of instruments is weak if the bias of the instrumental variables estimator,
relative to the bias of the OLS estimator, exceeds a certain limit b. Second, the set of instruments
is weak if the conventional α -level Wald test based on instrumental variables statistics has a size
that could exceed a certain threshold r. These two definitions correspond to the “bias” and “size”
problems mentioned earlier, and yield a set or parameters that define a “weak instruments set.” 13
13 There are two other weak instrument tests. First, Hahn and Hausman (2002) present a test similar in spirit to the Hausman (1978) specification test. Second, the Hansen-Sargan test compares the second stage residuals with the first stage instruments, testing for non-correlation among these variables; see Davidson and MacKinnon (2004). We present the Stock and Yogo test results because, in our opinion, its test statistic is easier to interpret; also, the Stock and Yogo test is consistent with the motivation of the prior research on weak instruments; for example, see Bound, Jaeger and Baker (1995) or Staiger and Stock (1997). However, we also perform the Hahn and Hausman, and the Hansen-Sargan weak instrument tests; inferences from these tests are consistent with the reported Stock and Yogo test results. Also, in addition to the instrument variables discussed above, we consider an alternate set of instrument variables; the results noted below are robust to the consideration of alternate instruments.
15
For a set of valid instruments, we need to compare the OLS estimates with the IV estimates
to determine if IV estimation is necessary. To do this, we use the Hausman (1978) specification
test alternatively known as the Wu-Hausman or Durbin-Wu-Hausman test. The test statistic is
constructed as follows:
)ˆˆ())ˆvar()ˆ(var()ˆˆ( 1IVOLSIVOLSIVOLSh ββββββ −−′−≡ − .
This statistic has a chi-square distribution with degrees of freedom equal to the number of
potentially endogenous regressors. If the difference between the OLS and IV estimates is “large,”
we conclude that OLS is not adequate. We use this same test to compare OLS to 2SLS, OLS to
3SLS, and 2SLS to 3SLS. If the instruments are valid, we can use this test to determine which
estimation method should be used.14
4. Corporate governance and performance
Table 4 summarizes our main results of the relationship between governance and
performance. While previous studies have used both stock market based and accounting measures
of performance, we primarily rely on accounting performance measures. Stock market based
performance measures are susceptible to investor anticipation. If investors anticipate the
corporate governance effect on performance, long-term stock returns will not be significantly
correlated with governance even if a significant correlation between performance and governance
indeed exists.15
In Table 4, Panels A through G, we report the results for the relationship between
operating performance (ROA) and the following governance measures respectively: GIM index,
BCF index, TCL index, Brown and Caylor index, stock ownership of the median board member,
CEO-Chair duality, and board independence. In each panel we report the OLS, 2SLS, and 3SLS
14 By construction, if the IV variance is larger than the OLS variance, the test statistic will be negative. In this case, we rely on the OLS estimates because of the smaller variance. 15 However, to aid the comparison of our results with the extant literature, in Appendix A we report results considering stock return and Tobin’s Q as performance measures.
16
estimates of the equation in (1a); we perform Hausman (1978) tests to guide our choice of which
set of estimates to consider for inference purposes. In each panel, we report three measures of
operating performance: contemporaneous return-on-assets (ROA), next year’s ROA, and next two
years’ ROA. Given that information needed to construct the various governance measures for a
particular year are released to market participants some time during the first two quarters of the
year, the impact of governance on performance will be observed on both the contemporaneous
and subsequent operating performance. Core, Guay, and Rusticus (2005) consider just the next
year’s operating performance. However, it is possible that to the extent governance impacts
performance, operating performance may be impacted for the next several years. For this reason,
we also consider the next two years’ operating performance.
Table 4, Panel A, highlights the relationship between the GIM governance index and
operating performance (ROA). Consider the results under the “Next 1 Year Performance.” The
Hausman test suggests we consider the 2SLS estimates for inference. The Stock and Yogo (2004)
test indicates that our instruments are appropriate. There is a significant negative correlation
between the GIM index and next year’s ROA. Given that lower GIM index numbers reflect
stronger shareholder rights (better governance), the above results are consistent with a positive
relation between good governance, as measured by GIM, and operating performance. Results
using the contemporaneous operating performance are similar. This relation is negative but
insignificant when we consider the operating performance of the next two years. These results are
consistent with GIM’s finding of a positive relation between good governance and performance
for the period 1990-1999, and extends their findings to the most recent period, 2000-2004.
However, it is important to note that GIM’s finding of a positive relation between good
governance and performance is based on long-term stock returns as the measure of performance,
and does not take into account the endogeneity of the relationships among corporate governance,
17
performance, capital structure, and corporate ownership structure.16 As noted above, if investors
anticipate the effect of corporate governance on performance, long-term stock returns will not be
significantly correlated with governance even if a significant correlation between performance
and governance exists. Indeed, as the results in Appendix A indicate, there is no significant or
consistent relation between GIM’s measure of governance and contemporaneous, next year’s or
the next two years’ stock returns, or Tobin’s Q.17
In Table 4, Panel B, we note the relationship between the BCF governance index and
operating performance. Again, the Hausman test suggests we consider the 2SLS estimates for
inference, and the Stock and Yogo (2004) test indicates that our instruments are appropriate.
There is a significant negative correlation between the BCF index and next year’s ROA. Similar
to the GIM index, lower BCF index numbers reflect better governance; hence, these results are
consistent with a positive relation between good governance, as measured by BCF, and operating
performance. Results using the contemporaneous and next two years’ operating performance are
similar. However, similar to GIM, BCF’s finding of a positive relation between good governance
and performance is based on long-term stock returns. The results in Appendix A-2, Panel B,
indicate there is no significant or consistent relation between BCF’s measure of governance and
contemporaneous, next year’s or the next two years’ stock returns, or Tobin’s Q.18 19
16 Consistent with the findings reported here, Core, Guay and Rusticus (2005) also find a positive relation between the GIM index and next year’s ROA. However, these authors do not take into account the endogeneity of the relationships among corporate governance, performance, capital structure, and corporate ownership structure. 17 These findings are consistent with those of Core, Holthausen and Larcker (1999) who conclude that their governance measures “more consistently predict future accounting operating performance than future stock market performance.” 18 For robustness, we also estimate the performance-governance relation for each of the seven governance measures using the fixed effects estimator. Some of these results are presented in Appendix C. The results are consistent with the results reported here. One positive feature of panel data and the fixed effects estimator is that if there are firm-specific time-invariant omitted variables in the estimated equation, the coefficients are estimated consistently. However, if the omitted variables are not stationary over time, the fixed effects estimated coefficients are inconsistent; see Wooldridge (2002). When the omitted variables are non-stationary, the instrumental variable technique can yield consistent estimates if the instruments are valid. As noted above, we use the Stock and Yogo (2004) weak instruments test to ascertain the validity of the instruments used in Table 4 and Appendix A.
18
The relation between TCL’s measure of good governance and operating performance is
detailed in Table 4, Panel C. While this relation is negative and statistically significant for the
contemporaneous year, it is not significant for next year’s and the next two years’ operating
performance.
Table 4, Panel D notes a negative but insignificant relation between Brown and Caylor’s
measure of good governance and operating performance. Since this index is available only for
2002, and we have operating data only through 2003, we do not report the relation between this
index and next two years’ operating performance.
In Table 4, Panel E, we note the relation between the dollar value of the median director’s
stock ownership and operating performance. We find a significant and positive relation between
the dollar value of the median director’s stock ownership and contemporaneous and next year’s
operating performance. This relation is positive but insignificant when we consider the operating
performance of the next two years.
The relation between CEO-Chair duality and operating performance is documented in
Table 4, Panel F. CEO-Chair duality is negatively and significantly related to contemporaneous,
next year’s and next two years’ operating performance.20 This result, along with the results for
GIM and BCF, suggests that greater managerial control leads to worse future operating
performance.
The final panel in Table 4, Panel G, details the relation between board independence and
performance. Board independence is negatively and significantly related to contemporaneous,
next year’s and next two years’ operating performance. This result is surprising, especially
considering the recent emphasis that has been placed on board independence by the NYSE and
19 In Appendix B we find that the relation between the GIM governance index and abnormal stock returns is not robust to either the construction of the abnormal stock return, or the sample period. 20 Note that the governance variable CEO-Chair duality is 1 if the CEO is Chair and 0 otherwise. Hence, a negative relation between CEO-Chair duality and performance is equivalent to a positive relation between CEO-Chair separation and performance.
19
NASDAQ regulations; however, it is consistent with prior literature (for example, Hermalin and
Weisbach (2003)).
In summary, these results demonstrate that certain complex measures of corporate
governance – GIM and BCF – and certain simple measures – director ownership and CEO-chair
separation – are positively associated with current and future operating performance. Other
measures seem to be less reliable indicators of performance. It is also important to note that the
estimation method used does matter in certain cases. For example, consider the performance-
governance relationships estimated in Appendix A-2, Panel A. The OLS estimate indicates a
significantly negative relation between the GIM index and next year’s Tobin’s Q, and the GIM
index and next two years’ Tobin’s Q. However, the 2SLS estimate is positive but statistically
insignificant for the one year Tobin’s Q, and again positive but statistically insignificant for the
two years’ Tobin’s Q. The Hausman (1978) specification test suggests that the 2SLS are more
appropriate for inferences. Similarly, as detailed in Appendix A-2, Panel B, the OLS and 2SLS
estimates for the relation between the BCF index and future Tobin’s Q are statistically and
economically different. Again, the Hausman (1978) specification test suggests that the 2SLS are
more appropriate for inferences. For this reason, we believe it is important to rely on inferences
after controlling for the endogeneity between governance and performance.
4.1 Economic significance of impact of governance on performance
Table 5 notes the elasticities for G-Index, E-Index, and median director ownership with
respect to operating performance. We find that a 1% improvement in governance as measured
by the G-Index is associated with a 0.854% change in operating performance in the current
period, a 0.763% change in next year’s operating performance, and a 0.287% change in the next
two years’ operating performance. The economic impacts for the E-Index and for director
ownership are slightly lower for contemporaneous and next year’s performance, and are about the
same for the next two years’ operating performance.
20
Table 2 indicates that the G-index and median director ownership are uncorrelated. This
suggests that a composite measure of governance that combines the information contained in the
G-index and median director ownership has the potential of being a more powerful predictor of
operating performance, than either measure by itself. To ensure robustness, we consider the non-
parametric (rank) information of these two governance measures. For each year, all firms are
ranked from best to worst governed with respect to each of the two governance variables. We
sum these two ranks to get a composite index (Composite G-Ownership index) for each year for
each sample firm.21 We find that a 1% improvement in governance as measured by the
composite index is associated with a 1.874% change in operating performance in the current
period, a 1.567% change in next year’s operating performance, and a 1.520% change in the next
two years’ operating performance.
4.2 Robustness checks
4.2.1 k-class estimators
In the case of simultaneously determined variables, 2SLS can address this problem by
using instrumental variables to obtain a predicted value of the endogenous regressor (Y ), then
using this predicted value in the structural equation (Y ). There are estimators other than the
2SLS estimator, such as the k-class estimator that can address the endogeneity problem. The k-
class of estimators are instrumental variables estimators where the predicted values used in the
second stage structural equation take a special form; see Kennedy (2003) and Guggenberger
(2005):
YkYkYiˆ)1(* +−= .
21 Year 2002 has 1,301 sample firms, which means the highest possible Composite G-Ownership index is 2,602. The lowest possible Composite G-Ownership index is 2. The actual composite governance index varies from a low of 40 to a high of 2,594. We consider the natural logarithm of the Composite G-Ownership index because of its better distributional properties.
21
For consistent estimates the probability limit of k must equal 1.22
The results in Table 6 with k=0 and with k=1 are identical to the results in Table 4, for
OLS and 2SLS, respectively. Recall that in Table 4, we showed that, based on the Hausman
specification test, 2SLS was preferred to OLS for all governance measures except for the Brown
and Caylor GovScore measure. This means that there is some bias or inconsistency in the OLS
estimation that is causing the OLS and 2SLS estimations to be different. By scanning down each
column in Table 6, it is apparent that the k-class estimators produce a very slow, non-linear
progression from the OLS results to the 2SLS results. Using the Hausman (1978) specification
test, we compare each sequential estimation. For every measure of governance, the Hausman
specification test indicates that the k=1.0 results are different from the k=0.9 result. This suggests
that only using k=1.0 (2SLS) produces estimates that are completely free of simultaneity bias. As
long as there is any part of the actual endogenous regressor used in the second stage structural
regression, which is the case for k less than 1.0, the simultaneity bias causes the regression results
to be inconsistent.
The results for next year’s operating performance, next two years’ operating
performance, stock return and Tobin’s Q (for contemporaneous and for the two additional time
periods) as the performance measures are consistent with the results reported in Table 4 and
Appendix A..
4.2.2 Estimation of standard errors
Standard econometric textbooks note that OLS standard errors are biased when the
residuals are correlated. In panel data, such as the one we consider here, residuals for a particular
firm may be correlated across years, or for a particular year the residuals may be correlated across
the sample firms. Two recent papers, Petersen (2005) and Wooldridge (2004) provide a careful 22 Certain maximum likelihood estimators, such as the limited information maximum likelihood (LIML) and the full information maximum likelihood can also be included in the k-class. The results using these estimators are qualitatively similar to the 2SLS results.
22
analysis of the impact of correlated residuals on the bias in standard errors in panel data. We
consider the suggestions of these authors in considering the robustness of our estimated
performance-governance relationship to alternative standard error estimation methods.
Petersen (2005) notes, “In the presence of a fixed firm effect both OLS and Fama-
MacBeth standard error estimates are biased down significantly. Clustered standard errors which
account for clustering by firm produce estimates which are unbiased.” Table 7 summarizes the
performance-governance relationship using OLS and clustered (Rogers) standard errors; these
results are qualitatively similar to those in Table 4.
While Petersen’s work is quite helpful in understanding the standard error estimates for a
single equation model, it is unclear how his conclusions might apply to a system of simultaneous
equations. Note that both the economics and econometrics of the performance-governance
relationship as analyzed above strongly suggests that this relationship needs to be estimated as a
system of simultaneous equations as in (1a), (1b), (1c), and (1d). Appendix C Table Panels A and
B summarize the performance-governance relationship using 2SLS and heteroscedasticity
adjusted White and clustered (Rogers) standard errors, respectively. Again our inferences from
these tables regarding the performance-relationship are similar to those from Table 4.
Appendix C Table Panels C and D summarize the performance-governance relationship
using OLS with fixed effects estimator with firm and year fixed effects, and OLS with fixed
effects estimator with clustered (Rogers) standard errors, respectively. Once again these results
are qualitatively similar to those in Table 4.
4.2.3. Alternative measures of leverage
It is possible that the results reported above regarding the performance-governance
relation are sensitive to the construction of the leverage variable. In the capital structure
literature, there does not appear to be any agreed upon measure of leverage. For our primary
analyses, we use the measure that appears frequently in corporate finance studies: All long term
23
debt divided by assets. To test the sensitivity of our results to this definition of leverage, we run
the analyses in Table 4 using five alternative definitions of leverage as detailed in Appendix D.
Overall, this evidence suggests that our results regarding the relation between performance and
governance are robust to alternative definitions of leverage.
5. Corporate governance and management turnover
The preceding analysis focused on the relation between governance and performance
generally. However, governance scholars and commentators suggest that governance is especially
critical in imposing discipline and providing fresh leadership when the corporation is performing
particularly poorly. It is possible that governance matters most in only certain firm events, such
as the decision to change senior management. For this reason, we study the relationship between
governance, performance, and CEO turnover.
Using Compustat’s Execucomp database, we identify 1,923 CEO changes from 1993 to
2003. Table 8 documents the number of disciplinary and non-disciplinary CEO turnovers during
this period. Our criteria for classifying a CEO turnover as disciplinary or non-disciplinary is
similar to that of Weisbach (1988), Gilson (1989), Huson, Parrino, and Starks (2001), and Farrell
and Whidbee (2003). CEO turnover is classified as “non-disciplinary” if the CEO died, if the
CEO was older than 63, if the change was the result of an announced transition plan, or if the
CEO stayed on as chairman of the board for more than a year. CEO turnover is classified as
“disciplinary” if the CEO resigned to pursue other interests, if the CEO was terminated, or if no
specific reason is given.
We consider a multinomial logit regression.23 The dependent variable is equal to 0 if no
turnover occurred in a firm-year, 1 if the turnover was disciplinary, and 2 if the turnover was non-
23 We also considered a fixed effects logit estimator model. However, there are concerns regarding the bias of such an estimator. Greene (2004) documents that when the time periods in panel data are five or less (as is the case in this study), nonlinear estimation may produce coefficients that can be biased in the range of 32% to 68%.
24
disciplinary. We consider the past two years’ stock return as the performance measure. We
estimate the following baseline equation:
Type of CEO Turnover = g1 (Past 2 years’ stock return, Z1, ε1). (2a)
The Z1 vector of controls includes CEO ownership, CEO age, CEO tenure, firm size, industry
return and year dummy variables. These control variables are motivated by a substantial extant
literature on performance and CEO turnover; for example, see Huson, Parrino, and Starks (2001),
Farrell and Whidbee (2003), and Engel, Hayes and Wang (2003). To determine the role that
governance plays in CEO turnover, we create an interactive variable that is equal to (Past 2 years’
stock return x Governance). The reason behind this is that if the firm is performing adequately,
good governance should not lead to CEO turnover; only when performance is poor do we expect
better governed firms to be more likely to replace the CEO. To measure this effect, we estimate
the following modified version of equation (2a):
Type of CEO Turnover = g2 (Past 2 years’ stock return, Governance, (Past 2 years’ stock return x Governance), Z1, ε2). (2b) Table 9 highlights the relation between different measures of governance and disciplinary
CEO turnover. Table 9, Panel A, details the multinomial logit regression results for the
determinants of disciplinary CEO turnover. Consider first the baseline results without governance
variables in the regression. The baseline results indicate that a firm’s stock market returns during
the previous two years, CEO stock ownership, and CEO tenure are significantly negatively
related to disciplinary CEO turnover; these findings are consistent with the prior literature noted
above. Interestingly, we find that the prior two years’ returns of similar firms in the industry is
significantly positively related to disciplinary CEO turnover.
Does good governance have an impact on disciplinary CEO turnover directly, or is
governance related to disciplinary turnover only in poorly performing companies? The results in
Table 9, Panel A, shed light on this question. Note that when the governance variables are
included, the prior return variable is not significant in five of the seven cases, suggesting that bad
25
performance alone is not enough to lead to a change in senior management. Also note that the
governance variable by itself is statistically not significant in most cases.24 This suggests that
good governance per se is not related to disciplinary turnover. The coefficient of the interactive
term (Past 2 years’ stock return x Governance) sheds light on the question whether governance is
related to disciplinary turnover only for poorly performing firms. The interactive term suggests
that good governance as measured by the dollar value of the median director’s stock ownership
and the percentage of directors who are independent, increases the probability of disciplinary
turnover for poorly performing firms.25 26 Both the GIM and BCF measures of good governance
are negatively related to the probability of disciplinary turnover for poorly performing firms. This
suggests that better governed firms as measured by the GIM and BCF indices are less likely to
experience disciplinary management turnover in spite of their poor performance. Finally, when
the CEO is also the Chairman, he is more likely to experience disciplinary turnover given poor
firm performance.
Table 9, Panel B, details the multinomial logit regression results for the determinants of
non-disciplinary CEO turnover. We do not expect any relation between good governance and
non-disciplinary CEO turnover both unconditionally, and conditional on poor prior performance;
the results in Panel B are consistent with this.
5.1 Robustness checks
24 The exceptions are: the TCL governance index which is positively related to disciplinary CEO turnover. Also, when the CEO is also the Chairman, he is less likely to experience disciplinary turnover. 25 The finding of the probability of disciplinary CEO turnover (given poor prior firm performance) increasing with greater board independence is consistent with the extant literature, for example, see Fich and Shivdasani (2005), and Weisbach (1988). 26 The economic importance of the dollar ownership of the median director is greater than board independence. We calculate the predicted probability of disciplinary and non-disciplinary turnover, using the coefficient estimates from Table 6. When all parameters are measured at their mean values, the probability of disciplinary turnover is 2.28% with the dollar ownership of the median director as the governance variable; this increases to 12.55% when the (Past Return x Director $ Ownership) interaction term decreases by one standard deviation. The corresponding probabilities are 2.90% and 7.96% for board independence.
26
Due to data limitations the sample periods and sample sizes for the various governance
measures are different in Table 9, Panels A and B. It is possible that the significant relationship
between a governance measure and disciplinary turnover in a poorly performing firm may be
sample-period specific, or is being influenced by the different sample sizes. To address this
concern, we consider disciplinary turnovers only for the period 2000 through 2002 for all
governance measures. The results are consistent with the results reported above.
It is possible that the board considers industry adjusted performance instead of firm
performance in deciding whether to discipline the CEO. Results considering industry adjusted
performance are similar to that reported above and are detailed in Appendix E.
6. Summary and conclusions
Our primary contribution to the literature is the consistent estimation of the relationship
between corporate governance and performance, by taking into account the inter-relationships
among corporate governance, management turnover, corporate performance, corporate capital
structure, and corporate ownership structure. We make four additional contributions to the
literature:
First, instead of considering just a single measure of governance (as prior studies in the
literature have done), we consider seven different governance measures. We find that better
governance as measured by the GIM and BCF indices, stock ownership of board members, and
CEO-Chair separation is significantly positively correlated with better contemporaneous and
subsequent operating performance. Additionally, better governance as measured by Brown and
Caylor ( that considers 52 separate charter provisions and board characteristics), and The
Corporate Library (that considers over a hundred variables concerning board characteristics,
management compensation policy, and antitakeover measures) is not significantly correlated with
better contemporaneous or subsequent operating performance. Also, interestingly, board
independence is negatively correlated with contemporaneous and subsequent operating
27
performance. This is especially relevant in light of the prominence that board independence has
received in the recent NYSE and NASDAQ corporate governance listing requirements. Finally,
contrary to the claims in the literature, none of the governance measures are correlated with future
stock market performance. We consider a battery of robustness checks including alternative
estimates of the standard errors of our model’s estimated coefficients. These robustness checks
provide consistent results and increase our confidence in the performance-governance relation as
noted above.
Second, in several instances our inferences regarding the performance-governance
relation do depend on whether or not one takes into account the endogenous nature of the relation
between governance and performance. For example, the OLS estimate indicates a significantly
negative relation between the GIM index and next year’s Tobin’s Q, and the GIM index and next
two years’ Tobin’s Q. However, the 2SLS estimate is positive but statistically insignificant for the
one year Tobin’s Q, and again positive and statistically insignificant for the two years’ Tobin’s Q.
The Hausman (1978) specification test suggests that the 2SLS estimates are more appropriate for
inferences. Similarly, the OLS and 2SLS estimates for the relation between the BCF index and
future Tobin’s Q are statistically and economically different. Again, the Hausman (1978)
specification test suggests that the 2SLS estimates are more appropriate for inferences. In both
cases the 2SLS results suggest no relationship between the GIM index and future Tobin’s Q, and
the BCF index and future Tobin’s Q. For this reason, we believe it is important to rely on
inferences after controlling for the endogeneity between governance and performance.
Third, given poor firm performance, the probability of disciplinary management turnover
is positively correlated with stock ownership of board members, and with board independence.
However, better governed firms as measured by the GIM and BCF indices are less likely to
experience disciplinary management turnover in spite of their poor performance.
Fourth, this study proposes a governance measure, namely, dollar ownership of the board
members, that is simple, intuitive, less prone to measurement error, and not subject to the
28
problem of weighting a multitude of governance provisions in constructing a governance index.
Consideration of this governance measure by future accounting and finance researchers would
enhance the comparability of research findings.
Can a single board characteristic be as effective a measure of corporate governance as
indices that consider multiple measures of corporate charter provisions, management
compensation structure, and board characteristics? Corporate boards have the power to make, or
at least, ratify all important decisions including decisions about investment policy, management
compensation policy, and board governance itself. It is plausible that board members with
appropriate stock ownership will have the incentive to provide effective monitoring and oversight
of important corporate decisions noted above; hence board ownership can be a good proxy for
overall good governance. Furthermore, the measurement error in measuring board ownership can
be less than the total measurement error in measuring a multitude of board processes,
compensation structure, and charter provisions. Finally, while board characteristics, corporate
charter provisions, and management compensation features do characterize a company’s
governance, construction of a governance index requires that the above variables be weighted.
The weights a particular index assigns to individual board characteristics, etc. is important. If the
weights are not consistent with the weights used by informed market participants in assessing the
relation between governance and firm performance, then incorrect inferences would be made
regarding the relation between governance and firm performance.
The above findings have important implications for researchers, senior policy makers,
and corporate boards: Efforts to improve corporate governance should focus on stock ownership
of board members – since it is positively related to both future operating performance, and to the
probability of disciplinary management turnover in poorly performing firms.
Proponents of board independence should note with caution the negative relation between
board independence and future operating performance. Hence, if the purpose of board
independence is to improve performance, then such efforts might be misguided. However, if the
29
purpose of board independence is to discipline management of poorly performing firms, then
board independence has merit. Finally, even though the GIM and BCF good governance indices
are positively related to future performance, policy makers and corporate boards should be
cautious in their emphasis on the components of these indices since this might exacerbate the
problem of entrenched management, especially in those situations where management should be
disciplined, that is, in poorly performing firms.
References Altman, Edward I., 1968, Financial Ratios, discriminates analysis, and the prediction of corporate
bankruptcy, Journal of Finance 23, 589-609. Anderson, Ronald C., Sattar A. Mansi and David M. Reeb, 2004, Board characteristics, accounting report
integrity, and the cost of debt, Journal of Accounting and Economics 37, 315-342. Ashbaugh-Skaife, Hollis, Daniel W. Collins and Ryan LaFond, 2006, The effects of corporate governance
on firms’ credit ratings, Journal of Accounting and Economics, forthcoming. Bergstresser, Daniel and Thomas Philippon, CEO incentives and earnings management, Journal of
Financial Economics 80, 511-530. Baker, M. and J. Wurgler, 2002, Market timing and capital structure, Journal of Finance 57, 1-32. Barber, Brad and John Lyon, 1996, Detecting abnormal operating performance: The empirical power and
specification of test statistics, Journal of Financial Economics 41, 359-400. Bebchuk, Lucian, Alma Cohen, and Allen Ferrell, 2004, What matters in corporate governance?, Working
paper, Harvard Law School Bebchuk, Lucian and Alma Cohen, 2005, The costs of entrenched boards, Journal of Financial Economics
78, 409-433. Berle, A.A. and G. Means, 1932, The Modern Corporation and Private Property, Macmillan, New York. Bhagat, Sanjai and Bernard Black, 2002, The non-correlation between board independence and long term
firm performance, Journal of Corporation Law 27, 231-274. Bhagat, Sanjai, Dennis Carey and Charles Elson, 1999, Director ownership, corporate performance, and
management turnover, The Business Lawyer 54. Black, Bernard, 1990, Shareholder passivity reexamined, Michigan Law Review 89, 2550. Bound, John, David A. Jaeger, and Regina M. Baker, 1995, Problems with instrumental variables
estimation when the correlation between the instruments and the endogenous explanatory variable is weak, Journal of the American Statistical Association 90, 443-450.
Bowen, Robert M., Shivaram Rajgopal and Mohan Venkatachalam, 2005, Accounting discretion, corporate
governance, and firm performance, University of Washington working paper.
30
Brickley, James A., Jeffrey L. Coles, and Gregg Jarrell, 1997, Leadership structure: Separating the CEO and chairman of the board, Journal of Corporate Finance, 3, 189-220. Brown, Lawrence D. and Marcus L. Caylor, 2004, Corporate governance and firm performance, Georgia
State University working paper. Bushman, Robert, Qi Chen, Ellen Engel and Abbie Smith, 2004, Financial accounting information,
organizational complexity and corporate governance systems, Journal of Accounting and Economics 37, 1670201.
Carhart, Mark M., 1997, On persistence in mutual fund performance, Journal of Finance 52(1), 57-82. Core, John E., Wayne R. Guay, Tjomme O. Rusticus, Does weak governance cause weak stock returns?
An examination of firm operating performance and investors’ expectations, Journal of Finance, Forthcoming, 2005.
Core, John E., Robert W. Holthausen, and David F. Larcker, 1999, Corporate governance, chief executive
officer compensation, and firm performance, Journal of Financial Economics 51, 371-406. Cragg, John G. and Stephen G. Donald, 1993, "Testing Identifiability and Specification in Instrumental
Variable Models," Econometric Theory 9, 222-240. Cremers, Martijn K.J., and Vinay B. Nair, Governance mechanisms and equity prices, Journal of Finance
60, 2859-2894. Davidson, Russell, and James G. MacKinnon, 2004, Estimation and Inference in Econometrics, Oxford
University Press, New York. Defond, Mark L., Rebecca N. Hann and Xuesong Hu, 2005, Does the market value financial expertise on
audit committees of boards of directors? Journal of Accounting Research 43, 153-193. Demsetz, Harold, 1983, The structure of ownership and the theory of the firm, Journal of Law and
Economics 26, 375-390. Demsetz, Harold and Kenneth Lehn, 1985, The structure of corporate ownership: Causes and
consequences, Journal of Political Economy 33, 3-53. Engel, Ellen, Rachel M. Hayes, and Xue Wang, 2003, CEO turnover and properties of accounting
information, Journal of Accounting and Economics 36, 197-226. Erickson, Merle, Michelle Hanlon and Edward L. Maydew, 2006, Is there a link between executive equity
incentives and accounting fraud? Journal of Accounting Research 44, 113-143. Fama, Eugene F., 1980, Agency problems and the theory of the firm, Journal of Political Economy 88, 288-
307. Farell, K.A. and Whidbee, D.A., 2003, The impact of firm performance expectations on CEO turnover and
replacement decisions, Journal of Accounting and Economics 36, 165-196. Fich, Eliezer M. and Anil Shivdasani, Are busy boards effective monitors?, Journal of Finance,
Forthcoming, 2005. Gibbons, Robert and Murphy, Kevin J, 1992. Optimal incentive contracts in the presence of career
concerns: Theory and evidence," Journal of Political Economy 100(3), 468-505.
31
Gillan, Stuart L., Jay C. Hartzell, Laura T. Starks, 2003, Industries, investment opportunities and corporate governance structures, Working paper.
Gillan, Stuart L., Recent developments in corporate governance: An overview, Journal of Corporate
Finance 12, 381-402. Gompers, Paul A., Joy L. Ishii, and Andrew Metrick, 2003, Corporate governance and equity prices,
Quarterly Journal of Economics 118(1), 107-155. Gilson, Stuart C., 1989, Management turnover and financial distress, Journal of Financial Economics 25,
241-262. Graham, J.R., 1996, Proxies for the corporate marginal tax rate, Journal of Financial Economics 42, 187-
221.
Graham, J.R., M.H. Lang and D. A. Shackelford, 2004, Employee stock options, corporate taxes, and debt policy, Journal of Finance 59, 1585-1618.
Greene, William H., 2004, The Behavior of the Fixed Effects Estimator in Nonlinear Models, The
Econometrics Journal 7. Grossman, Sanford and Oliver D. Hart, 1983, An analysis of the principal-agent problem, Econometrica ,
51, no 1, 7-45. Grossman, Sanford and Oliver D. Hart, 1986, The costs and benefits of ownership: A theory of vertical and
lateral integration, Journal of Political Economy 44, 691-719. Graham, John R, 1996, Debt and the marginal tax rate, Journal of Financial Economics 41, 41-73. Guggenberger, Patrick, 2005, Finite-sample evidence suggesting a heavy tail problem of the generalized
empirical likelihood estimator, UCLA Department of Economics working paper.` Hahn, Jinyong and Jerry A. Hausman, 2002, A new specification test for the validity of instrumental
variables, Econometrica 70, 163-189. Hallock, Kevin F., 1997, Reciprocally interlocking boards of directors and executive compensation, Journal
of Financial and Quantitative Analysis 32, 331-344. Harris, Milton, and Artur Raviv, 1988, Corporate control contests and capital structure, Journal of Financial
Economics 20, 55-86. Hart, Oliver D. and John Moore, 1990, Property rights and the theory of the firm, Journal of Political
Economy 48, 1119-1158. Hausman, Jerry A., 1978, Specification tests in econometrics, Econometrica 46, 1251-1271. Hermalin, Benjamin E. and Michael S. Weisbach,, 1998, Endogenously chosen boards of directors and
their monitoring of the CEO, American Economic Review 88, 96-118. Hermalin, Benjamin and Michael Weisbach, 2003, Boards of directors as an endogenously determined
institution: A survey of the economic evidence. Economic Policy Review, 9: 7-26. Hermes Pensions Management, 2005, Corporate governance and performance, Lloyds Chambers, London,
U.K.
32
Himmelberg, Charles P., R. Glenn Hubbard, and Darius Palia, 1999, Understanding the determinants of managerial ownership and the link between ownership and performance, Journal of Financial Economics 53, 353-384.
Huson, Mark R. Robert Parrino and Laura T. Starks, 2001, Internal monitoring mechanisms and CEO
turnover: A long-term perspective, Journal of Finance 54(6), 2265-2297. Jensen, Michael, 1986, Agency costs of free cash flow, corporate finance, and takeovers, American
Economic Review 76, 323-329. Jensen, Michael, and William Meckling, 1976, Theory of the firm: Managerial behavior, agency costs, and
ownership structure, Journal of Financial Economics 3, 305-360. Jensen, Michael, and Jerold B. Warner, 1988, The distribution of power among corporate managers,
shareholders and directors, Journal of Financial Economics 20, 3-24. Johnston, Jack and John DiNardo, 1997, Econometric Methods, Fourth edition, The McGraw-Hill
Companies. Kennedy, Peter, 2003, A Guide to Econometrics, Fifth Edition, MIT Press. Khanna, N. and S. Tice, 2005, Pricing, exit, and location decisions of firms: Evidence on the role of debt
and operating efficiency, Journal of Financial Economics 75, 397-428. Linck, James S., Jeffry M. Netter and Tina Yang, The determinants of board structure, University of
Georgia working paper, 2005. MacKie-Mason, Jeffrey K., 1990, Do taxes affect corporate financing decisions? Journal of Finance 45,
1471-1493. Maddala, G.S., 1992, Introduction to Econometrics, Second Edition, MacMillan. Milanovic, Branko, Do more unequal countries redistribute more? Does the median Voter hypothesis
hold?, World Bank policy research working paper series, Carnegie Endowment for International Peace, 2004
Morck, Randall, Andrei Shleifer, and Robert W. Vishny, 1988, Management ownership and market
valuation, Journal of Financial Economics 20, 293-315. Myerson, Roger, 1987, Incentive compatibility and the bargaining problem, Econometrica 47, 61-73. Nelson, Charles R. and Richard Startz, 1990, Some further results on the exact small sample properties of
the instrumental variables estimator, Econometrica 58, 967-976. Novaes, Walter, and Luigi Zingales, 1999, Capital structure choice under a takeover threat, University of
Chicago working paper. Palia, Darius, 2001, The endogeneity of managerial compensation in firm valuation: A solution, Review of
Financial Studies 14, 735-764. Petersen, Mitchell A., 2005, Estimating standard errors in finance panel data sets: Comparing approaches,
Nortwestern University working paper. Roe, Mark J., 1994, Strong managers, weak owners: The political roots of American corporate finance,
Princeton University Press, Princeton, NJ.
33
Rothenberg, Thomas J., 1984, "Approximating the Distributions of Econometric Estimators and Test Statistics," Chapter 15 in Handbook of Econometrics, Volume II, edited by Zvi Griliches and Michael D. Intriligator, Amsterdam: North Holland, 881-935.
Shleifer, Andrei and Kevin M. Murphy, Persuasion in politics, American economic association papers and
proceedings, Vol. 94, No. 2, May 2004 Smith, Clifford W. and Ross L. Watts, 1992, The investment opportunity set and corporate financing,
dividend and compensation policies, Journal of Financial Economics 32, 263-292. Staiger, Douglas and James H. Stock, 1997, “Instrumental Variables Regression with Weak Instruments,”
Econometrica 65(3), 557-586. Stock, James H., and Motohiro Yogo, 2004, “Testing for weak instruments in linear IV regression, in
D.W.K. Andrews and J.H. Stock, eds., Identification and Inference for Econometric Models: Essays in Honor of Thomas J. Rothenberg. Cambridge: Cambridge University Press.
Stulz, Rene M, 1988, Managerial control of voting rights: Financing policies and the market for corporate
control, Journal of Financial Economics 20, 25-54. Westphal, James D. and Poonam Khanna, 2003, Keeping Directors in Line: Social Distancing as a Control
Mechanism in the Corporate Elite, Administrative Science Quarterly 48, 361-398. Weisbach, Michael S., 1988, Outside directors and CEO turnover, Journal of Financial Economics 20, 432-
460. Wooldridge, J.M., 2002, Econometric Analysis of Cross Section and Panel Data, MIT Press, Cambridge,
Massachusetts. Wooldridge, J.M., 2004, Cluster sample methods in applied econometrics, Michigan State University
working paper. Yermack, David, 1996, Higher market valuation for firms with a small board of direcxtors, Journal of
Financial Economics 40, 185-211. Yermack, David, 2006, Flights of fancy: Corporate jets, CEO perquisites, and inferior shareholder returns,
Journal of Financial Economics 80, 211-242.
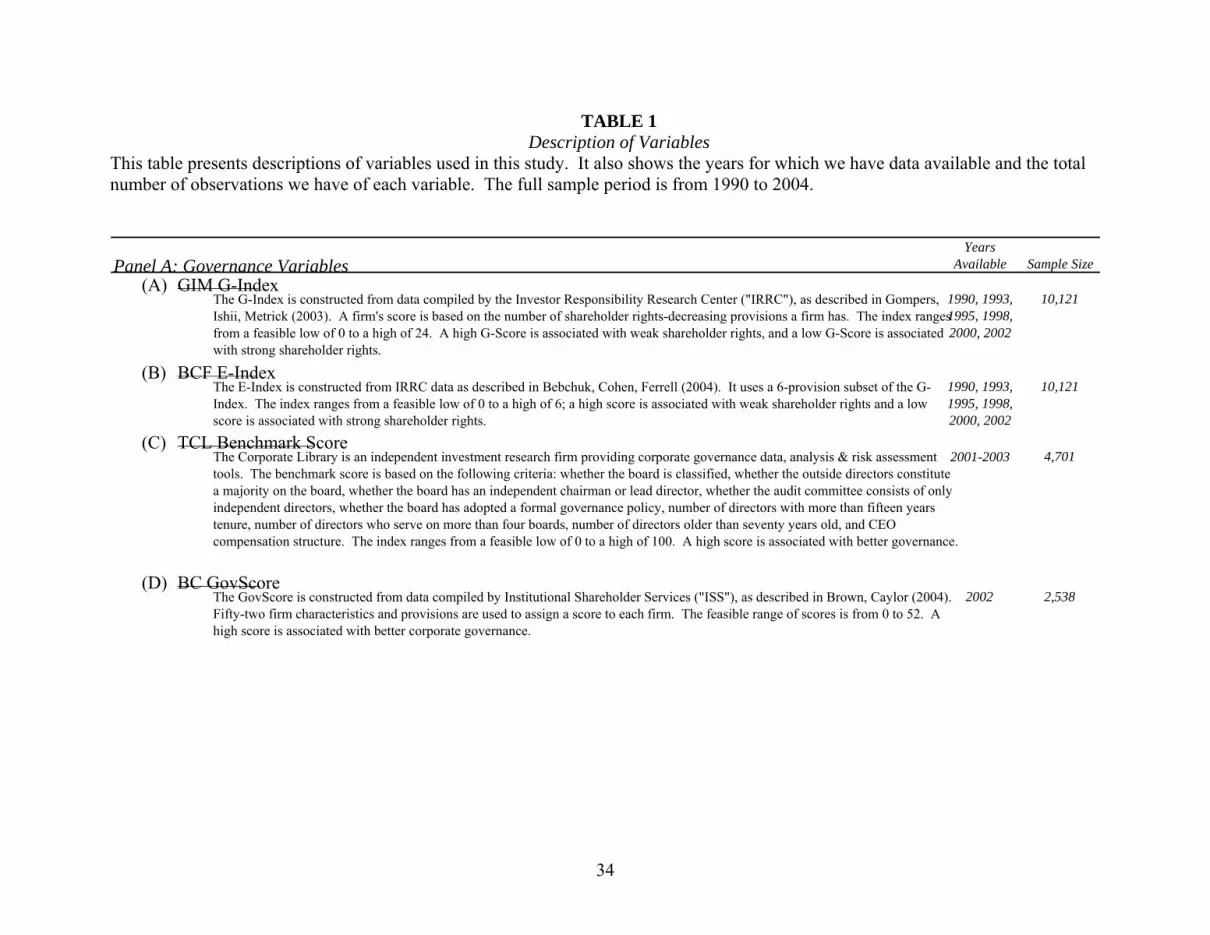
34
TABLE 1 Description of Variables
This table presents descriptions of variables used in this study. It also shows the years for which we have data available and the total number of observations we have of each variable. The full sample period is from 1990 to 2004.
Panel A: Governance VariablesYears
Available Sample Size
(A) GIM G-Index The G-Index is constructed from data compiled by the Investor Responsibility Research Center ("IRRC"), as described in Gompers,Ishii, Metrick (2003). A firm's score is based on the number of shareholder rights-decreasing provisions a firm has. The index ranges from a feasible low of 0 to a high of 24. A high G-Score is associated with weak shareholder rights, and a low G-Score is associated with strong shareholder rights.
1990, 1993, 1995, 1998, 2000, 2002
10,121
(B) BCF E-Index The E-Index is constructed from IRRC data as described in Bebchuk, Cohen, Ferrell (2004). It uses a 6-provision subset of the G-Index. The index ranges from a feasible low of 0 to a high of 6; a high score is associated with weak shareholder rights and a lowscore is associated with strong shareholder rights.
1990, 1993, 1995, 1998, 2000, 2002
10,121
(C) TCL Benchmark ScoreThe Corporate Library is an independent investment research firm providing corporate governance data, analysis & risk assessmenttools. The benchmark score is based on the following criteria: whether the board is classified, whether the outside directors constitutea majority on the board, whether the board has an independent chairman or lead director, whether the audit committee consists of onlyindependent directors, whether the board has adopted a formal governance policy, number of directors with more than fifteen yearstenure, number of directors who serve on more than four boards, number of directors older than seventy years old, and CEOcompensation structure. The index ranges from a feasible low of 0 to a high of 100. A high score is associated with better governance.
2001-2003 4,701
(D) BC GovScoreThe GovScore is constructed from data compiled by Institutional Shareholder Services ("ISS"), as described in Brown, Caylor (2004). Fifty-two firm characteristics and provisions are used to assign a score to each firm. The feasible range of scores is from 0 to 52. A high score is associated with better corporate governance.
2002 2,538
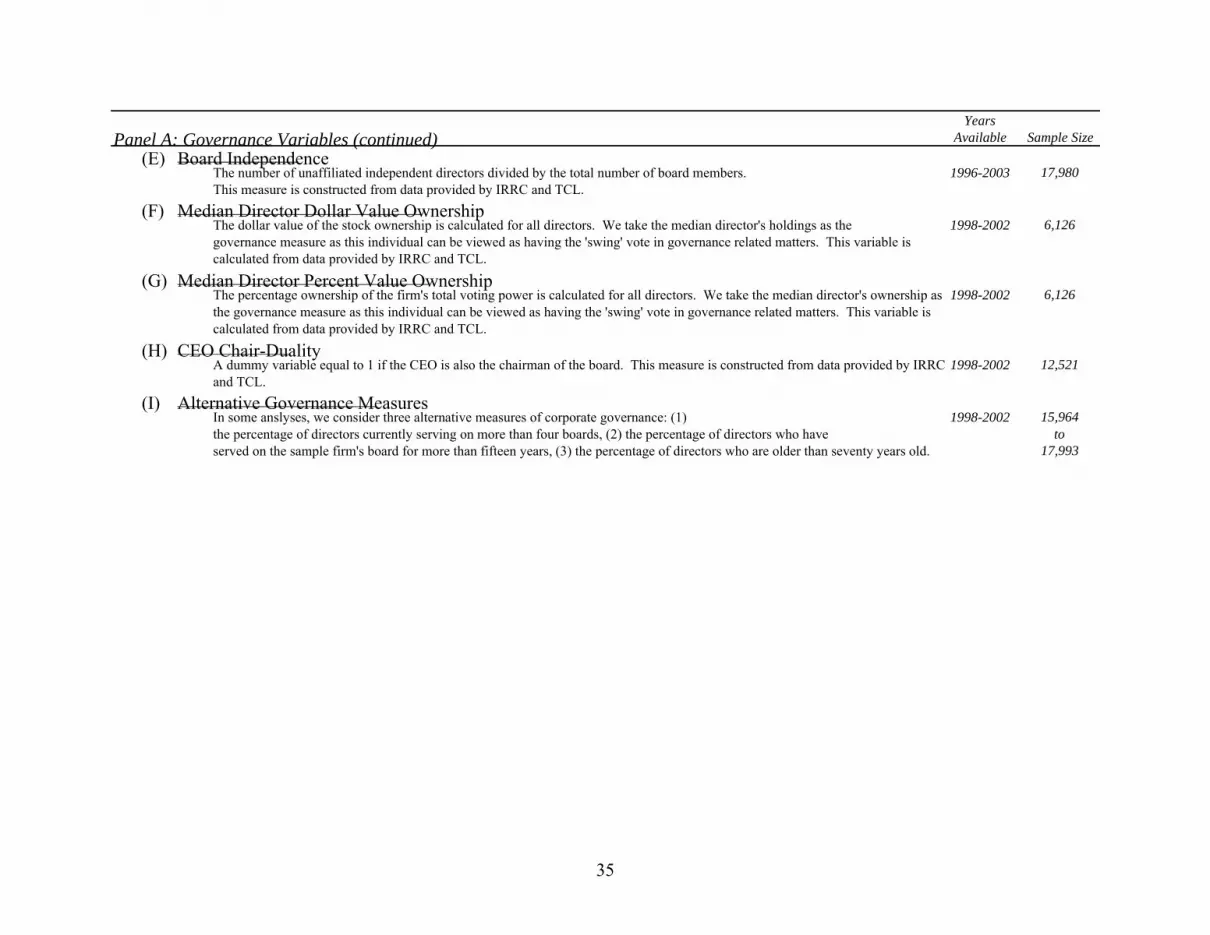
35
Panel A: Governance Variables (continued)Years
Available Sample Size
(E) Board IndependenceThe number of unaffiliated independent directors divided by the total number of board members.This measure is constructed from data provided by IRRC and TCL.
1996-2003 17,980
(F) Median Director Dollar Value OwnershipThe dollar value of the stock ownership is calculated for all directors. We take the median director's holdings as thegovernance measure as this individual can be viewed as having the 'swing' vote in governance related matters. This variable is calculated from data provided by IRRC and TCL.
1998-2002 6,126
(G) Median Director Percent Value OwnershipThe percentage ownership of the firm's total voting power is calculated for all directors. We take the median director's ownership as the governance measure as this individual can be viewed as having the 'swing' vote in governance related matters. This variable iscalculated from data provided by IRRC and TCL.
1998-2002 6,126
(H) CEO Chair-DualityA dummy variable equal to 1 if the CEO is also the chairman of the board. This measure is constructed from data provided by IRRCand TCL.
1998-2002 12,521
(I) Alternative Governance MeasuresIn some anslyses, we consider three alternative measures of corporate governance: (1) the percentage of directors currently serving on more than four boards, (2) the percentage of directors who haveserved on the sample firm's board for more than fifteen years, (3) the percentage of directors who are older than seventy years old.
1998-2002 15,964 to
17,993
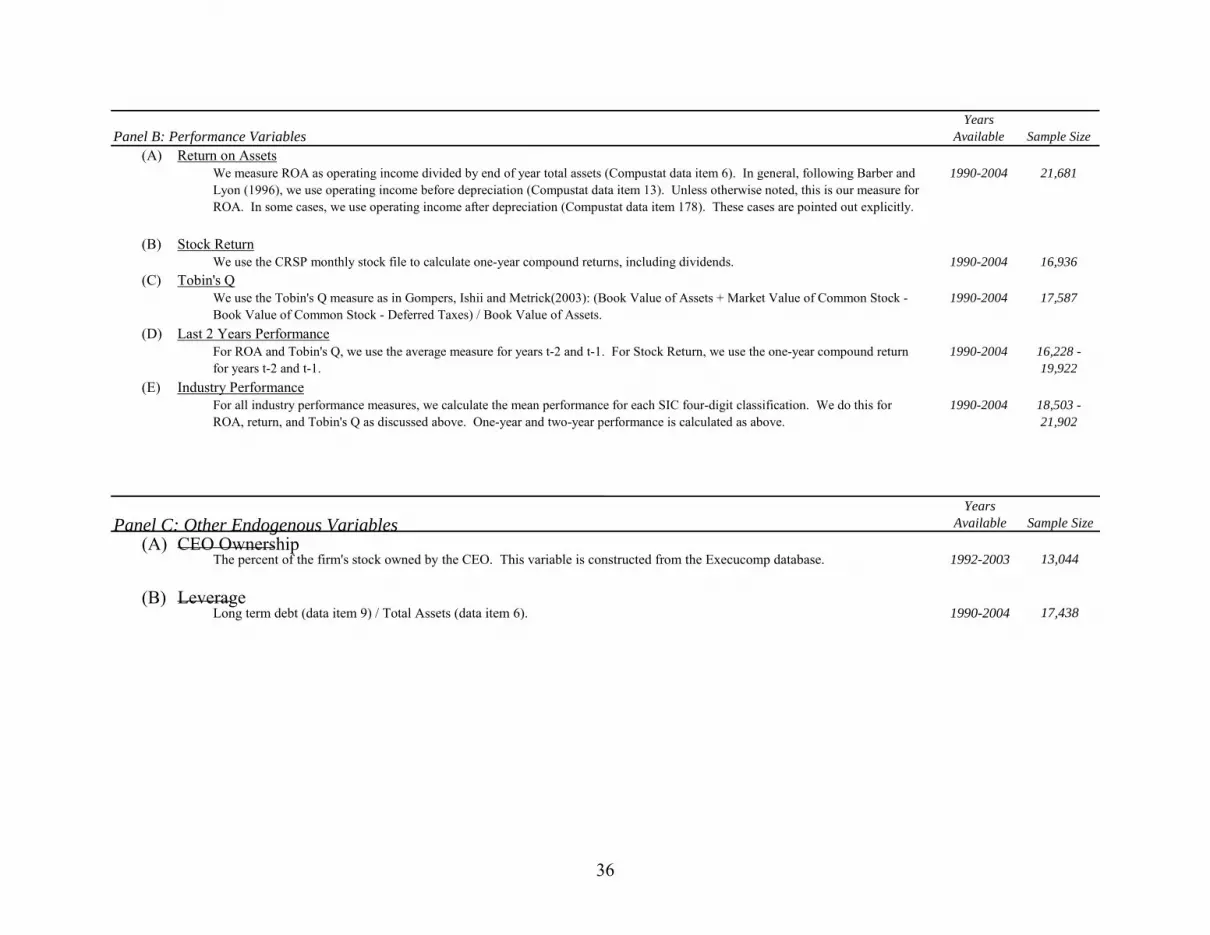
36
Panel B: Performance VariablesYears
Available Sample Size(A) Return on Assets
We measure ROA as operating income divided by end of year total assets (Compustat data item 6). In general, following Barber and Lyon (1996), we use operating income before depreciation (Compustat data item 13). Unless otherwise noted, this is our measure for ROA. In some cases, we use operating income after depreciation (Compustat data item 178). These cases are pointed out explicitly.
1990-2004 21,681
(B) Stock ReturnWe use the CRSP monthly stock file to calculate one-year compound returns, including dividends. 1990-2004 16,936
(C) Tobin's QWe use the Tobin's Q measure as in Gompers, Ishii and Metrick(2003): (Book Value of Assets + Market Value of Common Stock - Book Value of Common Stock - Deferred Taxes) / Book Value of Assets.
1990-2004 17,587
(D) Last 2 Years PerformanceFor ROA and Tobin's Q, we use the average measure for years t-2 and t-1. For Stock Return, we use the one-year compound return for years t-2 and t-1.
1990-2004 16,228 - 19,922
(E) Industry PerformanceFor all industry performance measures, we calculate the mean performance for each SIC four-digit classification. We do this for ROA, return, and Tobin's Q as discussed above. One-year and two-year performance is calculated as above.
1990-2004 18,503 - 21,902
Panel C: Other Endogenous VariablesYears
Available Sample Size
(A) CEO Ownership The percent of the firm's stock owned by the CEO. This variable is constructed from the Execucomp database. 1992-2003 13,044
(B) LeverageLong term debt (data item 9) / Total Assets (data item 6). 1990-2004 17,438
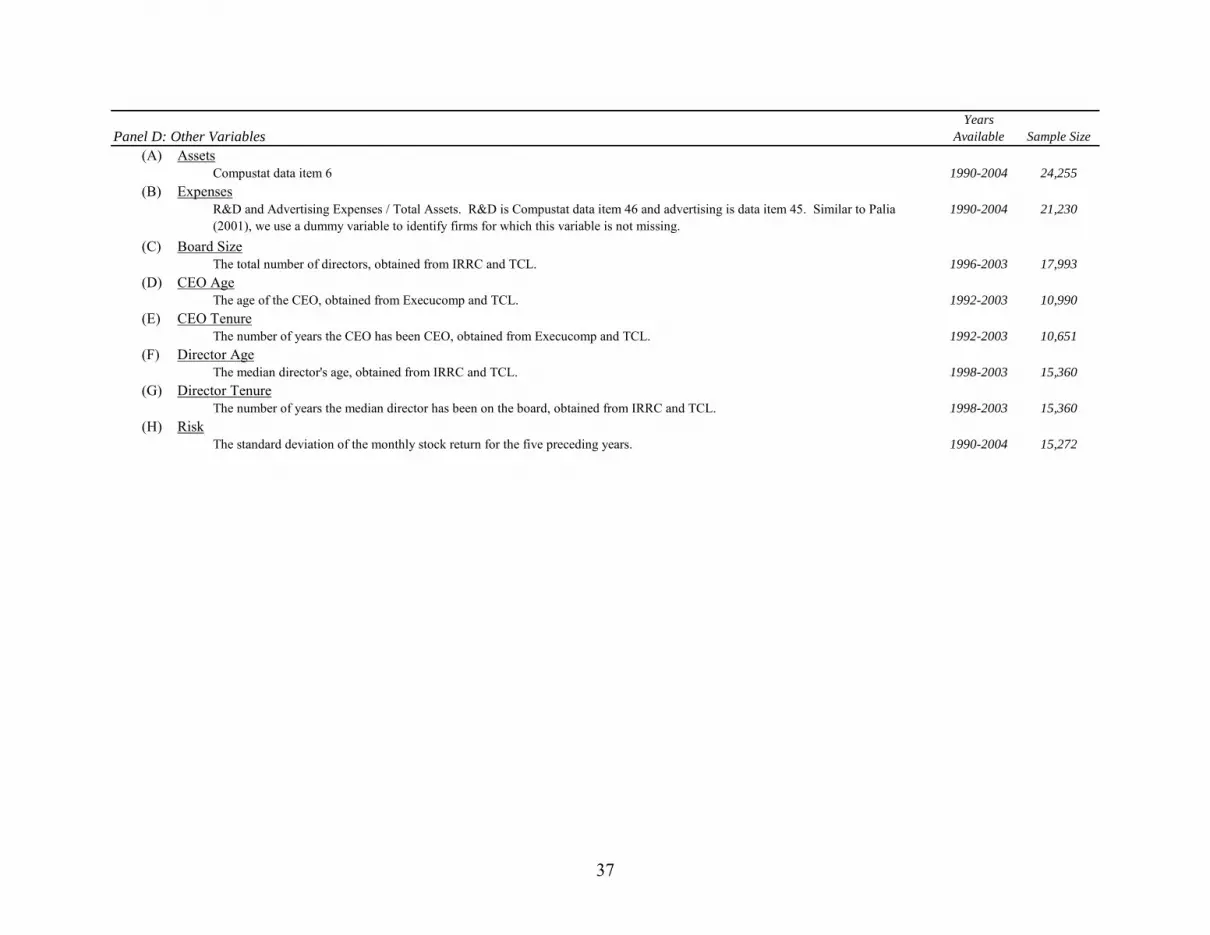
37
Panel D: Other VariablesYears
Available Sample Size(A) Assets
Compustat data item 6 1990-2004 24,255(B) Expenses
R&D and Advertising Expenses / Total Assets. R&D is Compustat data item 46 and advertising is data item 45. Similar to Palia (2001), we use a dummy variable to identify firms for which this variable is not missing.
1990-2004 21,230
(C) Board SizeThe total number of directors, obtained from IRRC and TCL. 1996-2003 17,993
(D) CEO AgeThe age of the CEO, obtained from Execucomp and TCL. 1992-2003 10,990
(E) CEO TenureThe number of years the CEO has been CEO, obtained from Execucomp and TCL. 1992-2003 10,651
(F) Director AgeThe median director's age, obtained from IRRC and TCL. 1998-2003 15,360
(G) Director TenureThe number of years the median director has been on the board, obtained from IRRC and TCL. 1998-2003 15,360
(H) RiskThe standard deviation of the monthly stock return for the five preceding years. 1990-2004 15,272
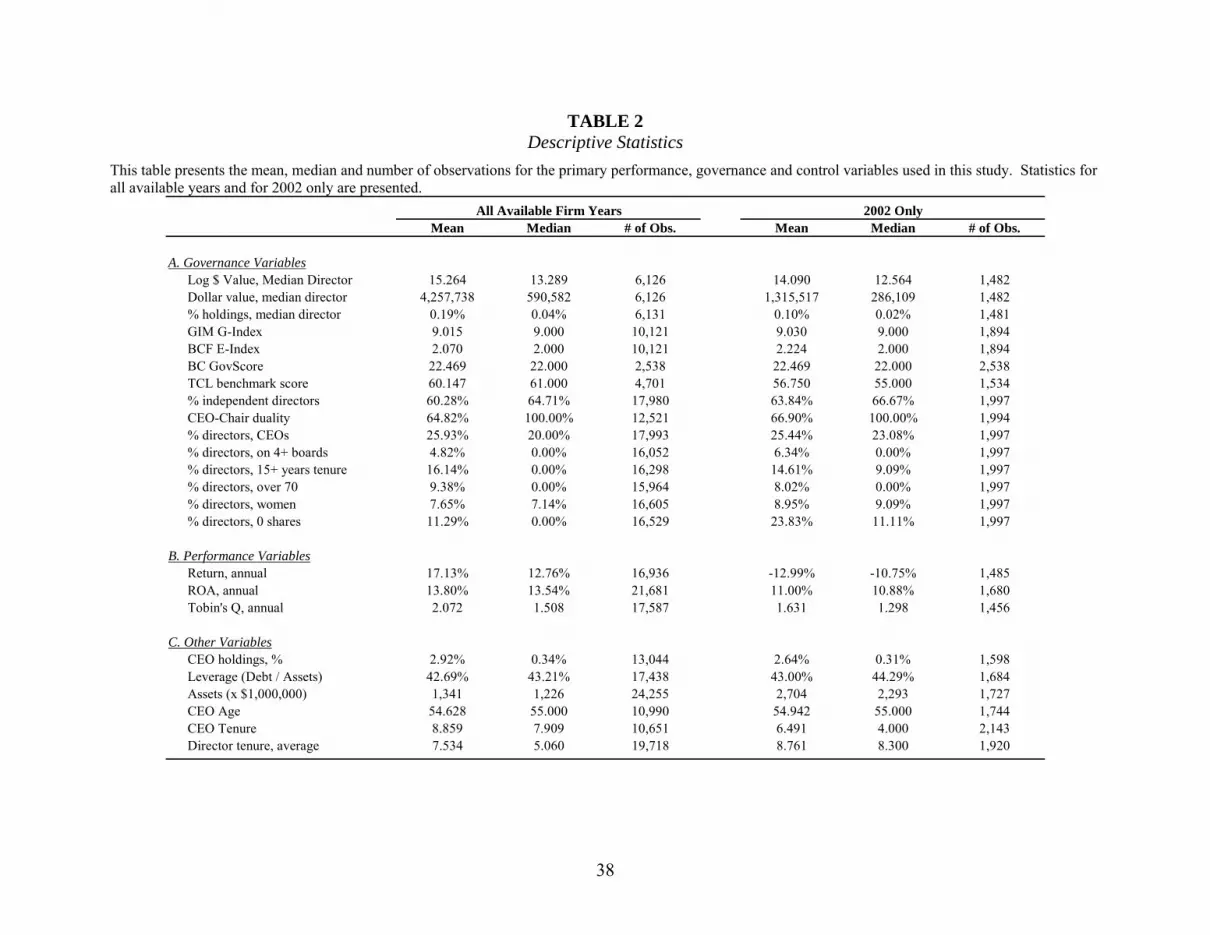
38
TABLE 2 Descriptive Statistics
This table presents the mean, median and number of observations for the primary performance, governance and control variables used in this study. Statistics for all available years and for 2002 only are presented.
Mean Median # of Obs. Mean Median # of Obs.
A. Governance VariablesLog $ Value, Median Director 15.264 13.289 6,126 14.090 12.564 1,482Dollar value, median director 4,257,738 590,582 6,126 1,315,517 286,109 1,482% holdings, median director 0.19% 0.04% 6,131 0.10% 0.02% 1,481GIM G-Index 9.015 9.000 10,121 9.030 9.000 1,894BCF E-Index 2.070 2.000 10,121 2.224 2.000 1,894BC GovScore 22.469 22.000 2,538 22.469 22.000 2,538TCL benchmark score 60.147 61.000 4,701 56.750 55.000 1,534% independent directors 60.28% 64.71% 17,980 63.84% 66.67% 1,997CEO-Chair duality 64.82% 100.00% 12,521 66.90% 100.00% 1,994% directors, CEOs 25.93% 20.00% 17,993 25.44% 23.08% 1,997% directors, on 4+ boards 4.82% 0.00% 16,052 6.34% 0.00% 1,997% directors, 15+ years tenure 16.14% 0.00% 16,298 14.61% 9.09% 1,997% directors, over 70 9.38% 0.00% 15,964 8.02% 0.00% 1,997% directors, women 7.65% 7.14% 16,605 8.95% 9.09% 1,997% directors, 0 shares 11.29% 0.00% 16,529 23.83% 11.11% 1,997
B. Performance VariablesReturn, annual 17.13% 12.76% 16,936 -12.99% -10.75% 1,485ROA, annual 13.80% 13.54% 21,681 11.00% 10.88% 1,680Tobin's Q, annual 2.072 1.508 17,587 1.631 1.298 1,456
C. Other VariablesCEO holdings, % 2.92% 0.34% 13,044 2.64% 0.31% 1,598Leverage (Debt / Assets) 42.69% 43.21% 17,438 43.00% 44.29% 1,684Assets (x $1,000,000) 1,341 1,226 24,255 2,704 2,293 1,727CEO Age 54.628 55.000 10,990 54.942 55.000 1,744CEO Tenure 8.859 7.909 10,651 6.491 4.000 2,143Director tenure, average 7.534 5.060 19,718 8.761 8.300 1,920
All Available Firm Years 2002 Only
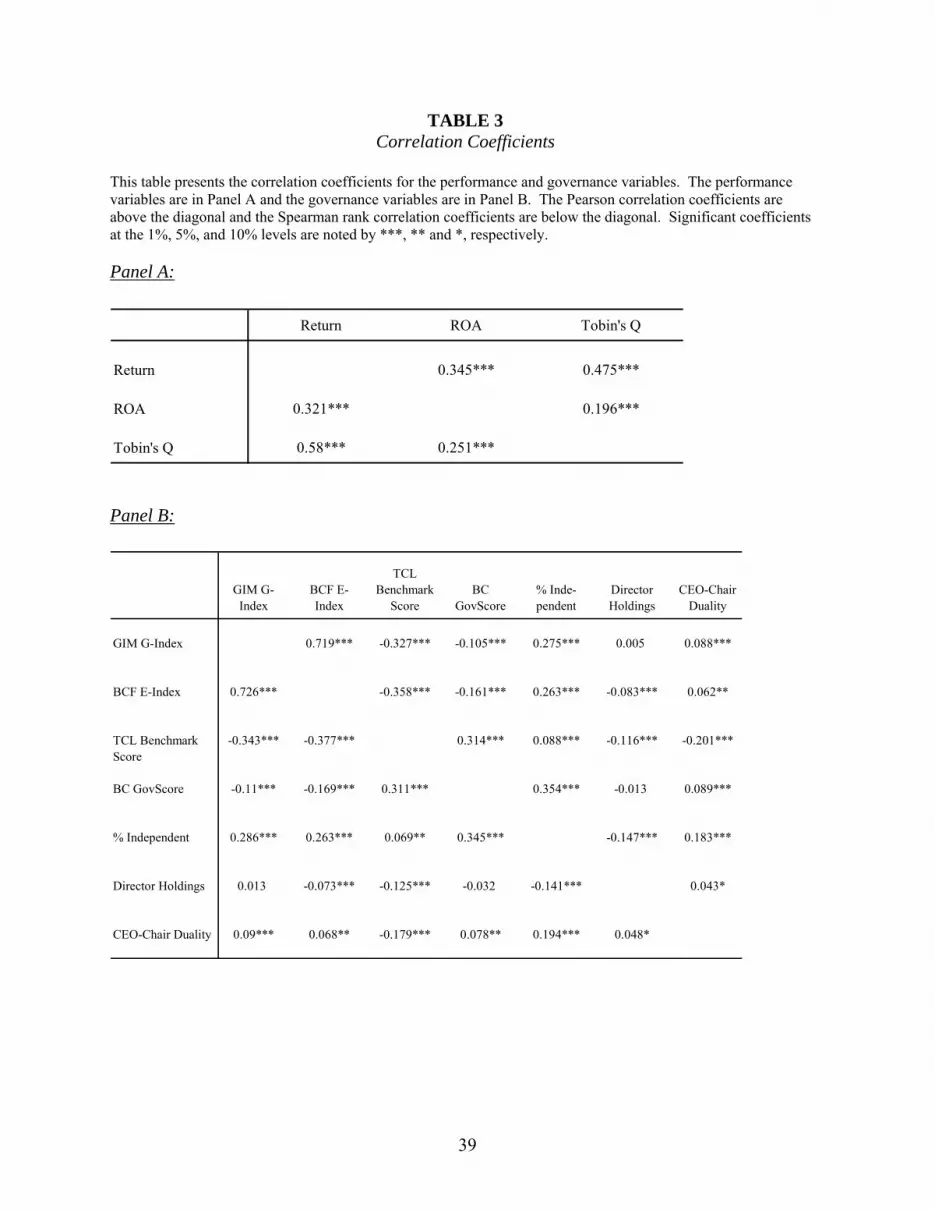
39
TABLE 3 Correlation Coefficients
This table presents the correlation coefficients for the performance and governance variables. The performance variables are in Panel A and the governance variables are in Panel B. The Pearson correlation coefficients are above the diagonal and the Spearman rank correlation coefficients are below the diagonal. Significant coefficients at the 1%, 5%, and 10% levels are noted by ***, ** and *, respectively. Panel A:
Return ROA Tobin's Q
Return 0.345*** 0.475***
ROA 0.321*** 0.196***
Tobin's Q 0.58*** 0.251***
Panel B:
GIM G-Index
BCF E-Index
TCL Benchmark
ScoreBC
GovScore% Inde-pendent
Director Holdings
CEO-Chair Duality
0.719*** -0.327*** -0.105*** 0.275*** 0.005 0.088***
0.726*** -0.358*** -0.161*** 0.263*** -0.083*** 0.062**
-0.343*** -0.377*** 0.314*** 0.088*** -0.116*** -0.201***
-0.11*** -0.169*** 0.311*** 0.354*** -0.013 0.089***
0.286*** 0.263*** 0.069** 0.345*** -0.147*** 0.183***
0.013 -0.073*** -0.125*** -0.032 -0.141*** 0.043*
0.09*** 0.068** -0.179*** 0.078** 0.194*** 0.048*
BC GovScore
% Independent
Director Holdings
CEO-Chair Duality
GIM G-Index
BCF E-Index
TCL Benchmark Score
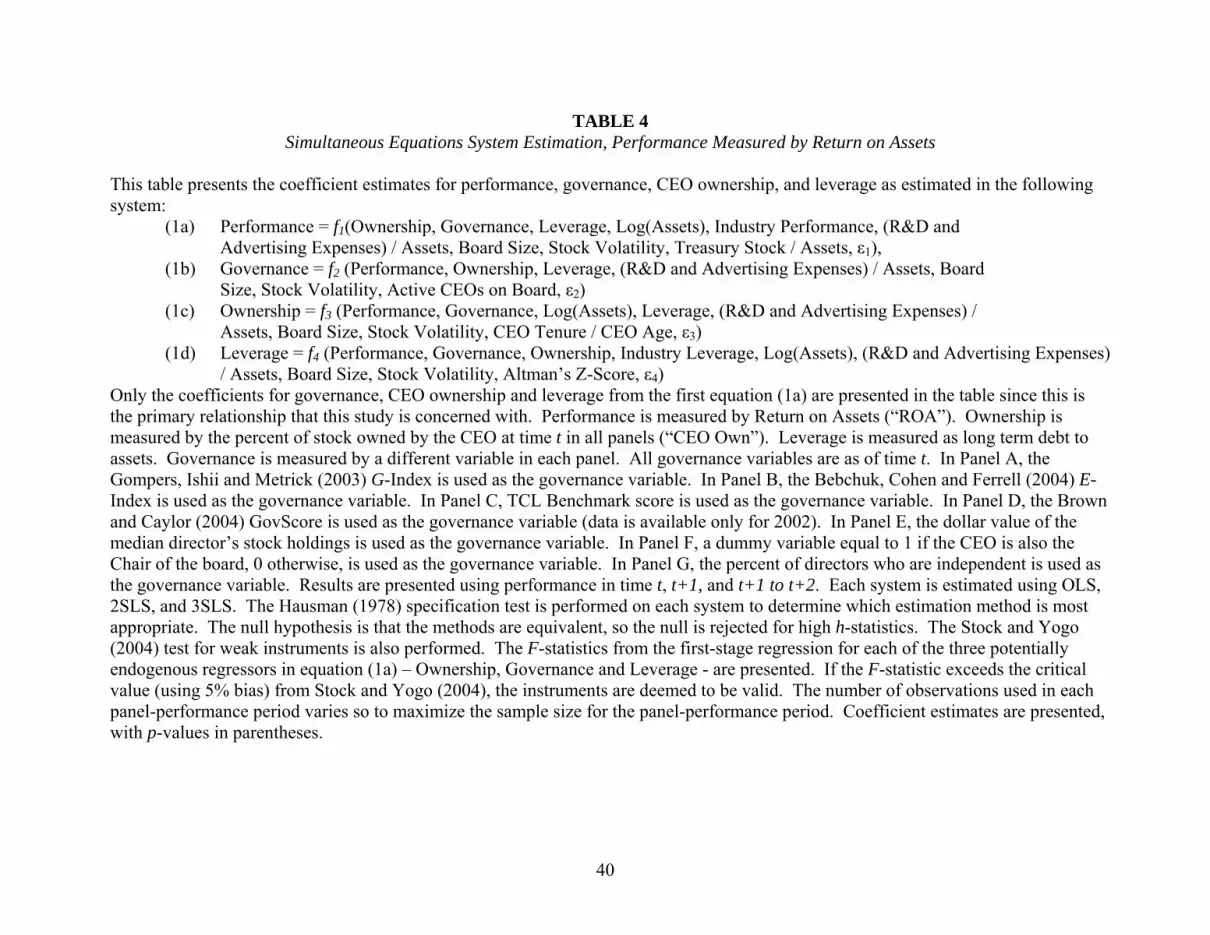
40
TABLE 4 Simultaneous Equations System Estimation, Performance Measured by Return on Assets
This table presents the coefficient estimates for performance, governance, CEO ownership, and leverage as estimated in the following system: (1a) Performance = f1(Ownership, Governance, Leverage, Log(Assets), Industry Performance, (R&D and Advertising Expenses) / Assets, Board Size, Stock Volatility, Treasury Stock / Assets, ε1), (1b) Governance = f2 (Performance, Ownership, Leverage, (R&D and Advertising Expenses) / Assets, Board Size, Stock Volatility, Active CEOs on Board, ε2) (1c) Ownership = f3 (Performance, Governance, Log(Assets), Leverage, (R&D and Advertising Expenses) / Assets, Board Size, Stock Volatility, CEO Tenure / CEO Age, ε3) (1d) Leverage = f4 (Performance, Governance, Ownership, Industry Leverage, Log(Assets), (R&D and Advertising Expenses) / Assets, Board Size, Stock Volatility, Altman’s Z-Score, ε4) Only the coefficients for governance, CEO ownership and leverage from the first equation (1a) are presented in the table since this is the primary relationship that this study is concerned with. Performance is measured by Return on Assets (“ROA”). Ownership is measured by the percent of stock owned by the CEO at time t in all panels (“CEO Own”). Leverage is measured as long term debt to assets. Governance is measured by a different variable in each panel. All governance variables are as of time t. In Panel A, the Gompers, Ishii and Metrick (2003) G-Index is used as the governance variable. In Panel B, the Bebchuk, Cohen and Ferrell (2004) E-Index is used as the governance variable. In Panel C, TCL Benchmark score is used as the governance variable. In Panel D, the Brown and Caylor (2004) GovScore is used as the governance variable (data is available only for 2002). In Panel E, the dollar value of the median director’s stock holdings is used as the governance variable. In Panel F, a dummy variable equal to 1 if the CEO is also the Chair of the board, 0 otherwise, is used as the governance variable. In Panel G, the percent of directors who are independent is used as the governance variable. Results are presented using performance in time t, t+1, and t+1 to t+2. Each system is estimated using OLS, 2SLS, and 3SLS. The Hausman (1978) specification test is performed on each system to determine which estimation method is most appropriate. The null hypothesis is that the methods are equivalent, so the null is rejected for high h-statistics. The Stock and Yogo (2004) test for weak instruments is also performed. The F-statistics from the first-stage regression for each of the three potentially endogenous regressors in equation (1a) – Ownership, Governance and Leverage - are presented. If the F-statistic exceeds the critical value (using 5% bias) from Stock and Yogo (2004), the instruments are deemed to be valid. The number of observations used in each panel-performance period varies so to maximize the sample size for the panel-performance period. Coefficient estimates are presented, with p-values in parentheses.

41
TABLE 4 Panel A: Gompers, Ishii and Metrick (2003) G-Index is the governance measure ("Gov")Return on Assets is the performance measure ("ROA")
OLS Estimate p-value OLS Estimate p-value OLS Estimate p-valueROA = Gov -0.001 (0.10) ROA = Gov -0.001 (0.03) ROA = Gov -0.001 (0.02)
CEO Own 0.05 (0.01) CEO Own 0.07 (0.00) CEO Own 0.02 (0.10)
Leverage -0.061 (0.00) Leverage -0.035 (0.00) Leverage -0.040 (0.00)
2SLS 2SLS 2SLSROA = Gov -0.013 (0.01) ROA = Gov -0.011 (0.03) ROA = Gov -0.004 (0.16)
CEO Own 0.18 (0.02) CEO Own 0.32 (0.00) CEO Own 0.09 (0.07)
Leverage -0.045 (0.00) Leverage -0.014 (0.13) Leverage -0.032 (0.00)
3SLS 3SLS 3SLSROA = Gov -0.013 (0.01) ROA = Gov -0.011 (0.02) ROA = Gov -0.004 (0.15)
CEO Own 0.19 (0.02) CEO Own 0.33 (0.00) CEO Own 0.09 (0.06)
Leverage -0.045 (0.00) Leverage -0.014 (0.13) Leverage -0.032 (0.00)
Sample Size 4,600 Sample Size 4,561 Sample Size 3,416
Hausman (1978) Specification Test:h -statistic p -value h-statistic p-value h-statistic p-value
OLS v. 2SLS 66.8 (0.00) OLS v. 2SLS 78.6 (0.00) OLS v. 2SLS 37.6 (0.10)
OLS v. 3SLS 48.7 (0.01) OLS v. 3SLS 69.2 (0.00) OLS v. 3SLS 103.40 (0.00)
2SLS v. 3SLS 19.9 (0.87) 2SLS v. 3SLS 18.0 (0.92) 2SLS v. 3SLS 31.6 (0.29)
Stock and Yogo (2004) Weak Instruments Test:First-Stage F -Statistic
Critical Value
First-Stage F-Statistic
Critical Value
First-StageF-Statistic
Critical Value
Gov 35.5 9.53 Gov 34.0 9.53 Gov 24.7 9.53 CEO Own 215.21 9.53 CEO Own 232.02 9.53 CEO Own 172.11 9.53 Leverage 98.7 9.53 Leverage 106.98 9.53 Leverage 87.7 9.53
Contemporaneous Performance Next 1 Year Performance Next 2 Years Performance
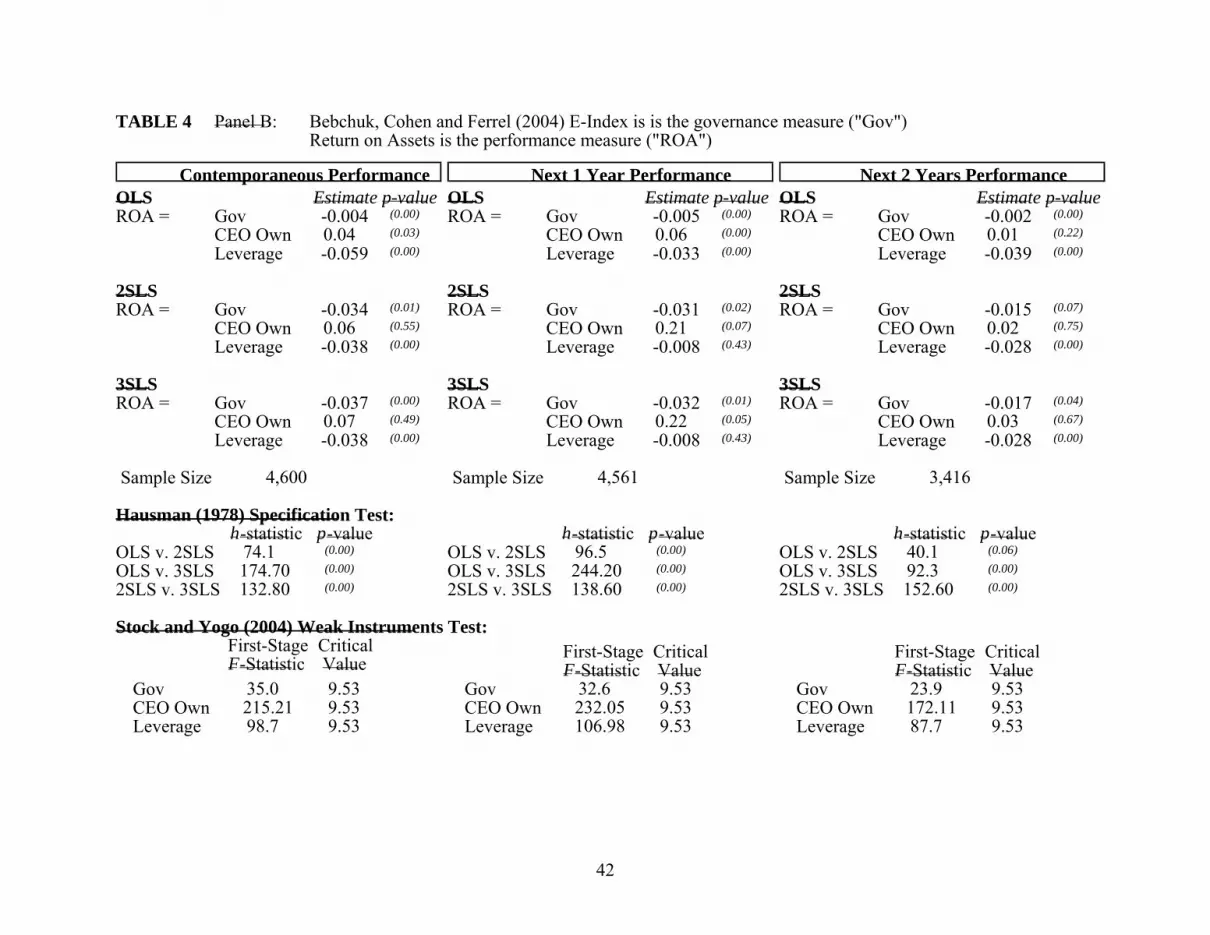
42
TABLE 4 Panel B: Bebchuk, Cohen and Ferrel (2004) E-Index is is the governance measure ("Gov")Return on Assets is the performance measure ("ROA")
OLS Estimate p-value OLS Estimate p-value OLS Estimate p-valueROA = Gov -0.004 (0.00) ROA = Gov -0.005 (0.00) ROA = Gov -0.002 (0.00)
CEO Own 0.04 (0.03) CEO Own 0.06 (0.00) CEO Own 0.01 (0.22)
Leverage -0.059 (0.00) Leverage -0.033 (0.00) Leverage -0.039 (0.00)
2SLS 2SLS 2SLSROA = Gov -0.034 (0.01) ROA = Gov -0.031 (0.02) ROA = Gov -0.015 (0.07)
CEO Own 0.06 (0.55) CEO Own 0.21 (0.07) CEO Own 0.02 (0.75)
Leverage -0.038 (0.00) Leverage -0.008 (0.43) Leverage -0.028 (0.00)
3SLS 3SLS 3SLSROA = Gov -0.037 (0.00) ROA = Gov -0.032 (0.01) ROA = Gov -0.017 (0.04)
CEO Own 0.07 (0.49) CEO Own 0.22 (0.05) CEO Own 0.03 (0.67)
Leverage -0.038 (0.00) Leverage -0.008 (0.43) Leverage -0.028 (0.00)
Sample Size 4,600 Sample Size 4,561 Sample Size 3,416
Hausman (1978) Specification Test:h -statistic p -value h-statistic p-value h-statistic p-value
OLS v. 2SLS 74.1 (0.00) OLS v. 2SLS 96.5 (0.00) OLS v. 2SLS 40.1 (0.06)
OLS v. 3SLS 174.70 (0.00) OLS v. 3SLS 244.20 (0.00) OLS v. 3SLS 92.3 (0.00)
2SLS v. 3SLS 132.80 (0.00) 2SLS v. 3SLS 138.60 (0.00) 2SLS v. 3SLS 152.60 (0.00)
Stock and Yogo (2004) Weak Instruments Test:First-Stage F-Statistic
Critical Value
First-Stage F-Statistic
Critical Value
First-Stage F-Statistic
Critical Value
Gov 35.0 9.53 Gov 32.6 9.53 Gov 23.9 9.53 CEO Own 215.21 9.53 CEO Own 232.05 9.53 CEO Own 172.11 9.53 Leverage 98.7 9.53 Leverage 106.98 9.53 Leverage 87.7 9.53
Contemporaneous Performance Next 1 Year Performance Next 2 Years Performance
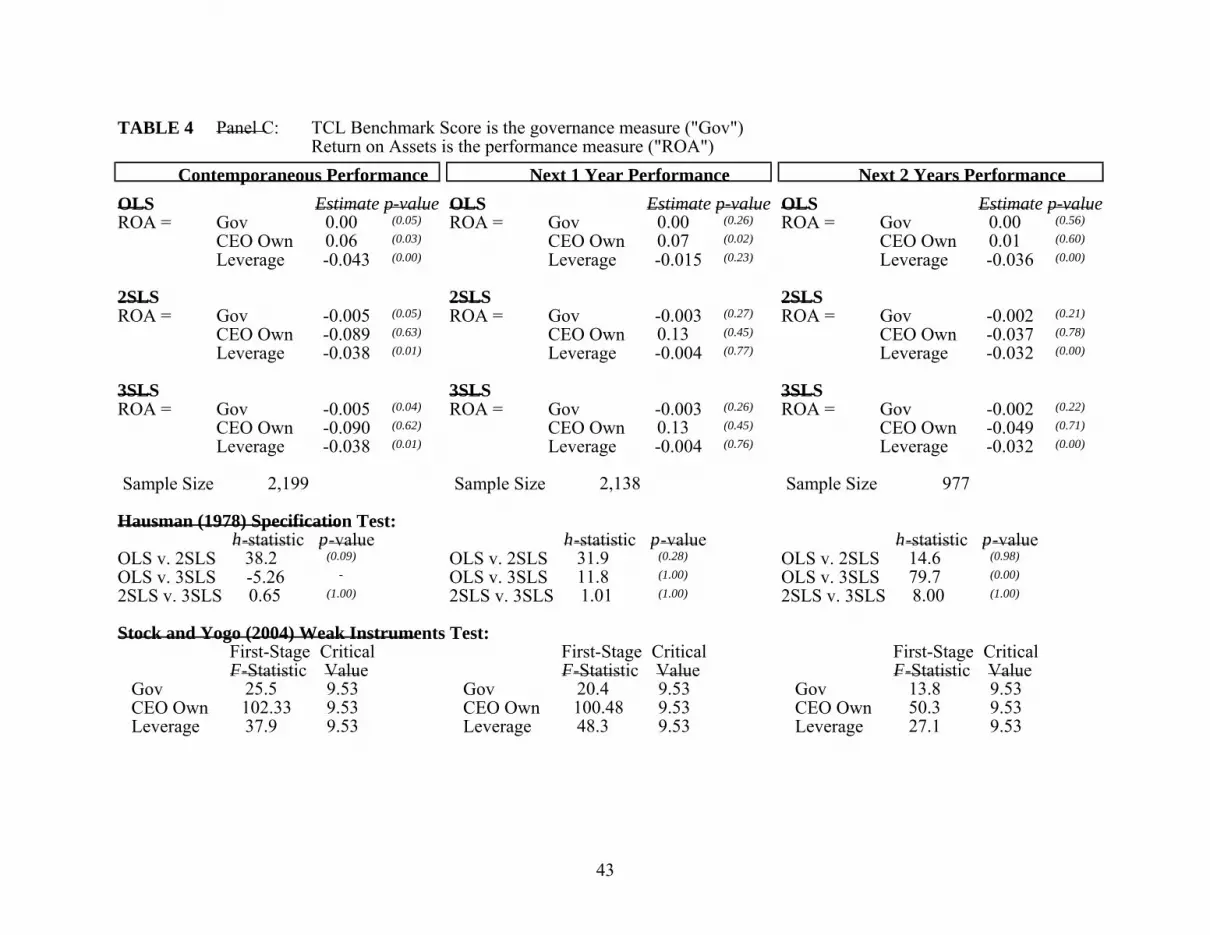
43
TABLE 4 Panel C: TCL Benchmark Score is the governance measure ("Gov")Return on Assets is the performance measure ("ROA")
OLS Estimate p-value OLS Estimate p-value OLS Estimate p-valueROA = Gov 0.00 (0.05) ROA = Gov 0.00 (0.26) ROA = Gov 0.00 (0.56)
CEO Own 0.06 (0.03) CEO Own 0.07 (0.02) CEO Own 0.01 (0.60)
Leverage -0.043 (0.00) Leverage -0.015 (0.23) Leverage -0.036 (0.00)
2SLS 2SLS 2SLSROA = Gov -0.005 (0.05) ROA = Gov -0.003 (0.27) ROA = Gov -0.002 (0.21)
CEO Own -0.089 (0.63) CEO Own 0.13 (0.45) CEO Own -0.037 (0.78)
Leverage -0.038 (0.01) Leverage -0.004 (0.77) Leverage -0.032 (0.00)
3SLS 3SLS 3SLSROA = Gov -0.005 (0.04) ROA = Gov -0.003 (0.26) ROA = Gov -0.002 (0.22)
CEO Own -0.090 (0.62) CEO Own 0.13 (0.45) CEO Own -0.049 (0.71)
Leverage -0.038 (0.01) Leverage -0.004 (0.76) Leverage -0.032 (0.00)
Sample Size 2,199 Sample Size 2,138 Sample Size 977
Hausman (1978) Specification Test:h -statistic p -value h-statistic p-value h-statistic p-value
OLS v. 2SLS 38.2 (0.09) OLS v. 2SLS 31.9 (0.28) OLS v. 2SLS 14.6 (0.98)
OLS v. 3SLS -5.26 - OLS v. 3SLS 11.8 (1.00) OLS v. 3SLS 79.7 (0.00)
2SLS v. 3SLS 0.65 (1.00) 2SLS v. 3SLS 1.01 (1.00) 2SLS v. 3SLS 8.00 (1.00)
Stock and Yogo (2004) Weak Instruments Test:First-Stage F -Statistic
Critical Value
First-Stage F-Statistic
Critical Value
First-Stage F-Statistic
Critical Value
Gov 25.5 9.53 Gov 20.4 9.53 Gov 13.8 9.53 CEO Own 102.33 9.53 CEO Own 100.48 9.53 CEO Own 50.3 9.53 Leverage 37.9 9.53 Leverage 48.3 9.53 Leverage 27.1 9.53
Contemporaneous Performance Next 1 Year Performance Next 2 Years Performance
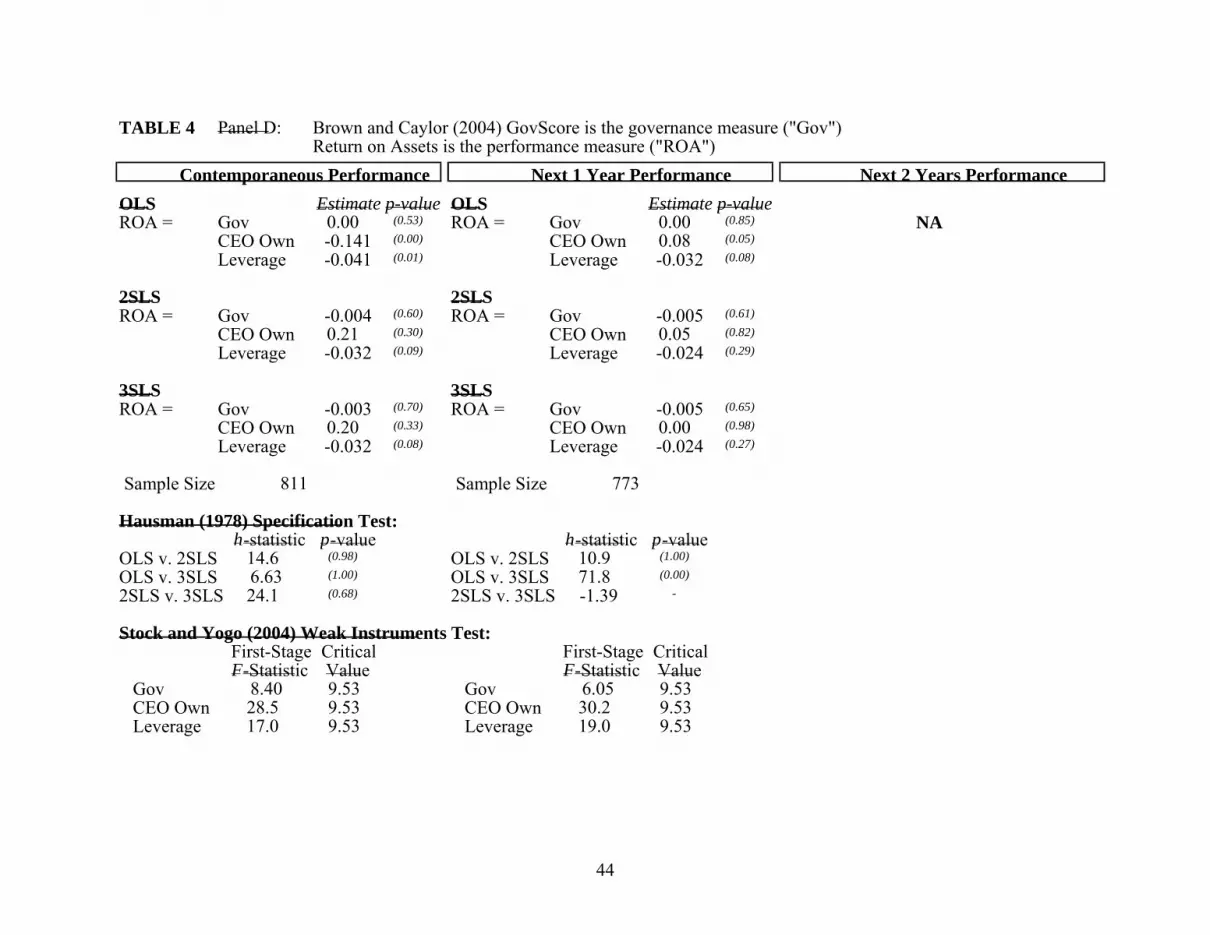
44
TABLE 4 Panel D: Brown and Caylor (2004) GovScore is the governance measure ("Gov")Return on Assets is the performance measure ("ROA")
OLS Estimate p-value OLS Estimate p-valueROA = Gov 0.00 (0.53) ROA = Gov 0.00 (0.85) NA
CEO Own -0.141 (0.00) CEO Own 0.08 (0.05)
Leverage -0.041 (0.01) Leverage -0.032 (0.08)
2SLS 2SLSROA = Gov -0.004 (0.60) ROA = Gov -0.005 (0.61)
CEO Own 0.21 (0.30) CEO Own 0.05 (0.82)
Leverage -0.032 (0.09) Leverage -0.024 (0.29)
3SLS 3SLSROA = Gov -0.003 (0.70) ROA = Gov -0.005 (0.65)
CEO Own 0.20 (0.33) CEO Own 0.00 (0.98)
Leverage -0.032 (0.08) Leverage -0.024 (0.27)
Sample Size 811 Sample Size 773
Hausman (1978) Specification Test:h -statistic p -value h-statistic p-value
OLS v. 2SLS 14.6 (0.98) OLS v. 2SLS 10.9 (1.00)
OLS v. 3SLS 6.63 (1.00) OLS v. 3SLS 71.8 (0.00)
2SLS v. 3SLS 24.1 (0.68) 2SLS v. 3SLS -1.39 -
Stock and Yogo (2004) Weak Instruments Test:First-Stage F -Statistic
Critical Value
First-Stage F-Statistic
Critical Value
Gov 8.40 9.53 Gov 6.05 9.53 CEO Own 28.5 9.53 CEO Own 30.2 9.53 Leverage 17.0 9.53 Leverage 19.0 9.53
Contemporaneous Performance Next 1 Year Performance Next 2 Years Performance
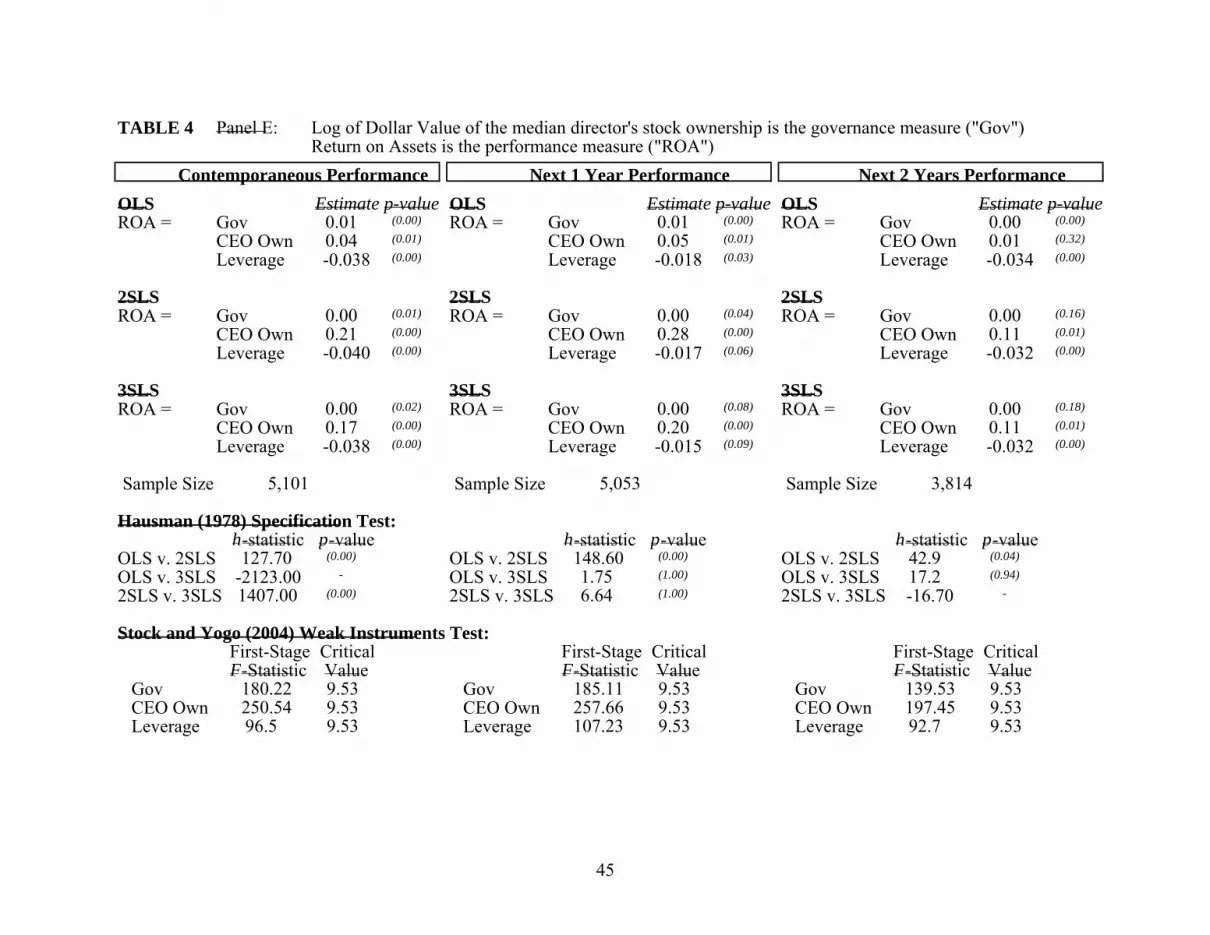
45
TABLE 4 Panel E: Log of Dollar Value of the median director's stock ownership is the governance measure ("Gov") Return on Assets is the performance measure ("ROA")
OLS Estimate p-value OLS Estimate p-value OLS Estimate p-valueROA = Gov 0.01 (0.00) ROA = Gov 0.01 (0.00) ROA = Gov 0.00 (0.00)
CEO Own 0.04 (0.01) CEO Own 0.05 (0.01) CEO Own 0.01 (0.32)
Leverage -0.038 (0.00) Leverage -0.018 (0.03) Leverage -0.034 (0.00)
2SLS 2SLS 2SLSROA = Gov 0.00 (0.01) ROA = Gov 0.00 (0.04) ROA = Gov 0.00 (0.16)
CEO Own 0.21 (0.00) CEO Own 0.28 (0.00) CEO Own 0.11 (0.01)
Leverage -0.040 (0.00) Leverage -0.017 (0.06) Leverage -0.032 (0.00)
3SLS 3SLS 3SLSROA = Gov 0.00 (0.02) ROA = Gov 0.00 (0.08) ROA = Gov 0.00 (0.18)
CEO Own 0.17 (0.00) CEO Own 0.20 (0.00) CEO Own 0.11 (0.01)
Leverage -0.038 (0.00) Leverage -0.015 (0.09) Leverage -0.032 (0.00)
Sample Size 5,101 Sample Size 5,053 Sample Size 3,814
Hausman (1978) Specification Test:h -statistic p -value h-statistic p-value h-statistic p-value
OLS v. 2SLS 127.70 (0.00) OLS v. 2SLS 148.60 (0.00) OLS v. 2SLS 42.9 (0.04)
OLS v. 3SLS -2123.00 - OLS v. 3SLS 1.75 (1.00) OLS v. 3SLS 17.2 (0.94)
2SLS v. 3SLS 1407.00 (0.00) 2SLS v. 3SLS 6.64 (1.00) 2SLS v. 3SLS -16.70 -
Stock and Yogo (2004) Weak Instruments Test:First-Stage F -Statistic
Critical Value
First-Stage F-Statistic
Critical Value
First-Stage F-Statistic
Critical Value
Gov 180.22 9.53 Gov 185.11 9.53 Gov 139.53 9.53 CEO Own 250.54 9.53 CEO Own 257.66 9.53 CEO Own 197.45 9.53 Leverage 96.5 9.53 Leverage 107.23 9.53 Leverage 92.7 9.53
Contemporaneous Performance Next 1 Year Performance Next 2 Years Performance
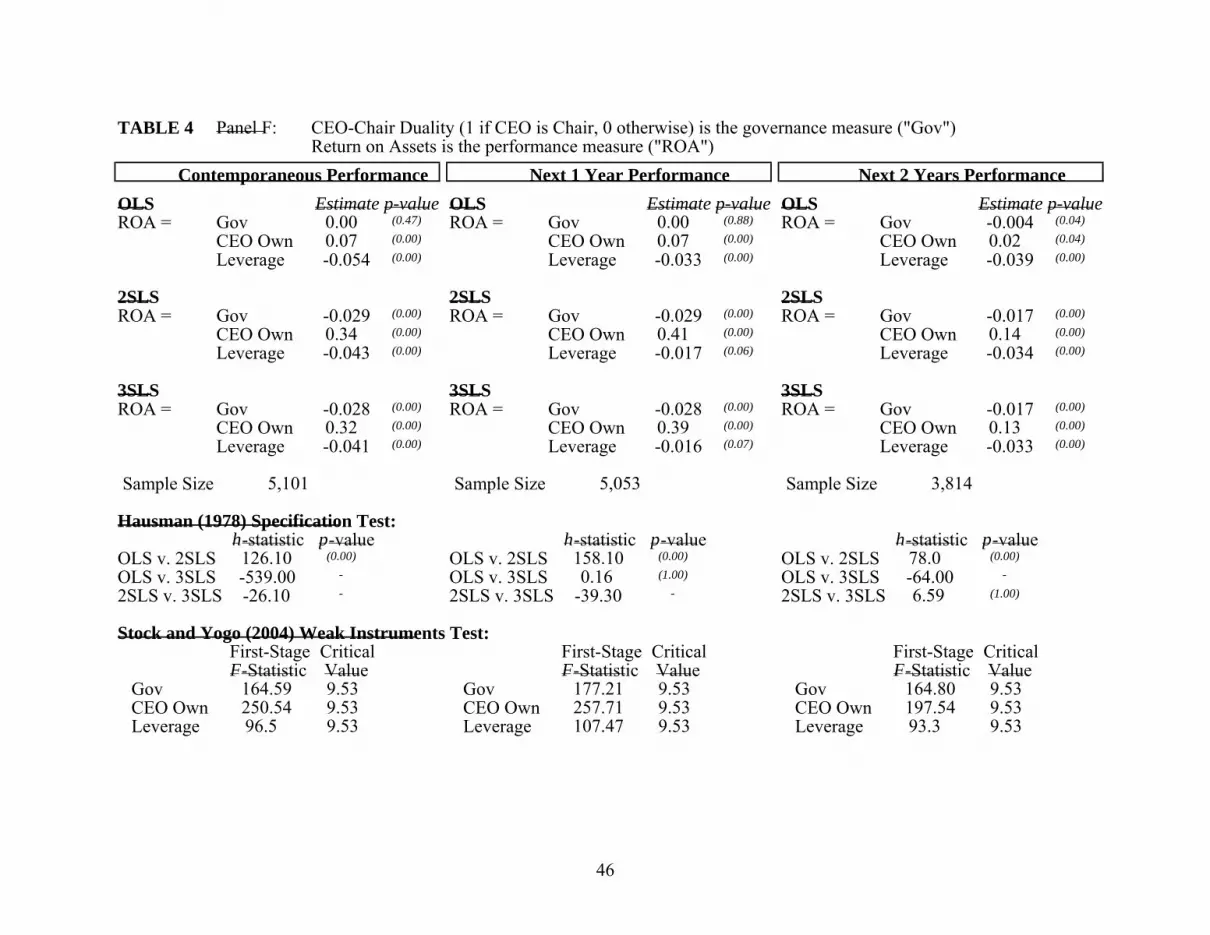
46
TABLE 4 Panel F: CEO-Chair Duality (1 if CEO is Chair, 0 otherwise) is the governance measure ("Gov")Return on Assets is the performance measure ("ROA")
OLS Estimate p-value OLS Estimate p-value OLS Estimate p-valueROA = Gov 0.00 (0.47) ROA = Gov 0.00 (0.88) ROA = Gov -0.004 (0.04)
CEO Own 0.07 (0.00) CEO Own 0.07 (0.00) CEO Own 0.02 (0.04)
Leverage -0.054 (0.00) Leverage -0.033 (0.00) Leverage -0.039 (0.00)
2SLS 2SLS 2SLSROA = Gov -0.029 (0.00) ROA = Gov -0.029 (0.00) ROA = Gov -0.017 (0.00)
CEO Own 0.34 (0.00) CEO Own 0.41 (0.00) CEO Own 0.14 (0.00)
Leverage -0.043 (0.00) Leverage -0.017 (0.06) Leverage -0.034 (0.00)
3SLS 3SLS 3SLSROA = Gov -0.028 (0.00) ROA = Gov -0.028 (0.00) ROA = Gov -0.017 (0.00)
CEO Own 0.32 (0.00) CEO Own 0.39 (0.00) CEO Own 0.13 (0.00)
Leverage -0.041 (0.00) Leverage -0.016 (0.07) Leverage -0.033 (0.00)
Sample Size 5,101 Sample Size 5,053 Sample Size 3,814
Hausman (1978) Specification Test:h -statistic p -value h-statistic p-value h-statistic p-value
OLS v. 2SLS 126.10 (0.00) OLS v. 2SLS 158.10 (0.00) OLS v. 2SLS 78.0 (0.00)
OLS v. 3SLS -539.00 - OLS v. 3SLS 0.16 (1.00) OLS v. 3SLS -64.00 -
2SLS v. 3SLS -26.10 - 2SLS v. 3SLS -39.30 - 2SLS v. 3SLS 6.59 (1.00)
Stock and Yogo (2004) Weak Instruments Test:First-Stage F -Statistic
Critical Value
First-Stage F-Statistic
Critical Value
First-Stage F-Statistic
Critical Value
Gov 164.59 9.53 Gov 177.21 9.53 Gov 164.80 9.53 CEO Own 250.54 9.53 CEO Own 257.71 9.53 CEO Own 197.54 9.53 Leverage 96.5 9.53 Leverage 107.47 9.53 Leverage 93.3 9.53
Next 1 Year Performance Next 2 Years PerformanceContemporaneous Performance

47
TABLE 4 Panel G: Percentage of directors who are independent is the governance measure ("Gov")Return on Assets is the performance measure ("ROA")
OLS Estimate p-value OLS Estimate p-value OLS Estimate p-valueROA = Gov -0.045 (0.00) ROA = Gov -0.052 (0.00) ROA = Gov -0.020 (0.00)
CEO Own 0.04 (0.01) CEO Own 0.04 (0.02) CEO Own 0.00 (0.49)
Leverage -0.055 (0.00) Leverage -0.033 (0.00) Leverage -0.040 (0.00)
2SLS 2SLS 2SLSROA = Gov -0.131 (0.00) ROA = Gov -0.121 (0.00) ROA = Gov -0.068 (0.01)
CEO Own 0.08 (0.32) CEO Own 0.16 (542.00) CEO Own 0.02 (0.62)
Leverage -0.054 (0.00) Leverage -0.027 (0.00) Leverage -0.037 (0.00)
3SLS 3SLS 3SLSROA = Gov -0.130 (0.00) ROA = Gov -0.120 (0.00) ROA = Gov -0.068 (0.01)
CEO Own 0.07 (0.34) CEO Own 0.16 (0.06) CEO Own 0.02 (0.64)
Leverage -0.054 (0.00) Leverage -0.027 (0.00) Leverage -0.037 (0.00)
Sample Size 5,101 Sample Size 5,053 Sample Size 3,814
Hausman (1978) Specification Test:h -statistic p -value h-statistic p-value h-statistic p-value
OLS v. 2SLS 78.6 (0.00) OLS v. 2SLS 68.5 (0.00) OLS v. 2SLS 36.3 (0.13)
OLS v. 3SLS 8.34 (1.00) OLS v. 3SLS -3.18 - OLS v. 3SLS -4.41 -
2SLS v. 3SLS 9.73 (1.00) 2SLS v. 3SLS 4.54 (1.00) 2SLS v. 3SLS 2.11 (1.00)
Stock and Yogo (2004) Weak Instruments Test:First-Stage F -Statistic
Critical Value
First-Stage F-Statistic
Critical Value
First-Stage F-Statistic
Critical Value
Gov 160.33 9.53 Gov 161.12 9.53 Gov 118.53 9.53 CEO Own 250.54 9.53 CEO Own 257.71 9.53 CEO Own 197.54 9.53 Leverage 96.5 9.53 Leverage 107.47 9.53 Leverage 93.3 9.53
Contemporaneous Performance Next 1 Year Performance Next 2 Years Performance
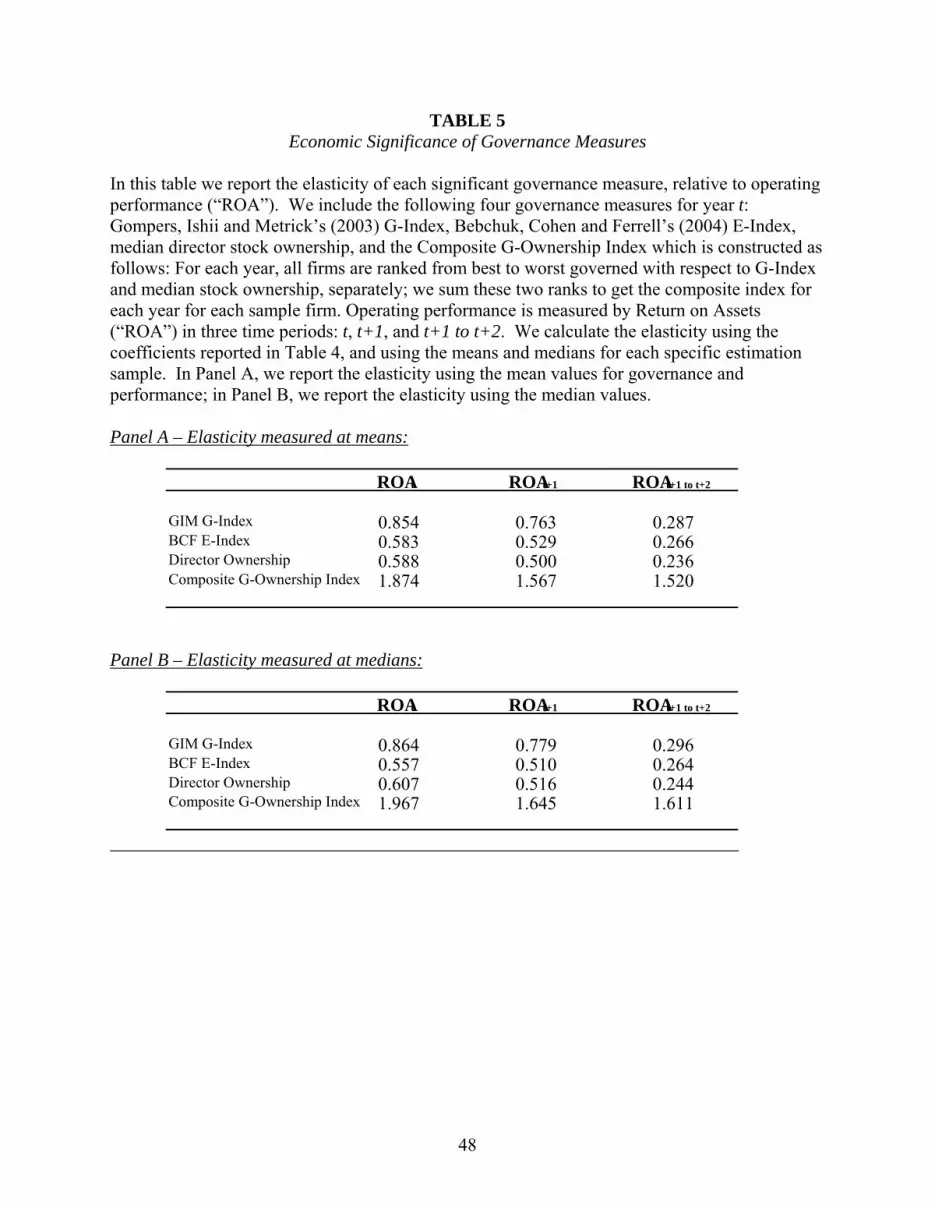
48
TABLE 5 Economic Significance of Governance Measures
In this table we report the elasticity of each significant governance measure, relative to operating performance (“ROA”). We include the following four governance measures for year t: Gompers, Ishii and Metrick’s (2003) G-Index, Bebchuk, Cohen and Ferrell’s (2004) E-Index, median director stock ownership, and the Composite G-Ownership Index which is constructed as follows: For each year, all firms are ranked from best to worst governed with respect to G-Index and median stock ownership, separately; we sum these two ranks to get the composite index for each year for each sample firm. Operating performance is measured by Return on Assets (“ROA”) in three time periods: t, t+1, and t+1 to t+2. We calculate the elasticity using the coefficients reported in Table 4, and using the means and medians for each specific estimation sample. In Panel A, we report the elasticity using the mean values for governance and performance; in Panel B, we report the elasticity using the median values. Panel A – Elasticity measured at means:
Panel B – Elasticity measured at medians:
ROAt ROAt+1 ROA t+1 to t+2
GIM G-Index 0.854 0.763 0.287 BCF E-Index 0.583 0.529 0.266 Director Ownership 0.588 0.500 0.236 Composite G-Ownership Index 1.874 1.567 1.520
ROAt ROAt+1 ROA t+1 to t+2
GIM G-Index 0.864 0.779 0.296 BCF E-Index 0.557 0.510 0.264 Director Ownership 0.607 0.516 0.244 Composite G-Ownership Index
1.967 1.645 1.611
49
TABLE 6
k-Class Estimators
In this table we report the results of estimating equation (1a) using different k-class estimators. We estimate equation (1) using contemporaneous operating performance (“ROA”) and using the seven governance variables. The following governance variables are considered: the Gompers, Ishii and Metrick (2003) G-Index, the Bebchuk, Cohen and Ferrell (2004) E-Index, TCL Benchmark score, the Brown and Caylor (2004) GovScore (data is available only for 2002), the dollar value of the median director’s stock holdings, a dummy variable equal to 1 if the CEO is also the Chair of the board, 0 otherwise, and, the percent of directors who are independent. We estimate equation (1) using a different value of k in each iteration, ranging from k=0.0 (OLS) to k=1.0 (2SLS), in increments of 0.1. We also report the 3SLS results for comparison. Each column presents the results for a single governance measure. Only the coefficients on the governance variable from equation (1a) are presented; p-values are in parentheses.
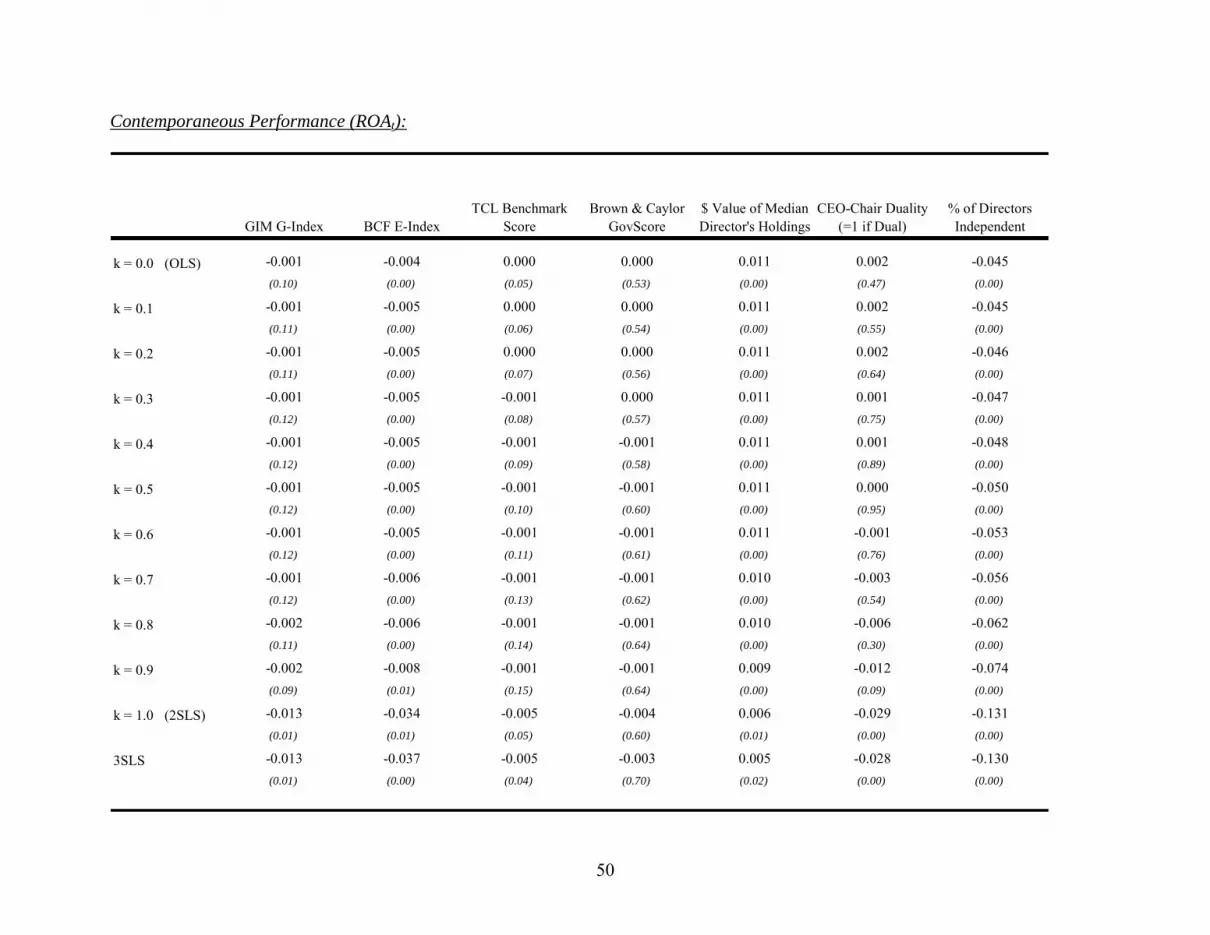
50
Contemporaneous Performance (ROAt):
GIM G-Index BCF E-IndexTCL Benchmark
ScoreBrown & Caylor
GovScore$ Value of Median Director's Holdings
CEO-Chair Duality (=1 if Dual)
% of Directors Independent
k = 0.0 (OLS) -0.001 -0.004 0.000 0.000 0.011 0.002 -0.045(0.10) (0.00) (0.05) (0.53) (0.00) (0.47) (0.00)
k = 0.1 -0.001 -0.005 0.000 0.000 0.011 0.002 -0.045(0.11) (0.00) (0.06) (0.54) (0.00) (0.55) (0.00)
k = 0.2 -0.001 -0.005 0.000 0.000 0.011 0.002 -0.046(0.11) (0.00) (0.07) (0.56) (0.00) (0.64) (0.00)
k = 0.3 -0.001 -0.005 -0.001 0.000 0.011 0.001 -0.047(0.12) (0.00) (0.08) (0.57) (0.00) (0.75) (0.00)
k = 0.4 -0.001 -0.005 -0.001 -0.001 0.011 0.001 -0.048(0.12) (0.00) (0.09) (0.58) (0.00) (0.89) (0.00)
k = 0.5 -0.001 -0.005 -0.001 -0.001 0.011 0.000 -0.050(0.12) (0.00) (0.10) (0.60) (0.00) (0.95) (0.00)
k = 0.6 -0.001 -0.005 -0.001 -0.001 0.011 -0.001 -0.053(0.12) (0.00) (0.11) (0.61) (0.00) (0.76) (0.00)
k = 0.7 -0.001 -0.006 -0.001 -0.001 0.010 -0.003 -0.056(0.12) (0.00) (0.13) (0.62) (0.00) (0.54) (0.00)
k = 0.8 -0.002 -0.006 -0.001 -0.001 0.010 -0.006 -0.062(0.11) (0.00) (0.14) (0.64) (0.00) (0.30) (0.00)
k = 0.9 -0.002 -0.008 -0.001 -0.001 0.009 -0.012 -0.074(0.09) (0.01) (0.15) (0.64) (0.00) (0.09) (0.00)
k = 1.0 (2SLS) -0.013 -0.034 -0.005 -0.004 0.006 -0.029 -0.131(0.01) (0.01) (0.05) (0.60) (0.01) (0.00) (0.00)
3SLS -0.013 -0.037 -0.005 -0.003 0.005 -0.028 -0.130(0.01) (0.00) (0.04) (0.70) (0.02) (0.00) (0.00)
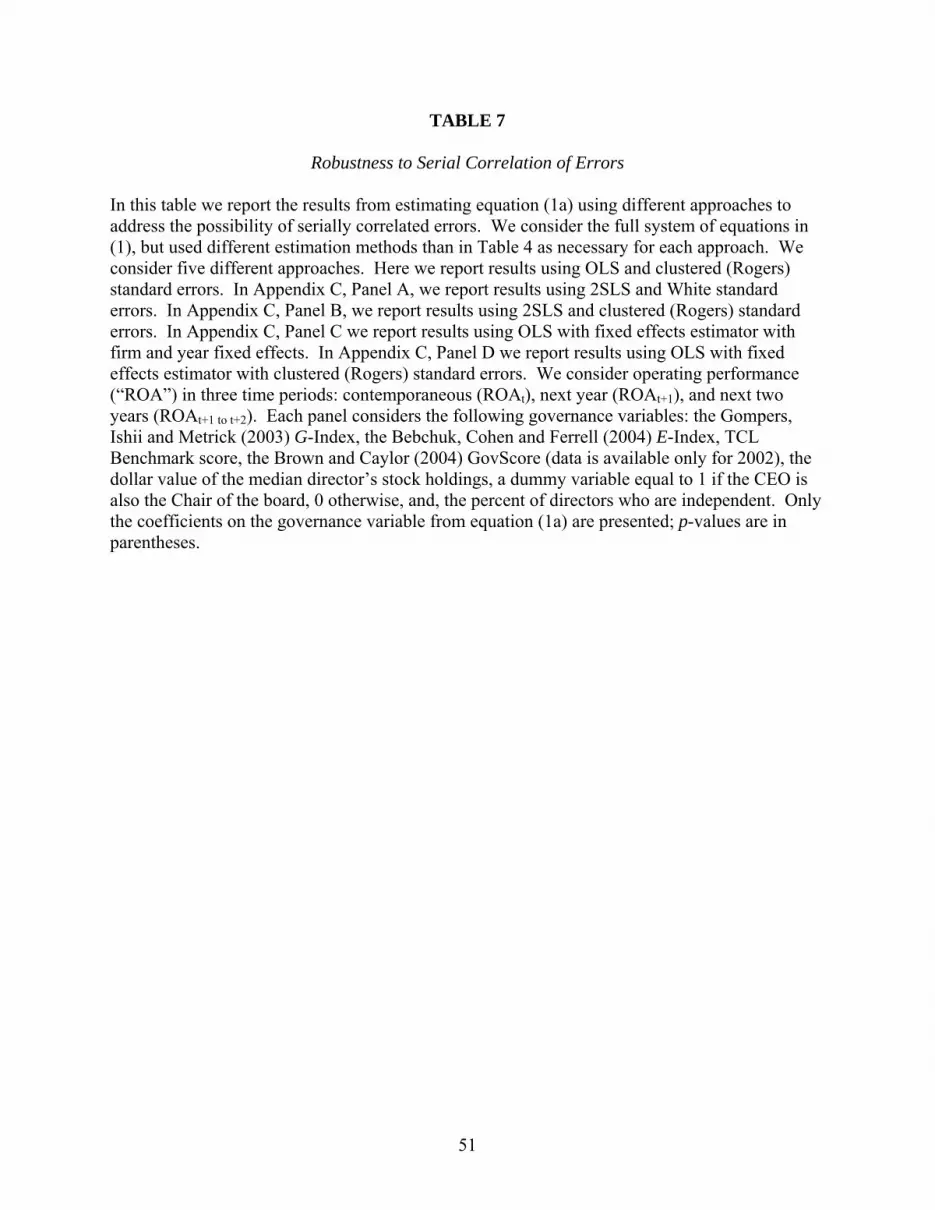
51
TABLE 7
Robustness to Serial Correlation of Errors
In this table we report the results from estimating equation (1a) using different approaches to address the possibility of serially correlated errors. We consider the full system of equations in (1), but used different estimation methods than in Table 4 as necessary for each approach. We consider five different approaches. Here we report results using OLS and clustered (Rogers) standard errors. In Appendix C, Panel A, we report results using 2SLS and White standard errors. In Appendix C, Panel B, we report results using 2SLS and clustered (Rogers) standard errors. In Appendix C, Panel C we report results using OLS with fixed effects estimator with firm and year fixed effects. In Appendix C, Panel D we report results using OLS with fixed effects estimator with clustered (Rogers) standard errors. We consider operating performance (“ROA”) in three time periods: contemporaneous (ROAt), next year (ROAt+1), and next two years (ROAt+1 to t+2). Each panel considers the following governance variables: the Gompers, Ishii and Metrick (2003) G-Index, the Bebchuk, Cohen and Ferrell (2004) E-Index, TCL Benchmark score, the Brown and Caylor (2004) GovScore (data is available only for 2002), the dollar value of the median director’s stock holdings, a dummy variable equal to 1 if the CEO is also the Chair of the board, 0 otherwise, and, the percent of directors who are independent. Only the coefficients on the governance variable from equation (1a) are presented; p-values are in parentheses.
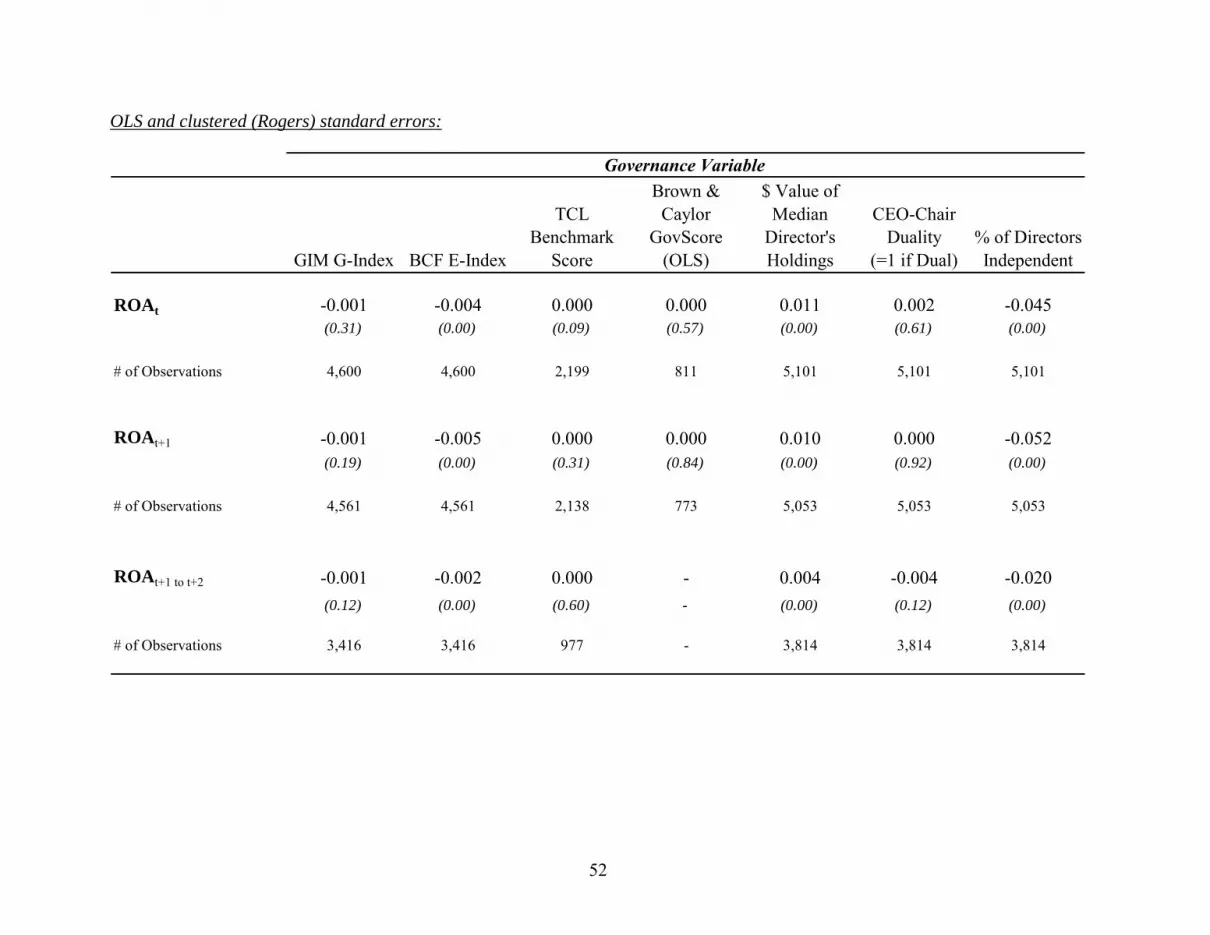
52
OLS and clustered (Rogers) standard errors:
GIM G-Index BCF E-Index
TCL Benchmark
Score
Brown & Caylor
GovScore (OLS)
$ Value of Median
Director's Holdings
CEO-Chair Duality
(=1 if Dual)% of Directors Independent
ROAt -0.001 -0.004 0.000 0.000 0.011 0.002 -0.045(0.31) (0.00) (0.09) (0.57) (0.00) (0.61) (0.00)
# of Observations 4,600 4,600 2,199 811 5,101 5,101 5,101
ROAt+1 -0.001 -0.005 0.000 0.000 0.010 0.000 -0.052(0.19) (0.00) (0.31) (0.84) (0.00) (0.92) (0.00)
# of Observations 4,561 4,561 2,138 773 5,053 5,053 5,053
ROAt+1 to t+2 -0.001 -0.002 0.000 - 0.004 -0.004 -0.020(0.12) (0.00) (0.60) - (0.00) (0.12) (0.00)
# of Observations 3,416 3,416 977 - 3,814 3,814 3,814
Governance Variable
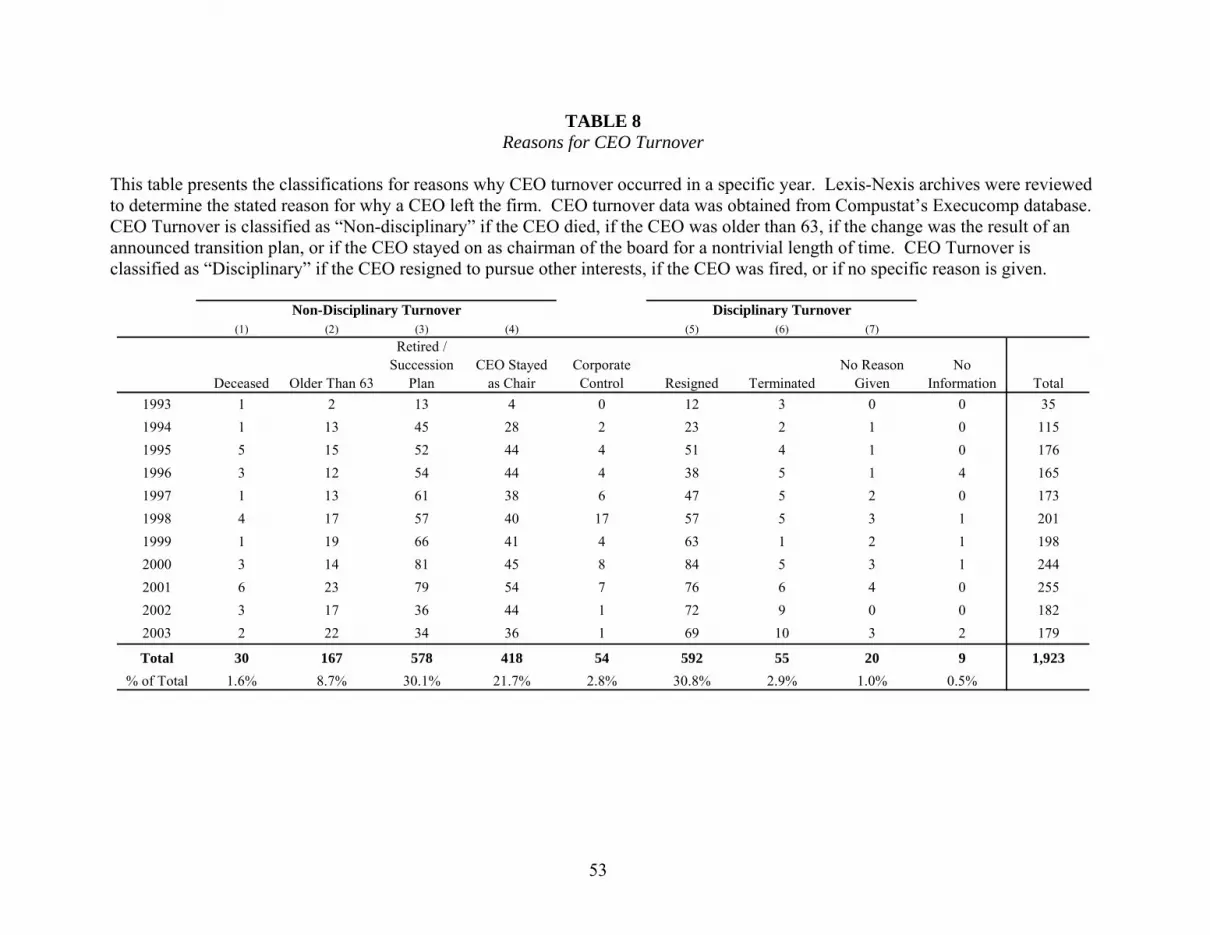
53
TABLE 8 Reasons for CEO Turnover
This table presents the classifications for reasons why CEO turnover occurred in a specific year. Lexis-Nexis archives were reviewed to determine the stated reason for why a CEO left the firm. CEO turnover data was obtained from Compustat’s Execucomp database. CEO Turnover is classified as “Non-disciplinary” if the CEO died, if the CEO was older than 63, if the change was the result of an announced transition plan, or if the CEO stayed on as chairman of the board for a nontrivial length of time. CEO Turnover is classified as “Disciplinary” if the CEO resigned to pursue other interests, if the CEO was fired, or if no specific reason is given.
(1) (2) (3) (4) (5) (6) (7)
Deceased Older Than 63
Retired / Succession
PlanCEO Stayed
as ChairCorporate Control Resigned Terminated
No Reason Given
No Information Total
1993 1 2 13 4 0 12 3 0 0 351994 1 13 45 28 2 23 2 1 0 1151995 5 15 52 44 4 51 4 1 0 1761996 3 12 54 44 4 38 5 1 4 1651997 1 13 61 38 6 47 5 2 0 1731998 4 17 57 40 17 57 5 3 1 2011999 1 19 66 41 4 63 1 2 1 1982000 3 14 81 45 8 84 5 3 1 2442001 6 23 79 54 7 76 6 4 0 2552002 3 17 36 44 1 72 9 0 0 1822003 2 22 34 36 1 69 10 3 2 179
Total 30 167 578 418 54 592 55 20 9 1,923% of Total 1.6% 8.7% 30.1% 21.7% 2.8% 30.8% 2.9% 1.0% 0.5%
Non-Disciplinary Turnover Disciplinary Turnover
54
TABLE 9 Multinomial Logit Models for CEO Turnover
This table presents the results from multinomial logistic regressions estimating the probability of CEO Turnover. The dependent variables are type of CEO turnover: 1 = Disciplinary turnover, 2 = Non-disciplinary turnover, 0 = no turnover. No turnover is the baseline category. Baseline results are presented in the first column; all other columns present results including Governance and (Performance x Governance) variables. In Panels A to D, performance is measured as the compound stock return for the two years prior to the year of observation. The governance variables are described in Table 1. The other control variables are also described in Table 1. Year dummy variables are included but are not shown. Panel A presents the results for disciplinary turnover for all available years; Panel B presents the results for non-disciplinary turnover for all available years. Panel A: Disciplinary Turnover
Baseline Performance GIM G-Index BCF E-Index
TCL Benchmark
Score BC GovScore
$ Value of Median
Director's Holdings
CEO-Chair Duality
(=1 if Dual)% of Directors Independent
-11.200 -9.424 -9.646 -4.917 -2.232 -2.753 -4.124 -3.673(0.00) (0.00) (0.00) (0.00) (0.25) (0.00) (0.00) (0.00)
-2.029 -0.404 -0.860 -4.390 -2.474 0.529 -1.526 0.234(0.00) (0.74) (0.18) (0.02) (0.57) (0.66) (0.00) (0.72)
1.079 1.506 1.514 0.961 1.353 1.051 1.058 1.101(0.00) (0.00) (0.00) (0.03) (0.21) (0.00) (0.00) (0.00)
- -0.009 0.023 0.019 -0.064 -0.031 -0.760 -0.414- (0.81) (0.77) (0.10) (0.21) (0.50) (0.00) (0.26)
- -0.220 -0.700 0.041 0.038 -0.208 -0.887 -3.559- (0.11) (0.01) (0.16) (0.84) (0.03) (0.07) (0.00)
-10.234 -6.135 -6.064 -7.636 -16.344 -9.316 -8.715 -10.924(0.00) (0.06) (0.07) (0.04) (0.20) (0.00) (0.00) (0.00)
-0.079 -0.069 -0.069 -0.086 -0.226 -0.084 -0.037 -0.088(0.04) (0.25) (0.25) (0.10) (0.06) (0.09) (0.41) (0.03)
0.011 0.018 0.019 0.032 0.051 0.015 0.012 0.011(0.28) (0.25) (0.23) (0.02) (0.08) (0.24) (0.27) (0.27)
-0.029 -0.049 -0.048 -0.046 -0.042 -0.027 -0.031 -0.030(0.02) (0.01) (0.01) (0.01) (0.27) (0.07) (0.02) (0.02)
Years Included 1993-2003 1993 , '95, '98, '00, '02
1993 , '95, '98, '00, '02
2001-2003 2002 1998-2002 1996-2003 1996-2003
Sample Size 8,965 3,329 3,329 3,488 788 4,766 6,871 7,278
Governance Variable
CEO Tenure
CEO Age
(Return, Last 2 years x Governance)CEO Own %
Intercept
Size (Assets)
Return, Last 2 years
Industry Return, Last 2 yearsGovernance
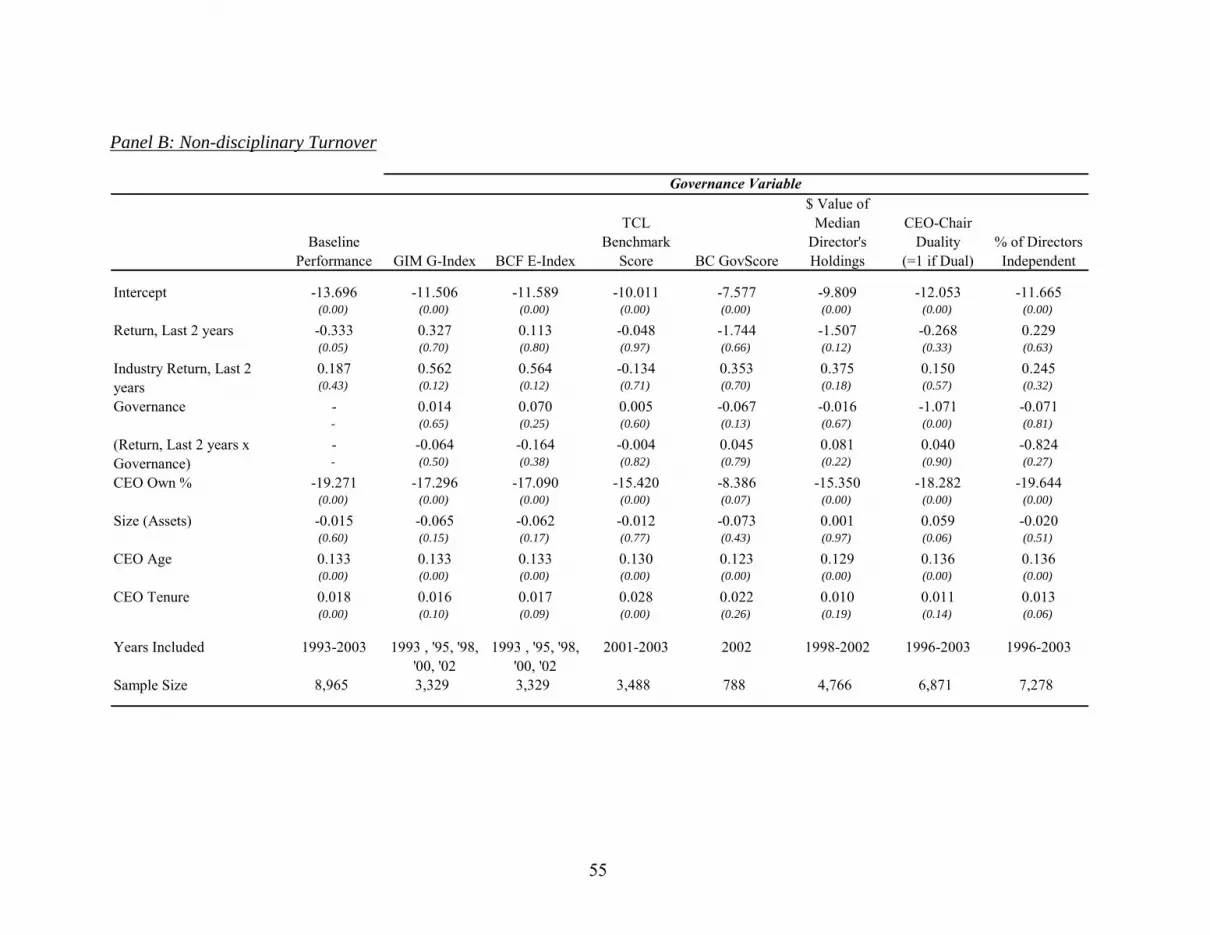
55
Panel B: Non-disciplinary Turnover
Baseline Performance GIM G-Index BCF E-Index
TCL Benchmark
Score BC GovScore
$ Value of Median
Director's Holdings
CEO-Chair Duality
(=1 if Dual)% of Directors Independent
-13.696 -11.506 -11.589 -10.011 -7.577 -9.809 -12.053 -11.665(0.00) (0.00) (0.00) (0.00) (0.00) (0.00) (0.00) (0.00)
-0.333 0.327 0.113 -0.048 -1.744 -1.507 -0.268 0.229(0.05) (0.70) (0.80) (0.97) (0.66) (0.12) (0.33) (0.63)
0.187 0.562 0.564 -0.134 0.353 0.375 0.150 0.245(0.43) (0.12) (0.12) (0.71) (0.70) (0.18) (0.57) (0.32)
- 0.014 0.070 0.005 -0.067 -0.016 -1.071 -0.071- (0.65) (0.25) (0.60) (0.13) (0.67) (0.00) (0.81)
- -0.064 -0.164 -0.004 0.045 0.081 0.040 -0.824- (0.50) (0.38) (0.82) (0.79) (0.22) (0.90) (0.27)
-19.271 -17.296 -17.090 -15.420 -8.386 -15.350 -18.282 -19.644(0.00) (0.00) (0.00) (0.00) (0.07) (0.00) (0.00) (0.00)
-0.015 -0.065 -0.062 -0.012 -0.073 0.001 0.059 -0.020(0.60) (0.15) (0.17) (0.77) (0.43) (0.97) (0.06) (0.51)
0.133 0.133 0.133 0.130 0.123 0.129 0.136 0.136(0.00) (0.00) (0.00) (0.00) (0.00) (0.00) (0.00) (0.00)
0.018 0.016 0.017 0.028 0.022 0.010 0.011 0.013(0.00) (0.10) (0.09) (0.00) (0.26) (0.19) (0.14) (0.06)
Years Included 1993-2003 1993 , '95, '98, '00, '02
1993 , '95, '98, '00, '02
2001-2003 2002 1998-2002 1996-2003 1996-2003
Sample Size 8,965 3,329 3,329 3,488 788 4,766 6,871 7,278
CEO Tenure
CEO Age
Governance
(Return, Last 2 years x Governance)CEO Own %
Intercept
Governance Variable
Size (Assets)
Return, Last 2 years
Industry Return, Last 2 years
56
Appendices A - E
Not intended for publication. Will be made available to the interested reader from the authors
and/or from the Journal website.
57
Appendix A.. Governance, stock returns and Tobin’s Q
Appendix Table A-1 is similar to Table 4, except that the appendix table considers stock
returns as the performance measure. As noted earlier, if investors anticipate the corporate
governance effect on performance, long-term stock returns will not be significantly correlated
with governance even if a significant correlation between performance and governance indeed
exists. (In Table 4, the performance measure was based on accounting data: return on assets.)
Appendix Table A-1, Panel A indicates there is no consistent or significant relation
between GIM’s measure of governance and contemporaneous, next year’s or the next two years’
stock returns. Appendix Table A-1, Panels B through G indicate there is no consistent or
significant relation between the other measures of governance considered in this study (BCF
index, TCL index, Brown and Caylor index, director stock ownership, CEO/Chair duality, and
board independence) and contemporaneous, next year’s or the next two years’ stock returns.
Appendix Table A-2 is similar to Table 4, except that this appendix table considers
Tobin’s Q as the performance measure. The results in Appendix Table A-2, Panels A through G
indicate there is no consistent or significant relation between the measures of governance
considered in this study (GIM index, BCF index, TCL index, Brown and Caylor index, director
stock ownership, CEO/Chair duality, and board independence) and contemporaneous, next year’s
or the next two years’ Tobin’s Q.
We note that the method for estimating the system of simultaneous equations does
matter. For example, in Appendix Table A-2, Panel A, the OLS estimates suggest a significant
relationship between the GIM index and Tobin’s Q, whereas the 2SLS estimates indicate no
significant relationship between the GIM index and Tobin’s Q. The Hausman test indicates that
the 2SLS estimates are better specified. Again, in Appendix Table A-2, Panel B, the OLS
estimates suggest a significant relationship between the BCF index and Tobin’s Q, whereas the
2SLS estimates indicate no significant relationship between the BCF index and Tobin’s Q. Once
again, the Hausman test indicates that the 2SLS estimates are better specified.
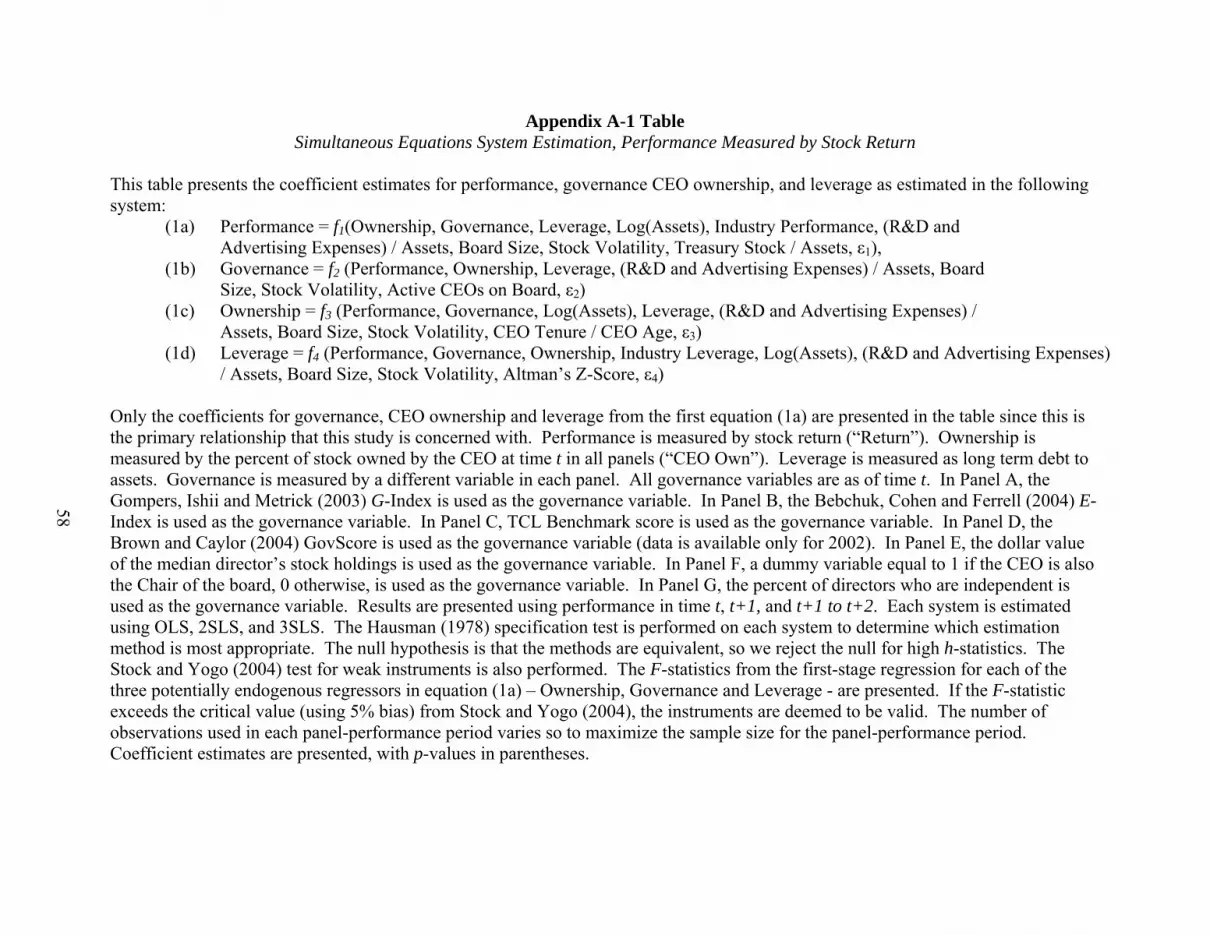
58
Appendix A-1 Table Simultaneous Equations System Estimation, Performance Measured by Stock Return
This table presents the coefficient estimates for performance, governance CEO ownership, and leverage as estimated in the following system: (1a) Performance = f1(Ownership, Governance, Leverage, Log(Assets), Industry Performance, (R&D and Advertising Expenses) / Assets, Board Size, Stock Volatility, Treasury Stock / Assets, ε1), (1b) Governance = f2 (Performance, Ownership, Leverage, (R&D and Advertising Expenses) / Assets, Board Size, Stock Volatility, Active CEOs on Board, ε2) (1c) Ownership = f3 (Performance, Governance, Log(Assets), Leverage, (R&D and Advertising Expenses) / Assets, Board Size, Stock Volatility, CEO Tenure / CEO Age, ε3) (1d) Leverage = f4 (Performance, Governance, Ownership, Industry Leverage, Log(Assets), (R&D and Advertising Expenses) / Assets, Board Size, Stock Volatility, Altman’s Z-Score, ε4) Only the coefficients for governance, CEO ownership and leverage from the first equation (1a) are presented in the table since this is the primary relationship that this study is concerned with. Performance is measured by stock return (“Return”). Ownership is measured by the percent of stock owned by the CEO at time t in all panels (“CEO Own”). Leverage is measured as long term debt to assets. Governance is measured by a different variable in each panel. All governance variables are as of time t. In Panel A, the Gompers, Ishii and Metrick (2003) G-Index is used as the governance variable. In Panel B, the Bebchuk, Cohen and Ferrell (2004) E-Index is used as the governance variable. In Panel C, TCL Benchmark score is used as the governance variable. In Panel D, the Brown and Caylor (2004) GovScore is used as the governance variable (data is available only for 2002). In Panel E, the dollar value of the median director’s stock holdings is used as the governance variable. In Panel F, a dummy variable equal to 1 if the CEO is also the Chair of the board, 0 otherwise, is used as the governance variable. In Panel G, the percent of directors who are independent is used as the governance variable. Results are presented using performance in time t, t+1, and t+1 to t+2. Each system is estimated using OLS, 2SLS, and 3SLS. The Hausman (1978) specification test is performed on each system to determine which estimation method is most appropriate. The null hypothesis is that the methods are equivalent, so we reject the null for high h-statistics. The Stock and Yogo (2004) test for weak instruments is also performed. The F-statistics from the first-stage regression for each of the three potentially endogenous regressors in equation (1a) – Ownership, Governance and Leverage - are presented. If the F-statistic exceeds the critical value (using 5% bias) from Stock and Yogo (2004), the instruments are deemed to be valid. The number of observations used in each panel-performance period varies so to maximize the sample size for the panel-performance period. Coefficient estimates are presented, with p-values in parentheses.
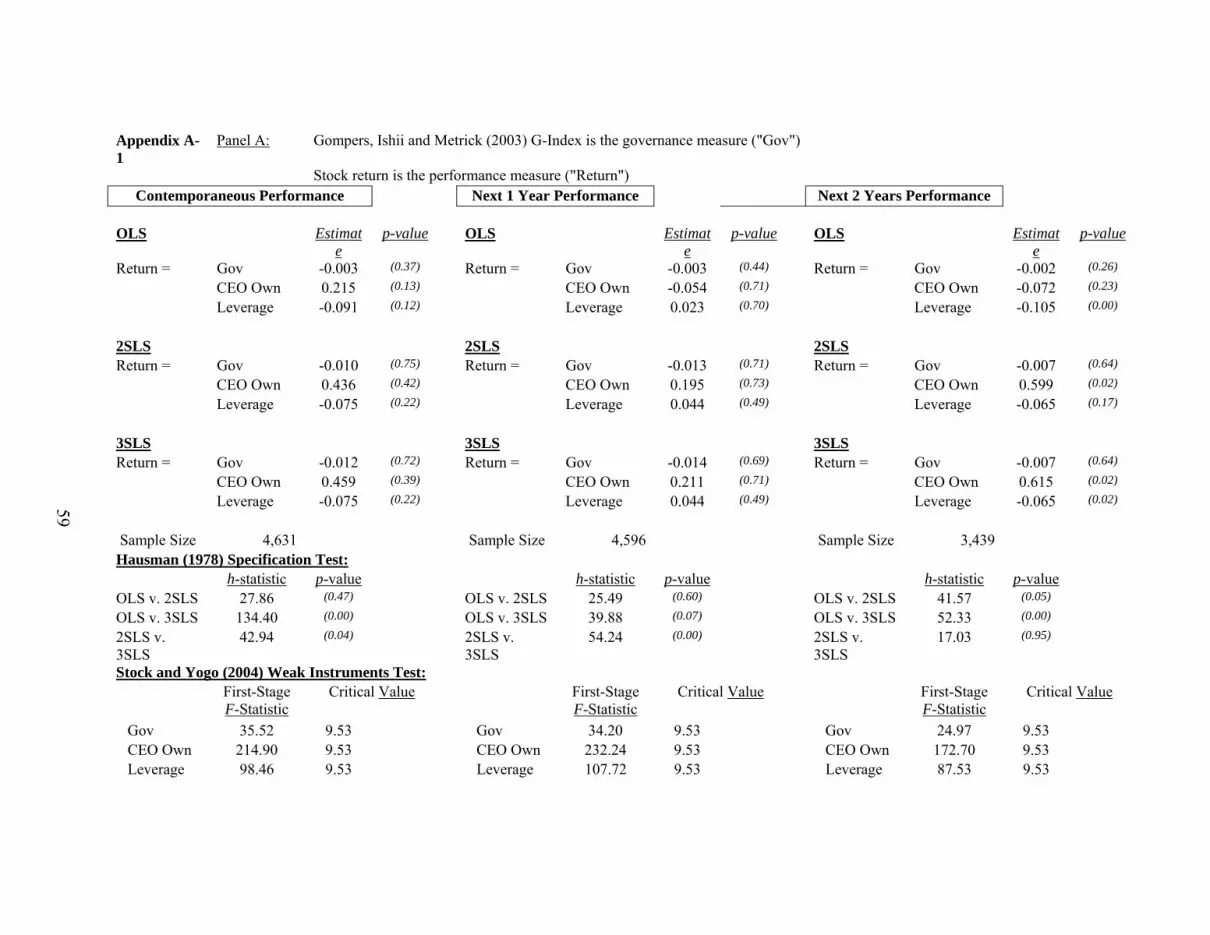
59
Appendix A-1
Panel A: Gompers, Ishii and Metrick (2003) G-Index is the governance measure ("Gov")
Stock return is the performance measure ("Return") Contemporaneous Performance Next 1 Year Performance Next 2 Years Performance
OLS Estimat
e p-value OLS Estimat
e p-value OLS Estimat
e p-value
Return = Gov -0.003 (0.37) Return = Gov -0.003 (0.44) Return = Gov -0.002 (0.26)
CEO Own 0.215 (0.13) CEO Own -0.054 (0.71) CEO Own -0.072 (0.23)
Leverage -0.091 (0.12) Leverage 0.023 (0.70) Leverage -0.105 (0.00)
2SLS 2SLS 2SLS
Return = Gov -0.010 (0.75) Return = Gov -0.013 (0.71) Return = Gov -0.007 (0.64)
CEO Own 0.436 (0.42) CEO Own 0.195 (0.73) CEO Own 0.599 (0.02)
Leverage -0.075 (0.22) Leverage 0.044 (0.49) Leverage -0.065 (0.17)
3SLS 3SLS 3SLS
Return = Gov -0.012 (0.72) Return = Gov -0.014 (0.69) Return = Gov -0.007 (0.64)
CEO Own 0.459 (0.39) CEO Own 0.211 (0.71) CEO Own 0.615 (0.02)
Leverage -0.075 (0.22) Leverage 0.044 (0.49) Leverage -0.065 (0.02)
Sample Size 4,631 Sample Size 4,596 Sample Size 3,439 Hausman (1978) Specification Test:
h-statistic p-value h-statistic p-value h-statistic p-value OLS v. 2SLS 27.86 (0.47) OLS v. 2SLS 25.49 (0.60) OLS v. 2SLS 41.57 (0.05) OLS v. 3SLS 134.40 (0.00) OLS v. 3SLS 39.88 (0.07) OLS v. 3SLS 52.33 (0.00) 2SLS v. 3SLS
42.94 (0.04) 2SLS v. 3SLS
54.24 (0.00) 2SLS v. 3SLS
17.03 (0.95)
Stock and Yogo (2004) Weak Instruments Test: First-Stage
F-Statistic Critical Value First-Stage
F-Statistic Critical Value First-Stage
F-Statistic Critical Value
Gov 35.52 9.53 Gov 34.20 9.53 Gov 24.97 9.53 CEO Own 214.90 9.53 CEO Own 232.24 9.53 CEO Own 172.70 9.53 Leverage 98.46 9.53 Leverage 107.72 9.53 Leverage 87.53 9.53

60
Appendix A-1
Panel B: Bebchuk, Cohen and Ferrel (2004) E-Index is is the governance measure ("Gov")
Stock return is the performance measure ("Return") Contemporaneous Performance Next 1 Year Performance Next 2 Years Performance
OLS Estimat
e p-value OLS Estimat
e p-value OLS Estimat
e p-value
Return = Gov -0.003 (0.66) Return = Gov 0.001 (0.89) Return = Gov -0.001 (0.70)
CEO Own 0.218 (0.12) CEO Own -0.038 (0.80) CEO Own -0.068 (0.25)
Leverage -0.091 (0.11) Leverage 0.020 (0.73) Leverage -0.106 (0.00)
2SLS 2SLS 2SLS
Return = Gov -0.044 (0.59) Return = Gov -0.021 (0.81) Return = Gov -0.001 (0.97)
CEO Own 0.210 (0.78) CEO Own 0.177 (0.83) CEO Own 0.674 (0.08)
Leverage -0.063 (0.35) Leverage 0.046 (0.52) Leverage -0.068 (0.02)
3SLS 3SLS 3SLS
Return = Gov -0.053 (0.52) Return = Gov -0.022 (0.81) Return = Gov 0.000 (0.99)
CEO Own 0.271 (0.72) CEO Own 0.183 (0.82) CEO Own 0.669 (0.08)
Leverage -0.062 (0.36) Leverage 0.046 (0.52) Leverage -0.069 (0.02)
Sample Size 4,631 Sample Size 4,596 Sample Size 3,439 Hausman (1978) Specification Test:
h-statistic p-value h-statistic p-value h-statistic p-value OLS v. 2SLS 29.51 (0.39) OLS v. 2SLS 26.03 (0.57) OLS v. 2SLS 42.78 (0.04) OLS v. 3SLS 425.20 (0.00) OLS v. 3SLS 395.40 (0.00) OLS v. 3SLS 99.97 (0.00) 2SLS v. 3SLS
174.00 (0.00) 2SLS v. 3SLS
245.80 (0.00) 2SLS v. 3SLS
-52.20 -
Stock and Yogo (2004) Weak Instruments Test: First-Stage
F-Statistic Critical Value First-Stage
F-Statistic Critical Value First-Stage
F-Statistic Critical Value
Gov 35.29 9.53 Gov 32.89 9.53 Gov 24.41 9.53 CEO Own 214.90 9.53 CEO Own 232.24 9.53 CEO Own 172.70 9.53 Leverage 98.46 9.53 Leverage 107.72 9.53 Leverage 87.53 9.53

61
Appendix A-1
Panel C: TCL Benchmark Score is the governance measure ("Gov")
Stock return is the performance measure ("Return") Contemporaneous Performance Next 1 Year Performance Next 2 Years Performance
OLS Estimat
e p-value OLS Estimat
e p-value OLS Estimat
e p-value
Return = Gov 0.001 (0.65) Return = Gov 0.002 (0.14) Return = Gov 0.001 (0.47)
CEO Own -0.062 (0.67) CEO Own 0.038 (0.81) CEO Own -0.043 (0.67)
Leverage 0.075 (0.18) Leverage 0.174 (0.01) Leverage -0.098 (0.01)
2SLS 2SLS 2SLS
Return = Gov -0.018 (0.12) Return = Gov 0.000 (0.97) Return = Gov 0.003 (0.64)
CEO Own -1.308 (0.12) CEO Own -0.948 (0.30) CEO Own 0.564 (0.28)
Leverage 0.075 (0.22) Leverage 0.152 (0.03) Leverage -0.081 (0.05)
3SLS 3SLS 3SLS
Return = Gov -0.020 (0.09) Return = Gov 0.000 (0.97) Return = Gov 0.003 (0.66)
CEO Own -1.326 (0.12) CEO Own -0.951 (0.30) CEO Own 0.580 (0.26)
Leverage 0.070 (0.26) Leverage 0.152 (0.03) Leverage -0.081 (0.04)
Sample Size 2,218 Sample Size 2,159 Sample Size 984 Hausman (1978) Specification Test:
h-statistic p-value h-statistic p-value h-statistic p-value OLS v. 2SLS 56.71 (0.00) OLS v. 2SLS 51.10 (0.00) OLS v. 2SLS 17.39 (0.94) OLS v. 3SLS -2.36 - OLS v. 3SLS 11.68 (1.00) OLS v. 3SLS -10.50 - 2SLS v. 3SLS
4.94 (1.00) 2SLS v. 3SLS
0.35 (1.00) 2SLS v. 3SLS
-15.30 -
Stock and Yogo (2004) Weak Instruments Test: First-Stage
F-Statistic Critical Value First-Stage
F-Statistic Critical Value First-Stage
F-Statistic Critical Value
Gov 25.56 9.53 Gov 20.23 9.53 Gov 13.79 9.53 CEO Own 102.33 9.53 CEO Own 100.62 9.53 CEO Own 50.53 9.53 Leverage 37.84 9.53 Leverage 48.49 9.53 Leverage 27.36 9.53
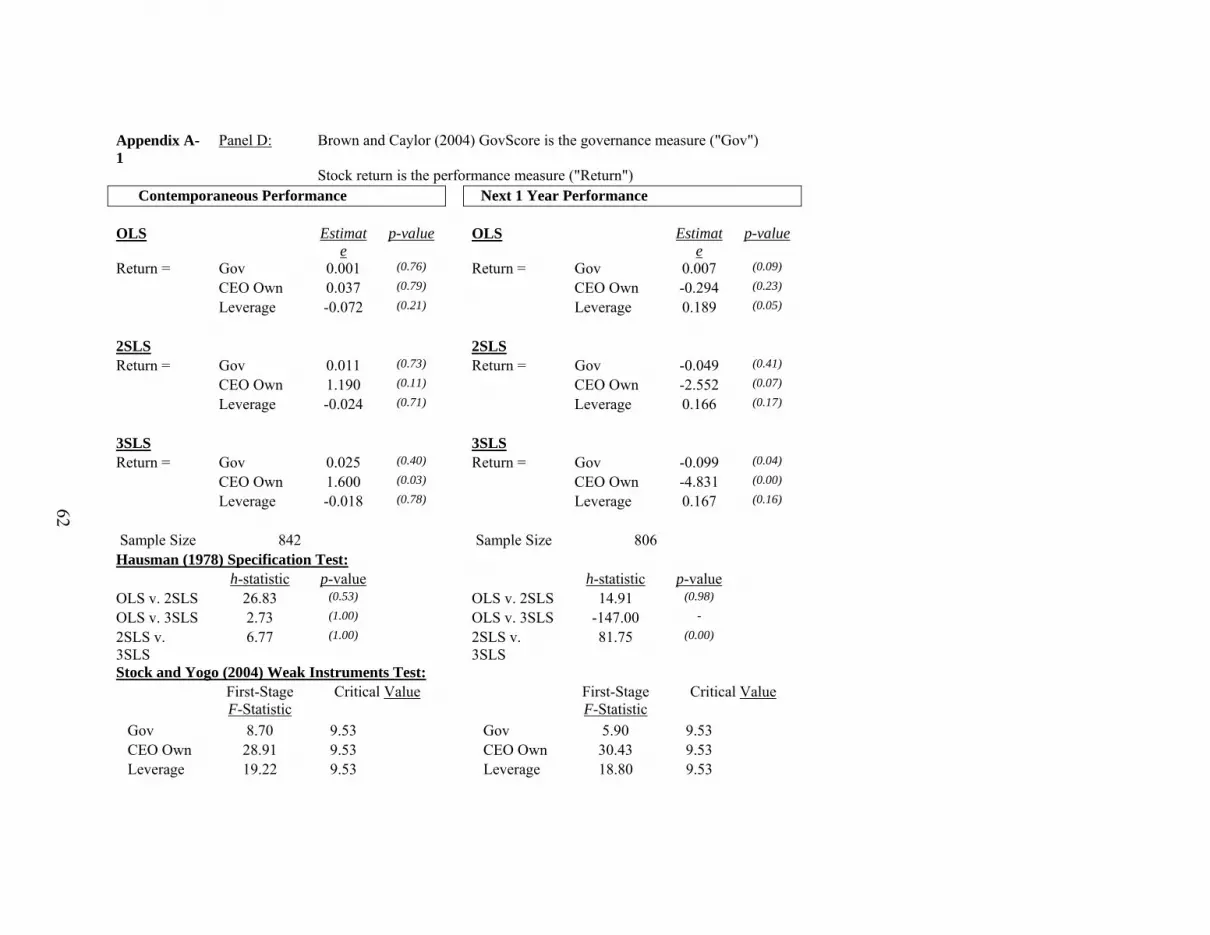
62
Appendix A-1
Panel D: Brown and Caylor (2004) GovScore is the governance measure ("Gov")
Stock return is the performance measure ("Return") Contemporaneous Performance Next 1 Year Performance
OLS Estimat
e p-value OLS Estimat
e p-value
Return = Gov 0.001 (0.76) Return = Gov 0.007 (0.09)
CEO Own 0.037 (0.79) CEO Own -0.294 (0.23)
Leverage -0.072 (0.21) Leverage 0.189 (0.05)
2SLS 2SLS
Return = Gov 0.011 (0.73) Return = Gov -0.049 (0.41)
CEO Own 1.190 (0.11) CEO Own -2.552 (0.07)
Leverage -0.024 (0.71) Leverage 0.166 (0.17)
3SLS 3SLS
Return = Gov 0.025 (0.40) Return = Gov -0.099 (0.04)
CEO Own 1.600 (0.03) CEO Own -4.831 (0.00)
Leverage -0.018 (0.78) Leverage 0.167 (0.16)
Sample Size 842 Sample Size 806 Hausman (1978) Specification Test:
h-statistic p-value h-statistic p-value OLS v. 2SLS 26.83 (0.53) OLS v. 2SLS 14.91 (0.98) OLS v. 3SLS 2.73 (1.00) OLS v. 3SLS -147.00 - 2SLS v. 3SLS
6.77 (1.00) 2SLS v. 3SLS
81.75 (0.00)
Stock and Yogo (2004) Weak Instruments Test: First-Stage
F-Statistic Critical Value First-Stage
F-Statistic Critical Value
Gov 8.70 9.53 Gov 5.90 9.53 CEO Own 28.91 9.53 CEO Own 30.43 9.53 Leverage 19.22 9.53 Leverage 18.80 9.53
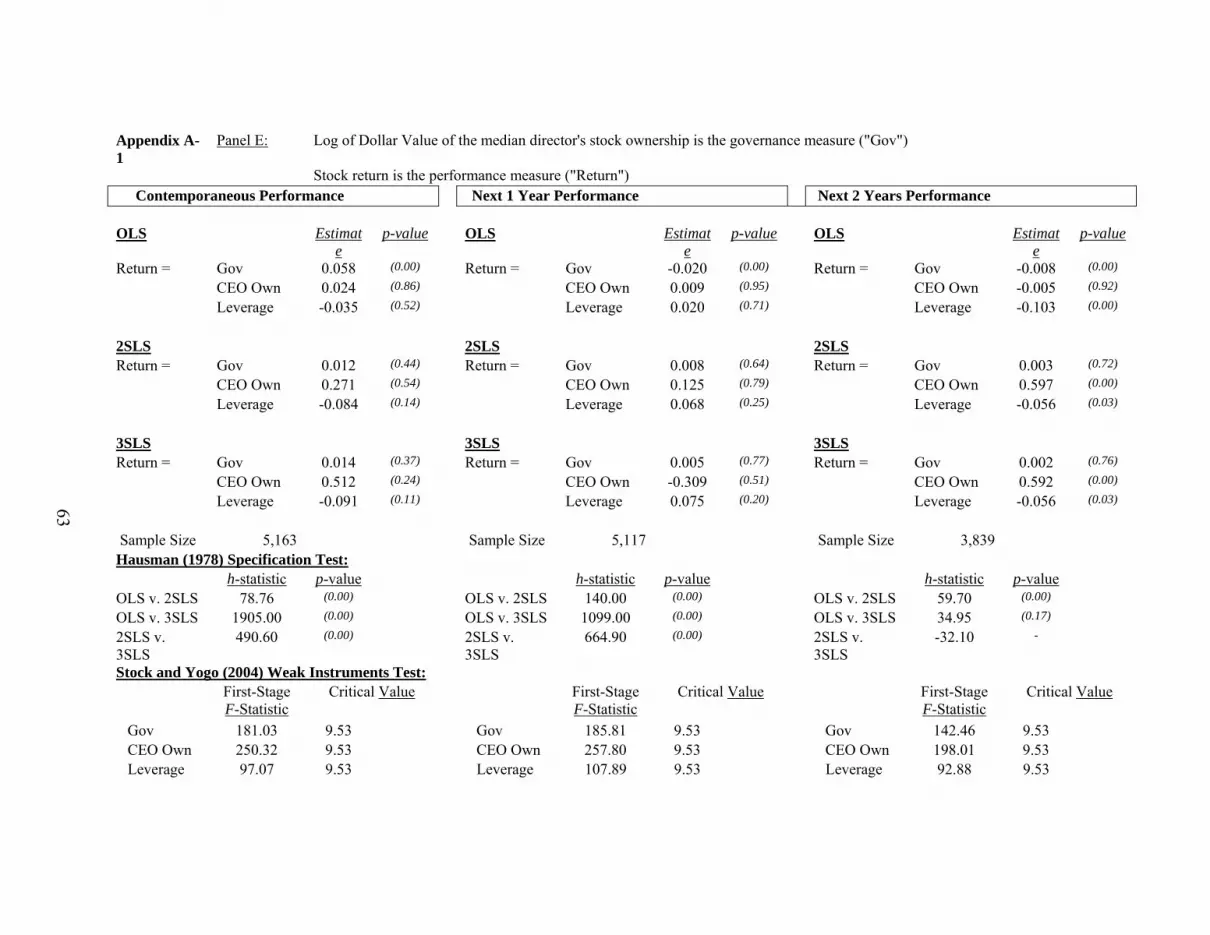
63
Appendix A-1
Panel E: Log of Dollar Value of the median director's stock ownership is the governance measure ("Gov")
Stock return is the performance measure ("Return") Contemporaneous Performance Next 1 Year Performance Next 2 Years Performance
OLS Estimat
e p-value OLS Estimat
e p-value OLS Estimat
e p-value
Return = Gov 0.058 (0.00) Return = Gov -0.020 (0.00) Return = Gov -0.008 (0.00)
CEO Own 0.024 (0.86) CEO Own 0.009 (0.95) CEO Own -0.005 (0.92)
Leverage -0.035 (0.52) Leverage 0.020 (0.71) Leverage -0.103 (0.00)
2SLS 2SLS 2SLS
Return = Gov 0.012 (0.44) Return = Gov 0.008 (0.64) Return = Gov 0.003 (0.72)
CEO Own 0.271 (0.54) CEO Own 0.125 (0.79) CEO Own 0.597 (0.00)
Leverage -0.084 (0.14) Leverage 0.068 (0.25) Leverage -0.056 (0.03)
3SLS 3SLS 3SLS
Return = Gov 0.014 (0.37) Return = Gov 0.005 (0.77) Return = Gov 0.002 (0.76)
CEO Own 0.512 (0.24) CEO Own -0.309 (0.51) CEO Own 0.592 (0.00)
Leverage -0.091 (0.11) Leverage 0.075 (0.20) Leverage -0.056 (0.03)
Sample Size 5,163 Sample Size 5,117 Sample Size 3,839 Hausman (1978) Specification Test:
h-statistic p-value h-statistic p-value h-statistic p-value OLS v. 2SLS 78.76 (0.00) OLS v. 2SLS 140.00 (0.00) OLS v. 2SLS 59.70 (0.00) OLS v. 3SLS 1905.00 (0.00) OLS v. 3SLS 1099.00 (0.00) OLS v. 3SLS 34.95 (0.17) 2SLS v. 3SLS
490.60 (0.00) 2SLS v. 3SLS
664.90 (0.00) 2SLS v. 3SLS
-32.10 -
Stock and Yogo (2004) Weak Instruments Test: First-Stage
F-Statistic Critical Value First-Stage
F-Statistic Critical Value First-Stage
F-Statistic Critical Value
Gov 181.03 9.53 Gov 185.81 9.53 Gov 142.46 9.53 CEO Own 250.32 9.53 CEO Own 257.80 9.53 CEO Own 198.01 9.53 Leverage 97.07 9.53 Leverage 107.89 9.53 Leverage 92.88 9.53
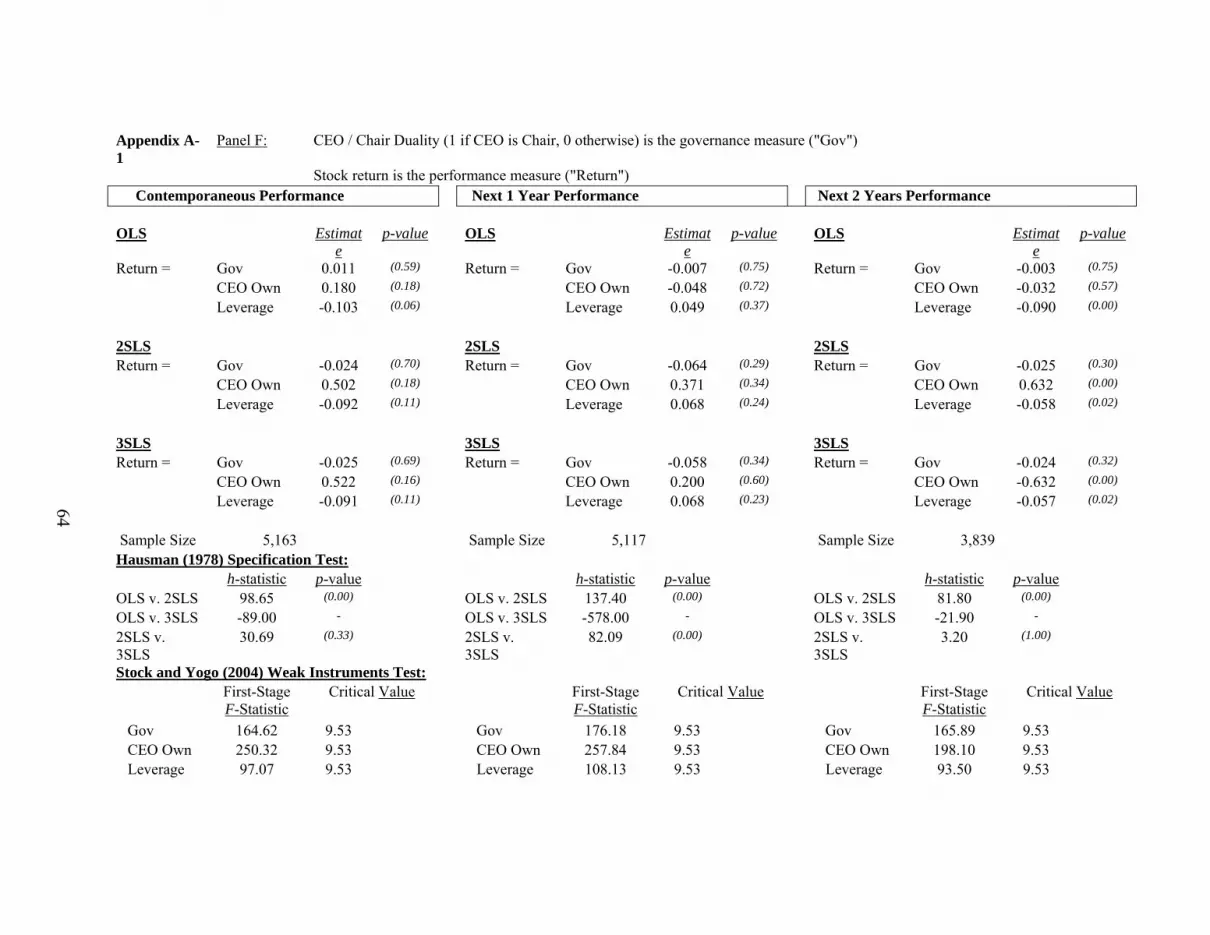
64
Appendix A-1
Panel F: CEO / Chair Duality (1 if CEO is Chair, 0 otherwise) is the governance measure ("Gov")
Stock return is the performance measure ("Return") Contemporaneous Performance Next 1 Year Performance Next 2 Years Performance
OLS Estimat
e p-value OLS Estimat
e p-value OLS Estimat
e p-value
Return = Gov 0.011 (0.59) Return = Gov -0.007 (0.75) Return = Gov -0.003 (0.75)
CEO Own 0.180 (0.18) CEO Own -0.048 (0.72) CEO Own -0.032 (0.57)
Leverage -0.103 (0.06) Leverage 0.049 (0.37) Leverage -0.090 (0.00)
2SLS 2SLS 2SLS
Return = Gov -0.024 (0.70) Return = Gov -0.064 (0.29) Return = Gov -0.025 (0.30)
CEO Own 0.502 (0.18) CEO Own 0.371 (0.34) CEO Own 0.632 (0.00)
Leverage -0.092 (0.11) Leverage 0.068 (0.24) Leverage -0.058 (0.02)
3SLS 3SLS 3SLS
Return = Gov -0.025 (0.69) Return = Gov -0.058 (0.34) Return = Gov -0.024 (0.32)
CEO Own 0.522 (0.16) CEO Own 0.200 (0.60) CEO Own -0.632 (0.00)
Leverage -0.091 (0.11) Leverage 0.068 (0.23) Leverage -0.057 (0.02)
Sample Size 5,163 Sample Size 5,117 Sample Size 3,839 Hausman (1978) Specification Test:
h-statistic p-value h-statistic p-value h-statistic p-value OLS v. 2SLS 98.65 (0.00) OLS v. 2SLS 137.40 (0.00) OLS v. 2SLS 81.80 (0.00) OLS v. 3SLS -89.00 - OLS v. 3SLS -578.00 - OLS v. 3SLS -21.90 - 2SLS v. 3SLS
30.69 (0.33) 2SLS v. 3SLS
82.09 (0.00) 2SLS v. 3SLS
3.20 (1.00)
Stock and Yogo (2004) Weak Instruments Test: First-Stage
F-Statistic Critical Value First-Stage
F-Statistic Critical Value First-Stage
F-Statistic Critical Value
Gov 164.62 9.53 Gov 176.18 9.53 Gov 165.89 9.53 CEO Own 250.32 9.53 CEO Own 257.84 9.53 CEO Own 198.10 9.53 Leverage 97.07 9.53 Leverage 108.13 9.53 Leverage 93.50 9.53

65
Appendix A-1
Panel G: Percentage of directors who are independent is the governance measure ("Gov")
Stock return is the performance measure ("Return") Contemporaneous Performance Next 1 Year Performance Next 2 Years Performance
OLS Estimat
e p-value OLS Estimat
e p-value OLS Estimat
e p-value
Return = Gov -0.036 (0.44) Return = Gov -0.038 (0.42) Return = Gov -0.038 (0.04)
CEO Own 0.162 (0.23) CEO Own -0.076 (0.57) CEO Own -0.062 (0.28)
Leverage -0.104 (0.06) Leverage 0.048 (0.38) Leverage -0.091 (0.00)
2SLS 2SLS 2SLS
Return = Gov -0.157 (0.53) Return = Gov -0.250 (0.33) Return = Gov -0.092 (0.40)
CEO Own 0.197 (0.73) CEO Own -0.172 (0.76) CEO Own 0.474 (0.07)
Leverage -0.105 (0.08) Leverage 0.047 (0.43) Leverage -0.063 (0.01)
3SLS 3SLS 3SLS
Return = Gov -0.154 (0.54) Return = Gov -0.249 (0.33) Return = Gov -0.092 (0.40)
CEO Own 0.179 (0.75) CEO Own -0.181 (0.75) CEO Own 0.474 (0.07)
Leverage -0.104 (0.08) Leverage 0.047 (0.43) Leverage -0.063 (0.01)
Sample Size 5,163 Sample Size 5,117 Sample Size 3,839 Hausman (1978) Specification Test:
h-statistic p-value h-statistic p-value h-statistic p-value OLS v. 2SLS 63.84 (0.00) OLS v. 2SLS 49.73 (0.01) OLS v. 2SLS 43.91 (0.03) OLS v. 3SLS 14.17 (0.99) OLS v. 3SLS -6.08 - OLS v. 3SLS -16.60 - 2SLS v. 3SLS
16.00 (0.97) 2SLS v. 3SLS
9.94 (1.00) 2SLS v. 3SLS
0.48 (1.00)
Stock and Yogo (2004) Weak Instruments Test: First-Stage
F-Statistic Critical Value First-Stage
F-Statistic Critical Value First-Stage
F-Statistic Critical Value
Gov 163.69 9.53 Gov 160.48 9.53 Gov 119.29 9.53 CEO Own 250.32 9.53 CEO Own 257.84 9.53 CEO Own 198.10 9.53 Leverage 97.07 9.53 Leverage 108.13 9.53 Leverage 93.50 9.53
66
Appendix A-2 Table Simultaneous Equations System Estimation, Performance Measured by Tobin’s Q
This table presents the coefficient estimates for performance, governance CEO ownership, and leverage as estimated in the following system: (1a) Performance = f1(Ownership, Governance, Leverage, Log(Assets), Industry Performance, (R&D and Advertising Expenses) / Assets, Board Size, Stock Volatility, Treasury Stock / Assets, ε1), (1b) Governance = f2 (Performance, Ownership, Leverage, (R&D and Advertising Expenses) / Assets, Board Size, Stock Volatility, Active CEOs on Board, ε2) (1c) Ownership = f3 (Performance, Governance, Log(Assets), Leverage, (R&D and Advertising Expenses) / Assets, Board Size, Stock Volatility, CEO Tenure / CEO Age, ε3) (1d) Leverage = f4 (Performance, Governance, Ownership, Industry Leverage, Log(Assets), (R&D and Advertising Expenses) / Assets, Board Size, Stock Volatility, Altman’s Z-Score, ε4) Only the coefficients for governance, CEO ownership and leverage from the first equation (1a) are presented in the table since this is the primary relationship that this study is concerned with. Performance is measured by Tobin’s Q (“Q”). Ownership is measured by the percent of stock owned by the CEO at time t in all panels (“CEO Own”). Leverage is measured as long term debt to assets. Governance is measured by a different variable in each panel. All governance variables are as of time t. In Panel A, the Gompers, Ishii and Metrick (2003) G-Index is used as the governance variable. In Panel B, the Bebchuk, Cohen and Ferrell (2004) E-Index is used as the governance variable. In Panel C, TCL Benchmark score is used as the governance variable. In Panel D, the Brown and Caylor (2004) GovScore is used as the governance variable (data is available only for 2002). In Panel E, the dollar value of the median director’s stock holdings is used as the governance variable. In Panel F, a dummy variable equal to 1 if the CEO is also the Chair of the board, 0 otherwise, is used as the governance variable. In Panel G, the percent of directors who are independent is used as the governance variable. Results are presented using performance in time t, t+1, and t+1 to t+2. Each system is estimated using OLS, 2SLS, and 3SLS. The Hausman (1978) specification test is performed on each system to determine which estimation method is most appropriate. The null hypothesis is that the methods are equivalent, so we reject the null for high h-statistics. The Stock and Yogo (2004) test for weak instruments is also performed. The F-statistics from the first-stage regression for each of the three potentially endogenous regressors in equation (1a) – Ownership, Governance and Leverage - are presented. If the F-statistic exceeds the critical value (using 5% bias) from Stock and Yogo (2004), the instruments are deemed to be valid. The number of observations used in each panel-performance period varies so to maximize the sample size for the panel-performance period. Coefficient estimates are presented, with p-values in parentheses.
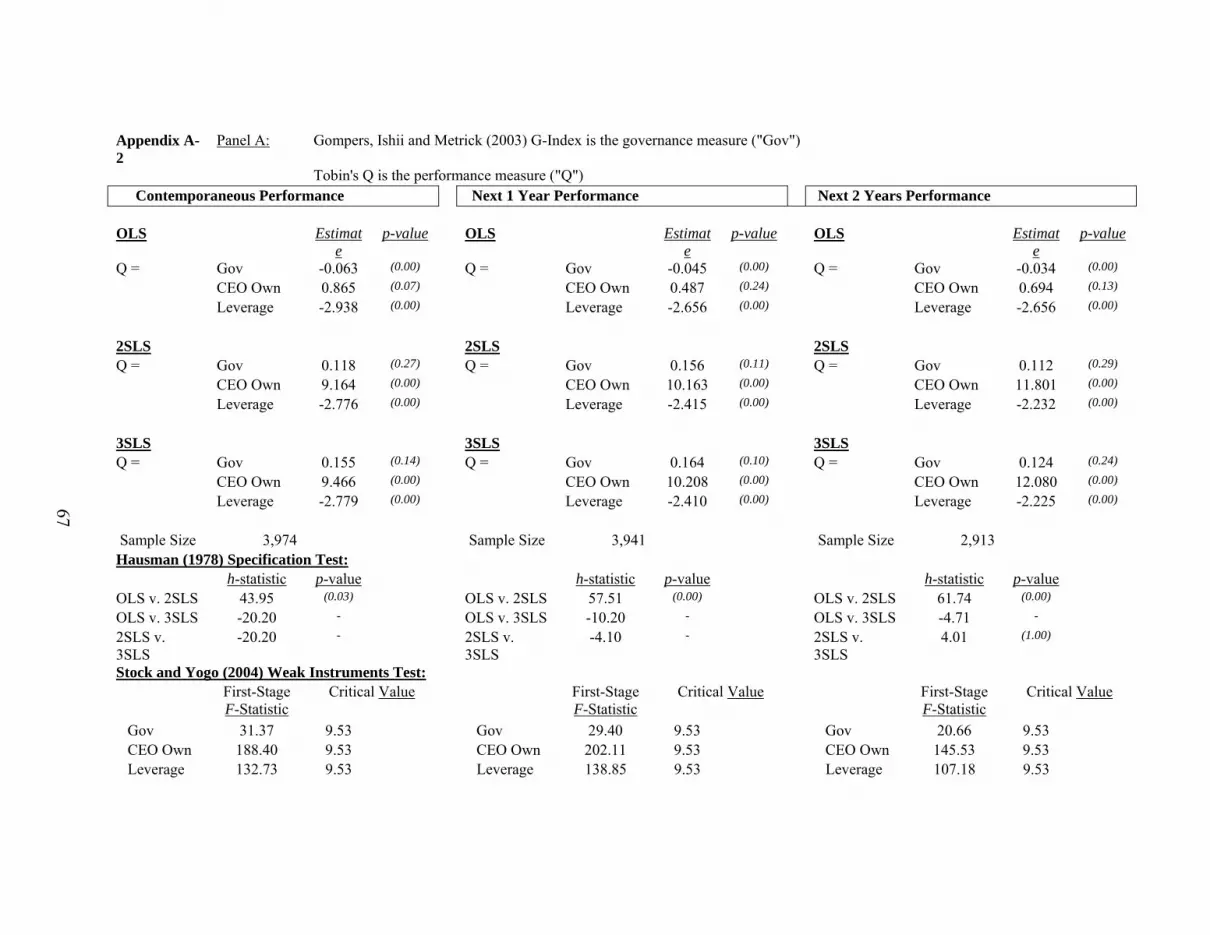
67
Appendix A-2
Panel A: Gompers, Ishii and Metrick (2003) G-Index is the governance measure ("Gov")
Tobin's Q is the performance measure ("Q") Contemporaneous Performance Next 1 Year Performance Next 2 Years Performance
OLS Estimat
e p-value OLS Estimat
e p-value OLS Estimat
e p-value
Q = Gov -0.063 (0.00) Q = Gov -0.045 (0.00) Q = Gov -0.034 (0.00)
CEO Own 0.865 (0.07) CEO Own 0.487 (0.24) CEO Own 0.694 (0.13)
Leverage -2.938 (0.00) Leverage -2.656 (0.00) Leverage -2.656 (0.00)
2SLS 2SLS 2SLS
Q = Gov 0.118 (0.27) Q = Gov 0.156 (0.11) Q = Gov 0.112 (0.29)
CEO Own 9.164 (0.00) CEO Own 10.163 (0.00) CEO Own 11.801 (0.00)
Leverage -2.776 (0.00) Leverage -2.415 (0.00) Leverage -2.232 (0.00)
3SLS 3SLS 3SLS
Q = Gov 0.155 (0.14) Q = Gov 0.164 (0.10) Q = Gov 0.124 (0.24)
CEO Own 9.466 (0.00) CEO Own 10.208 (0.00) CEO Own 12.080 (0.00)
Leverage -2.779 (0.00) Leverage -2.410 (0.00) Leverage -2.225 (0.00)
Sample Size 3,974 Sample Size 3,941 Sample Size 2,913 Hausman (1978) Specification Test:
h-statistic p-value h-statistic p-value h-statistic p-value OLS v. 2SLS 43.95 (0.03) OLS v. 2SLS 57.51 (0.00) OLS v. 2SLS 61.74 (0.00) OLS v. 3SLS -20.20 - OLS v. 3SLS -10.20 - OLS v. 3SLS -4.71 - 2SLS v. 3SLS
-20.20 - 2SLS v. 3SLS
-4.10 - 2SLS v. 3SLS
4.01 (1.00)
Stock and Yogo (2004) Weak Instruments Test: First-Stage
F-Statistic Critical Value First-Stage
F-Statistic Critical Value First-Stage
F-Statistic Critical Value
Gov 31.37 9.53 Gov 29.40 9.53 Gov 20.66 9.53 CEO Own 188.40 9.53 CEO Own 202.11 9.53 CEO Own 145.53 9.53 Leverage 132.73 9.53 Leverage 138.85 9.53 Leverage 107.18 9.53
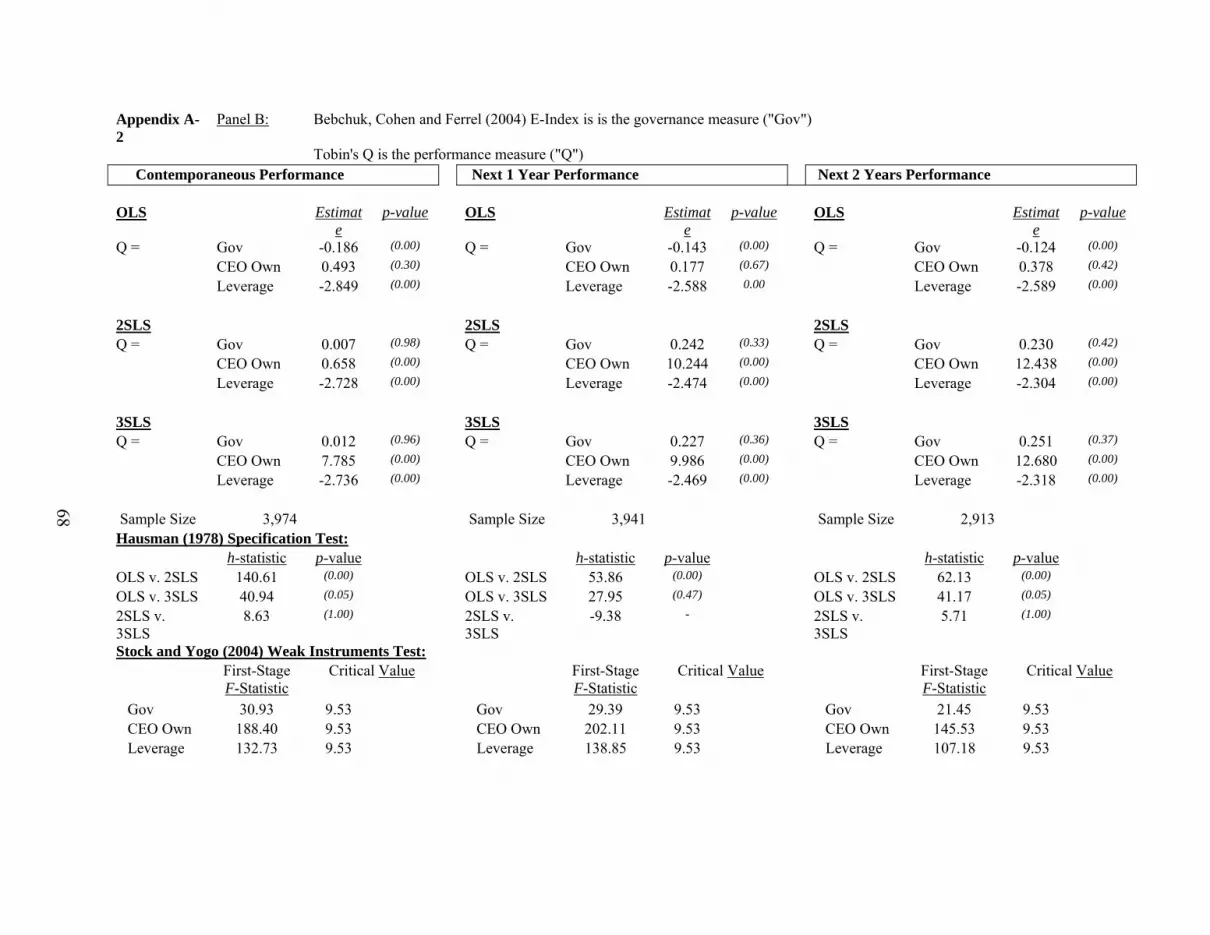
68
Appendix A-2
Panel B: Bebchuk, Cohen and Ferrel (2004) E-Index is is the governance measure ("Gov")
Tobin's Q is the performance measure ("Q") Contemporaneous Performance Next 1 Year Performance Next 2 Years Performance
OLS Estimat
e p-value OLS Estimat
e p-value OLS Estimat
e p-value
Q = Gov -0.186 (0.00) Q = Gov -0.143 (0.00) Q = Gov -0.124 (0.00)
CEO Own 0.493 (0.30) CEO Own 0.177 (0.67) CEO Own 0.378 (0.42)
Leverage -2.849 (0.00) Leverage -2.588 0.00 Leverage -2.589 (0.00)
2SLS 2SLS 2SLS
Q = Gov 0.007 (0.98) Q = Gov 0.242 (0.33) Q = Gov 0.230 (0.42)
CEO Own 0.658 (0.00) CEO Own 10.244 (0.00) CEO Own 12.438 (0.00)
Leverage -2.728 (0.00) Leverage -2.474 (0.00) Leverage -2.304 (0.00)
3SLS 3SLS 3SLS
Q = Gov 0.012 (0.96) Q = Gov 0.227 (0.36) Q = Gov 0.251 (0.37)
CEO Own 7.785 (0.00) CEO Own 9.986 (0.00) CEO Own 12.680 (0.00)
Leverage -2.736 (0.00) Leverage -2.469 (0.00) Leverage -2.318 (0.00)
Sample Size 3,974 Sample Size 3,941 Sample Size 2,913 Hausman (1978) Specification Test:
h-statistic p-value h-statistic p-value h-statistic p-value OLS v. 2SLS 140.61 (0.00) OLS v. 2SLS 53.86 (0.00) OLS v. 2SLS 62.13 (0.00) OLS v. 3SLS 40.94 (0.05) OLS v. 3SLS 27.95 (0.47) OLS v. 3SLS 41.17 (0.05) 2SLS v. 3SLS
8.63 (1.00) 2SLS v. 3SLS
-9.38 - 2SLS v. 3SLS
5.71 (1.00)
Stock and Yogo (2004) Weak Instruments Test: First-Stage
F-Statistic Critical Value First-Stage
F-Statistic Critical Value First-Stage
F-Statistic Critical Value
Gov 30.93 9.53 Gov 29.39 9.53 Gov 21.45 9.53 CEO Own 188.40 9.53 CEO Own 202.11 9.53 CEO Own 145.53 9.53 Leverage 132.73 9.53 Leverage 138.85 9.53 Leverage 107.18 9.53
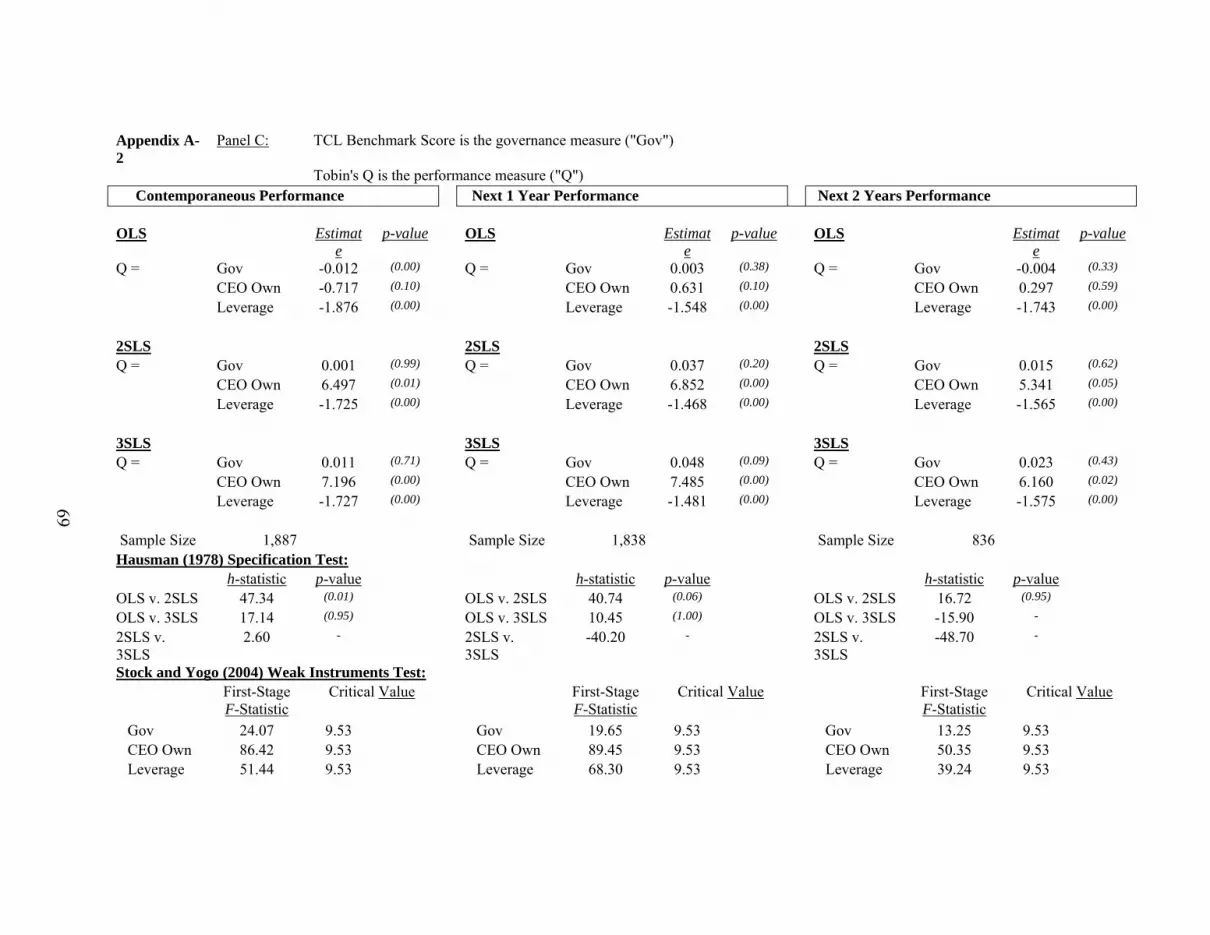
69
Appendix A-2
Panel C: TCL Benchmark Score is the governance measure ("Gov")
Tobin's Q is the performance measure ("Q") Contemporaneous Performance Next 1 Year Performance Next 2 Years Performance
OLS Estimat
e p-value OLS Estimat
e p-value OLS Estimat
e p-value
Q = Gov -0.012 (0.00) Q = Gov 0.003 (0.38) Q = Gov -0.004 (0.33)
CEO Own -0.717 (0.10) CEO Own 0.631 (0.10) CEO Own 0.297 (0.59)
Leverage -1.876 (0.00) Leverage -1.548 (0.00) Leverage -1.743 (0.00)
2SLS 2SLS 2SLS
Q = Gov 0.001 (0.99) Q = Gov 0.037 (0.20) Q = Gov 0.015 (0.62)
CEO Own 6.497 (0.01) CEO Own 6.852 (0.00) CEO Own 5.341 (0.05)
Leverage -1.725 (0.00) Leverage -1.468 (0.00) Leverage -1.565 (0.00)
3SLS 3SLS 3SLS
Q = Gov 0.011 (0.71) Q = Gov 0.048 (0.09) Q = Gov 0.023 (0.43)
CEO Own 7.196 (0.00) CEO Own 7.485 (0.00) CEO Own 6.160 (0.02)
Leverage -1.727 (0.00) Leverage -1.481 (0.00) Leverage -1.575 (0.00)
Sample Size 1,887 Sample Size 1,838 Sample Size 836 Hausman (1978) Specification Test:
h-statistic p-value h-statistic p-value h-statistic p-value OLS v. 2SLS 47.34 (0.01) OLS v. 2SLS 40.74 (0.06) OLS v. 2SLS 16.72 (0.95) OLS v. 3SLS 17.14 (0.95) OLS v. 3SLS 10.45 (1.00) OLS v. 3SLS -15.90 - 2SLS v. 3SLS
2.60 - 2SLS v. 3SLS
-40.20 - 2SLS v. 3SLS
-48.70 -
Stock and Yogo (2004) Weak Instruments Test: First-Stage
F-Statistic Critical Value First-Stage
F-Statistic Critical Value First-Stage
F-Statistic Critical Value
Gov 24.07 9.53 Gov 19.65 9.53 Gov 13.25 9.53 CEO Own 86.42 9.53 CEO Own 89.45 9.53 CEO Own 50.35 9.53 Leverage 51.44 9.53 Leverage 68.30 9.53 Leverage 39.24 9.53

70
Appendix A-2
Panel D: Brown and Caylor (2004) GovScore is the governance measure ("Gov")
Tobin's Q is the performance measure ("Q") Contemporaneous Performance Next 1 Year Performance
OLS Estimat
e p-value OLS Estimat
e p-value
Q = Gov -0.008 (0.37) Q = Gov -0.003 (0.76)
CEO Own 1.040 (0.02) CEO Own 0.541 (0.33)
Leverage -1.152 (0.00) Leverage -1.387 (0.00)
2SLS 2SLS
Q = Gov 0.085 (0.48) Q = Gov 0.034 (0.81)
CEO Own 7.368 (0.01) CEO Own 3.676 (0.29)
Leverage -0.870 (0.00) Leverage -1.310 (0.00)
3SLS 3SLS
Q = Gov 0.174 (0.11) Q = Gov 0.125 (0.35)
CEO Own 11.173 (0.00) CEO Own 6.785 (0.04)
Leverage -0.807 (0.00) Leverage -1.329 (0.00)
Sample Size 717 Sample Size 691 Hausman (1978) Specification Test:
h-statistic p-value h-statistic p-value OLS v. 2SLS 19.56 (0.88) OLS v. 2SLS 13.77 (0.99) OLS v. 3SLS -923.00 - OLS v. 3SLS -760.00 - 2SLS v. 3SLS
44.17 (0.03) 2SLS v. 3SLS
56.78 (0.00)
Stock and Yogo (2004) Weak Instruments Test: First-Stage
F-Statistic Critical Value First-Stage
F-Statistic Critical Value
Gov 8.41 9.53 Gov 6.13 9.53 CEO Own 22.34 9.53 CEO Own 27.42 9.53 Leverage 26.88 9.53 Leverage 29.40 9.53
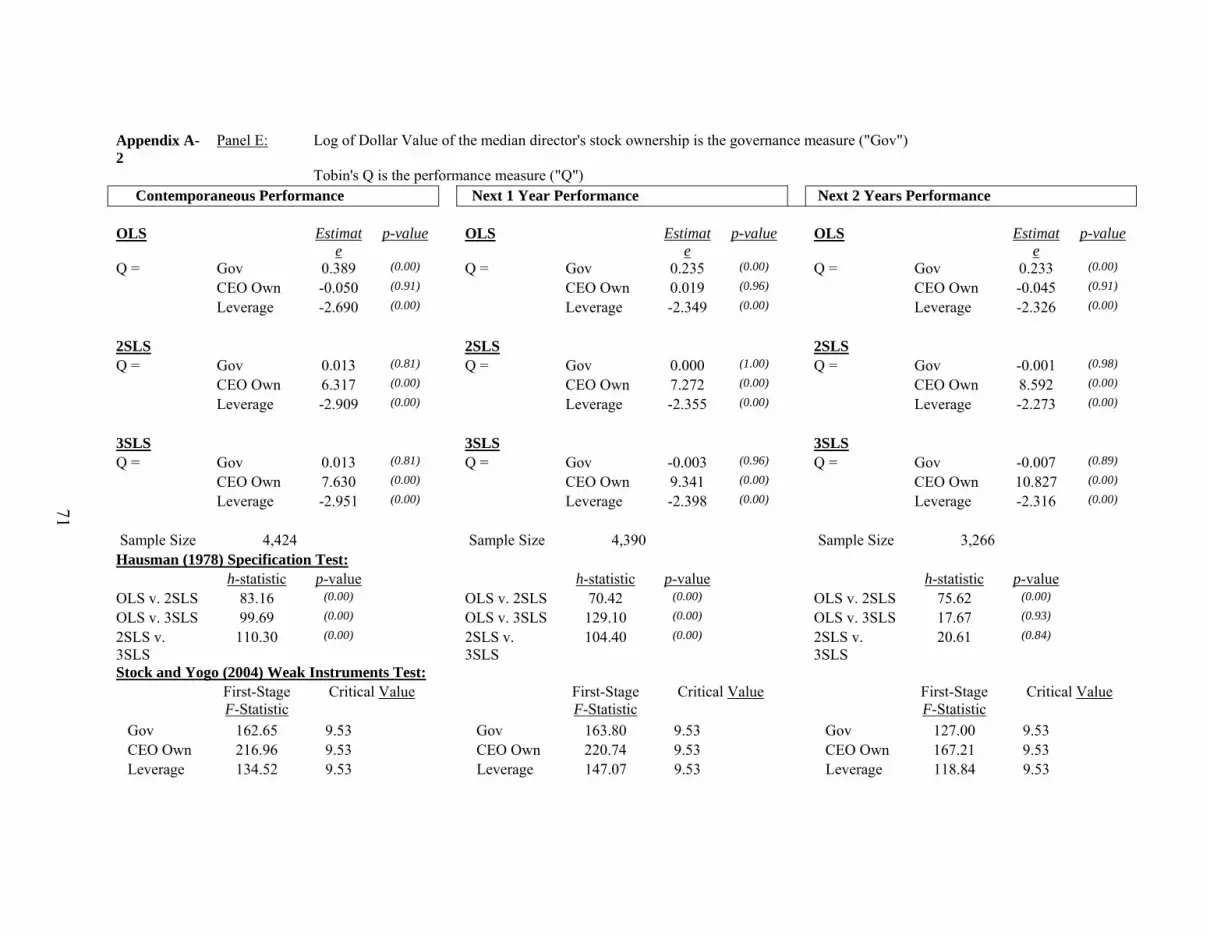
71
Appendix A-2
Panel E: Log of Dollar Value of the median director's stock ownership is the governance measure ("Gov")
Tobin's Q is the performance measure ("Q") Contemporaneous Performance Next 1 Year Performance Next 2 Years Performance
OLS Estimat
e p-value OLS Estimat
e p-value OLS Estimat
e p-value
Q = Gov 0.389 (0.00) Q = Gov 0.235 (0.00) Q = Gov 0.233 (0.00)
CEO Own -0.050 (0.91) CEO Own 0.019 (0.96) CEO Own -0.045 (0.91)
Leverage -2.690 (0.00) Leverage -2.349 (0.00) Leverage -2.326 (0.00)
2SLS 2SLS 2SLS
Q = Gov 0.013 (0.81) Q = Gov 0.000 (1.00) Q = Gov -0.001 (0.98)
CEO Own 6.317 (0.00) CEO Own 7.272 (0.00) CEO Own 8.592 (0.00)
Leverage -2.909 (0.00) Leverage -2.355 (0.00) Leverage -2.273 (0.00)
3SLS 3SLS 3SLS
Q = Gov 0.013 (0.81) Q = Gov -0.003 (0.96) Q = Gov -0.007 (0.89)
CEO Own 7.630 (0.00) CEO Own 9.341 (0.00) CEO Own 10.827 (0.00)
Leverage -2.951 (0.00) Leverage -2.398 (0.00) Leverage -2.316 (0.00)
Sample Size 4,424 Sample Size 4,390 Sample Size 3,266 Hausman (1978) Specification Test:
h-statistic p-value h-statistic p-value h-statistic p-value OLS v. 2SLS 83.16 (0.00) OLS v. 2SLS 70.42 (0.00) OLS v. 2SLS 75.62 (0.00) OLS v. 3SLS 99.69 (0.00) OLS v. 3SLS 129.10 (0.00) OLS v. 3SLS 17.67 (0.93) 2SLS v. 3SLS
110.30 (0.00) 2SLS v. 3SLS
104.40 (0.00) 2SLS v. 3SLS
20.61 (0.84)
Stock and Yogo (2004) Weak Instruments Test: First-Stage
F-Statistic Critical Value First-Stage
F-Statistic Critical Value First-Stage
F-Statistic Critical Value
Gov 162.65 9.53 Gov 163.80 9.53 Gov 127.00 9.53 CEO Own 216.96 9.53 CEO Own 220.74 9.53 CEO Own 167.21 9.53 Leverage 134.52 9.53 Leverage 147.07 9.53 Leverage 118.84 9.53

72
Appendix A-2
Panel F: CEO / Chair Duality (1 if CEO is Chair, 0 otherwise) is the governance measure ("Gov")
Tobin's Q is the performance measure ("Q") Contemporaneous Performance Next 1 Year Performance Next 2 Years Performance
OLS Estimat
e p-value OLS Estimat
e p-value OLS Estimat
e p-value
Q = Gov 0.141 (0.05) Q = Gov -0.005 (0.94) Q = Gov -0.006 (0.93)
CEO Own 1.173 (0.01) CEO Own 0.852 (0.03) CEO Own 0.958 (0.02)
Leverage -3.114 (0.00) Leverage -2.632 (0.00) Leverage -2.648 (0.00)
2SLS 2SLS 2SLS
Q = Gov 0.324 (0.14) Q = Gov 0.209 (0.23) Q = Gov 0.051 (0.77)
CEO Own 6.096 (0.00) CEO Own 6.889 (0.00) CEO Own 8.590 (0.00)
Leverage -2.924 (0.00) Leverage -2.373 (0.00) Leverage -2.272 (0.00)
3SLS 3SLS 3SLS
Q = Gov 0.296 (0.18) Q = Gov 0.189 (0.28) Q = Gov 0.056 (0.75)
CEO Own 7.970 (0.00) CEO Own 8.398 (0.00) CEO Own 9.279 (0.00)
Leverage -2.944 (0.00) Leverage -2.372 (0.00) Leverage -2.254 (0.00)
Sample Size 4,424 Sample Size 4,390 Sample Size 3,266 Hausman (1978) Specification Test:
h-statistic p-value h-statistic p-value h-statistic p-value OLS v. 2SLS 97.24 (0.00) OLS v. 2SLS 148.50 (0.00) OLS v. 2SLS 95.71 (0.00) OLS v. 3SLS 154.60 (0.00) OLS v. 3SLS 604.10 (0.00) OLS v. 3SLS -62.20 - 2SLS v. 3SLS
-27.10 - 2SLS v. 3SLS
1.36 (1.00) 2SLS v. 3SLS
-0.90 -
Stock and Yogo (2004) Weak Instruments Test: First-Stage
F-Statistic Critical Value First-Stage
F-Statistic Critical Value First-Stage
F-Statistic Critical Value
Gov 142.00 9.53 Gov 153.66 9.53 Gov 143.83 9.53 CEO Own 216.96 9.53 CEO Own 220.78 9.53 CEO Own 167.25 9.53 Leverage 134.52 9.53 Leverage 147.41 9.53 Leverage 119.32 9.53
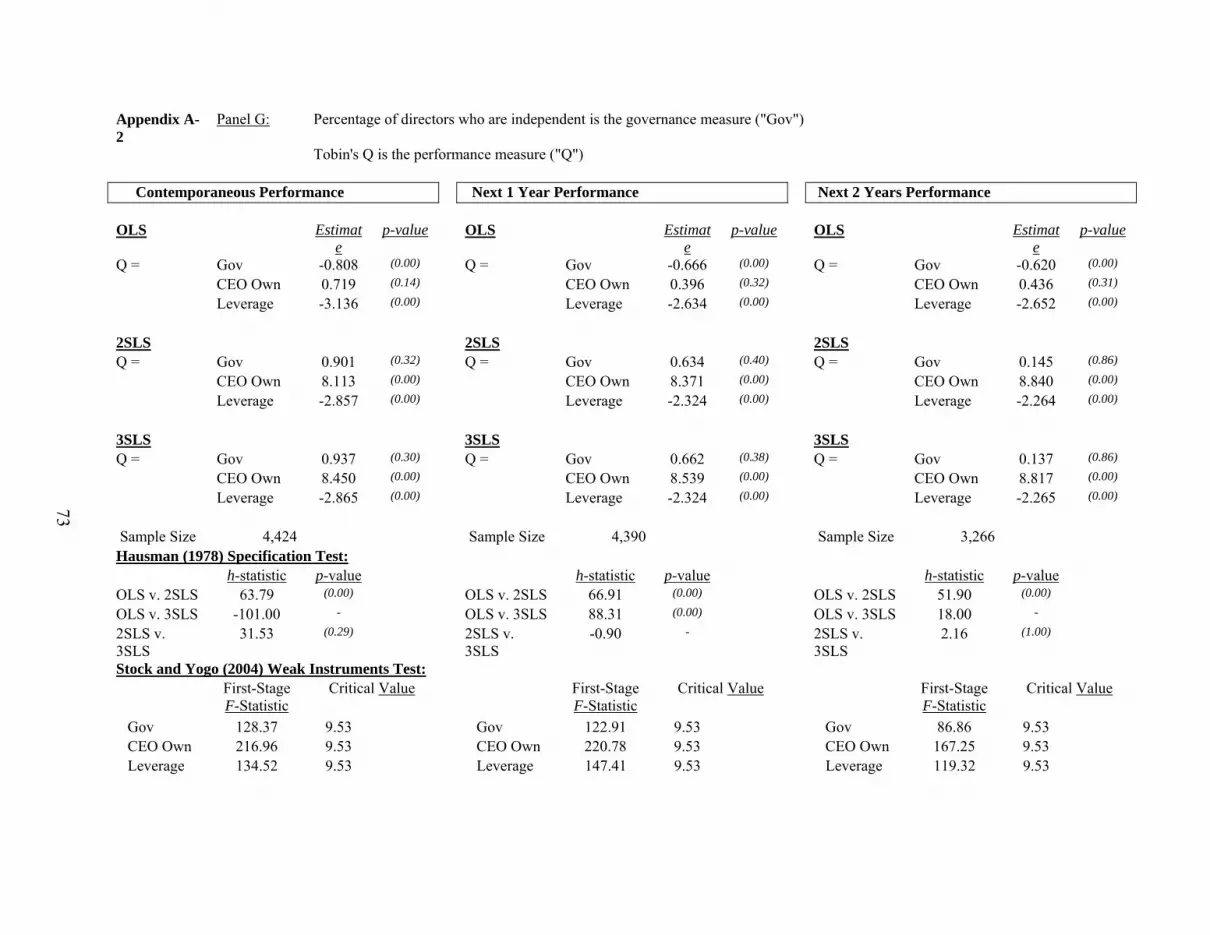
73
Appendix A-2
Panel G: Percentage of directors who are independent is the governance measure ("Gov")
Tobin's Q is the performance measure ("Q")
Contemporaneous Performance Next 1 Year Performance Next 2 Years Performance
OLS Estimate
p-value OLS Estimate
p-value OLS Estimate
p-value
Q = Gov -0.808 (0.00) Q = Gov -0.666 (0.00) Q = Gov -0.620 (0.00)
CEO Own 0.719 (0.14) CEO Own 0.396 (0.32) CEO Own 0.436 (0.31)
Leverage -3.136 (0.00) Leverage -2.634 (0.00) Leverage -2.652 (0.00)
2SLS 2SLS 2SLS
Q = Gov 0.901 (0.32) Q = Gov 0.634 (0.40) Q = Gov 0.145 (0.86)
CEO Own 8.113 (0.00) CEO Own 8.371 (0.00) CEO Own 8.840 (0.00)
Leverage -2.857 (0.00) Leverage -2.324 (0.00) Leverage -2.264 (0.00)
3SLS 3SLS 3SLS
Q = Gov 0.937 (0.30) Q = Gov 0.662 (0.38) Q = Gov 0.137 (0.86)
CEO Own 8.450 (0.00) CEO Own 8.539 (0.00) CEO Own 8.817 (0.00)
Leverage -2.865 (0.00) Leverage -2.324 (0.00) Leverage -2.265 (0.00)
Sample Size 4,424 Sample Size 4,390 Sample Size 3,266 Hausman (1978) Specification Test:
h-statistic p-value h-statistic p-value h-statistic p-value OLS v. 2SLS 63.79 (0.00) OLS v. 2SLS 66.91 (0.00) OLS v. 2SLS 51.90 (0.00) OLS v. 3SLS -101.00 - OLS v. 3SLS 88.31 (0.00) OLS v. 3SLS 18.00 - 2SLS v. 3SLS
31.53 (0.29) 2SLS v. 3SLS
-0.90 - 2SLS v. 3SLS
2.16 (1.00)
Stock and Yogo (2004) Weak Instruments Test: First-Stage
F-Statistic Critical Value First-Stage
F-Statistic Critical Value First-Stage
F-Statistic Critical Value
Gov 128.37 9.53 Gov 122.91 9.53 Gov 86.86 9.53 CEO Own 216.96 9.53 CEO Own 220.78 9.53 CEO Own 167.25 9.53 Leverage 134.52 9.53 Leverage 147.41 9.53 Leverage 119.32 9.53
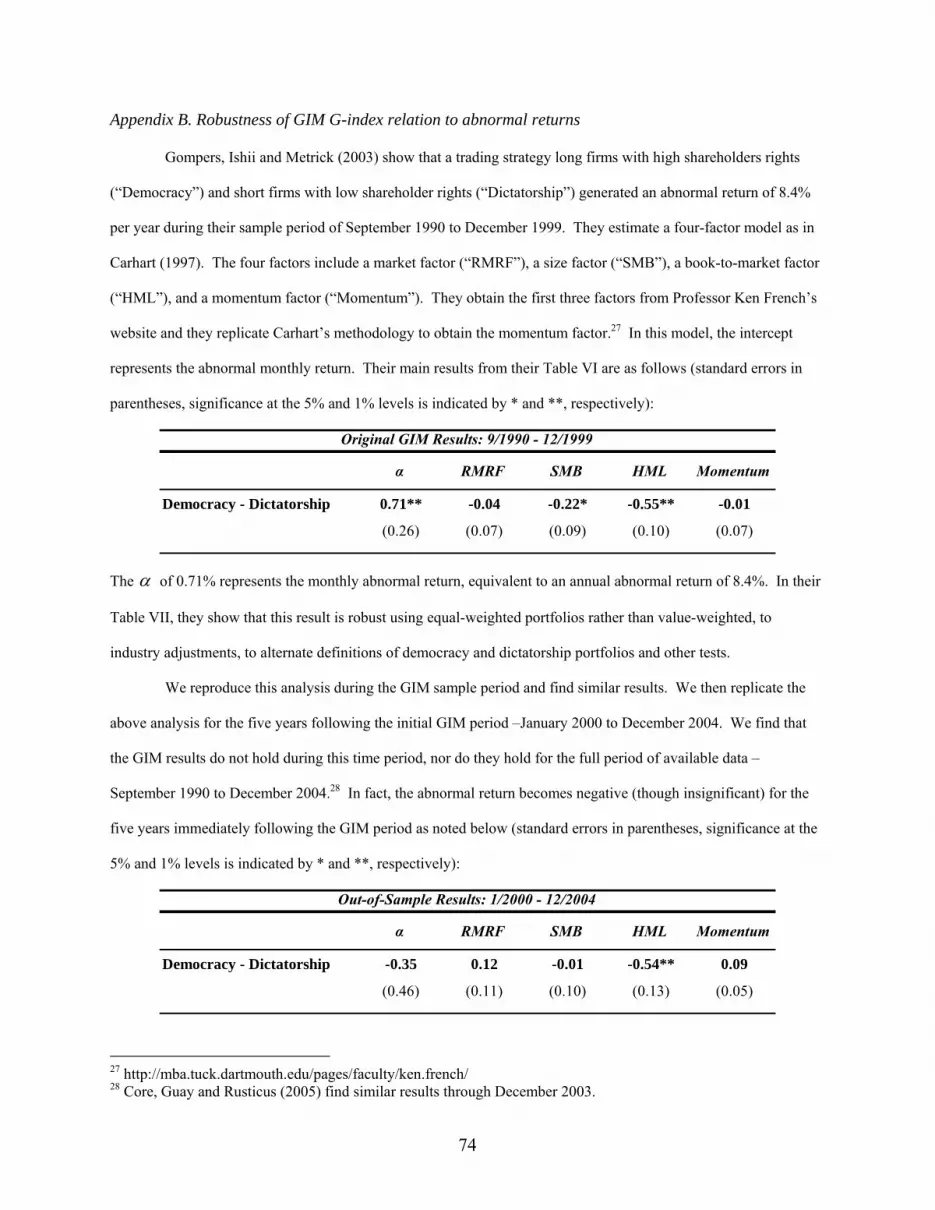
74
Appendix B. Robustness of GIM G-index relation to abnormal returns
Gompers, Ishii and Metrick (2003) show that a trading strategy long firms with high shareholders rights
(“Democracy”) and short firms with low shareholder rights (“Dictatorship”) generated an abnormal return of 8.4%
per year during their sample period of September 1990 to December 1999. They estimate a four-factor model as in
Carhart (1997). The four factors include a market factor (“RMRF”), a size factor (“SMB”), a book-to-market factor
(“HML”), and a momentum factor (“Momentum”). They obtain the first three factors from Professor Ken French’s
website and they replicate Carhart’s methodology to obtain the momentum factor.27 In this model, the intercept
represents the abnormal monthly return. Their main results from their Table VI are as follows (standard errors in
parentheses, significance at the 5% and 1% levels is indicated by * and **, respectively):
α RMRF SMB HML Momentum
Democracy - Dictatorship 0.71** -0.04 -0.22* -0.55** -0.01
(0.26) (0.07) (0.09) (0.10) (0.07)
Original GIM Results: 9/1990 - 12/1999
The α of 0.71% represents the monthly abnormal return, equivalent to an annual abnormal return of 8.4%. In their
Table VII, they show that this result is robust using equal-weighted portfolios rather than value-weighted, to
industry adjustments, to alternate definitions of democracy and dictatorship portfolios and other tests.
We reproduce this analysis during the GIM sample period and find similar results. We then replicate the
above analysis for the five years following the initial GIM period –January 2000 to December 2004. We find that
the GIM results do not hold during this time period, nor do they hold for the full period of available data –
September 1990 to December 2004.28 In fact, the abnormal return becomes negative (though insignificant) for the
five years immediately following the GIM period as noted below (standard errors in parentheses, significance at the
5% and 1% levels is indicated by * and **, respectively):
α RMRF SMB HML Momentum
Democracy - Dictatorship -0.35 0.12 -0.01 -0.54** 0.09
(0.46) (0.11) (0.10) (0.13) (0.05)
Out-of-Sample Results: 1/2000 - 12/2004
27 http://mba.tuck.dartmouth.edu/pages/faculty/ken.french/ 28 Core, Guay and Rusticus (2005) find similar results through December 2003.
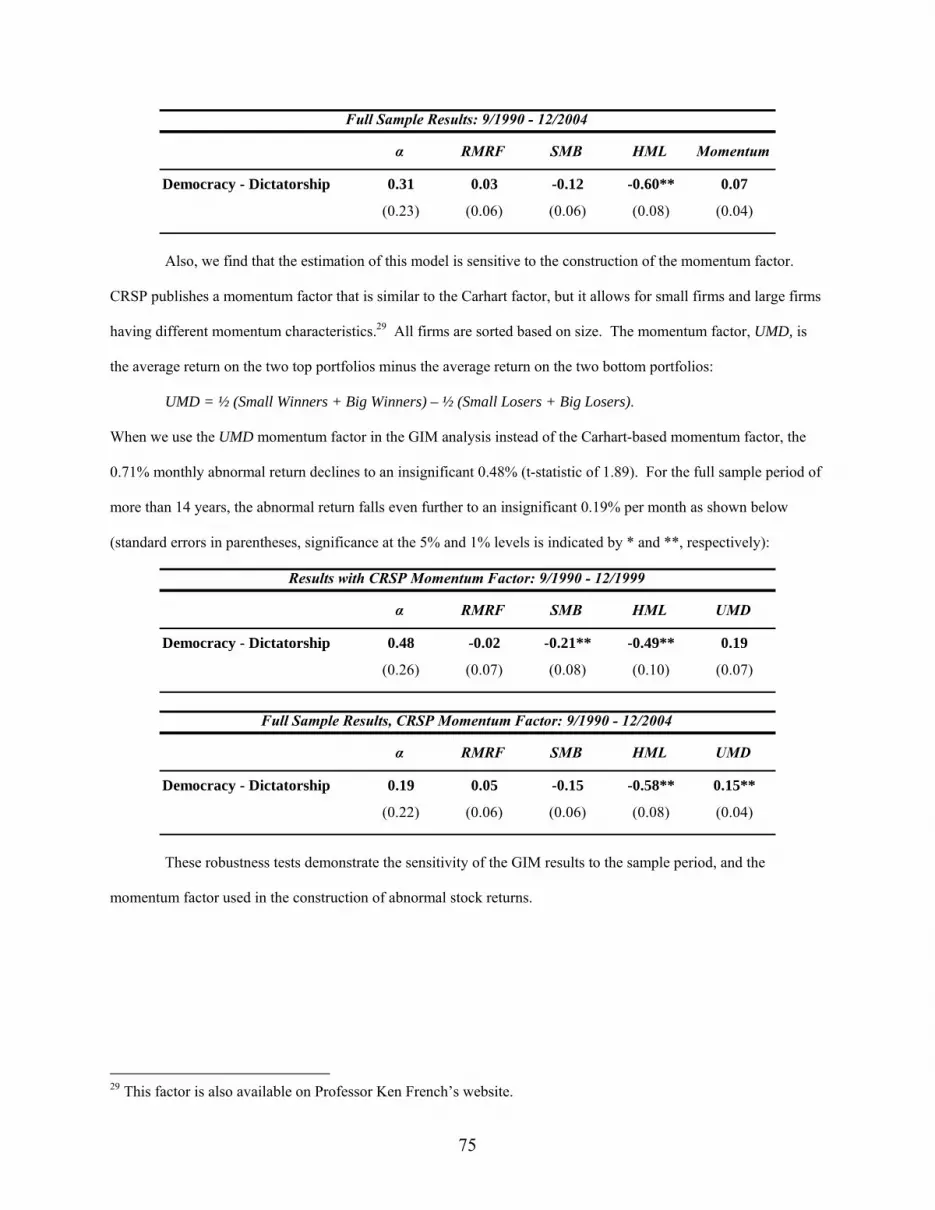
75
α RMRF SMB HML Momentum
Democracy - Dictatorship 0.31 0.03 -0.12 -0.60** 0.07
(0.23) (0.06) (0.06) (0.08) (0.04)
Full Sample Results: 9/1990 - 12/2004
Also, we find that the estimation of this model is sensitive to the construction of the momentum factor.
CRSP publishes a momentum factor that is similar to the Carhart factor, but it allows for small firms and large firms
having different momentum characteristics.29 All firms are sorted based on size. The momentum factor, UMD, is
the average return on the two top portfolios minus the average return on the two bottom portfolios:
UMD = ½ (Small Winners + Big Winners) – ½ (Small Losers + Big Losers).
When we use the UMD momentum factor in the GIM analysis instead of the Carhart-based momentum factor, the
0.71% monthly abnormal return declines to an insignificant 0.48% (t-statistic of 1.89). For the full sample period of
more than 14 years, the abnormal return falls even further to an insignificant 0.19% per month as shown below
(standard errors in parentheses, significance at the 5% and 1% levels is indicated by * and **, respectively):
α RMRF SMB HML UMD
Democracy - Dictatorship 0.48 -0.02 -0.21** -0.49** 0.19
(0.26) (0.07) (0.08) (0.10) (0.07)
Results with CRSP Momentum Factor: 9/1990 - 12/1999
α RMRF SMB HML UMD
Democracy - Dictatorship 0.19 0.05 -0.15 -0.58** 0.15**
(0.22) (0.06) (0.06) (0.08) (0.04)
Full Sample Results, CRSP Momentum Factor: 9/1990 - 12/2004
These robustness tests demonstrate the sensitivity of the GIM results to the sample period, and the
momentum factor used in the construction of abnormal stock returns.
29 This factor is also available on Professor Ken French’s website.
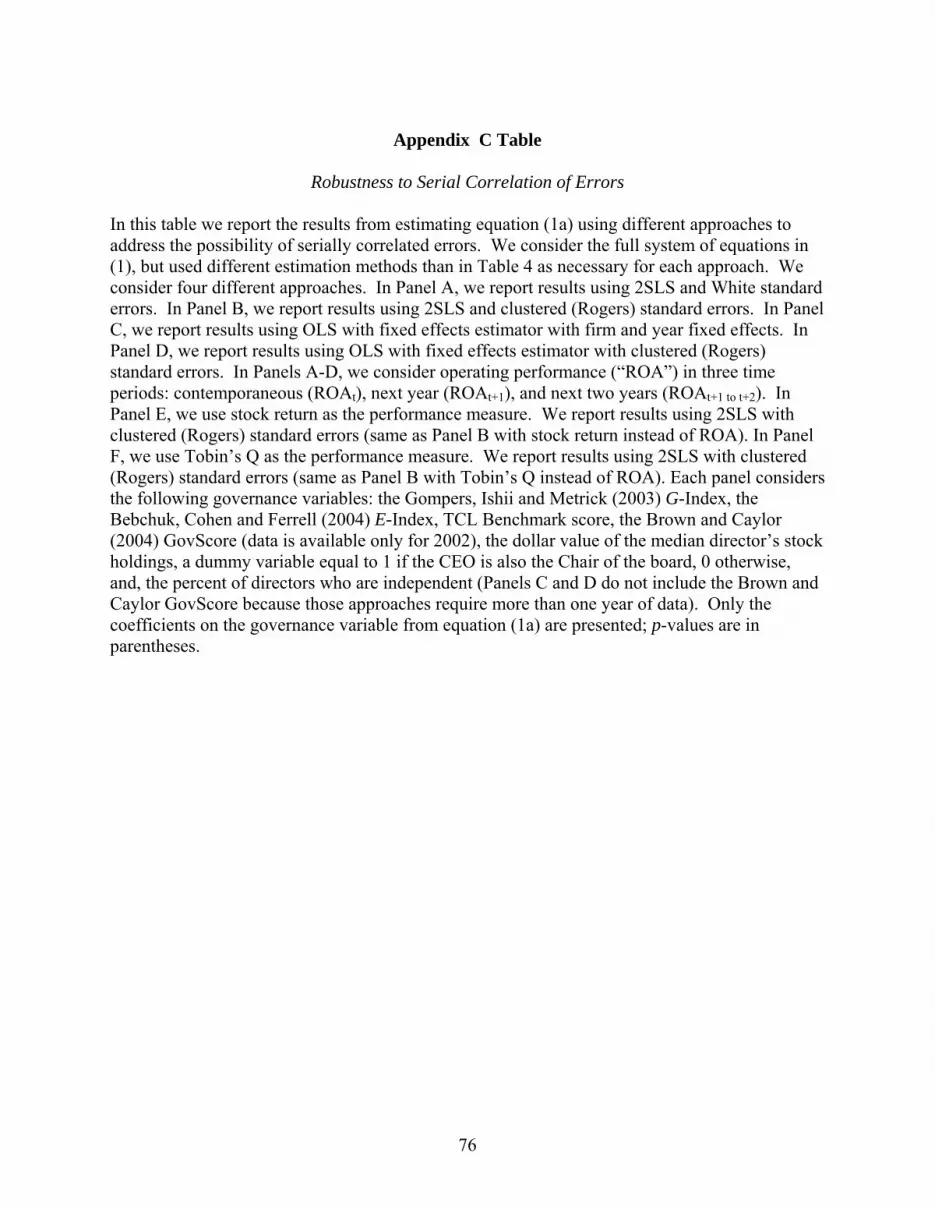
76
Appendix C Table
Robustness to Serial Correlation of Errors
In this table we report the results from estimating equation (1a) using different approaches to address the possibility of serially correlated errors. We consider the full system of equations in (1), but used different estimation methods than in Table 4 as necessary for each approach. We consider four different approaches. In Panel A, we report results using 2SLS and White standard errors. In Panel B, we report results using 2SLS and clustered (Rogers) standard errors. In Panel C, we report results using OLS with fixed effects estimator with firm and year fixed effects. In Panel D, we report results using OLS with fixed effects estimator with clustered (Rogers) standard errors. In Panels A-D, we consider operating performance (“ROA”) in three time periods: contemporaneous (ROAt), next year (ROAt+1), and next two years (ROAt+1 to t+2). In Panel E, we use stock return as the performance measure. We report results using 2SLS with clustered (Rogers) standard errors (same as Panel B with stock return instead of ROA). In Panel F, we use Tobin’s Q as the performance measure. We report results using 2SLS with clustered (Rogers) standard errors (same as Panel B with Tobin’s Q instead of ROA). Each panel considers the following governance variables: the Gompers, Ishii and Metrick (2003) G-Index, the Bebchuk, Cohen and Ferrell (2004) E-Index, TCL Benchmark score, the Brown and Caylor (2004) GovScore (data is available only for 2002), the dollar value of the median director’s stock holdings, a dummy variable equal to 1 if the CEO is also the Chair of the board, 0 otherwise, and, the percent of directors who are independent (Panels C and D do not include the Brown and Caylor GovScore because those approaches require more than one year of data). Only the coefficients on the governance variable from equation (1a) are presented; p-values are in parentheses.

77
Panel A – ROA, 2SLS and White standard errors:
GIM G-Index BCF E-Index
TCL Benchmark
Score
Brown & Caylor
GovScore (OLS)
$ Value of Median
Director's Holdings
CEO-Chair Duality
(=1 if Dual)% of Directors Independent
ROAt -0.013 -0.034 -0.049 0.000 0.006 -0.029 -0.131(0.00) (0.02) (0.05) (0.57) (0.08) (0.01) (0.00)
# of Observations 4,600 4,600 2,199 811 5,101 5,101 5,101
ROAt+1 -0.011 -0.031 -0.003 0.000 0.005 -0.031 -0.124(0.05) (0.10) (0.09) (0.84) (0.06) (0.02) (0.04)
# of Observations 4,561 4,561 2,138 773 5,053 5,053 5,053
ROAt+1 to t+2 -0.004 -0.015 -0.002 - 0.002 -0.017 -0.068(0.02) (0.09) (0.17) - (0.03) (0.02) (0.06)
# of Observations 3,416 3,416 977 - 3,814 3,814 3,814
Governance Variable
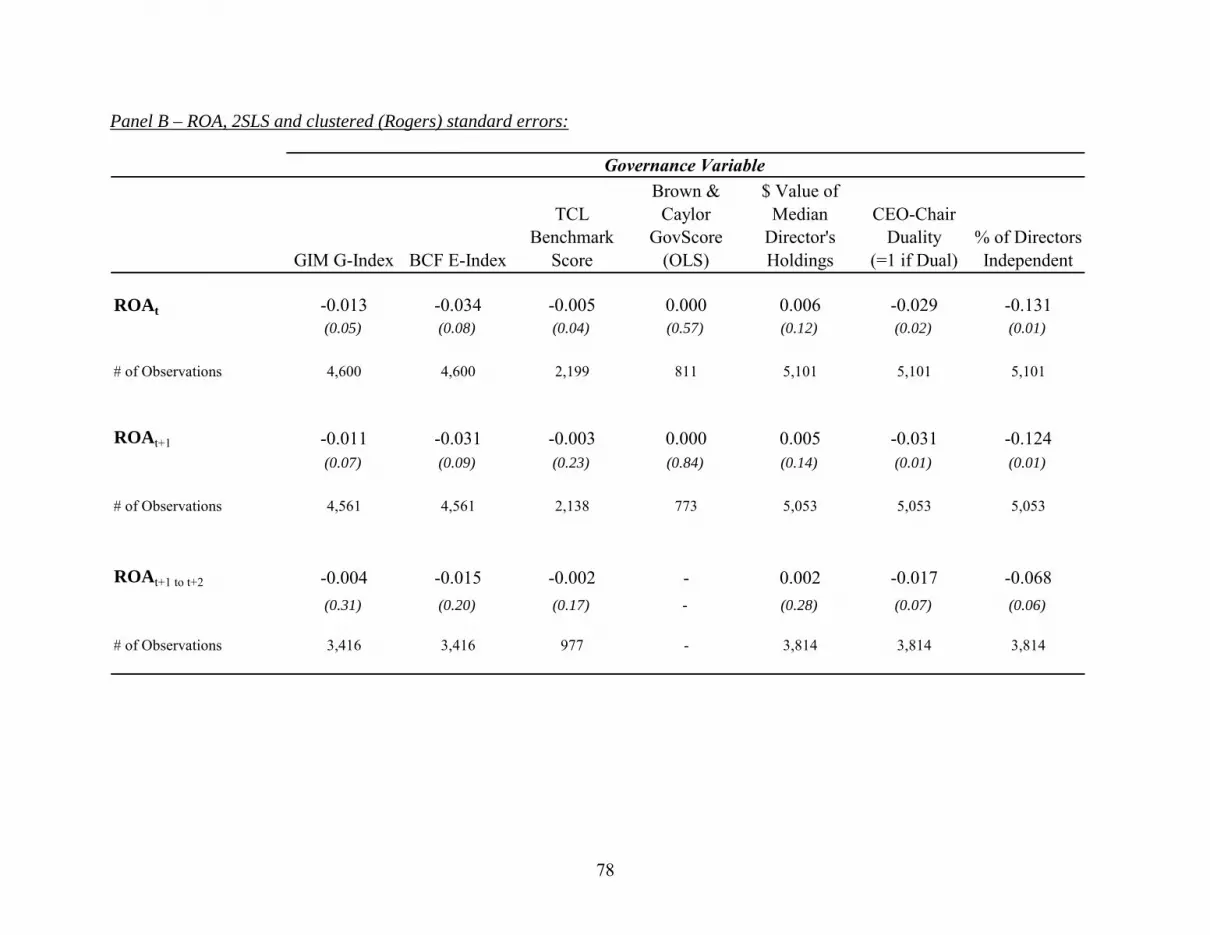
78
Panel B – ROA, 2SLS and clustered (Rogers) standard errors:
GIM G-Index BCF E-Index
TCL Benchmark
Score
Brown & Caylor
GovScore (OLS)
$ Value of Median
Director's Holdings
CEO-Chair Duality
(=1 if Dual)% of Directors Independent
ROAt -0.013 -0.034 -0.005 0.000 0.006 -0.029 -0.131(0.05) (0.08) (0.04) (0.57) (0.12) (0.02) (0.01)
# of Observations 4,600 4,600 2,199 811 5,101 5,101 5,101
ROAt+1 -0.011 -0.031 -0.003 0.000 0.005 -0.031 -0.124(0.07) (0.09) (0.23) (0.84) (0.14) (0.01) (0.01)
# of Observations 4,561 4,561 2,138 773 5,053 5,053 5,053
ROAt+1 to t+2 -0.004 -0.015 -0.002 - 0.002 -0.017 -0.068(0.31) (0.20) (0.17) - (0.28) (0.07) (0.06)
# of Observations 3,416 3,416 977 - 3,814 3,814 3,814
Governance Variable
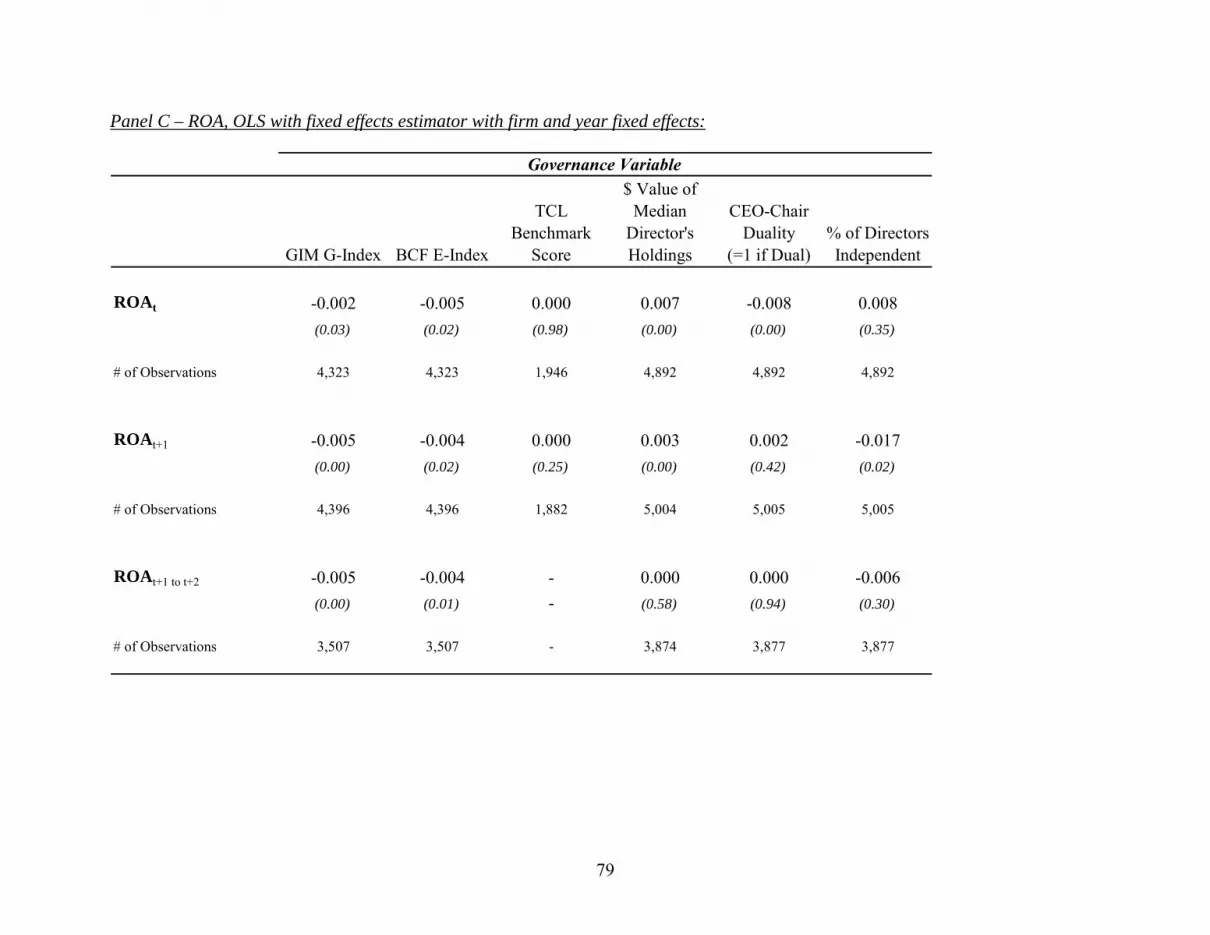
79
Panel C – ROA, OLS with fixed effects estimator with firm and year fixed effects:
GIM G-Index BCF E-Index
TCL Benchmark
Score
$ Value of Median
Director's Holdings
CEO-Chair Duality
(=1 if Dual)% of Directors Independent
ROAt -0.002 -0.005 0.000 0.007 -0.008 0.008(0.03) (0.02) (0.98) (0.00) (0.00) (0.35)
# of Observations 4,323 4,323 1,946 4,892 4,892 4,892
ROAt+1 -0.005 -0.004 0.000 0.003 0.002 -0.017(0.00) (0.02) (0.25) (0.00) (0.42) (0.02)
# of Observations 4,396 4,396 1,882 5,004 5,005 5,005
ROAt+1 to t+2 -0.005 -0.004 - 0.000 0.000 -0.006(0.00) (0.01) - (0.58) (0.94) (0.30)
# of Observations 3,507 3,507 - 3,874 3,877 3,877
Governance Variable
80
Panel D – ROA, OLS with fixed effects estimator with clustered (Rogers) standard errors:
GIM G-Index BCF E-Index
TCL Benchmark
Score
$ Value of Median
Director's Holdings
CEO-Chair Duality
(=1 if Dual)% of Directors Independent
ROAt -0.002 -0.005 0.000 0.007 -0.008 0.008(0.08) (0.05) (0.90) (0.03) (0.01) (0.42)
# of Observations 4,323 4,323 1,946 4,892 4,892 4,892
ROAt+1 -0.005 -0.004 0.000 0.003 0.002 -0.017(0.01) (0.08) (0.30) (0.03) (0.50) (0.06)
# of Observations 4,396 4,396 1,882 5,004 5,005 5,005
ROAt+1 to t+2 -0.005 -0.004 - 0.000 0.000 -0.006(0.01) (0.01) - (0.50) (0.82) (0.32)
# of Observations 3,507 3,507 - 3,874 3,877 3,877
Governance Variable
81
Appendix D. Sensitivity of results to alternative measures of leverage
It is possible that the results reported in section 4 regarding the performance-governance
relation are sensitive to the construction of the leverage variable. In the capital structure
literature, there does not appear to be any agreed upon ‘best’ measure of leverage. For our
primary analyses, we use the measure that appears frequently in corporate finance studies: All
long term debt divided by assets.
To test the sensitivity of our results to this definition of leverage, we run the analyses in
Table 4 using the following six definitions of leverage:
(1) sTotalAssetbtLongTermDe (This is used in Table 4 – includes current portion of long term debt.)
(2) sTotalAssetbtLongTermDe (Excluding current portion of long term debt.)
(3) sTotalAsset
BookEquitysTotalAsset −
(4) sTotalAsset
iabilitiesTotalBookL
(5) sTotalAsset
BookEquitysTotalAsset − (Per, Baker & Wurgler (2002).30)
(6) tyMarketEquiBookEquitysTotalAsset
BookDebt+−
(Per, Baker & Wurgler (2002).)
Again, we run the three-equation system allowing for potential endogeneity between
performance, governance and ownership. We estimate each system using OLS, 2SLS, and 3SLS.
30 Definitions (3) and (5) differ in the Compustat variables used, specifically for Book Equity. Definition (3) uses Compustat data item #216, “Stockholders’ Equity.” Definition (5) defines Book Equity as total assets less total liabilities (item 181) and preferred stock (item 10) plus deferred taxes (item 35) and convertible debt (item 79). The correlation between the leverage variables based on the two definitions is 0.90.
82
We use the Stock and Yogo (2004) weak instrument test and the Hausman (1978) specification
test to determine which estimation method is most appropriate.
In the following table, we only present the coefficients and p-values (in parentheses) for
the governance variable in the performance equation (equation 1A), with return on assets as the
performance variable. Only the results from the estimation method deemed most appropriate by
the specification tests are presented. We present the results for all three different time periods
(contemporaneous, next year’s ROA, and next two years’ ROA) and for all seven different
governance variables. The results are qualitatively very similar across the different definitions of
leverage. Both the coefficients and p-values vary little with the first five definitions of leverage;
in a few cases, using the Baker and Wurgler (2002) market leverage variable does impact the
statistical significance levels. Overall, this evidence suggests that our results regarding the
relation between performance and governance are robust to alternative definitions of leverage.
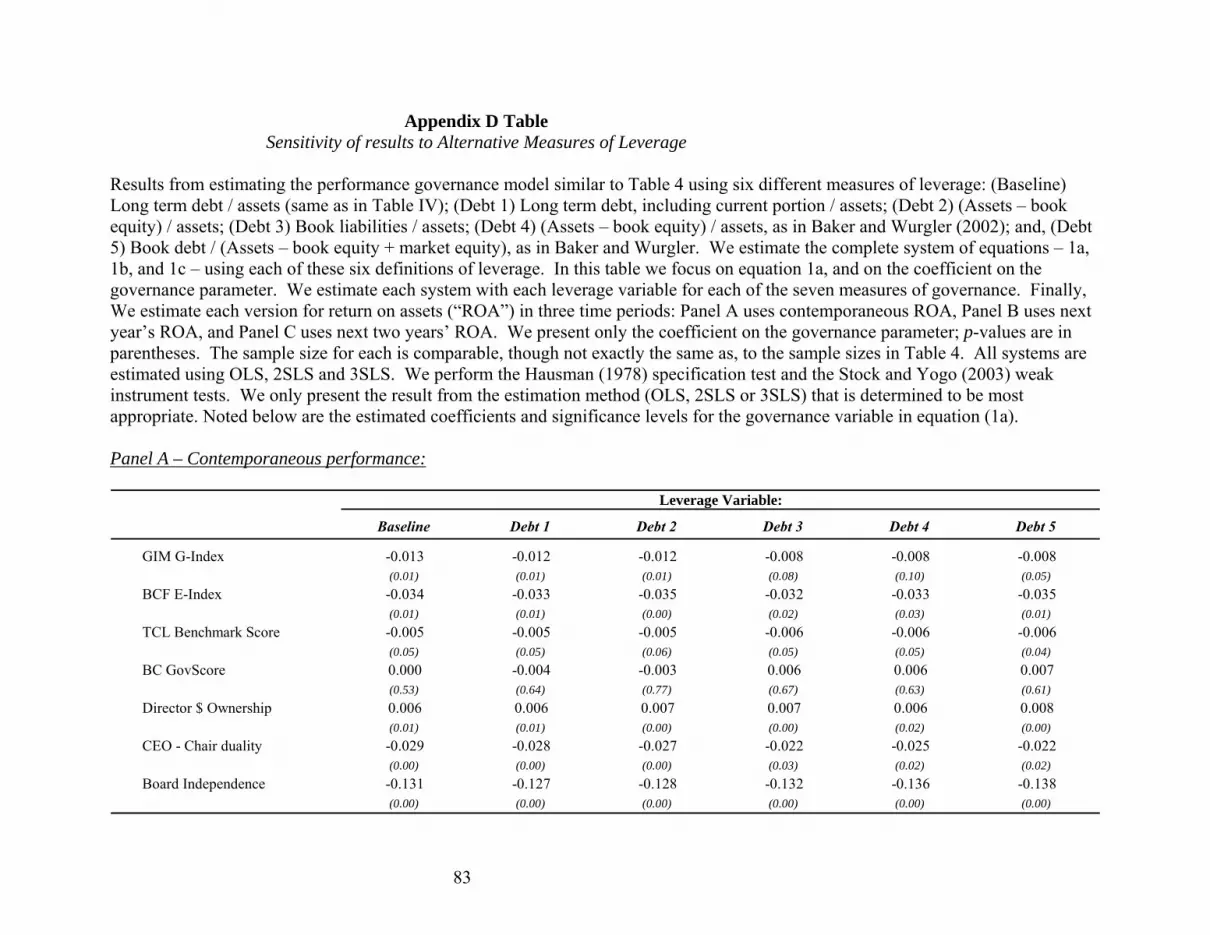
83
Appendix D Table Sensitivity of results to Alternative Measures of Leverage
Results from estimating the performance governance model similar to Table 4 using six different measures of leverage: (Baseline) Long term debt / assets (same as in Table IV); (Debt 1) Long term debt, including current portion / assets; (Debt 2) (Assets – book equity) / assets; (Debt 3) Book liabilities / assets; (Debt 4) (Assets – book equity) / assets, as in Baker and Wurgler (2002); and, (Debt 5) Book debt / (Assets – book equity + market equity), as in Baker and Wurgler. We estimate the complete system of equations – 1a, 1b, and 1c – using each of these six definitions of leverage. In this table we focus on equation 1a, and on the coefficient on the governance parameter. We estimate each system with each leverage variable for each of the seven measures of governance. Finally, We estimate each version for return on assets (“ROA”) in three time periods: Panel A uses contemporaneous ROA, Panel B uses next year’s ROA, and Panel C uses next two years’ ROA. We present only the coefficient on the governance parameter; p-values are in parentheses. The sample size for each is comparable, though not exactly the same as, to the sample sizes in Table 4. All systems are estimated using OLS, 2SLS and 3SLS. We perform the Hausman (1978) specification test and the Stock and Yogo (2003) weak instrument tests. We only present the result from the estimation method (OLS, 2SLS or 3SLS) that is determined to be most appropriate. Noted below are the estimated coefficients and significance levels for the governance variable in equation (1a). Panel A – Contemporaneous performance:
Baseline Debt 1 Debt 2 Debt 3 Debt 4 Debt 5
GIM G-Index -0.013 -0.012 -0.012 -0.008 -0.008 -0.008(0.01) (0.01) (0.01) (0.08) (0.10) (0.05)
BCF E-Index -0.034 -0.033 -0.035 -0.032 -0.033 -0.035(0.01) (0.01) (0.00) (0.02) (0.03) (0.01)
TCL Benchmark Score -0.005 -0.005 -0.005 -0.006 -0.006 -0.006(0.05) (0.05) (0.06) (0.05) (0.05) (0.04)
BC GovScore 0.000 -0.004 -0.003 0.006 0.006 0.007(0.53) (0.64) (0.77) (0.67) (0.63) (0.61)
Director $ Ownership 0.006 0.006 0.007 0.007 0.006 0.008(0.01) (0.01) (0.00) (0.00) (0.02) (0.00)
CEO - Chair duality -0.029 -0.028 -0.027 -0.022 -0.025 -0.022(0.00) (0.00) (0.00) (0.03) (0.02) (0.02)
Board Independence -0.131 -0.127 -0.128 -0.132 -0.136 -0.138(0.00) (0.00) (0.00) (0.00) (0.00) (0.00)
Leverage Variable:
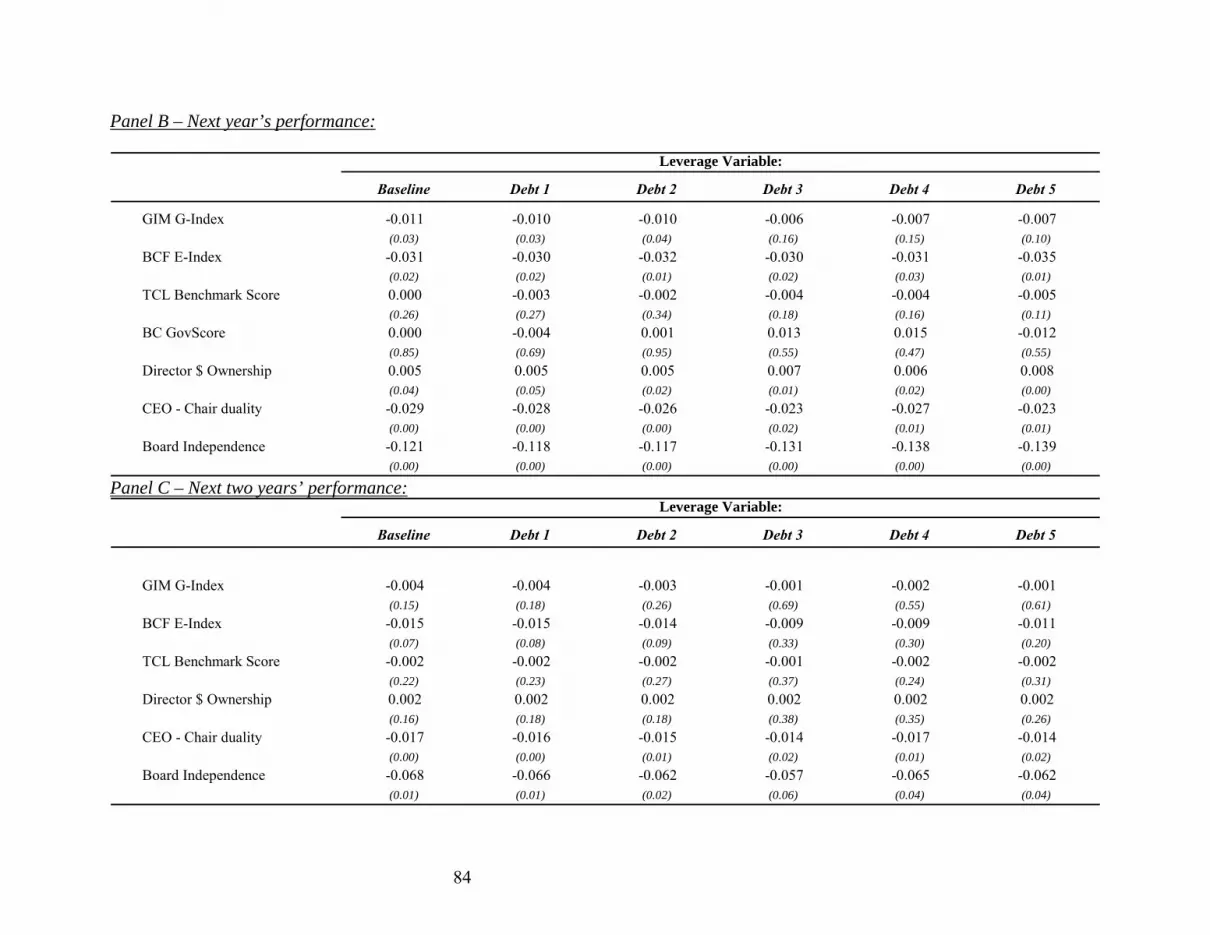
84
Panel B – Next year’s performance:
Baseline Debt 1 Debt 2 Debt 3 Debt 4 Debt 5
GIM G-Index -0.011 -0.010 -0.010 -0.006 -0.007 -0.007(0.03) (0.03) (0.04) (0.16) (0.15) (0.10)
BCF E-Index -0.031 -0.030 -0.032 -0.030 -0.031 -0.035(0.02) (0.02) (0.01) (0.02) (0.03) (0.01)
TCL Benchmark Score 0.000 -0.003 -0.002 -0.004 -0.004 -0.005(0.26) (0.27) (0.34) (0.18) (0.16) (0.11)
BC GovScore 0.000 -0.004 0.001 0.013 0.015 -0.012(0.85) (0.69) (0.95) (0.55) (0.47) (0.55)
Director $ Ownership 0.005 0.005 0.005 0.007 0.006 0.008(0.04) (0.05) (0.02) (0.01) (0.02) (0.00)
CEO - Chair duality -0.029 -0.028 -0.026 -0.023 -0.027 -0.023(0.00) (0.00) (0.00) (0.02) (0.01) (0.01)
Board Independence -0.121 -0.118 -0.117 -0.131 -0.138 -0.139(0.00) (0.00) (0.00) (0.00) (0.00) (0.00)
Leverage Variable:
Panel C – Next two years’ performance:
Baseline Debt 1 Debt 2 Debt 3 Debt 4 Debt 5
GIM G-Index -0.004 -0.004 -0.003 -0.001 -0.002 -0.001(0.15) (0.18) (0.26) (0.69) (0.55) (0.61)
BCF E-Index -0.015 -0.015 -0.014 -0.009 -0.009 -0.011(0.07) (0.08) (0.09) (0.33) (0.30) (0.20)
TCL Benchmark Score -0.002 -0.002 -0.002 -0.001 -0.002 -0.002(0.22) (0.23) (0.27) (0.37) (0.24) (0.31)
Director $ Ownership 0.002 0.002 0.002 0.002 0.002 0.002(0.16) (0.18) (0.18) (0.38) (0.35) (0.26)
CEO - Chair duality -0.017 -0.016 -0.015 -0.014 -0.017 -0.014(0.00) (0.00) (0.01) (0.02) (0.01) (0.02)
Board Independence -0.068 -0.066 -0.062 -0.057 -0.065 -0.062(0.01) (0.01) (0.02) (0.06) (0.04) (0.04)
Leverage Variable:
85
Appendix E. Multinomial logit models for CEO turnover, industry adjusted performance
It is possible that the governance function reacts to poor performance relative to industry
performance, rather than absolute performance of the firm as was considered in equations
(2a) and (2b). To address this, we reconsider equations (2a) and (2b) using industry
adjusted performance by itself, rather than using firm performance and industry
performance as two separate variables. The performance term in the interaction term is
also industry adjusted performance.
The results from this analysis are qualitatively similar to the results presented in
Table 9. The three measures of entrenchment – G-Index, E-Index, and CEO / Chair
duality – suggest that better governed firms are less likely to experience disciplinary
management turnover in spite of their performance. Using the dollar value of the median
director’s stock ownership and the percentage of directors who are independent, the results
suggest that better governed firms are more likely to experience disciplinary management
turnover following poor performance.
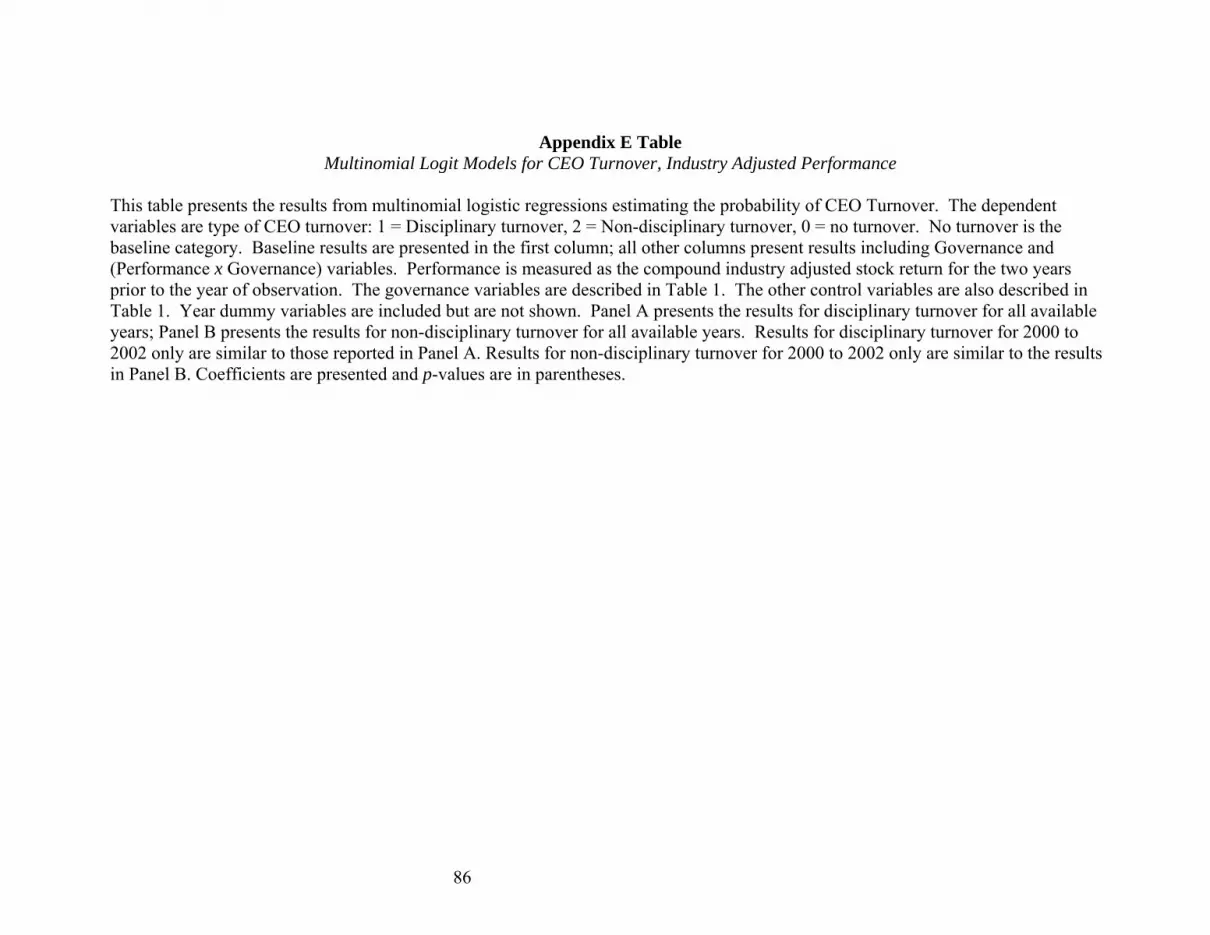
86
Appendix E Table
Multinomial Logit Models for CEO Turnover, Industry Adjusted Performance This table presents the results from multinomial logistic regressions estimating the probability of CEO Turnover. The dependent variables are type of CEO turnover: 1 = Disciplinary turnover, 2 = Non-disciplinary turnover, 0 = no turnover. No turnover is the baseline category. Baseline results are presented in the first column; all other columns present results including Governance and (Performance x Governance) variables. Performance is measured as the compound industry adjusted stock return for the two years prior to the year of observation. The governance variables are described in Table 1. The other control variables are also described in Table 1. Year dummy variables are included but are not shown. Panel A presents the results for disciplinary turnover for all available years; Panel B presents the results for non-disciplinary turnover for all available years. Results for disciplinary turnover for 2000 to 2002 only are similar to those reported in Panel A. Results for non-disciplinary turnover for 2000 to 2002 only are similar to the results in Panel B. Coefficients are presented and p-values are in parentheses.
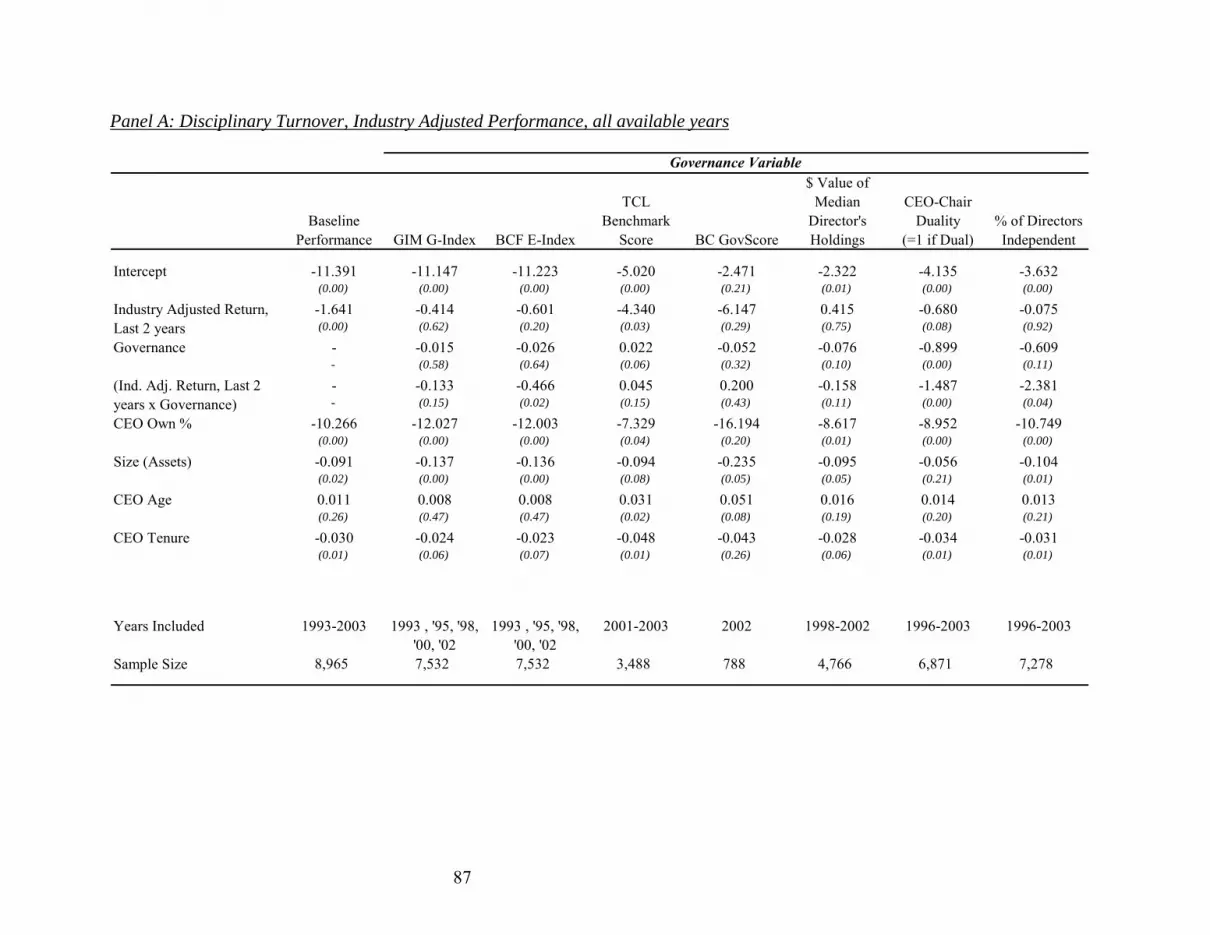
87
Panel A: Disciplinary Turnover, Industry Adjusted Performance, all available years
Baseline Performance GIM G-Index BCF E-Index
TCL Benchmark
Score BC GovScore
$ Value of Median
Director's Holdings
CEO-Chair Duality
(=1 if Dual)% of Directors Independent
-11.391 -11.147 -11.223 -5.020 -2.471 -2.322 -4.135 -3.632(0.00) (0.00) (0.00) (0.00) (0.21) (0.01) (0.00) (0.00)
-1.641 -0.414 -0.601 -4.340 -6.147 0.415 -0.680 -0.075(0.00) (0.62) (0.20) (0.03) (0.29) (0.75) (0.08) (0.92)
- -0.015 -0.026 0.022 -0.052 -0.076 -0.899 -0.609- (0.58) (0.64) (0.06) (0.32) (0.10) (0.00) (0.11)
- -0.133 -0.466 0.045 0.200 -0.158 -1.487 -2.381- (0.15) (0.02) (0.15) (0.43) (0.11) (0.00) (0.04)
-10.266 -12.027 -12.003 -7.329 -16.194 -8.617 -8.952 -10.749(0.00) (0.00) (0.00) (0.04) (0.20) (0.01) (0.00) (0.00)
-0.091 -0.137 -0.136 -0.094 -0.235 -0.095 -0.056 -0.104(0.02) (0.00) (0.00) (0.08) (0.05) (0.05) (0.21) (0.01)
0.011 0.008 0.008 0.031 0.051 0.016 0.014 0.013(0.26) (0.47) (0.47) (0.02) (0.08) (0.19) (0.20) (0.21)
-0.030 -0.024 -0.023 -0.048 -0.043 -0.028 -0.034 -0.031(0.01) (0.06) (0.07) (0.01) (0.26) (0.06) (0.01) (0.01)
Years Included 1993-2003 1993 , '95, '98, '00, '02
1993 , '95, '98, '00, '02
2001-2003 2002 1998-2002 1996-2003 1996-2003
Sample Size 8,965 7,532 7,532 3,488 788 4,766 6,871 7,278
Industry Adjusted Return, Last 2 years
Governance Variable
Intercept
Size (Assets)
CEO Age
Governance
CEO Tenure
(Ind. Adj. Return, Last 2 years x Governance)CEO Own %
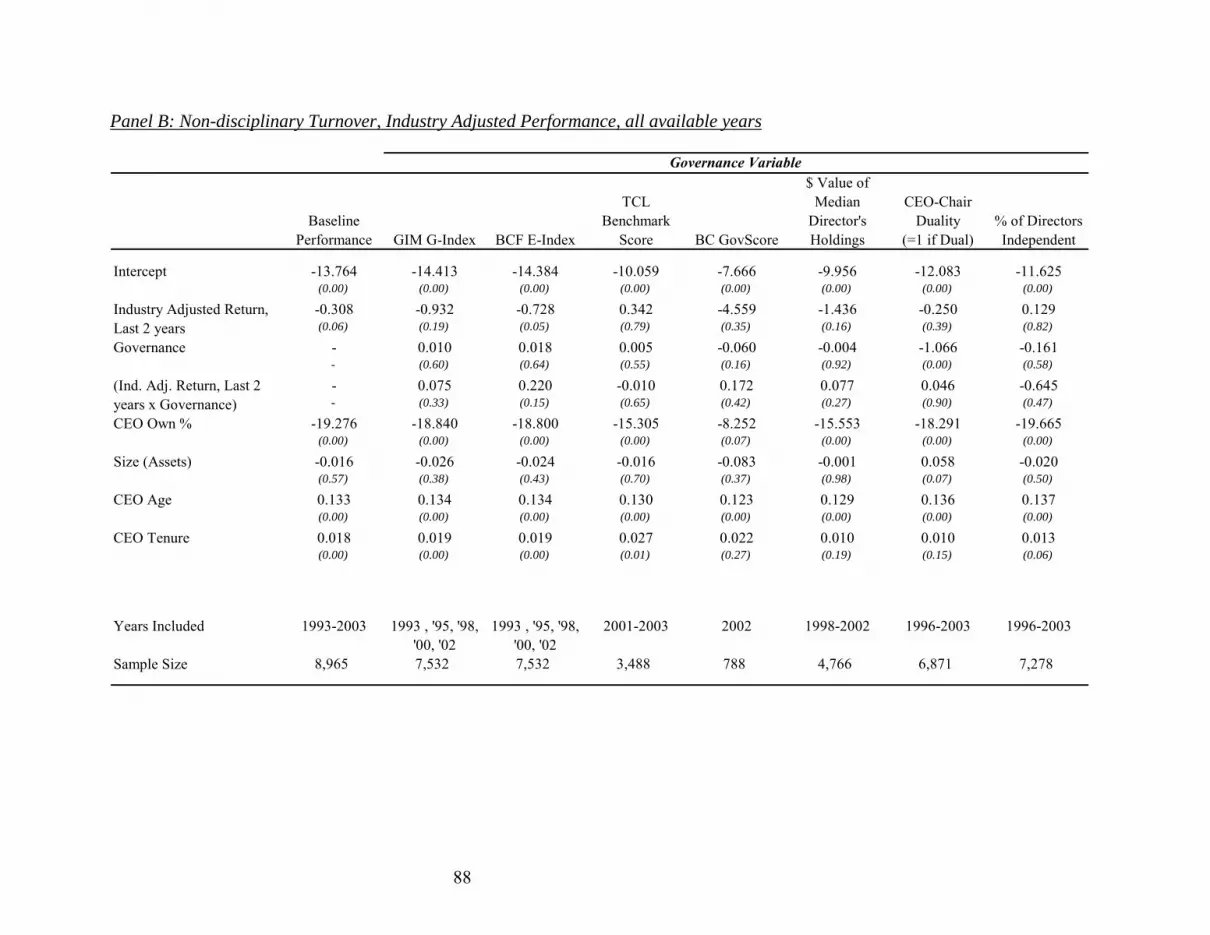
88
Panel B: Non-disciplinary Turnover, Industry Adjusted Performance, all available years
Baseline Performance GIM G-Index BCF E-Index
TCL Benchmark
Score BC GovScore
$ Value of Median
Director's Holdings
CEO-Chair Duality
(=1 if Dual)% of Directors Independent
-13.764 -14.413 -14.384 -10.059 -7.666 -9.956 -12.083 -11.625(0.00) (0.00) (0.00) (0.00) (0.00) (0.00) (0.00) (0.00)
-0.308 -0.932 -0.728 0.342 -4.559 -1.436 -0.250 0.129(0.06) (0.19) (0.05) (0.79) (0.35) (0.16) (0.39) (0.82)
- 0.010 0.018 0.005 -0.060 -0.004 -1.066 -0.161- (0.60) (0.64) (0.55) (0.16) (0.92) (0.00) (0.58)
- 0.075 0.220 -0.010 0.172 0.077 0.046 -0.645- (0.33) (0.15) (0.65) (0.42) (0.27) (0.90) (0.47)
-19.276 -18.840 -18.800 -15.305 -8.252 -15.553 -18.291 -19.665(0.00) (0.00) (0.00) (0.00) (0.07) (0.00) (0.00) (0.00)
-0.016 -0.026 -0.024 -0.016 -0.083 -0.001 0.058 -0.020(0.57) (0.38) (0.43) (0.70) (0.37) (0.98) (0.07) (0.50)
0.133 0.134 0.134 0.130 0.123 0.129 0.136 0.137(0.00) (0.00) (0.00) (0.00) (0.00) (0.00) (0.00) (0.00)
0.018 0.019 0.019 0.027 0.022 0.010 0.010 0.013(0.00) (0.00) (0.00) (0.01) (0.27) (0.19) (0.15) (0.06)
Years Included 1993-2003 1993 , '95, '98, '00, '02
1993 , '95, '98, '00, '02
2001-2003 2002 1998-2002 1996-2003 1996-2003
Sample Size 8,965 7,532 7,532 3,488 788 4,766 6,871 7,278
Industry Adjusted Return, Last 2 years
Governance Variable
Intercept
Size (Assets)
CEO Age
Governance
CEO Tenure
(Ind. Adj. Return, Last 2 years x Governance)CEO Own %


