Theoretical Maximum Algal Oil Production Kristina M. Weyer & Daniel R. Bush & Al Darzins & Bryan D. Willson Published online: 8 October 2009 # The Author(s) 2009. This article is published with open access at Springerlink.com Abstract Interest in algae as a feedstock for biofuel production has risen in recent years, due to projections that algae can produce lipids (oil) at a rate significantly higher than agriculture-based feedstocks. Current research and development of enclosed photobioreactors for commercial- scale algal oil production is directed towards pushing the upper limit of productivity beyond that of open ponds. So far, most of this development is in a prototype stage, so working production metrics for a commercial-scale algal biofuel system are still unknown, and projections are largely based on small-scale experimental data. Given this research climate, a methodical analysis of a maximum algal oil production rate from a theoretical perspective will be useful to the emerging industry for understanding the upper limits that will bound the production capabilities of new designs. This paper presents a theoretical approach to calculating an absolute upper limit to algal production based on physical laws and assumptions of perfect efficiencies. In addition, it presents a best case approach that represents an optimistic target for production based on realistic efficiencies and is calculated for six global sites. The theoretical maximum was found to be 354,000 L·ha −1 ·year −1 (38,000 gal·ac −1 ·year −1 ) of unrefined oil, while the best cases examined in this report range from 40,700–53,200 L·ha −1 ·year −1 (4,350–5,700 gal·ac −1 ·year −1 ) of unrefined oil. Keywords Algae . Biofuels . Theoretical yield . Oil production . Second-generation feedstock Abbreviations DCW Dry cell weight NREL National Renewable Energy Laboratory PAR Photosynthetically active radiation PCE Photoconversion efficiency PFD Photon flux density Introduction Algae as a feedstock is emerging at the forefront of biofuel research due to increasing awareness of global energy issues in conjunction with the production limitations of agriculture- based oilseed crops [8, 30]. Many species of algae exhibit Employees of the Alliance for Sustainable Energy, LLC, under Contract No. DE-AC36-08GO28308 with the U.S. Department of Energy have authored this work. The United States Government retains and the publisher, by accepting the article for publication, acknowledges that the United States Government retains a non- exclusive, paid-up, irrevocable, worldwide license to publish or reproduce the published form of this work, or allow others to do so, for United States Government purposes. K. M. Weyer (*) Solix Biofuels, Inc, 430B N. College Ave, Fort Collins, CO 80524, USA e-mail: [email protected]D. R. Bush Department of Biology, Colorado State University, Fort Collins, CO 80523, USA A. Darzins National Bioenergy Center, National Renewable Energy Laboratory, 1617 Cole Blvd, Golden, CO 80401, USA B. D. Willson Department of Mechanical Engineering, Engines and Energy Conversion Laboratory, Colorado State University, 430 N. College Ave, Fort Collins, CO 80524, USA Bioenerg. Res. (2010) 3:204–213 DOI 10.1007/s12155-009-9046-x
Transcript
Theoretical Maximum Algal Oil Production
Kristina M. Weyer & Daniel R. Bush & Al Darzins &
Bryan D. Willson
Published online: 8 October 2009# The Author(s) 2009. This article is published with open access at Springerlink.com
Abstract Interest in algae as a feedstock for biofuelproduction has risen in recent years, due to projections thatalgae can produce lipids (oil) at a rate significantly higherthan agriculture-based feedstocks. Current research anddevelopment of enclosed photobioreactors for commercial-scale algal oil production is directed towards pushing theupper limit of productivity beyond that of open ponds. So far,most of this development is in a prototype stage, so working
production metrics for a commercial-scale algal biofuelsystem are still unknown, and projections are largely basedon small-scale experimental data. Given this research climate,a methodical analysis of a maximum algal oil production ratefrom a theoretical perspective will be useful to the emergingindustry for understanding the upper limits that will bound theproduction capabilities of new designs. This paper presents atheoretical approach to calculating an absolute upper limit toalgal production based on physical laws and assumptions ofperfect efficiencies. In addition, it presents a best caseapproach that represents an optimistic target for productionbased on realistic efficiencies and is calculated for six globalsites. The theoretical maximum was found to be354,000 L·ha−1·year−1 (38,000 gal·ac−1·year−1) of unrefinedoil, while the best cases examined in this report range from40,700–53,200 L·ha−1·year−1 (4,350–5,700 gal·ac−1·year−1)of unrefined oil.
Keywords Algae . Biofuels . Theoretical yield .
Oil production . Second-generation feedstock
AbbreviationsDCW Dry cell weightNREL National Renewable Energy LaboratoryPAR Photosynthetically active radiationPCE Photoconversion efficiencyPFD Photon flux density
Introduction
Algae as a feedstock is emerging at the forefront of biofuelresearch due to increasing awareness of global energy issues inconjunction with the production limitations of agriculture-based oilseed crops [8, 30]. Many species of algae exhibit
Employees of the Alliance for Sustainable Energy, LLC, underContract No. DE-AC36-08GO28308 with the U.S. Department ofEnergy have authored this work. The United States Governmentretains and the publisher, by accepting the article for publication,acknowledges that the United States Government retains a non-exclusive, paid-up, irrevocable, worldwide license to publish orreproduce the published form of this work, or allow others to do so,for United States Government purposes.
K. M. Weyer (*)Solix Biofuels, Inc,430B N. College Ave,Fort Collins, CO 80524, USAe-mail: [email protected]
D. R. BushDepartment of Biology, Colorado State University,Fort Collins, CO 80523, USA
A. DarzinsNational Bioenergy Center,National Renewable Energy Laboratory,1617 Cole Blvd,Golden, CO 80401, USA
B. D. WillsonDepartment of Mechanical Engineering,Engines and Energy Conversion Laboratory,Colorado State University,430 N. College Ave,Fort Collins, CO 80524, USA
promise in this capacity because of their characteristics of highlipid content and rapid growth, which result in areal produc-tivity significantly higher than oilseed crops. Additionally,because algae are grown in water rather than soil, algalproduction can be sited on land not suitable for agricultural use.
The potential of algae as a biofuels feedstock wasinvestigated extensively by the Aquatic Species Program ofthe National Renewable Energy Laboratory (NREL),focusing specifically on open-pond production designs[31]. That program concluded that large-scale algal pro-duction could be an economically competitive source ofrenewable energy. Recent years have seen the emergence ofnew enclosed photobioreactor designs, which are expectedto improve yields over the open-pond design by protectingproductive strains from contamination and using highersurface-area-to-volume ratios to optimize light utilization.In light of the recent research, a calculation of thetheoretical limits of algal production will provide a usefulbenchmark for understanding the yields that can berealistically expected from this new biofuel technology.
While numerous studies have addressed maximumtheoretical efficiency of photosynthesis [6, 9, 23, 26],they have not been applied specifically to algal biofuelproduction or extrapolated to calculate maximum instan-taneous efficiency and maximum annual production yield.Calculations by Raven [26] and Goldman [13] are theclosest in methodology to this work, but they focusprimarily on daily rather than annual yields and includeassumptions of unknown efficiencies akin to the best-caseapproach in this work but do not address a purelytheoretical case. Likewise, many projections have beenmade of expected production yields, but are frequentlybased on small-scale experiments or include estimations offuture advances [8, 30, 31].
The limits presented in this paper apply to any large-scale algal production system that relies only on solarenergy input to drive growth and oil production. Systemsthat use artificial lighting or other additional energyinputs, such as sugars for heterotrophic growth, are notconsidered. The calculation for theoretical maximum yieldis based on physical laws, an established value forquantum yield, solar irradiance assuming perfectly clearweather and atmospheric conditions, and assumes 100%for unknown efficiencies. Thus, the theoretical maximumyield is a true upper limit: a value that cannot besurpassed without breaking fundamental physical laws.Due to the numerous assumptions of perfect efficiencyemployed in the theoretical calculation, it is an unattain-able goal. A best case is also calculated, in order toprovide designers with a realistic goal, which employssolar irradiance data for several sites and reasonable butoptimistically high values for some efficiencies that wereassumed to be 100% in the theoretical case. The best case
therefore represents what may be possible with optimiza-tion of both biological and production systems. Uncer-tainties in several terms were used to provide error barson both yield results. These values provide a benchmarkagainst which to gauge predicted and achieved yields bothto the designers of algae production systems and thoseseeking to implement the technology.
Methods
The primary physical law that limits the productioncapabilities of algae is the first law of thermodynamics,which states conservation of energy for any system:E�in � E
�stored. For a system of photosynthesizing algae, E
�in
is the rate of incident solar irradiance on the productionarea, and E
�stored is the rate of chemical energy storage by
the algae as oil and other biomass. Thus, the amount ofstored chemical energy is directly limited by the amount ofsolar irradiance available.
The intention of the theoretical maximum yield calcula-tion is to provide a value that relies only on physical lawsand well-known values so that it cannot be disputed as theupper limit to production. For this reason, several efficien-cies that reasonably cannot be 100% have been conserva-tively included in the calculation as 100% because a valuehas not yet been well established. Thus, the calculatedtheoretical maximum yield is not dependent on estimatesthat could easily change depending on new experimentalresults or species. In contrast, optimistic estimates of knownphenomena are included in the best case because theintention is to provide an optimistic production goal.
The equation to calculate total yield for both thetheoretical and best cases is identical. The calculationsdiffer only due to different values used for the two cases.The equation includes 11 terms and gives annual productionyield, in volume∙area−1∙year−1 of unrefined oil. Severalsubsets of the terms produce other metrics of note. The firstthree terms combined result in total photons of averageenergy in the photosynthetically active portion of thespectrum. Terms 3, 6, and 7 combined result in maximumphotosynthetic efficiency, which is a measure of energystored as biomass per incident solar energy. The first nineterms combined result in growth rate, given as mass∙area−1∙-day−1 of biomass.
Term 1: Full-spectrum Solar Energy
The term full-spectrum solar energy (Efull-spectrum) repre-sents the total solar irradiance incident on the algalproduction system. The solar spectrum is a function ofatmospheric conditions (including clouds, aerosols, ozone,and other gases), which affect both the magnitude and
spectral distribution of solar irradiance that reaches theearth’s surface.
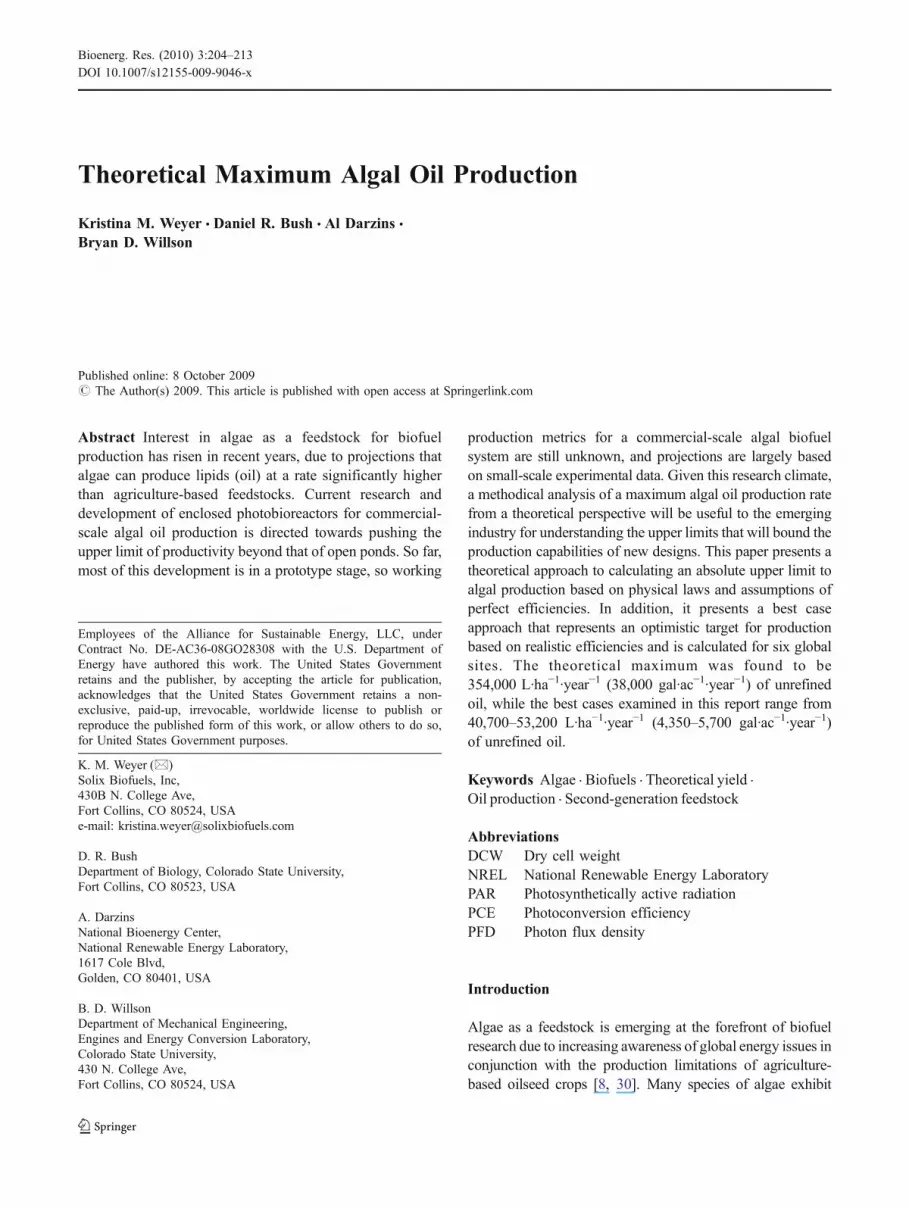
For the theoretical case, total solar irradiance wascalculated assuming year-round clear skies and minimalatmospheric absorption. With these assumptions, theoreti-cally maximum total solar irradiance is a function oflatitude alone, shown in Fig. 1 for sea level. Calculationsfor this graph used the Bird Clear Sky Model [4], with thefollowing inputs for minimal atmospheric absorption:0.05 cm total column ozone thickness, 0.01 cm totalcolumn water vapor thickness, 0.02 aerosol optical depthat 500 nm, and 0.1 aerosol optical depth at 380 nm.
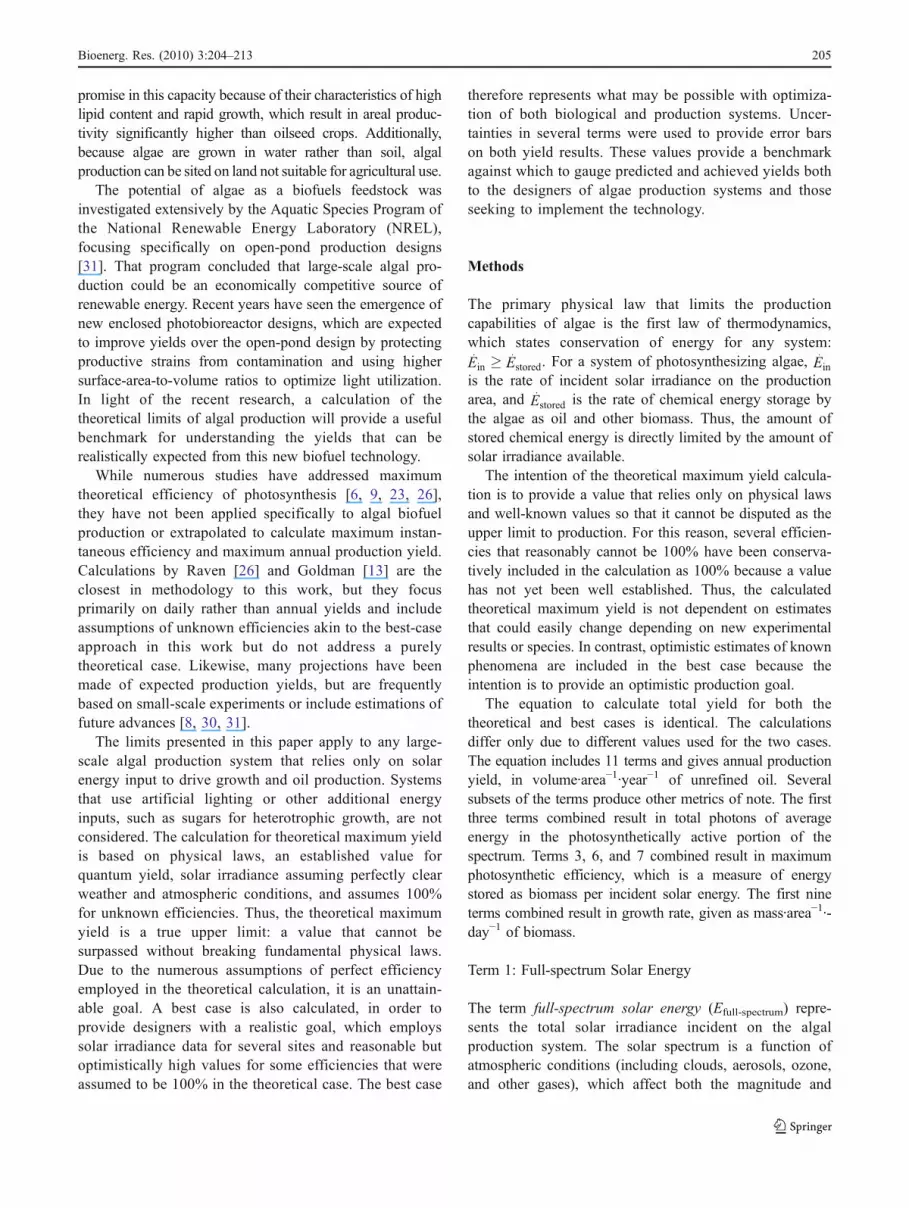
For the best case, total solar irradiance was calculatedusing weather data for six global climates, because the actualamount of irradiance is greatly reduced from the theoreticalby clouds and other absorptive atmospheric conditions.Weather data that represents typical conditions were usedfrom the Department of Energy’s EnergyPlus weather dataset [33]. The six sites and their latitudes are Denver,Colorado (40°N); Phoenix, Arizona (33°N); Honolulu,Hawaii (21°N); Kuala Lumpur, Malaysia (3°N); Tel Aviv,Israel (32°N); and Màlaga, Spain (37°N). Figure 2 shows acomparison of theoretical and actual values on an annual
basis. As this figure shows, solar irradiance is stronglydependent on the climate, not only latitude. For example,Phoenix has the highest total annual solar irradiance despiteits relatively high latitude. Kuala Lumpur, close to theequator and with the highest theoretical solar irradiance, hasthe lowest actual solar irradiance.
Term 2: Photosynthetic Portion of Spectrum
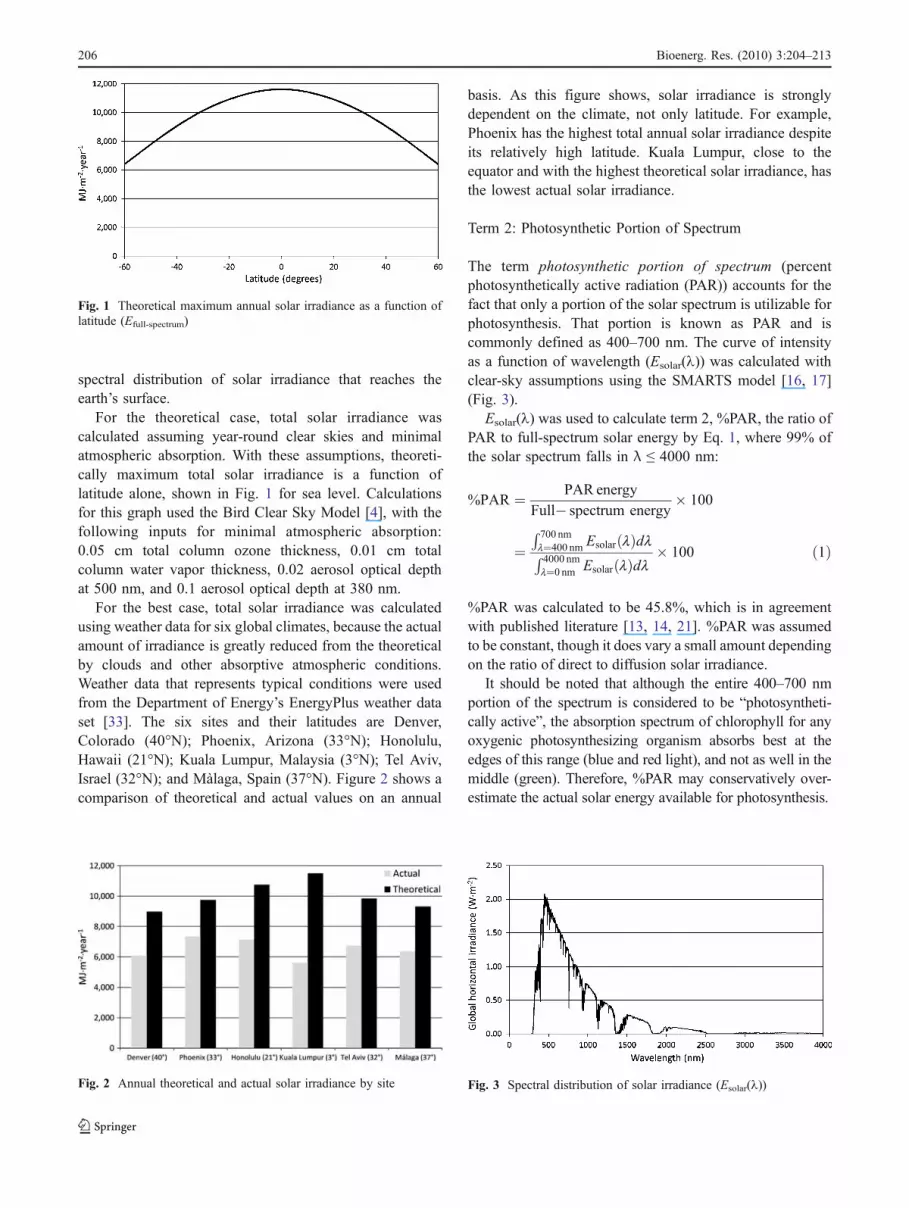
The term photosynthetic portion of spectrum (percentphotosynthetically active radiation (PAR)) accounts for thefact that only a portion of the solar spectrum is utilizable forphotosynthesis. That portion is known as PAR and iscommonly defined as 400–700 nm. The curve of intensityas a function of wavelength (Esolar(1)) was calculated withclear-sky assumptions using the SMARTS model [16, 17](Fig. 3).
Esolar(1) was used to calculate term 2, %PAR, the ratio ofPAR to full-spectrum solar energy by Eq. 1, where 99% ofthe solar spectrum falls in λ ≤ 4000 nm:
%PAR was calculated to be 45.8%, which is in agreementwith published literature [13, 14, 21]. %PAR was assumedto be constant, though it does vary a small amount dependingon the ratio of direct to diffusion solar irradiance.
It should be noted that although the entire 400–700 nmportion of the spectrum is considered to be “photosyntheti-cally active”, the absorption spectrum of chlorophyll for anyoxygenic photosynthesizing organism absorbs best at theedges of this range (blue and red light), and not as well in themiddle (green). Therefore, %PAR may conservatively over-estimate the actual solar energy available for photosynthesis.
Fig. 1 Theoretical maximum annual solar irradiance as a function oflatitude (Efull-spectrum)
Fig. 2 Annual theoretical and actual solar irradiance by site Fig. 3 Spectral distribution of solar irradiance (Esolar(1))
to number of photons. Esolar (1), calculated in term 2, wasused to calculate term 3, the wavelength-weighted averagephoton energy, Ephoton.Within the PAR range, photon energyranges from most energetic (299 kJ∙mol−1) at 400 nm (blue)to least energetic (171 kJ∙mol−1) at 700 nm (red). These arecalculated using Planck’s law (Ephoton ¼ h � c=l, where h isPlanck’s constant (6.63E-34 J∙s), c is the speed of light(2.998E8 m∙s−1), and 1 is wavelength). Ephoton wascalculated to be 225.3 kJ∙mol−1, or 0.2253 MJ∙mol−1, alsoin good agreement with published values [14, 21]. Thiscorresponds to a wavelength of 531 nm (green).
Total photon flux density (PFD) over a year can becalculated from a combination of terms 1, 2, and 3 by Eq. 2.
PFDmol
m2 � year� �
¼Efull�spectrum
MJm2�year
� �� %PAR
100
EphotonMJmol
� � ð2Þ
Term 4: Photon Transmission Efficiency
The term photon transmission efficiency accounts for lossesin incident solar energy due to the construction or geometry ofthe growth system, either an open-pond or enclosed photo-bioreactor. Light reflection or absorption by surfaces andmaterials will be minimized in an optimized design, but anydesign will have some reduction in the number of incidentphotons that reach the cells. For the theoretical case, thegrowing system was assumed to preserve total PFD, i.e., noreduction to 100% photon transmission efficiency. For thebest case, the reduction in PFD due to the growth system wasestimated for an open-pond scenario, where incident solarenergy is lost due to reflection off the open water surface.Solar geometry equations [10] were used to calculate twoparameters: reflectance off the surface based on angle ofincidence and the predicted magnitude of solar radiation(assuming no cloud cover) for any given latitude, day of year,
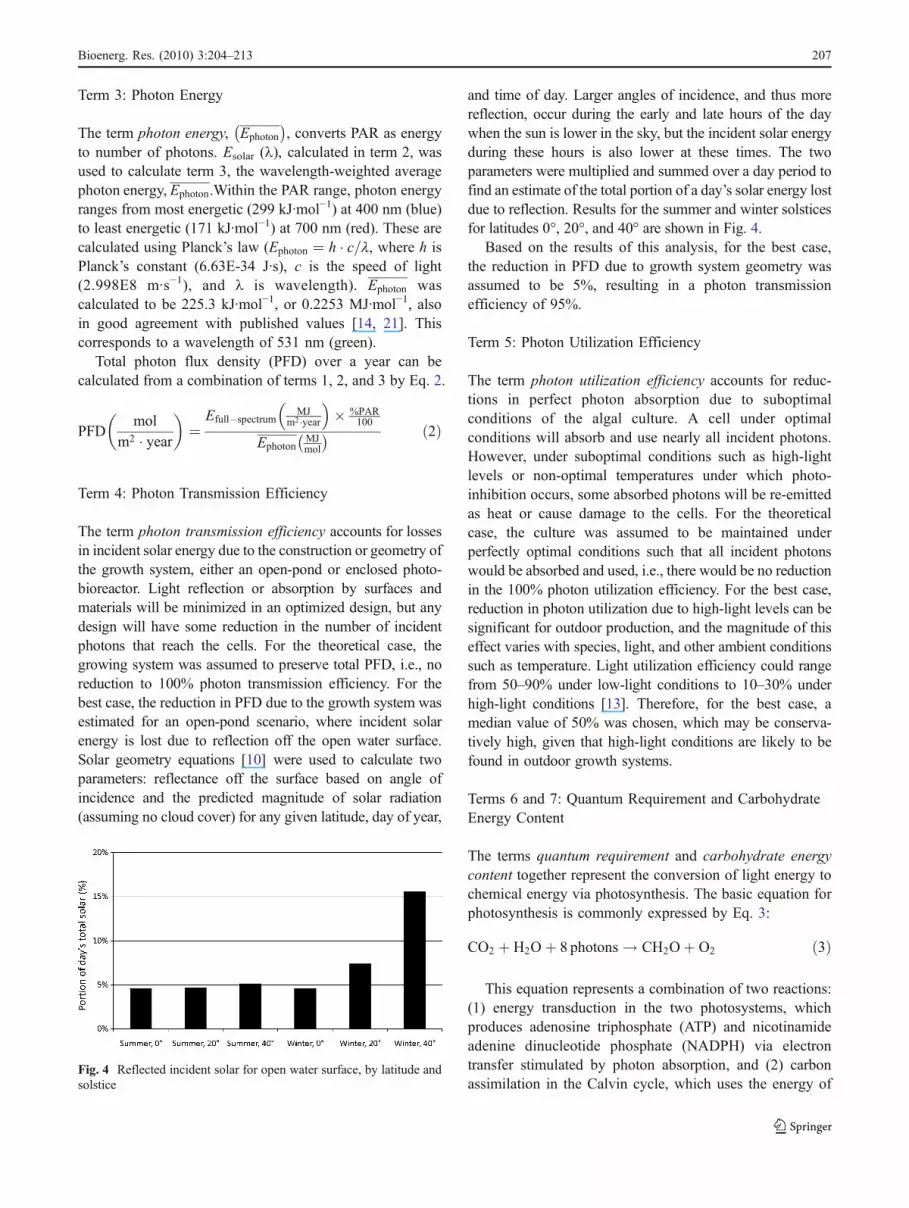
and time of day. Larger angles of incidence, and thus morereflection, occur during the early and late hours of the daywhen the sun is lower in the sky, but the incident solar energyduring these hours is also lower at these times. The twoparameters were multiplied and summed over a day period tofind an estimate of the total portion of a day’s solar energy lostdue to reflection. Results for the summer and winter solsticesfor latitudes 0°, 20°, and 40° are shown in Fig. 4.
Based on the results of this analysis, for the best case,the reduction in PFD due to growth system geometry wasassumed to be 5%, resulting in a photon transmissionefficiency of 95%.
Term 5: Photon Utilization Efficiency
The term photon utilization efficiency accounts for reduc-tions in perfect photon absorption due to suboptimalconditions of the algal culture. A cell under optimalconditions will absorb and use nearly all incident photons.However, under suboptimal conditions such as high-lightlevels or non-optimal temperatures under which photo-inhibition occurs, some absorbed photons will be re-emittedas heat or cause damage to the cells. For the theoreticalcase, the culture was assumed to be maintained underperfectly optimal conditions such that all incident photonswould be absorbed and used, i.e., there would be no reductionin the 100% photon utilization efficiency. For the best case,reduction in photon utilization due to high-light levels can besignificant for outdoor production, and the magnitude of thiseffect varies with species, light, and other ambient conditionssuch as temperature. Light utilization efficiency could rangefrom 50–90% under low-light conditions to 10–30% underhigh-light conditions [13]. Therefore, for the best case, amedian value of 50% was chosen, which may be conserva-tively high, given that high-light conditions are likely to befound in outdoor growth systems.
Terms 6 and 7: Quantum Requirement and CarbohydrateEnergy Content
The terms quantum requirement and carbohydrate energycontent together represent the conversion of light energy tochemical energy via photosynthesis. The basic equation forphotosynthesis is commonly expressed by Eq. 3:
CO2 þ H2Oþ 8 photons ! CH2Oþ O2 ð3Þ
This equation represents a combination of two reactions:(1) energy transduction in the two photosystems, whichproduces adenosine triphosphate (ATP) and nicotinamideadenine dinucleotide phosphate (NADPH) via electrontransfer stimulated by photon absorption, and (2) carbonassimilation in the Calvin cycle, which uses the energy of
Fig. 4 Reflected incident solar for open water surface, by latitude andsolstice
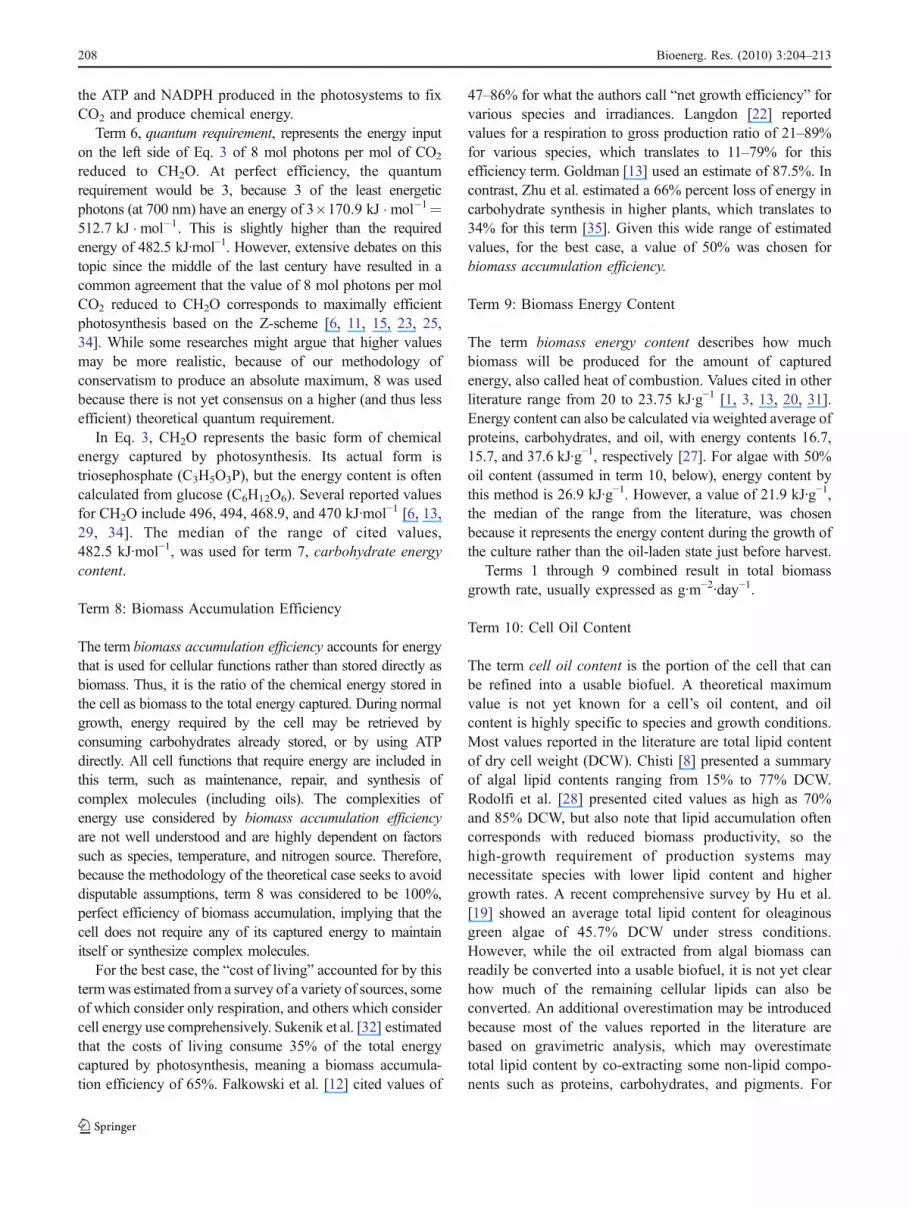
the ATP and NADPH produced in the photosystems to fixCO2 and produce chemical energy.
Term 6, quantum requirement, represents the energy inputon the left side of Eq. 3 of 8 mol photons per mol of CO2
reduced to CH2O. At perfect efficiency, the quantumrequirement would be 3, because 3 of the least energeticphotons (at 700 nm) have an energy of 3�170:9 kJ �mol�1¼512:7 kJ �mol�1. This is slightly higher than the requiredenergy of 482.5 kJ∙mol−1. However, extensive debates on thistopic since the middle of the last century have resulted in acommon agreement that the value of 8 mol photons per molCO2 reduced to CH2O corresponds to maximally efficientphotosynthesis based on the Z-scheme [6, 11, 15, 23, 25,34]. While some researches might argue that higher valuesmay be more realistic, because of our methodology ofconservatism to produce an absolute maximum, 8 was usedbecause there is not yet consensus on a higher (and thus lessefficient) theoretical quantum requirement.
In Eq. 3, CH2O represents the basic form of chemicalenergy captured by photosynthesis. Its actual form istriosephosphate (C3H5O3P), but the energy content is oftencalculated from glucose (C6H12O6). Several reported valuesfor CH2O include 496, 494, 468.9, and 470 kJ∙mol−1 [6, 13,29, 34]. The median of the range of cited values,482.5 kJ∙mol−1, was used for term 7, carbohydrate energycontent.
Term 8: Biomass Accumulation Efficiency
The term biomass accumulation efficiency accounts for energythat is used for cellular functions rather than stored directly asbiomass. Thus, it is the ratio of the chemical energy stored inthe cell as biomass to the total energy captured. During normalgrowth, energy required by the cell may be retrieved byconsuming carbohydrates already stored, or by using ATPdirectly. All cell functions that require energy are included inthis term, such as maintenance, repair, and synthesis ofcomplex molecules (including oils). The complexities ofenergy use considered by biomass accumulation efficiencyare not well understood and are highly dependent on factorssuch as species, temperature, and nitrogen source. Therefore,because the methodology of the theoretical case seeks to avoiddisputable assumptions, term 8 was considered to be 100%,perfect efficiency of biomass accumulation, implying that thecell does not require any of its captured energy to maintainitself or synthesize complex molecules.
For the best case, the “cost of living” accounted for by thistermwas estimated from a survey of a variety of sources, someof which consider only respiration, and others which considercell energy use comprehensively. Sukenik et al. [32] estimatedthat the costs of living consume 35% of the total energycaptured by photosynthesis, meaning a biomass accumula-tion efficiency of 65%. Falkowski et al. [12] cited values of
47–86% for what the authors call “net growth efficiency” forvarious species and irradiances. Langdon [22] reportedvalues for a respiration to gross production ratio of 21–89%for various species, which translates to 11–79% for thisefficiency term. Goldman [13] used an estimate of 87.5%. Incontrast, Zhu et al. estimated a 66% percent loss of energy incarbohydrate synthesis in higher plants, which translates to34% for this term [35]. Given this wide range of estimatedvalues, for the best case, a value of 50% was chosen forbiomass accumulation efficiency.
Term 9: Biomass Energy Content
The term biomass energy content describes how muchbiomass will be produced for the amount of capturedenergy, also called heat of combustion. Values cited in otherliterature range from 20 to 23.75 kJ∙g−1 [1, 3, 13, 20, 31].Energy content can also be calculated via weighted average ofproteins, carbohydrates, and oil, with energy contents 16.7,15.7, and 37.6 kJ∙g−1, respectively [27]. For algae with 50%oil content (assumed in term 10, below), energy content bythis method is 26.9 kJ∙g−1. However, a value of 21.9 kJ∙g−1,the median of the range from the literature, was chosenbecause it represents the energy content during the growth ofthe culture rather than the oil-laden state just before harvest.
Terms 1 through 9 combined result in total biomassgrowth rate, usually expressed as g∙m−2∙day−1.
Term 10: Cell Oil Content
The term cell oil content is the portion of the cell that canbe refined into a usable biofuel. A theoretical maximumvalue is not yet known for a cell’s oil content, and oilcontent is highly specific to species and growth conditions.Most values reported in the literature are total lipid contentof dry cell weight (DCW). Chisti [8] presented a summaryof algal lipid contents ranging from 15% to 77% DCW.Rodolfi et al. [28] presented cited values as high as 70%and 85% DCW, but also note that lipid accumulation oftencorresponds with reduced biomass productivity, so thehigh-growth requirement of production systems maynecessitate species with lower lipid content and highergrowth rates. A recent comprehensive survey by Hu et al.[19] showed an average total lipid content for oleaginousgreen algae of 45.7% DCW under stress conditions.However, while the oil extracted from algal biomass canreadily be converted into a usable biofuel, it is not yet clearhow much of the remaining cellular lipids can also beconverted. An additional overestimation may be introducedbecause most of the values reported in the literature arebased on gravimetric analysis, which may overestimatetotal lipid content by co-extracting some non-lipid compo-nents such as proteins, carbohydrates, and pigments. For
this work, 50% oil content was chosen for both thetheoretical and best cases, though it is acknowledged thismay be an overestimate of what will be achievable forproduction systems for the reasons stated above.
Term 11: Oil Density
The term oil density is the volumetric density of theunrefined oil. This term converts the mass of oil producedto a volume measurement. Because algal oil is a relativelynew commodity, not much data exist for its physicalproperties. Therefore, the density of soybean oil, which issimilar to algal oil, was used. The density of soybean oilwas taken to be 918 Kg∙m−3, with a range of 910–925 Kg∙m−3 [5] for both the theoretical and best cases.
Results
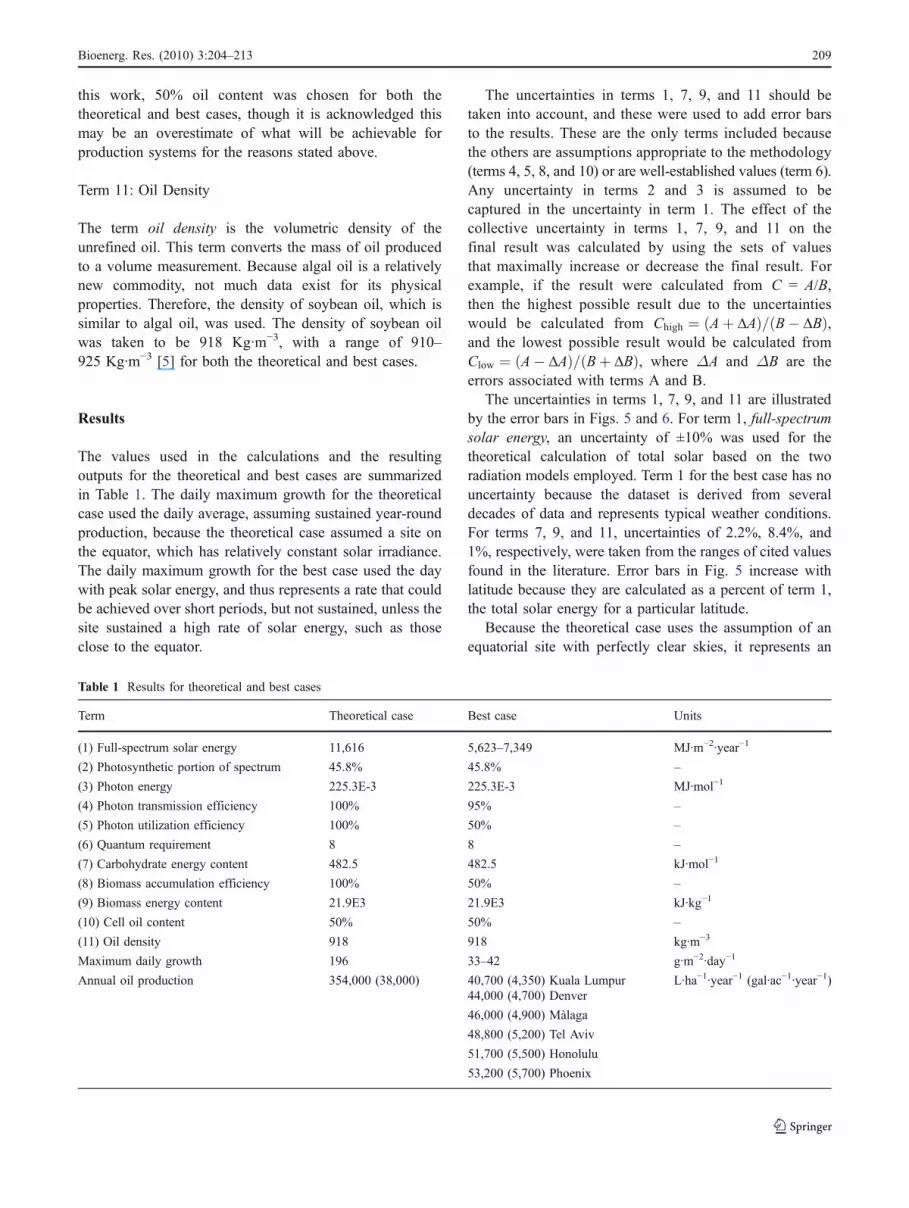
The values used in the calculations and the resultingoutputs for the theoretical and best cases are summarizedin Table 1. The daily maximum growth for the theoreticalcase used the daily average, assuming sustained year-roundproduction, because the theoretical case assumed a site onthe equator, which has relatively constant solar irradiance.The daily maximum growth for the best case used the daywith peak solar energy, and thus represents a rate that couldbe achieved over short periods, but not sustained, unless thesite sustained a high rate of solar energy, such as thoseclose to the equator.
The uncertainties in terms 1, 7, 9, and 11 should betaken into account, and these were used to add error barsto the results. These are the only terms included becausethe others are assumptions appropriate to the methodology(terms 4, 5, 8, and 10) or are well-established values (term 6).Any uncertainty in terms 2 and 3 is assumed to becaptured in the uncertainty in term 1. The effect of thecollective uncertainty in terms 1, 7, 9, and 11 on thefinal result was calculated by using the sets of valuesthat maximally increase or decrease the final result. Forexample, if the result were calculated from C = A/B,then the highest possible result due to the uncertaintieswould be calculated from Chigh ¼ Aþ $Að Þ= B� $Bð Þ,and the lowest possible result would be calculated fromClow ¼ A� $Að Þ= Bþ $Bð Þ, where ΔA and ΔB are theerrors associated with terms A and B.
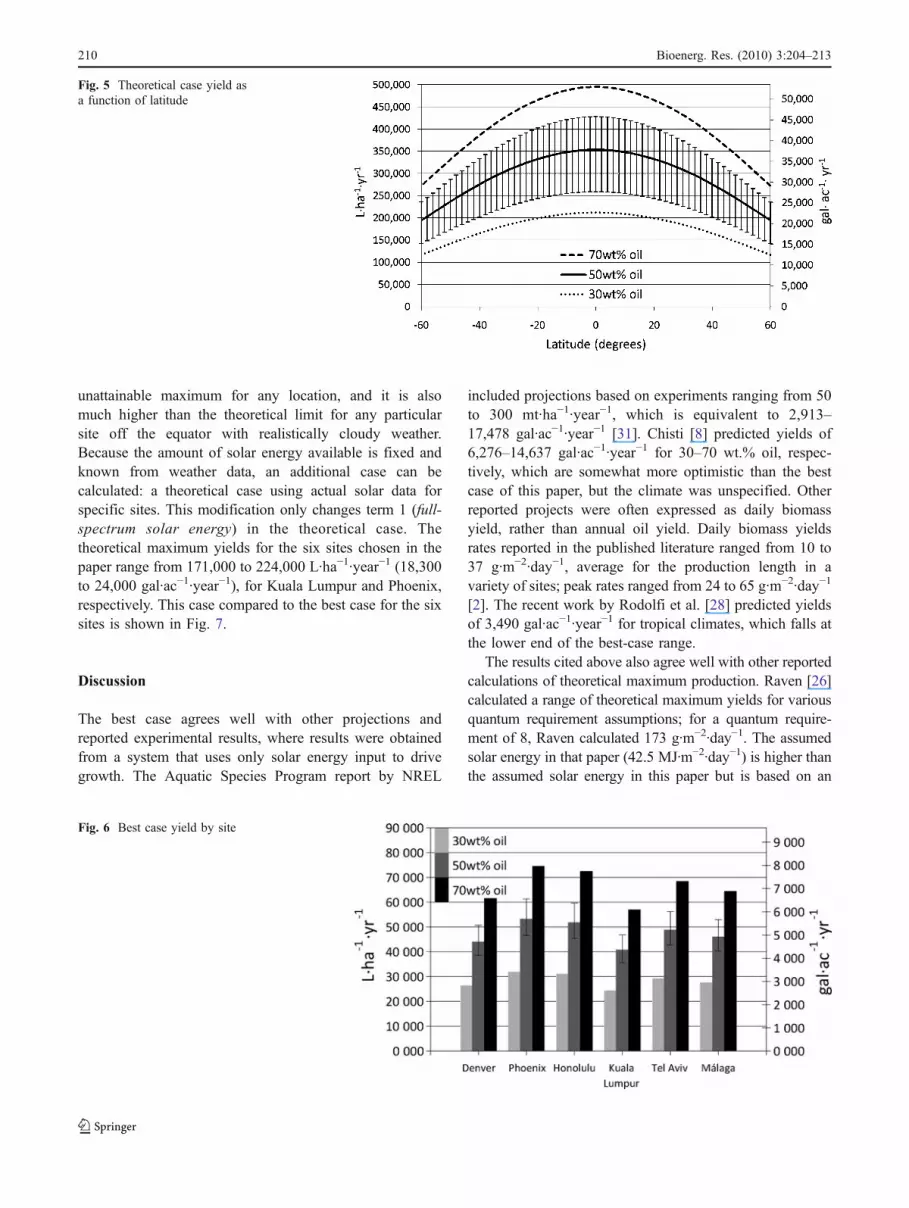
The uncertainties in terms 1, 7, 9, and 11 are illustratedby the error bars in Figs. 5 and 6. For term 1, full-spectrumsolar energy, an uncertainty of ±10% was used for thetheoretical calculation of total solar based on the tworadiation models employed. Term 1 for the best case has nouncertainty because the dataset is derived from severaldecades of data and represents typical weather conditions.For terms 7, 9, and 11, uncertainties of 2.2%, 8.4%, and1%, respectively, were taken from the ranges of cited valuesfound in the literature. Error bars in Fig. 5 increase withlatitude because they are calculated as a percent of term 1,the total solar energy for a particular latitude.
Because the theoretical case uses the assumption of anequatorial site with perfectly clear skies, it represents an
Table 1 Results for theoretical and best cases
Term Theoretical case Best case Units
(1) Full-spectrum solar energy 11,616 5,623–7,349 MJ∙m−2∙year−1
(2) Photosynthetic portion of spectrum 45.8% 45.8% –
(3) Photon energy 225.3E-3 225.3E-3 MJ∙mol−1
(4) Photon transmission efficiency 100% 95% –
(5) Photon utilization efficiency 100% 50% –
(6) Quantum requirement 8 8 –
(7) Carbohydrate energy content 482.5 482.5 kJ∙mol−1
(8) Biomass accumulation efficiency 100% 50% –
(9) Biomass energy content 21.9E3 21.9E3 kJ∙kg−1
(10) Cell oil content 50% 50% –
(11) Oil density 918 918 kg∙m−3
Maximum daily growth 196 33–42 g∙m−2∙day−1
Annual oil production 354,000 (38,000) 40,700 (4,350) Kuala Lumpur L∙ha−1∙year−1 (gal∙ac−1∙year−1)44,000 (4,700) Denver
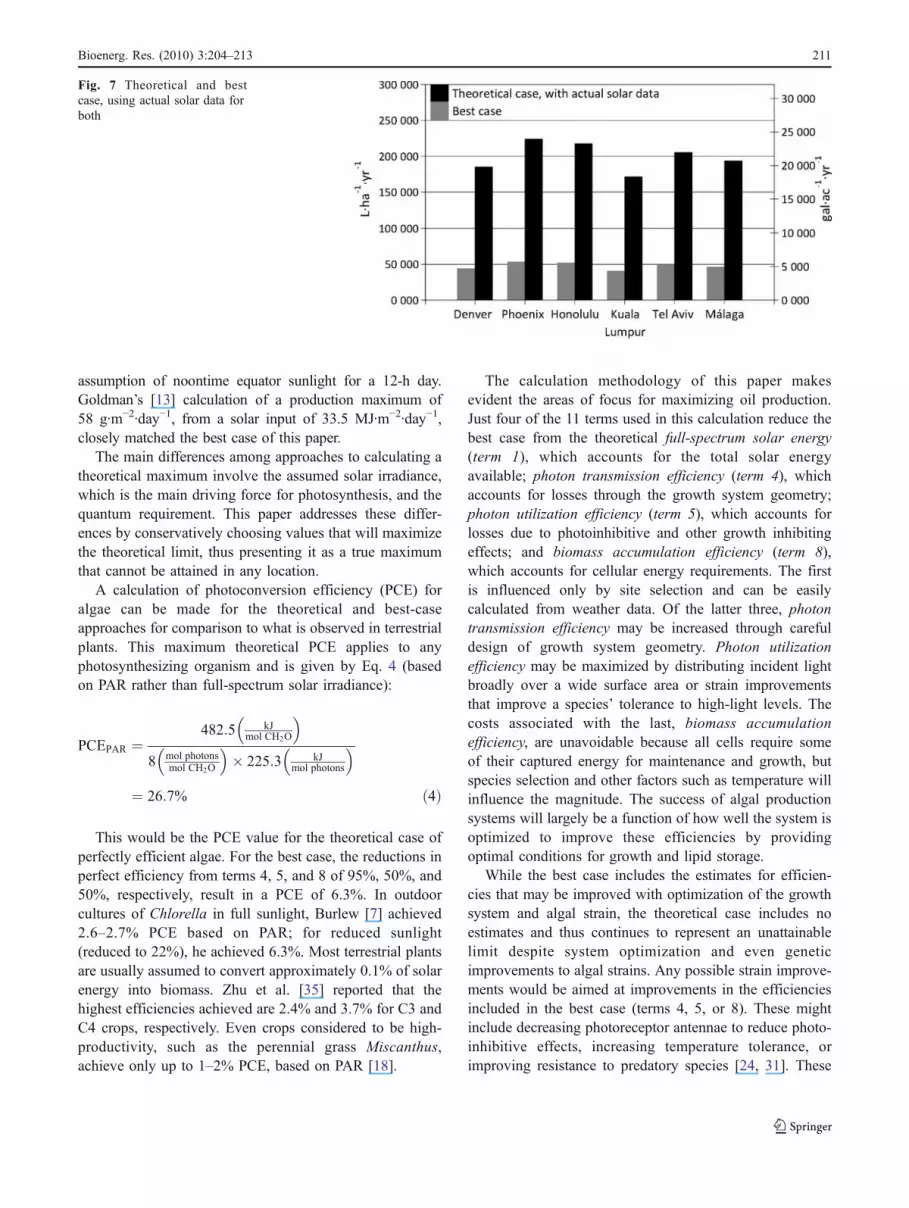
unattainable maximum for any location, and it is alsomuch higher than the theoretical limit for any particularsite off the equator with realistically cloudy weather.Because the amount of solar energy available is fixed andknown from weather data, an additional case can becalculated: a theoretical case using actual solar data forspecific sites. This modification only changes term 1 (full-spectrum solar energy) in the theoretical case. Thetheoretical maximum yields for the six sites chosen in thepaper range from 171,000 to 224,000 L·ha−1·year−1 (18,300to 24,000 gal·ac−1·year−1), for Kuala Lumpur and Phoenix,respectively. This case compared to the best case for the sixsites is shown in Fig. 7.
Discussion
The best case agrees well with other projections andreported experimental results, where results were obtainedfrom a system that uses only solar energy input to drivegrowth. The Aquatic Species Program report by NREL
included projections based on experiments ranging from 50to 300 mt∙ha−1∙year−1, which is equivalent to 2,913–17,478 gal∙ac−1∙year−1 [31]. Chisti [8] predicted yields of6,276–14,637 gal∙ac−1∙year−1 for 30–70 wt.% oil, respec-tively, which are somewhat more optimistic than the bestcase of this paper, but the climate was unspecified. Otherreported projects were often expressed as daily biomassyield, rather than annual oil yield. Daily biomass yieldsrates reported in the published literature ranged from 10 to37 g∙m−2∙day−1, average for the production length in avariety of sites; peak rates ranged from 24 to 65 g∙m−2∙day−1
[2]. The recent work by Rodolfi et al. [28] predicted yieldsof 3,490 gal∙ac−1∙year−1 for tropical climates, which falls atthe lower end of the best-case range.
The results cited above also agree well with other reportedcalculations of theoretical maximum production. Raven [26]calculated a range of theoretical maximum yields for variousquantum requirement assumptions; for a quantum require-ment of 8, Raven calculated 173 g∙m−2∙day−1. The assumedsolar energy in that paper (42.5 MJ∙m−2∙day−1) is higher thanthe assumed solar energy in this paper but is based on an
Fig. 5 Theoretical case yield asa function of latitude
assumption of noontime equator sunlight for a 12-h day.Goldman’s [13] calculation of a production maximum of58 g∙m−2∙day−1, from a solar input of 33.5 MJ∙m−2∙day−1,closely matched the best case of this paper.
The main differences among approaches to calculating atheoretical maximum involve the assumed solar irradiance,which is the main driving force for photosynthesis, and thequantum requirement. This paper addresses these differ-ences by conservatively choosing values that will maximizethe theoretical limit, thus presenting it as a true maximumthat cannot be attained in any location.
A calculation of photoconversion efficiency (PCE) foralgae can be made for the theoretical and best-caseapproaches for comparison to what is observed in terrestrialplants. This maximum theoretical PCE applies to anyphotosynthesizing organism and is given by Eq. 4 (basedon PAR rather than full-spectrum solar irradiance):
PCEPAR ¼482:5 kJ
mol CH2O
� �
8 mol photonsmol CH2O
� �� 225:3 kJ
mol photons
� �
¼ 26:7% ð4Þ
This would be the PCE value for the theoretical case ofperfectly efficient algae. For the best case, the reductions inperfect efficiency from terms 4, 5, and 8 of 95%, 50%, and50%, respectively, result in a PCE of 6.3%. In outdoorcultures of Chlorella in full sunlight, Burlew [7] achieved2.6–2.7% PCE based on PAR; for reduced sunlight(reduced to 22%), he achieved 6.3%. Most terrestrial plantsare usually assumed to convert approximately 0.1% of solarenergy into biomass. Zhu et al. [35] reported that thehighest efficiencies achieved are 2.4% and 3.7% for C3 andC4 crops, respectively. Even crops considered to be high-productivity, such as the perennial grass Miscanthus,achieve only up to 1–2% PCE, based on PAR [18].
The calculation methodology of this paper makesevident the areas of focus for maximizing oil production.Just four of the 11 terms used in this calculation reduce thebest case from the theoretical full-spectrum solar energy(term 1), which accounts for the total solar energyavailable; photon transmission efficiency (term 4), whichaccounts for losses through the growth system geometry;photon utilization efficiency (term 5), which accounts forlosses due to photoinhibitive and other growth inhibitingeffects; and biomass accumulation efficiency (term 8),which accounts for cellular energy requirements. The firstis influenced only by site selection and can be easilycalculated from weather data. Of the latter three, photontransmission efficiency may be increased through carefuldesign of growth system geometry. Photon utilizationefficiency may be maximized by distributing incident lightbroadly over a wide surface area or strain improvementsthat improve a species’ tolerance to high-light levels. Thecosts associated with the last, biomass accumulationefficiency, are unavoidable because all cells require someof their captured energy for maintenance and growth, butspecies selection and other factors such as temperature willinfluence the magnitude. The success of algal productionsystems will largely be a function of how well the system isoptimized to improve these efficiencies by providingoptimal conditions for growth and lipid storage.
While the best case includes the estimates for efficien-cies that may be improved with optimization of the growthsystem and algal strain, the theoretical case includes noestimates and thus continues to represent an unattainablelimit despite system optimization and even geneticimprovements to algal strains. Any possible strain improve-ments would be aimed at improvements in the efficienciesincluded in the best case (terms 4, 5, or 8). These mightinclude decreasing photoreceptor antennae to reduce photo-inhibitive effects, increasing temperature tolerance, orimproving resistance to predatory species [24, 31]. These
Fig. 7 Theoretical and bestcase, using actual solar data forboth
effects are already assumed to be nonexistent in thetheoretical case.
Despite any discrepancies among approaches, all estimatesaffirm the productive potential of algae as a biofuel feedstock.The lowest projection in this paper, 40,700 L∙ha−1∙year−1
(4,350 gal∙ac−1∙year−1) for Kuala Lumpur, is drasticallyhigher than reported yields for corn, canola, or even oilpalm (172, 1190, and 5,950 L∙ha−1∙year−1; 18, 127, and637 gal∙ac−1∙year−1, respectively) [8]. Thus, the bounds onalgal production presented in this paper should not beviewed as unpleasant news about physical realities but asa realistic check that confirms its potential and will servethe industry in its pursuit of maximum algal biofuelproduction.
Conclusion
A process of employing basic physical laws, known values,and conservative assumptions has resulted in a robustcalculation of theoretical maximum and best case algal oilyields. For the theoretical case on the equator with 50% celloil content, the theoretical maximum annual oil productionfrom algae was calculated to be 354,000 L·ha−1·year−1
(38,000 gal·ac−1·year−1) with an uncertainty of roughly10%. The best case was calculated to range from 40,700–53,200 L·ha−1·year−1 (4,350 to 5,700 gal·ac−1·year−1).
The equations, calculations, and discussion in this paperhave shown that, because physical laws dictate the theoreticalmaximum, it represents a true upper limit to production thatcannot be attained regardless of new technology advances.However, if algal biofuel production systems approach even afraction of the calculated theoretical maximum, they will beextremely productive compared to current oil productioncapability of agriculture-based biofuels.
Acknowledgements The authors acknowledge the following indi-viduals for their critical review of the manuscript: Michael Seibert,Eric Jarvis, Lieve Laurens (National Renewable Energy Laboratory),and Matthew Posewitz (Colorado School of Mines).
Open Access This article is distributed under the terms of theCreative Commons Attribution Noncommercial License which per-mits any noncommercial use, distribution, and reproduction in anymedium, provided the original author(s) and source are credited.
References
1. Acièn Fernández F-G, Garcìa Camacho F, Sànchez Pérez J-A,Fernàndez Sevilla J-M, Molina Grima E (1998) Modeling ofbiomass productivity in tubular photobioreactors for microalgalcultures: effects of dilution rate, tube diameter, and solarirradiance. Biotechnol Bioeng 58(6):605–616
2. Becker E-W (1994) Microalgae: biotechnology and microbiology.Cambridge University Press, Cambridge
3. Ben-Amotz A (2007) Biofuel and CO2 capture by algae. Paperpresented at the Algae Biomass Summit, San Francisco, 15 Nov2007
4. Bird R-E, Hulstrom R-L (1981) Simplified clear sky model fordirect and diffuse insolation on horizontal surfaces. TechnicalReport No. SERI/TR-642-761. Solar Energy Research Institute
5. BockischM (1998) Fats and oils handbook. AOCS Press, Champaign6. Bolton J, Hall D (1991) The maximum efficiency of photosyn-
thesis. Photochem Photobiol 53(4):545–5487. Burlew J-S (1953) Algal culture: from laboratory to pilot plant.
Carnegie Institution of Washington Publication, WashingtonDC
8. Chisti Y (2007) Biodiesel from microalgae. Biotechnol Adv25:294–306
9. Cornet J-F, Dussap C-G, Gros J-B (1994) Conversion of radiantlight energy in photobioreactors. AIChE J 40(6):1055–1066
10. Duffie J-A, Beckman W-A (2006) Solar engineering of thermalprocesses. Wiley, Hoboken
12. Falkowski P-G, Dubinsky Z, Wyman K (1985) Growth-irradiance relationships in phytoplankton. Limnol Oceanogr30(2):311–321
13. Goldman J (1979) Outdoor algal mass cultures—II. Photosyn-thetic yield limitations. Water Res 13:119–136
14. González J-A, Calbó J (2002) Modelled and measured ratio ofPAR to global radiation under cloudless skies. Agric For Meteorol110:319–325
15. Govindjee R, Rabinowitch E, Govindjee (1968) Maximumquantum yield and action spectrum of photosynthesis andfluorescence in Chlorella. Biochim Biophys Acta 162:539–544
16. Gueymard C (1995) SMARTS, a simple model of the atmosphericradiative transfer of sunshine: algorithms and performanceassessment. Professional Paper FSEC-PF-270-95. Florida SolarEnergy Center
17. Gueymard C (2001) Parameterized transmittance model for directbeam and circumsolar spectral irradiance. Sol Energy 71(5):325–346
18. Heaton E-A, Dohleman F-G, Long S-P (2008) Meeting US biofuelgoals with less land: the potential ofMiscanthus. Glob Chang Biol14:2000–2014
19. Hu Q, Sommerfield M, Jarvis E, Ghirardi M, Posewitz M, SeibertM et al (2008) Microalgal triacylglycerols as feedstocks forbiofuel production: perspectives and advances. Plant J 54:621–639
20. Huntley M, Redalje D (2006) CO2 mitigation and renewable oilfrom photosynthetic microbes: a new appraisal. Mitig AdaptStrategies Glob Chang 12(4):573–608
21. Jacovides C-P, Timvios F-S, Papaioannou G, Asimakopoulos D-N, Theofilou C-M (2004) Ratio of PAR to broadband solarradiation measured in Cyprus. Agric For Meteorol 121:135–140
22. Langdon C (1993) The significance of respiration in productionmeasurements based on oxygen. ICES Mar Sci Symp 197:69–78
24. Melis A, Neidhardt J, Benemann J-R (1999) Dunaliella salina(Chlorophyta) with small chlorophyll antenna sizes exhibit higherphotosynthetic productivities and photon use efficiencies thannormally pigmented cells. J Appl Phycol 10:515–525
25. Raven J-A (1974) Photosynthetic electron flow and photophos-phorylation. In: Stewart W-D-P (ed) Algal physiology andbiochemistry. University of California Press, Berkeley
28. Rodolfi L, Zittelli G-C, Bassi N, Padovani G, Biondi N, Bonini Get al (2008) Microalgae for oil: strain selection, induction of lipidsynthesis and outdoor mass cultivation in a low-cost photo-bioreactor. Biotechnol Bioeng 102(1):100–112
29. Ryther J-H (1959) Potential productivity of the sea. Science130:602–608
30. Schenk P, Thomas-Hall S, Stephens E, Marx U, Mussgnug J,Posten C et al (2008) Second generation biofuels: high-efficiencymicroalgae for biodiesel production. Bioenergy Res 1:20–43
31. Sheehan J, Dunahay T, Benemann J, Roessler P (1998) Look backat the U.S. Department of Energy’s Aquatic Species Program:biodiesel from algae; Close-Out Report. NREL Report No. TP-580-24190
32. Sukenik A, Levy R-S, Levy Y, Falkowski P-G, Dubinsky Z(1991) Optimizing algal biomass production in an outdoor pond: asimulation model. J Appl Phycol 3:191–201
33. U.S. Department of Energy (2009) EnergyPlus Weather Data.http://apps1.eere.energy.gov/buildings/energyplus/cfm/weather_data.cfm. Cited 30 Jul 2009
34. Walker D (1992) Energy, plants and man. Packard PublishingLimited, East Sussex
35. Zhu X, Long S, Ort D (2008) What is the maximum efficiencywith which photosynthesis can convert solar energy into biomass?Curr Opin Biotechnol 19:153–159