Kueppers et al. Journal of Applied Volcanology 2014, 3:4http://www.appliedvolc.com/content/3/1/4
RESEARCH Open Access
The thermal stability of Eyjafjallajökull ash versusturbine ingestion test sandsUlrich Kueppers1*, Corrado Cimarelli1, Kai-Uwe Hess1, Jacopo Taddeucci2, Fabian B Wadsworth1
and Donald B Dingwell1
Abstract
The 2010 eruption of Eyjafjallajökull (Iceland) and the 2011 eruptions of Grimsvötn (Iceland), Cordon Caulle (Chile) andNabro (Ethiopia) have drastically heightened the level of awareness in the general population of how volcanic activitycan affect everyday life by disrupting air travel. The ingestion of airborne volcanic matter into jet turbines may causeharm by (1) abrasion of engine parts, (2) destabilisation of the fuel/air mix and its dynamics and (3) by melting andsintering ash onto engine parts. To investigate the behaviour of volcanic ash upon reheating, we have performedexperiments at ten temperature steps between 700 and 1600°C on (1) fresh volcanic ash from the final explosive phaseof the 2010 Eyjafjallajökull (EYJA) eruption and (2) two standard materials used in ingestion tests in the history ofturbine testing (MIL E 5007C test sand, MIL; Arizona Test Dust, ATD). We confirm expected large differences in thesamples’ response to thermal treatment. We quantify the physical basis for these differences using thermogravimetryand differential scanning calorimetry. Glassy volcanic ash softens at temperatures that are considerably lower thanthose required for crystalline silicates to start to melt. We find that volcanic ash starts softening at temperatures as lowas 600°C and that complete sintering takes place at temperatures as low as 1050°C. Accordingly, the ingestion ofvolcanic ash in the hot zone of turbines will rather efficiently transform the angular volcanic particles into stickydroplets with a high potential of adhering to surfaces. These experiments demonstrate both a large variability in thematerial properties of ash from Eyjafjallajökull volcano and a strong contrast to the behaviour of the test sands. In lightof these differences, the application in volcanic crises of models of the impact of ash on operability of passenger jetturbines that have been based on test sand calibrations must be re-evaluated. We stress as well that ingestion testsshould not only investigate the turbine’s response to ash concentration (g/m3) but also to ash dosage.
BackgroundFor many years, the civil aviation authorities have primarilybeen concerned with localised ash plumes (Guffanti et al.2010). The year 2010 however marked a dramatic turningpoint in our perception of associated risks. Beginning withmild explosive activity on the snow-covered eastern flank,the vent position of the Eyjafjallajökull eruption changed towithin the glacier-covered summit caldera, causing amarked increase in eruption explosivity (Gudmundssonet al. 2012). The prevailing winds transported the vol-canic ash over large areas of the Northern hemisphere
* Correspondence: [email protected] & Environmental Sciences, Ludwig-Maximilians-Universität München,Theresienstr. 41, 80333 Munich, GermanyFull list of author information is available at the end of the article
and, soon after the eruption onset, caused widespreadairport closure in Northern and Central Europe. Thedramatic extent of the disruption stemmed from the“zero ash tolerance” guideline followed by decision-makers at the time of the Eyjafjallajökull eruption. Thisguideline (Miller and Casadevall 2000; International CivilAviation Organization [ICAO] 2007) had been imple-mented by the International Civil Aviation Organization[ICAO] after the 1982 Galunggung (Indonesia) and 1989Redoubt (USA) incidents (Guffanti et al. 2010; Dunn2012), based on the Proceedings of the First InternationalSymposium on Volcanic Ash, held in Seattle, Washington,in July 1991 (Casadevall 1994). This rule had been widelyaccepted by all legal authorities and airline companies, aswell as airplane and turbine manufacturers. During the
is an open access article distributed under the terms of the Creative Commonsg/licenses/by/2.0), which permits unrestricted use, distribution, and reproductionroperly cited.
Kueppers et al. Journal of Applied Volcanology Page 2 of 112014, 3:4http://www.appliedvolc.com/content/3/1/4
Eyjafjallajökull eruption, the combination of eruption dur-ation, meteorological situation and area of airspace closurelead to substantial economic loss, which was not restrictedto airline and airport companies (Budd et al. 2011) butalso affected industrial activities and goods production.The increasing duration of airspace closure and the
consequent magnitude of economic loss and logisticalproblems created an increasing reticence towards theimposed flight ban on the part of the airline and cargocompanies. However, the rigid implementation of the“zero ash tolerance” guideline undoubtedly avoidedhazardous ash encounters. While in-flight ash detectionis still a complicated task (Prata and Tupper 2009), air-space contamination by volcanic ash at the time of theEyjafjallajökull eruption was confirmed for large areasof Europe by direct sampling (Schumann et al. 2011) orLIDAR measurements (Wiegner et al. 2012). At present,the evaluation of the hazard posed by volcanic ash tocivil aviation is impeded by 1) the absence of a techno-logy to quantify the ash concentration reliably andquickly at a high temporal and spatial resolution, 2) theinvisibility of ash even at concentrations above thecurrently accepted threshold of 2 mg/m3 (e.g., at nightor when overcast; Weinzierl et al. 2012). Recently, theapparent problem of visual detection of volcanic ash(Weinzierl et al. 2012) stimulated a change in termin-ology and was implemented in the latest ICAO (2013)working paper (IAVWOPSG/7-WP/17).The “zero ash tolerance” guideline was mainly justified
by the limited knowledge about the tolerance of turbineengines to the ingestion of ash particles (Dunn and Wade1994; Dunn 2012). However, for other types of particulatematter more commonly ingested (e.g., mineral sand) flightoperations are permitted within a certain threshold ofparticle concentration. Under pressure from media andairline companies, turbine manufacturers were asked for aconcentration threshold below which safe flying condi-tions in volcanic ash could be declared possible. Thisthreshold value, currently replacing the “zero ash toler-ance” limit, is set at 2 mg/m3 (at the time of writing; e.g.,Emmott 2010) and has been empirically chosen to fallbetween known safe flying conditions in mineral sand(data from military jet turbines, e.g., Gabbard et al. 1982)and what are considered ‘dangerous’ ash concentrations,estimated by reference to ash deposition within turbinesduring the 1982 and 1989 incidents (the value of ash con-centration responsible for the Galungung accident washowever largely overestimated; pers. comm. W. Aspinall).A more quantitative assessment of the hazard posed byash ingestion into turbine engines is highly desirable.The response of turbine engines to the ingestion of dif-
ferent types of particulate matter will strongly depend ontheir chemical and physical characteristics, especially athigh temperature. Particles suspended in the atmosphere
may have very different origins, including volcanic ash,aeolian sand or incineration residues, and thus differentchemical and physical characteristics. Particle shapeimposes a strong effect on the viscous sintering rates in sofar as sintering timescales are dependent on curvature ofthe surface in contact with the substrate in a jet engine.Therefore, a particle with a high aspect ratio, whichimpacts the jet engine surface end-on, will sinter at afaster rate than a spherical particle of the same volumebecause the contact curvature is higher than the sphericalequivalent. It arises from sintering theory that particleroughness likely plays a role, albeit a less important one.The chemical composition of rocks is usually declared asa list of elements expressed as oxides. With the exceptionof natrocarbonatitic melts that also may erupt explosively(Keller et al. 2010), the major constituent in volcanic rocksis silica, SiO2. The SiO2 content, however, may reflect thecontributions of many silicate phases other than quartzcrystals. Furthermore, due to high cooling or degassingrates during eruption, volcanic ash usually contains a frac-tion of silicate glass, i.e., an amorphous phase lackinglong-range crystallographic order. Glass and crystalsbehave very differently during heating. Glass may softenand melt, deform and stick to surfaces, at temperatures aslow as 700°C. Deposition inside turbines will change theinternal aerodynamic conditions, affect the temperature ofindividual components (e.g., by clogging cooling holes),and may react chemically with the thermal-barrier coat-ing. In order to sustain the high temperatures necessaryfor increased efficiency, parts within the hot zone of theturbine rely on thermal-barrier coatings to operate attemperatures in excess of the melting point of the under-lying alloys. Crystalline silicates, in contrast, typicallyexhibit melting temperatures far higher than the glasssoftening temperature; crystalline SiO2, for example, has amelting point above 1700°C. Accordingly, the effect of ashon the operational reliability of aircraft turbines isexpected to be very different from that of any mineralsand dominated by quartz.Sintering of glass, crystals and multi-phase mixtures is a
relatively well-understood process in ceramics (Scherer1977; Scherer and Bachman 1977), physics (Frenkel 1945)and volcanology literature (Sparks et al. 1999). Sinteringbegins with the formation of necks between particles andinvolves the transition of a dominantly granular materialto a porous framework (Scherer 1977). This initial stagesintering or sticking occurs by viscous neck formation insupercooled melts (high temperature equivalent of glass)and by diffusive neck formation in crystalline material(Frenkel 1945). For a given temperature, the latter isgenerally a slower process but depends strongly on thecrystal composition and thermal stability (Zarzycki 1991;Uhlmann et al. 1975). However, in the simpler glass/meltsystem, is generally accepted that sintering timescales (τ)
Kueppers et al. Journal of Applied Volcanology Page 3 of 112014, 3:4http://www.appliedvolc.com/content/3/1/4
are dependent on initial grain size (R), melt viscosity (η)and melt surface tension (γ); given by (Uhlmann et al.1975):
τ ¼ Rηγ
ð1Þ
In our experiments with natural volcanic ash, for aconstant grain size and composition, the sintering time-scale is therefore entirely governed by viscosity and there-fore time and temperature dependent. However at thesame temperature conditions, the grain size of ingestedash particles should play a critical role in the timescale ofeffective sintering and therefore grain size will be theprime parameter controlling the probability that particlescolliding with each other or with surfaces will adhere andaccumulate in engines (Vasseur et al. 2013). Substratematerials in jet engines are not well publicised and there-fore the sintering behaviour of particles on a particularsubstrate remains unconstrained. There is remarkablylittle literature on sintering as a function of substratematerial. This is especially true when considering a singleparticle and not a granular mixture. However, there isprodigious literature showing and modelling how thiscan happen in, for example, coal combustion devices withmetal substrates (Tomeczek et al. 2004; Song et al. 2009).For this reason we consider the sintering of particles toother particles of the same material as an approximateproxy to the timescales and characteristics of sintering toa metal substrate or to a thermal barrier coating. Weconcede that further research in this area is necessary.For the theoretical model (Eq. 1), a spherical particleshape is assumed. Figure 1 clearly shows that none of thethree samples is comprised of particles of this shape. Theshape of the particles will affect the sintering timescale,as heat conductivity is surface area controlled. The effectof grain shape on sintering timescale was not the targetof this study.Several working groups have characterized Eyjafjallajökull
ash (Bonadonna et al. 2011; Dellino et al. 2012; Taddeucciet al. 2011). Further, reaction with metallic surfaces wasinvestigated for natural ash (Gislason et al. 2011) andchemically comparable analogue materials (Mechnich et al.2011) by constraining “size, shape, and hardness […] as wellas the chemical composition of the salt condensates on theparticle surfaces” of ash that was sampled dry. To the bestof our knowledge, no investigation has compared theresponse of Eyjafjallajökull ash and mineral sands toreheating.In this study, we compare the ash collected during the
Eyjafjallajökull eruption (EYJA) to two different testsands commonly employed as turbine contaminants; the“Arizona Test Dust” (ATD) and the “MIL E 5007C” testsands (MIL). We focus on the response of static powder
samples to heating for 30, 60 or 120 minutes, respect-ively, at 1 bar pressure.
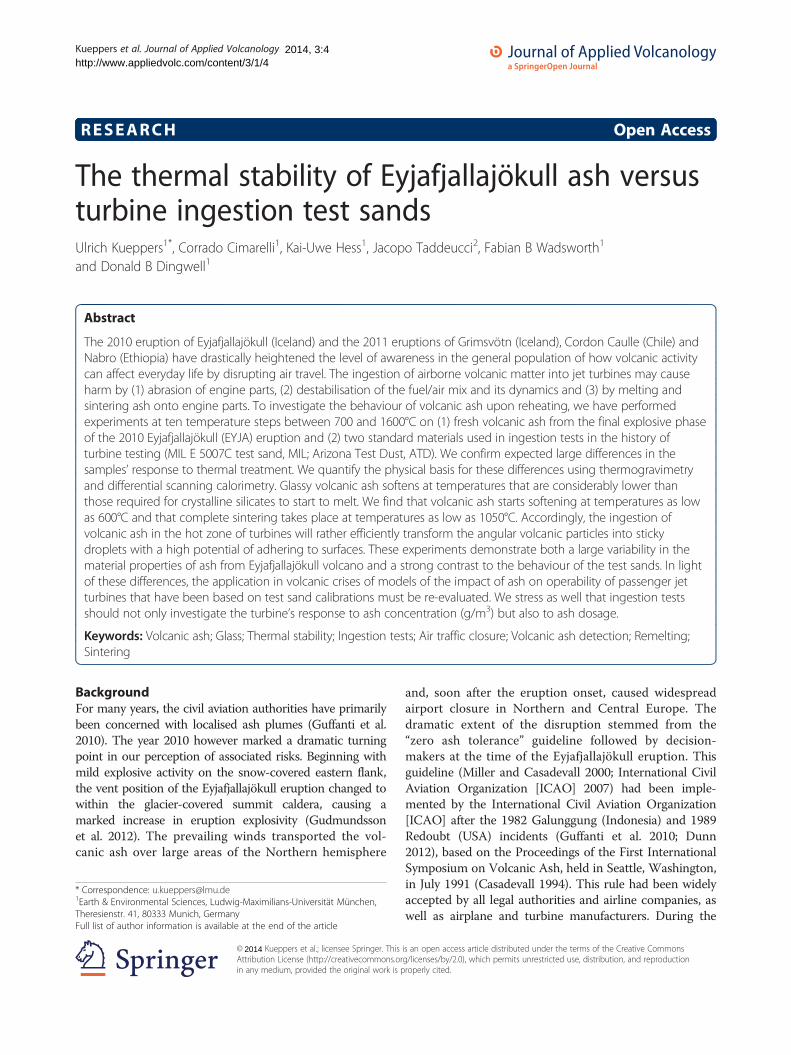
Sample characterisationEyjafjallajökull ashThe ash sample E4 (EYJA) was collected on 18 May 2010along the plume dispersal axis at 7.5 km north from thevent as it sedimented from the ash cloud. The sample’sgrain size distribution is smaller than 1 mm and displays apositive skewness (modal value at 500 μm) with a second-ary peak at 63 μm. This bimodal distribution can be attri-buted to the process of aggregation by finer particles(< 125 μm) acting at the time of sampling, enabling thepremature depletion of the finer grains from the ash cloud(Taddeucci et al. 2011). Under Field-Emission ScanningElectron Microscope (FE-SEM) the sample appears almostentirely composed of juvenile material, ranging in vesicu-lation from highly vesicular (Figure 1a) to non-vesicular.Clasts are mostly glassy with variable contents of micro-lites (crystals smaller than 10 μm, mostly plagioclase,clinopyroxene and oxides, Figure 1b). Chemical bulk com-position has been determined by X-Ray Fluorescence(XRF) analysis, while single-spot composition of the glassmatrix has been determined by Electron MicroprobeAnalysis (EMPA, Table 1). Higher values of SiO2 withinthe glassy matrix with respect to the bulk composition areconsistent with the presence of crystals in the groundmassand, although rare, of loose crystals in the whole sample(Taddeucci et al. 2011).
Arizona test dustThe characteristics of the Arizona Test Dust (ATD)follow the specification of the International Organizationfor Standardization ISO 12103–1 “Road Vehicles - TestDust for Filter Evaluation”. The ATD is used as a testcontaminant for fuel system components, water filterperformance evaluation and other custom applications.It consists of a granular material of mixed silicate min-eralogy with grain size smaller than 200 μm (Figure 1c).We purchased two different grades of ATD from PowderTechnology Inc., ATD-A2 fine grade (< 120 μm) andATD-A4 coarse grade (< 200 μm), respectively. Grainsfrom both samples are texturally homogeneous, denseand display angular shapes. Chemical compositions ofthe bulk samples and average composition of singlegrains have been determined from XRF and EMPAanalyses respectively, and are reported in Table 1. SinceATD is mainly employed for the testing of particulatefilters, the manufacturer has no criteria for strictcontrols on its bulk composition and reports the rangeof compositions for different ATD grades (expressed inwt% of oxides) as follows: SiO2 68.0–76.0; CaO 2.0-5.0;Al2O3 10.0–15.0; MgO 1.0-2.0; Fe2O3 2.0–5.0; TiO2
0.5-1.0; Na2O 2.0–4.0; K2O 2.0-5.0. XRF analyses of the
Figure 1 SEM images of single and embedded grains. a) and b) showing different EYJA grains showing the porous nature (a) and themicrolite content (b); c) shows the angular shape of ATD grains; d) shows the rounded shape of MIL grains.
Kueppers et al. Journal of Applied Volcanology Page 4 of 112014, 3:4http://www.appliedvolc.com/content/3/1/4
bulk sample (Table 1) show that the ATD-A2 compo-sition is in good agreement with the composition givenby the manufacturer, while ATD-A4 composition isslightly different, being dominated by SiO2 with minorwt% of Al2O3, FeO, CaO, Na2O, K2O.
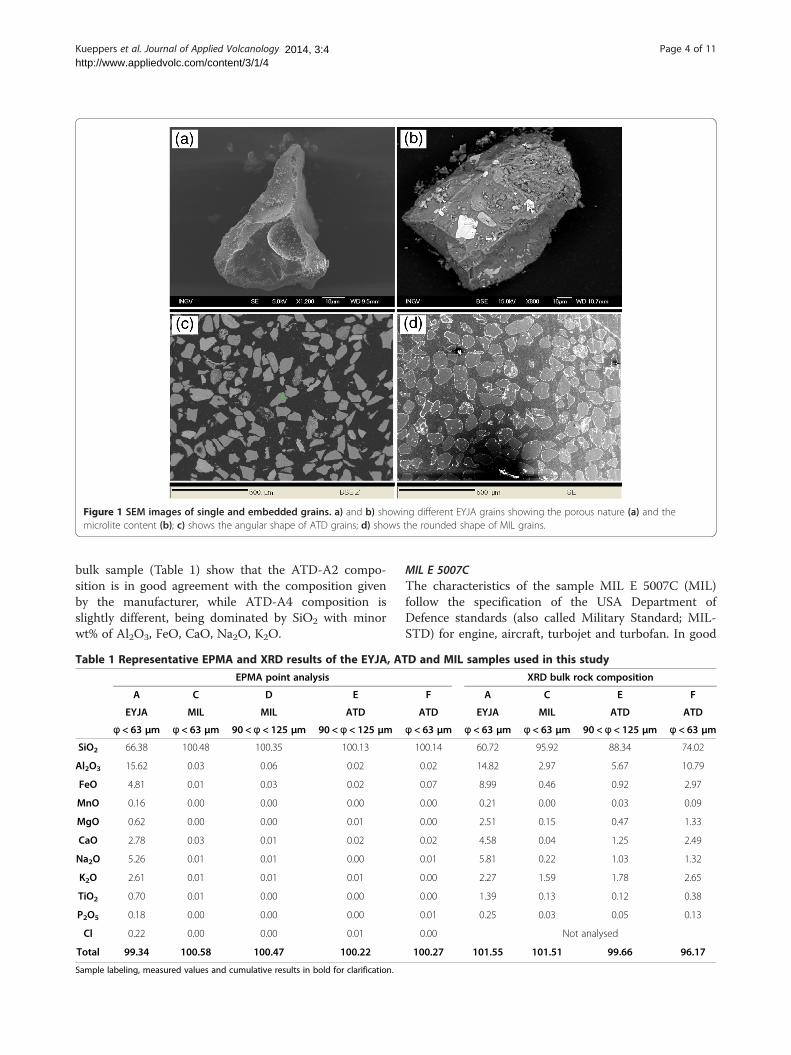
Table 1 Representative EPMA and XRD results of the EYJA, AT
Sample labeling, measured values and cumulative results in bold for clarification.
MIL E 5007CThe characteristics of the sample MIL E 5007C (MIL)follow the specification of the USA Department ofDefence standards (also called Military Standard; MIL-STD) for engine, aircraft, turbojet and turbofan. In good
Kueppers et al. Journal of Applied Volcanology Page 5 of 112014, 3:4http://www.appliedvolc.com/content/3/1/4
commercial quality, it consists of crushed quartz finerthan 1 mm. For our experiments, we sieved the bulksample to obtain two sub-samples, 90 < ϕ < 125 μm(Figure 1d) and ϕ < 63 μm. BSE images reveal a betterrounding of most MIL grains in respect to ATD. Chem-ical analyses of single grains and bulk sample (Table 1)are in good agreement and confirm the homogeneousmineralogical composition (almost entirely pure quartz)of the samples.
MethodsThermal treatmentSintering is the process of sticking and cohesion of initiallygranular particles as a function of heating rate,temperature, composition and grainsize. Sintering is theadherence of particles by diffusive or viscous remobilisa-tion of material to form necks, joining particles in contactwith one another. In this study we assess the grainsize-and temperature-dependence of sintering times. We per-formed 25 experiments with 133 sample specimens at tentemperature steps between 700 and 1600°C and ambientatmosphere. We started with 0.3 g of new material placedin a Calcium Phosphate-crucible (i.e. static experiments).We observed some limited chemical and mechanical inter-action between sample and crucible. Chemical interactionsare not a focus of the current study; however, the mechan-ical interaction, the flowing of molten sample into the cru-cible’s pore space, was clearly correlated with theexperimental temperature and was constrained qualita-tively. Irrespective of their differing chemical composi-tions, porosity within the crucibles used in this study isalso a property exhibited by thermal barrier coatings (seeFigures eight and nine in Mechnich et al. 2011). For eachsample (EYJA, ATD and MIL) we used two different grainsizes: ϕ < 63 μm and 90 < ϕ < 125 μm. Sets of 18 sampleshave been placed in the furnace at the experimentaltemperature, removed after 30, 60 or 120 minutes, respect-ively, and allowed to cool under ambient conditions. Aftercooling, we qualitatively assessed macroscopic changes byclassifying the samples in one of the following classes:granular (unsintered powder), partially sintered (individualparticles adhere at points of contact and neck formation),efficiently sintered and texturally completely densified. Se-lected samples were embedded in epoxy, cut and polishedto allow thin section and SEM analysis.
Thermal stabilityA series of three different measurements have been per-formed to quantitatively constrain the sample responsesto heating.
1. Thermogravimetric (TG) measurements werecarried out using a Netzsch STA 449C thermalbalance. Sample powder of approx. 30 mg was
heated in a platinum crucible (with lid) at a heatingrate of 10 K/min to 1500°C in an argon atmosphere.
2. Calorimetric (differential scanning calorimetry, DSC)measurements have been performed using a hightemperature, low sensitivity Netzsch STA 449C.Approx. 30 mg were heated in a platinum cruciblewith a heating rate of 10 K/min to 1325°C.
3. Calorimetric (differential scanning calorimetry, DSC)measurements have been performed using a lowtemperature, high sensitivity Setaram Sensys Evo.Approximately 60 mg were heated in a platinumcrucible with a heating rate of 10 K/min to 800°C inan argon atmosphere. This measurement wasperformed only on EYJA samples.
Results
1. The major element composition (Table 1) wasquantified as single point (microprobe) and bulk rock(XRF) analyses (see Appendix for details of analyticalconditions). FE-SEM images reveal a variable microlitecontent for EYJA (Figure 1a,b) while ATD (Figure 1c)and MIL (Figure 1d) are almost exclusively composedof quartz grains. In the ATD sample, we observe thatthe quartz grains are coated with another mineralphase, most likely clay (see DSC results). The differ-ences between the two chemical data sets are minorfor MIL, moderate for EYJA and high for ATD. Weobserve a generally angular shape for clasts of EYJAand ATD while most clasts of MIL are subrounded torounded. EYJA clasts show abundant segments ofbubble walls from broken bubbles. The EYJA ash wasfound to be strongly degassed with measured watercontents below 0.1 wt.%.
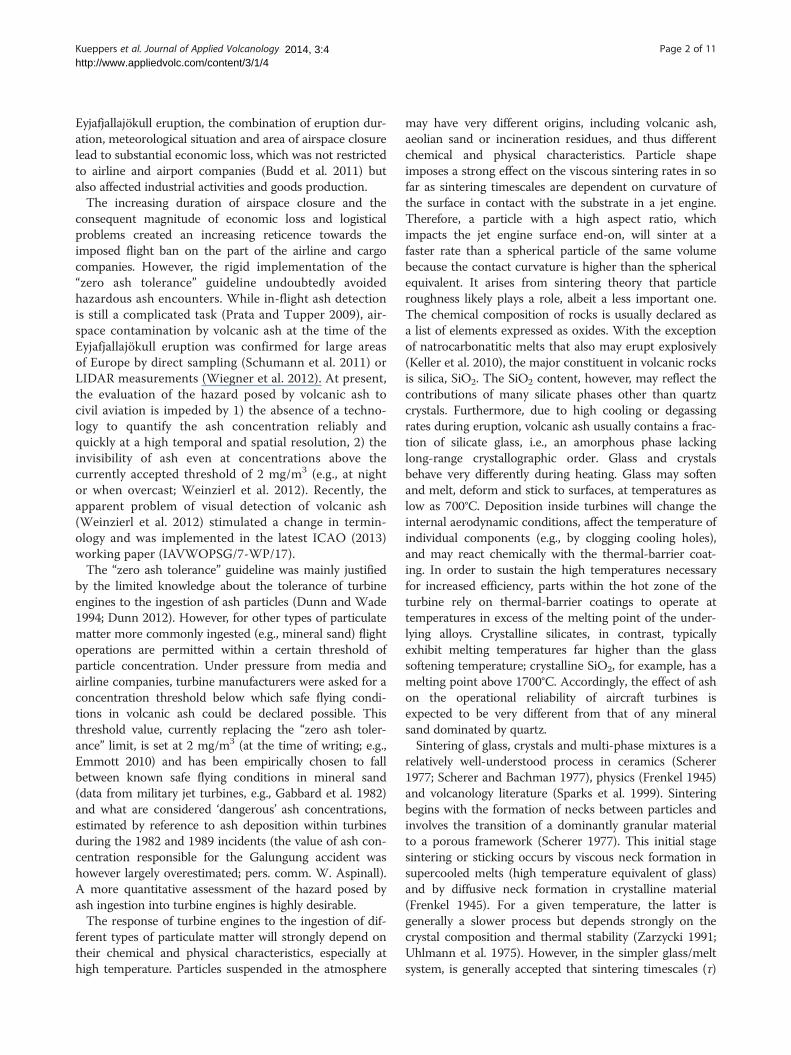
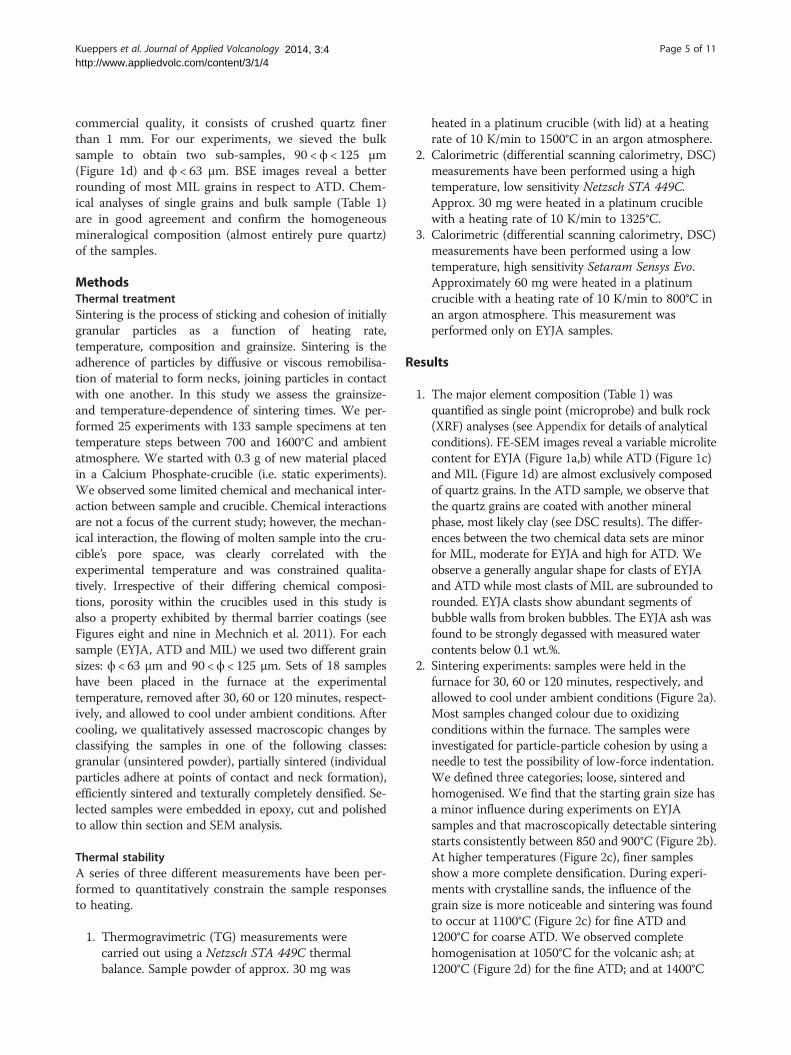
2. Sintering experiments: samples were held in thefurnace for 30, 60 or 120 minutes, respectively, andallowed to cool under ambient conditions (Figure 2a).Most samples changed colour due to oxidizingconditions within the furnace. The samples wereinvestigated for particle-particle cohesion by using aneedle to test the possibility of low-force indentation.We defined three categories; loose, sintered andhomogenised. We find that the starting grain size hasa minor influence during experiments on EYJAsamples and that macroscopically detectable sinteringstarts consistently between 850 and 900°C (Figure 2b).At higher temperatures (Figure 2c), finer samplesshow a more complete densification. During experi-ments with crystalline sands, the influence of thegrain size is more noticeable and sintering was foundto occur at 1100°C (Figure 2c) for fine ATD and1200°C for coarse ATD. We observed completehomogenisation at 1050°C for the volcanic ash; at1200°C (Figure 2d) for the fine ATD; and at 1400°C
Figure 2 Photos of the samples (a) after 60 min at 700°C (no observable change), (b) after 60 min at 900°C, (c) after 60 min at 1100°Cand (d) after 60 min at 1200°C (each crucible has a diameter of 22 mm). Arrangement of samples in (a) through (c): top row from left toright: EYJA, ATD and MIL (all ϕ < 63 μm); bottom row from left to right: EYJA, ATD and MIL (all 90 < ϕ < 125 μm). Arrangement of samples in (d):top row from left to right: ATD and MIL (all ϕ < 63 μm); bottom row from left to right: ATD and MIL (all 90 < ϕ < 125 μm). After 60 minutes at700°C (a), all samples are still loose powders. After 60 minutes at 900°C (b), EYJA samples show signs of sintering (crusted surface), all othersamples are still loose powders. After 60 minutes at 1100°C (c), EYJA samples are completely sintered whereas all other samples are still loose.After 60 minutes at 1200°C (d), ATD is partially sintered (90 <ϕ < 125 μm) and completely welded (ϕ < 63 μm), respectively, whereas MIL samplesare still loose powders.
Ta
Sa
Ab
Kueppers et al. Journal of Applied Volcanology Page 6 of 112014, 3:4http://www.appliedvolc.com/content/3/1/4
for the coarse ATD. The MIL sample shows signs ofa homogenisation onset at 1400°C (Table 2).
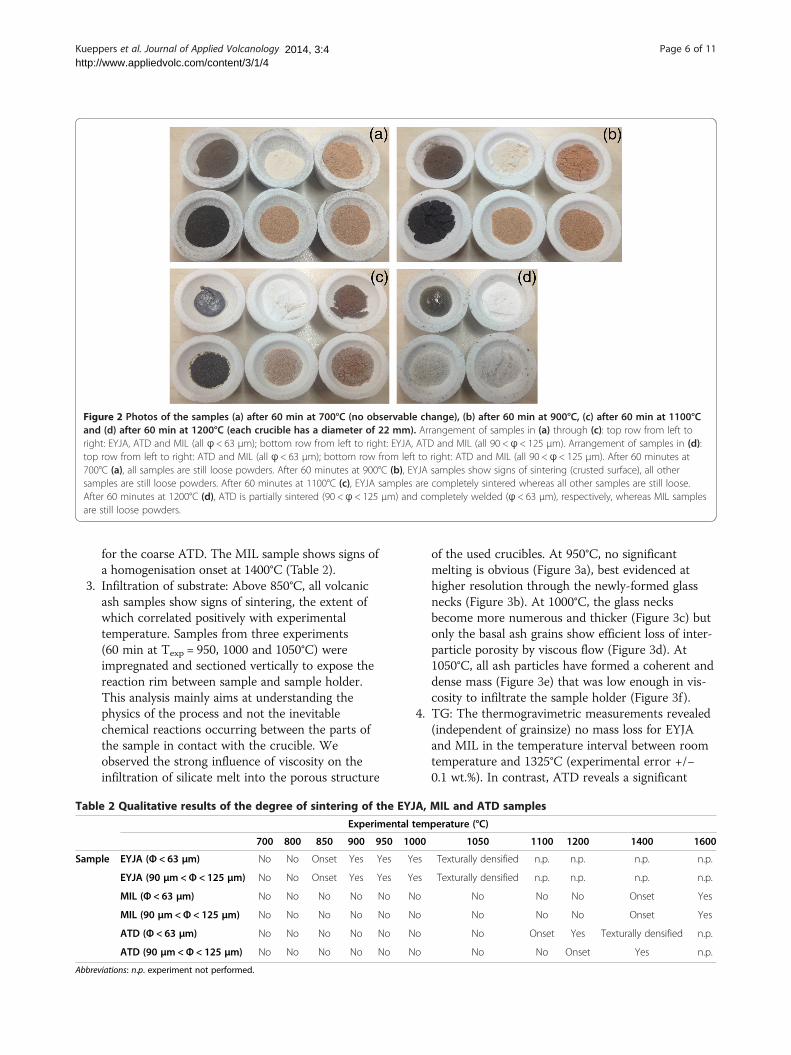
3. Infiltration of substrate: Above 850°C, all volcanicash samples show signs of sintering, the extent ofwhich correlated positively with experimentaltemperature. Samples from three experiments(60 min at Texp = 950, 1000 and 1050°C) wereimpregnated and sectioned vertically to expose thereaction rim between sample and sample holder.This analysis mainly aims at understanding thephysics of the process and not the inevitablechemical reactions occurring between the parts ofthe sample in contact with the crucible. Weobserved the strong influence of viscosity on theinfiltration of silicate melt into the porous structure
ble 2 Qualitative results of the degree of sintering of the EYJ
Experimental t
700 800 850 900 950 10
mple EYJA (Φ < 63 μm) No No Onset Yes Yes Y
EYJA (90 μm<Φ < 125 μm) No No Onset Yes Yes Y
MIL (Φ < 63 μm) No No No No No N
MIL (90 μm<Φ < 125 μm) No No No No No N
ATD (Φ < 63 μm) No No No No No N
ATD (90 μm<Φ < 125 μm) No No No No No N
breviations: n.p. experiment not performed.
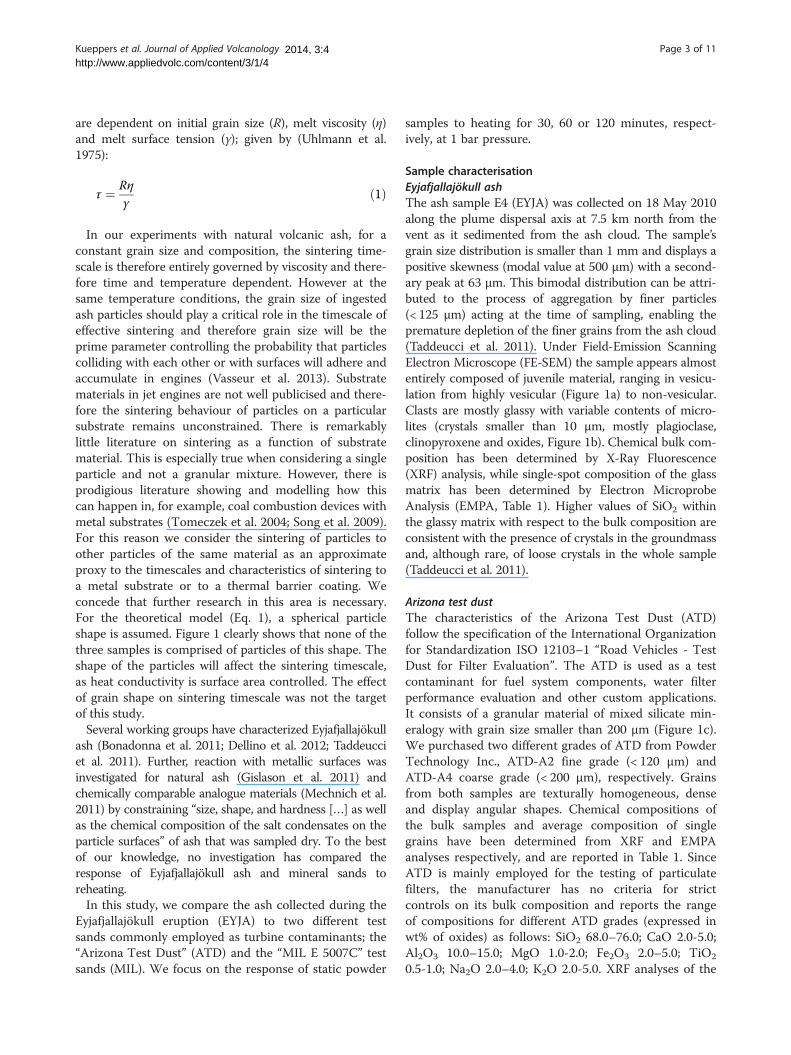
of the used crucibles. At 950°C, no significantmelting is obvious (Figure 3a), best evidenced athigher resolution through the newly-formed glassnecks (Figure 3b). At 1000°C, the glass necksbecome more numerous and thicker (Figure 3c) butonly the basal ash grains show efficient loss of inter-particle porosity by viscous flow (Figure 3d). At1050°C, all ash particles have formed a coherent anddense mass (Figure 3e) that was low enough in vis-cosity to infiltrate the sample holder (Figure 3f ).
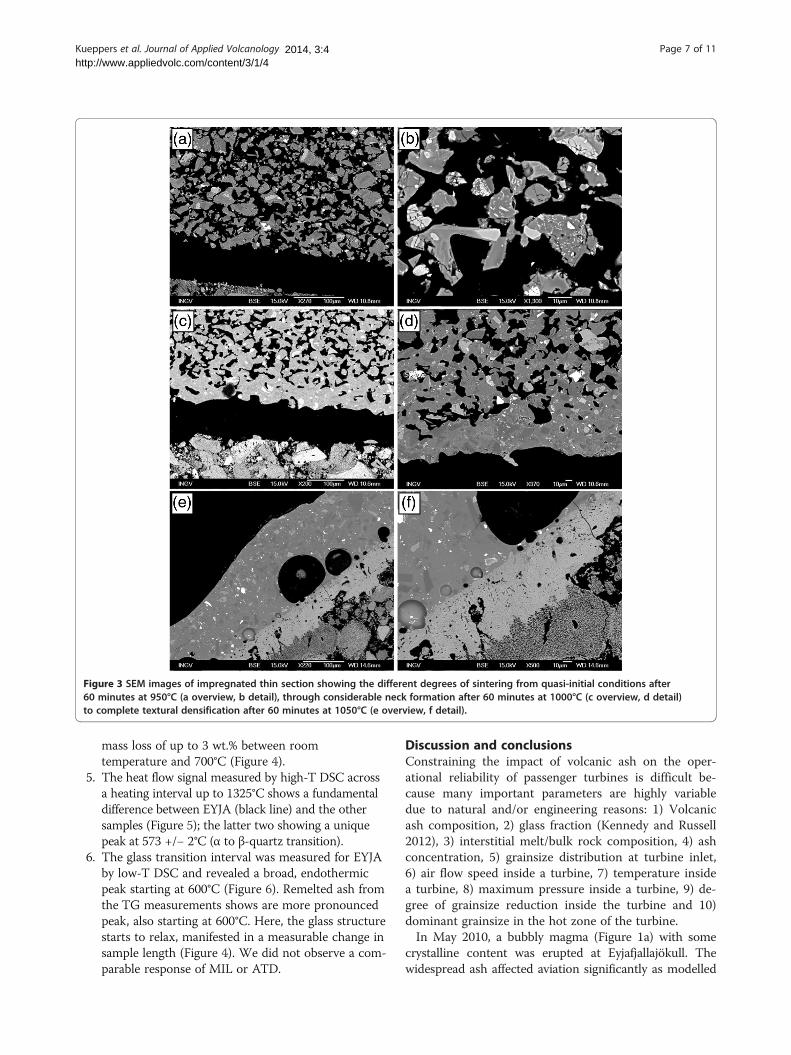
4. TG: The thermogravimetric measurements revealed(independent of grainsize) no mass loss for EYJAand MIL in the temperature interval between roomtemperature and 1325°C (experimental error +/−0.1 wt.%). In contrast, ATD reveals a significant
Figure 3 SEM images of impregnated thin section showing the different degrees of sintering from quasi-initial conditions after60 minutes at 950°C (a overview, b detail), through considerable neck formation after 60 minutes at 1000°C (c overview, d detail)to complete textural densification after 60 minutes at 1050°C (e overview, f detail).
Kueppers et al. Journal of Applied Volcanology Page 7 of 112014, 3:4http://www.appliedvolc.com/content/3/1/4
mass loss of up to 3 wt.% between roomtemperature and 700°C (Figure 4).
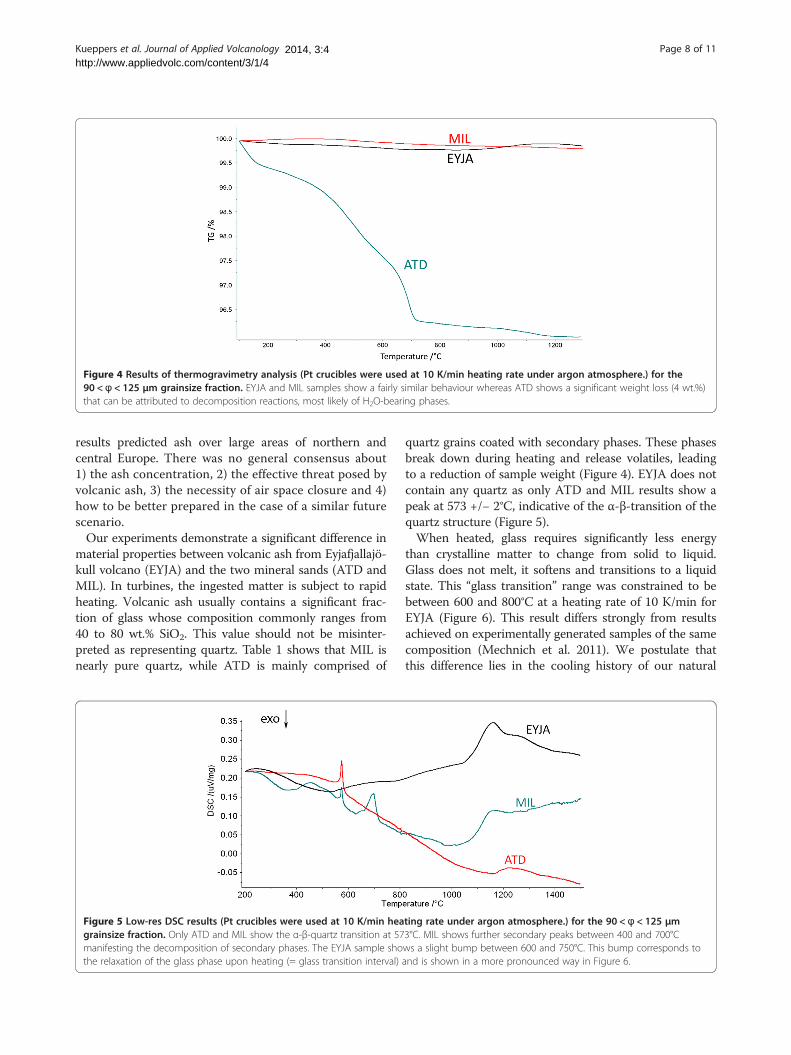
5. The heat flow signal measured by high-T DSC acrossa heating interval up to 1325°C shows a fundamentaldifference between EYJA (black line) and the othersamples (Figure 5); the latter two showing a uniquepeak at 573 +/− 2°C (α to β-quartz transition).
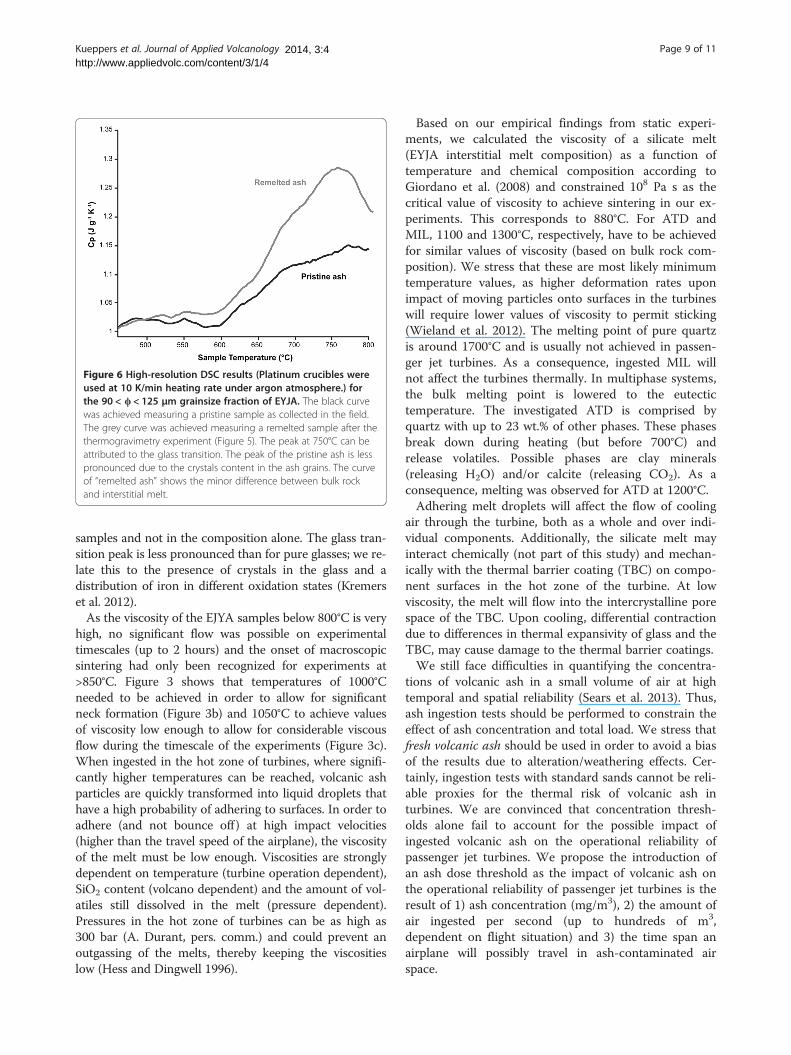
6. The glass transition interval was measured for EYJAby low-T DSC and revealed a broad, endothermicpeak starting at 600°C (Figure 6). Remelted ash fromthe TG measurements shows are more pronouncedpeak, also starting at 600°C. Here, the glass structurestarts to relax, manifested in a measurable change insample length (Figure 4). We did not observe a com-parable response of MIL or ATD.
Discussion and conclusionsConstraining the impact of volcanic ash on the oper-ational reliability of passenger turbines is difficult be-cause many important parameters are highly variabledue to natural and/or engineering reasons: 1) Volcanicash composition, 2) glass fraction (Kennedy and Russell2012), 3) interstitial melt/bulk rock composition, 4) ashconcentration, 5) grainsize distribution at turbine inlet,6) air flow speed inside a turbine, 7) temperature insidea turbine, 8) maximum pressure inside a turbine, 9) de-gree of grainsize reduction inside the turbine and 10)dominant grainsize in the hot zone of the turbine.In May 2010, a bubbly magma (Figure 1a) with some
crystalline content was erupted at Eyjafjallajökull. Thewidespread ash affected aviation significantly as modelled
Figure 4 Results of thermogravimetry analysis (Pt crucibles were used at 10 K/min heating rate under argon atmosphere.) for the90 < ϕ < 125 μm grainsize fraction. EYJA and MIL samples show a fairly similar behaviour whereas ATD shows a significant weight loss (4 wt.%)that can be attributed to decomposition reactions, most likely of H2O-bearing phases.
Kueppers et al. Journal of Applied Volcanology Page 8 of 112014, 3:4http://www.appliedvolc.com/content/3/1/4
results predicted ash over large areas of northern andcentral Europe. There was no general consensus about1) the ash concentration, 2) the effective threat posed byvolcanic ash, 3) the necessity of air space closure and 4)how to be better prepared in the case of a similar futurescenario.Our experiments demonstrate a significant difference in
material properties between volcanic ash from Eyjafjallajö-kull volcano (EYJA) and the two mineral sands (ATD andMIL). In turbines, the ingested matter is subject to rapidheating. Volcanic ash usually contains a significant frac-tion of glass whose composition commonly ranges from40 to 80 wt.% SiO2. This value should not be misinter-preted as representing quartz. Table 1 shows that MIL isnearly pure quartz, while ATD is mainly comprised of
Figure 5 Low-res DSC results (Pt crucibles were used at 10 K/min heagrainsize fraction. Only ATD and MIL show the α-β-quartz transition at 57manifesting the decomposition of secondary phases. The EYJA sample shothe relaxation of the glass phase upon heating (= glass transition interval)
quartz grains coated with secondary phases. These phasesbreak down during heating and release volatiles, leadingto a reduction of sample weight (Figure 4). EYJA does notcontain any quartz as only ATD and MIL results show apeak at 573 +/− 2°C, indicative of the α-β-transition of thequartz structure (Figure 5).When heated, glass requires significantly less energy
than crystalline matter to change from solid to liquid.Glass does not melt, it softens and transitions to a liquidstate. This “glass transition” range was constrained to bebetween 600 and 800°C at a heating rate of 10 K/min forEYJA (Figure 6). This result differs strongly from resultsachieved on experimentally generated samples of the samecomposition (Mechnich et al. 2011). We postulate thatthis difference lies in the cooling history of our natural
ting rate under argon atmosphere.) for the 90 < ϕ < 125 μm3°C. MIL shows further secondary peaks between 400 and 700°Cws a slight bump between 600 and 750°C. This bump corresponds toand is shown in a more pronounced way in Figure 6.
Figure 6 High-resolution DSC results (Platinum crucibles wereused at 10 K/min heating rate under argon atmosphere.) forthe 90 < ϕ < 125 μm grainsize fraction of EYJA. The black curvewas achieved measuring a pristine sample as collected in the field.The grey curve was achieved measuring a remelted sample after thethermogravimetry experiment (Figure 5). The peak at 750°C can beattributed to the glass transition. The peak of the pristine ash is lesspronounced due to the crystals content in the ash grains. The curveof “remelted ash” shows the minor difference between bulk rockand interstitial melt.
Kueppers et al. Journal of Applied Volcanology Page 9 of 112014, 3:4http://www.appliedvolc.com/content/3/1/4
samples and not in the composition alone. The glass tran-sition peak is less pronounced than for pure glasses; we re-late this to the presence of crystals in the glass and adistribution of iron in different oxidation states (Kremerset al. 2012).As the viscosity of the EJYA samples below 800°C is very
high, no significant flow was possible on experimentaltimescales (up to 2 hours) and the onset of macroscopicsintering had only been recognized for experiments at>850°C. Figure 3 shows that temperatures of 1000°Cneeded to be achieved in order to allow for significantneck formation (Figure 3b) and 1050°C to achieve valuesof viscosity low enough to allow for considerable viscousflow during the timescale of the experiments (Figure 3c).When ingested in the hot zone of turbines, where signifi-cantly higher temperatures can be reached, volcanic ashparticles are quickly transformed into liquid droplets thathave a high probability of adhering to surfaces. In order toadhere (and not bounce off) at high impact velocities(higher than the travel speed of the airplane), the viscosityof the melt must be low enough. Viscosities are stronglydependent on temperature (turbine operation dependent),SiO2 content (volcano dependent) and the amount of vol-atiles still dissolved in the melt (pressure dependent).Pressures in the hot zone of turbines can be as high as300 bar (A. Durant, pers. comm.) and could prevent anoutgassing of the melts, thereby keeping the viscositieslow (Hess and Dingwell 1996).
Based on our empirical findings from static experi-ments, we calculated the viscosity of a silicate melt(EYJA interstitial melt composition) as a function oftemperature and chemical composition according toGiordano et al. (2008) and constrained 108 Pa s as thecritical value of viscosity to achieve sintering in our ex-periments. This corresponds to 880°C. For ATD andMIL, 1100 and 1300°C, respectively, have to be achievedfor similar values of viscosity (based on bulk rock com-position). We stress that these are most likely minimumtemperature values, as higher deformation rates uponimpact of moving particles onto surfaces in the turbineswill require lower values of viscosity to permit sticking(Wieland et al. 2012). The melting point of pure quartzis around 1700°C and is usually not achieved in passen-ger jet turbines. As a consequence, ingested MIL willnot affect the turbines thermally. In multiphase systems,the bulk melting point is lowered to the eutectictemperature. The investigated ATD is comprised byquartz with up to 23 wt.% of other phases. These phasesbreak down during heating (but before 700°C) andrelease volatiles. Possible phases are clay minerals(releasing H2O) and/or calcite (releasing CO2). As aconsequence, melting was observed for ATD at 1200°C.Adhering melt droplets will affect the flow of cooling
air through the turbine, both as a whole and over indi-vidual components. Additionally, the silicate melt mayinteract chemically (not part of this study) and mechan-ically with the thermal barrier coating (TBC) on compo-nent surfaces in the hot zone of the turbine. At lowviscosity, the melt will flow into the intercrystalline porespace of the TBC. Upon cooling, differential contractiondue to differences in thermal expansivity of glass and theTBC, may cause damage to the thermal barrier coatings.We still face difficulties in quantifying the concentra-
tions of volcanic ash in a small volume of air at hightemporal and spatial reliability (Sears et al. 2013). Thus,ash ingestion tests should be performed to constrain theeffect of ash concentration and total load. We stress thatfresh volcanic ash should be used in order to avoid a biasof the results due to alteration/weathering effects. Cer-tainly, ingestion tests with standard sands cannot be reli-able proxies for the thermal risk of volcanic ash inturbines. We are convinced that concentration thresh-olds alone fail to account for the possible impact ofingested volcanic ash on the operational reliability ofpassenger jet turbines. We propose the introduction ofan ash dose threshold as the impact of volcanic ash onthe operational reliability of passenger jet turbines is theresult of 1) ash concentration (mg/m3), 2) the amount ofair ingested per second (up to hundreds of m3,dependent on flight situation) and 3) the time span anairplane will possibly travel in ash-contaminated airspace.
Kueppers et al. Journal of Applied Volcanology Page 10 of 112014, 3:4http://www.appliedvolc.com/content/3/1/4
AppendixElectron microprobe analysisGroundmass glass and crystal phases were analysed formajor elements by electron microprobe on a CamecaSX100 at the University of Munich (LMU), Germany.An accelerating voltage of 15 kV, a 15 nA beam current,a defocused 3 μm spot size and ZAF correction proce-dures were used. Na and K were analysed first on theirrespective spectrometers for 10 s on the peak and 5 s onthe background. Peak and background analysis times forSi, Ti, Al, Fe, Mg and Ca were 20 s and 10 s, for Mn, Ni,Cr, P 30 s and 10 s, for S 50 s and 25 s, while for Cl theywere 240 s and 120 s, respectively. To check for homo-geneity at least 10 analyses were collected on the glassand at least 5 on the crystals.
SEM analysisMicro-scale observations of ash particles was performedusing a JEOL JSM 6500 F Field Emission (Schottky-type)Scanning Emission Microscope (FE-SEM) at the Insti-tuto Nazionale di Geofisica e Vulcanologia – Roma.In comparison to conventional SEMs, FE-SEMs offer a
more stable electron source and a smaller beam capableof higher spatial resolution at a lower acceleration volt-age. The nominal resolution of the used FE-SEM is of1.5 and 3 nm at 15 and 1 kV voltage acceleration, re-spectively. Magnifications up to 100.000× were used tovisualize down to sub-micron size features of theparticles.
Competing interestsThe authors declare that they have no competing interests.
Authors’ contributionsUK and CC performed and analysed the sintering experiments, KUH thethermogravimetry and DSC analysis. UK, CC and JT investigated the samplesbefore and after the experiments with EMPA and SEM. KUH and FBWreviewed the sintering literature. UK, CC, KUH and DBD discussed theimplications of the results. UK, CC, FBW and JT drafted the manuscript. Allauthors have read and approved the final manuscript.
AcknowledgementsWe thank Willy Aspinall, Paul Ayris, Adam Durant, Marianne Guffanti andLarry Mastin for vivid discussions and fruitful insights. We thank SorayaHeuss-Aßbichler for the XRF measurements and Hilger Lohringer for samplepreparation. DBD wishes to acknowledge the support of a Research Profes-sorship LMUexcellent of the Bundesexzellenzinitiative as well as AdvancedGrant “EVOKES” 247076 of the ERC. The AXA Research Fund Project “Risk fromvolcanic ash in the Earth system” has primarily supported this work. Wethank the two anonymous reviewers for their input.
Author details1Earth & Environmental Sciences, Ludwig-Maximilians-Universität München,Theresienstr. 41, 80333 Munich, Germany. 2Istituto Nazionale di Geofisica eVulcanologia, Via di Vigna Murata 605, 00143 Roma, Italy.
Received: 20 June 2013 Accepted: 10 February 2014Published:
ReferencesBonadonna C, Genco R, Gouhier M, Pistolesi M, Cioni R, Alfano F, Hoskuldsson A,
Ripepe M (2011) Tephra sedimentation during the 2010 Eyjafjallajökull
27 Mar 2014
eruption (Iceland) from deposit, radar, and satellite observations. J GeophysRes 116:B12202, doi:10.1029/2011JB008462
Budd L, Griggs S, Howarth D, Ison S (2011) A fiasco of volcanic proportions?Eyjafjallajökull and the closure of european airspace. Mobilities 6(1):31–40
Casadevall TJ (1994) Volcanic ash and Aviation Safety; Proceedings of the FirstInternational Symposium on Volcanic Ash and Aviation Safety Held inSeattle. U.S. Geological Survey Bulletin, Washington, p 2047, in July 1991
Dellino P, Gudmundsson MT, Larsen G, Mele D, Stevenson JA, Thordarson T,Zimanowski B (2012) Ash from the Eyjafjallajökull eruption (Iceland):Fragmentation processes and aerodynamic behaviour. J Geophys Res 117:B00C04, doi:10.1029/2011JB008726
Dunn MG (2012) Operation of gas turbine engines in an environmentcontaminated with volcanic ash. J Turbomach 134(5):051001-051001-18,doi: 10.1115/1.4006236
Dunn MG, Wade DP (1994) Influence of volcanic ash clouds on gas turbineengines. In casadevall TJ volcanic ash and aviation safety; proceedings of thefirst international symposium on volcanic Ash and aviation safety held inSeattle, Washington, in July 1991: U.S. Geol Surv Bull 2047:107–117
Emmott P (2010) Eyjafjallajökull – the impact of volcanic ash on aircraft engines.Oral commun Atlantic Conf Eyjafjallajökull Aviation Keflavik, http://en.keilir.net/static/files/Aviation/PDF/Eyjafjallajokull_and_Aviation_Conference_Program.pdf
Frenkel J (1945) Viscous flow of crystalline bodies under the action of surfacetension. J Phys 9(5):385–391
Gabbard CB, LeLevier RE, Parry JFW (1982) Dust-Cloud Effects on Aircraft Engines –Emerging Issues and new Damage Mechanisms. A Case Study of a Mt. St.Helens Experience and its Implications for Nuclear-Weapon-Lofted Dust-CloudEffects. US Defense Nuclear Agency Report DNA-TR-82-18, http://www.dtra.mil/documents/foia/DNA-TR-82-18.pdf
Giordano D, Russell JK, Dingwell DB (2008) Viscosity of magmatic liquids: amodel. Earth Plan Sci Lett 271:123–134
Gislason SR, Hassenkam T, Nedel S, Bovet N, Eiriksdottir ES, Alfredsson HA, HemCP, Balogh ZI, Dideriksen K, Oskarsson N, Sigfusson B, Larsen G, Stipp SLS(2011) Characterization of eyjafjallajökull volcanic ash particles and a protocolfor rapid risk assessment. Proc Nat Acad Sci 108(18):7307–7312
Gudmundsson MT, Thordarson T, Höskuldsson A, Larsen G, Björnsson H, Prata FJ,Oddsson B, Magnússon E, Högnadóttir T, Petersen GN, Hayward CL,Stevenson JA, Jónsdóttir I (2012) Ash generation and distribution from theapril-may 2010 eruption of eyjafjallajökull. Iceland Sci Rep 2:572, 10.1038/srep00572
Guffanti M, Casadevall TJ, Budding K (2010) Encounters of Aircraft with Volcanicash Clouds; A Compilation of Known Incidents, 1953–2009. U.S. GeologicalSurvey Data Series 545, http://pubs.usgs.gov/ds/545/DS545.pdf
Hess KU, Dingwell DB (1996) Viscosities of hydrous leucogranitic melts: a non-arrhenian model. Am Min 81:1297–1300
International Civil Aviation Organization [ICAO] (2007) Manual on Volcanic ash,Radioactive Material and Toxic Chemical Clouds, 2nd edn. International Civil AviationOrganization Doc 9691–AN/954, http://www.paris.icao.int/news/pdf/9691.pdf
International Civil Aviation Organization [ICAO] (2013) IAVWOPSG/7-WP/17,International Airways Volcano Watch Operations GROUP, 7th Meeting,Follow-up of IVATF Recommendation 4/10m – Definitions of visible ash anddiscernable ash for operational use., accessed May 22, 2013, www.icao.int/safety/meteorology/iavwopsg/IAVWOPSG%20Meetings%20Metadata/IAVWOPSG.7.WP.017.5.pdf
Keller J, Klaudius J, Kervyn M, Ernst GGJ, Mattson HB (2010) Fundamental changesin the activity of the natrocarbonatite volcano Oldoinyo Lengai, Tanzania.Bull Volcanol 72:893–912
Kennedy LA, Russell JK (2012) Cataclastic production of volcanic ash at MountSaint Helens. Phys Chem Earth 45–46:40–49
Kremers S, Lavallee Y, Hanson J, Hess KU, Chevrel MO, Wassermann J, DingwellDB (2012) Shallow magma-mingling-driven Strombolian eruptions at Mt.Yasur Volcano, Vanuatu. Geophys Res Lett 39, L21304
Mechnich P, Braue W, Schulz U (2011) High-temperature corrosion of EB-PVDyttria partially stabilized zirconia thermal barrier coatings with an artificialvolcanic Ash overlay. J Am Cer Soc 94:925–931
Miller TP, Casadevall TJ (2000) Volcanic ash Hazards to Aviation. In: Sigurdsson H(ed) Encyclopedia of Volcanoes. Academic, San Diego, pp 915–930
Prata AJ, Tupper A (2009) Aviation hazards from volcanoes: the state of thescience. Nat Haz 186:91–107
Scherer GW (1977) Sintering of low-density glasses: I, theory. J Am Cer Soc60(5–6):236–239
Kueppers et al. Journal of Applied Volcanology Page 11 of 112014, 3:4http://www.appliedvolc.com/content/3/1/4
Scherer GW, Bachman DL (1977) Sintering of low-density glasses: II, experimentalstudy. J Am Cer Soc 60(5–6):239–243
Schumann U, Weinzierl B, Reitebuch O, Schlager H, Minikin A, Forster C, Baumann R,Sailer T, Graf K, Mannstein H, Voigt C, Rahm S, Simmet R, Scheibe M, Lichtenstern M,Stock P, Ru ba H, Schäuble D, Tafferner A, Rautenhaus M, Gerz T, Ziereis H,Krautstrunk M, Mallaun C, Gayet JF, Lieke K, Kandler K, Ebert M, Weinbruch S,Stohl A, et al. (2011) Airborne observations of the Eyjafjalla volcano ashcloud over Europe during air space closure in April and May 2010. Atmos ChemPhys 11:2245–2279, http://dx.doi.org/10.5194/acp-11-2245-2011
Sears TM, Thomas GE, Carboni E, Smith AJA, Grainger RG (2013) SO2 as a possibleproxy for volcanic ash in aviation hazard avoidance. J Geophys Res(Atmospheres) 118(11), doi:10.1002/jgrd.50505
Song W, Tang L, Zhu X, Wu Y, Rong Y, Zhu Z, Koyama S (2009) Fusibility andflow properties of coal ash and slag. Fuel 88(2):297–304
Sparks RSJ, Tait SR, Yanev Y (1999) Dense welding caused by volatile resorption.J Geol Soc 156(2):217–225
Taddeucci J, Scarlato P, Montanaro C, Cimarelli C, Del Bello E, Freda C, AndronicoD, Gudmudsson MT, Dingwell DB (2011) Aggregation-dominated ash settlingfrom the eyjafjallajökull volcanic cloud illuminated by field and laboratoryhigh-speed imaging. Geol 39:891–894
Tomeczek J, Palugniok H, Ochman J (2004) Modelling of deposits formation onheating tubes in pulverized coal boilers. Fuel 83(2):213–221
Uhlmann D, Klein L, Hopper R (1975) Sintering, crystallization, and brecciaformation. Moon 13(1–3):277–284
Vasseur J, Wadsworth FB, Lavallee Y, Hess KU, Dingwell DB (2013) Viscoussintering: timescales of viscous densification and strength recovery. GeophysRes Lett 40:5658–5664
Weinzierl B, Sauer D, Minikin A, Reitebuch O, Dahlkötter F, Mayer B, Emde C,Tegen I, Gasteiger J, Petzold A, Veira A, Kueppers U, Schumann U (2012) Onthe visibility of airborne volcanic ash and mineral dust from the pilot’sperspective in flight. Phys Chem Earth A 45–46:87–102
Wiegner M, Gasteiger J, Gross S, Schnell F, Freudenthaler V, Forkel R (2012)Characterization of the Eyjafjallajökull ash-plume: Potential of lidar remotesensing. Phys Chem Earth 45-46:79–86
Wieland C, Kreutzkam B, Balan G, Spliethoff H (2012) Evaluation, comparison andvalidation of deposition criteria for numerical simulation of slagging. ApplEner 93:184–192
Zarzycki J (1991) Glasses and amorphous solids (Vol 9). In: Cahn RW, Hassen P,Kramer EJ (eds) Materials Science and Technology: a comprehensivetreatment. Wiley, VCH Verlagsgesellschaft, Weinheim
Cite this article as: Kueppers et al.: The thermal stability ofEyjafjallajökull ash versus turbine ingestion test sands. Journal of AppliedVolcanology
10.1186/2191-5040-3-4
2014, 3:4
Submit your manuscript to a journal and benefi t from: