IEEE TRANSACTIONS ON GEOSCIENCE AND REMOTE SENSING, VOL. 35, NO. 5, SEPTEMBER 1997 1117 The Effects of Rain on TOPEX/Poseidon Altimeter Data Jean Tournadre and June C. Morland Abstract— The presence of rain in the sub-satellite track can significantly degrade altimeter measurements by causing an at- tenuation of the backscattered signal, a change in its path length through the atmosphere and a change in the mean square slope of the sea surface. This can cause errors, not only in the mea- surement of the satellite altitude, but also in the determination of wind speed and wave height. TOPEX/Poseidon dual-frequency altimeter data (cycles 3 and 8) were searched for instances where the data were possibly degraded by the presence of rain over the North and inter-Tropical Atlantic. A subjective analysis of the data, similar to the one used in previous studies was conducted on the backscatter coefficient, wind speed, significant wave height, sea surface height, TOPEX Microwave Radiometer (TMR) brightness temperatures, liquid water content and data quality flags to identify the orbits possibly affected by rain. From the 105 probable rain events identified, the effects of rain on the TOPEX measurements and data quality parameters were characterized. The strong differential effect of rain on the Ku and C band measurements was then used to define a new rain flag based on a departure from the normal relationship between the C and Ku band backscatter. This new rain flag was shown to detect all the identified rain events, as well as new ones. The TMR rain flag, used operationally, was shown to flag too many altimeter samples and too few rain events, mainly because of its large resolution (few tens of kilometers compared to few kilometers for the altimeter). An estimation of the rainfall rate from the attenuation of the Ku band backscatter was proposed. Index Terms—Ku and C bands , rain flag, TOPEX altimeter. I. INTRODUCTION S INCE the launch of Geosat (1985–1989) and the subsequent launches of ERS-1 (1991 to the present), TOPEX/Poseidon (1992–present) and ERS-2 (1995–present), a nearly continuous series of altimeter data is now available for oceanographic studies. Altimeter data have become over the past years a major and standard tool for analyzing the world ocean circulation. The fundamental parameters measured by an altimeter are the significant wave height ( ), the backscatter power ( ) (related to the surface wind) and the time taken for a radar pulse to be reflected from the sea surface. From the Manuscript received April 9, 1996; revised March 3, 1997. This work was supported in part by a contract from the European Union, program MAST, entitled European Community Wave Model (ECAWOM), N MAS2-CT94- 0091. J. Tournadre is with the D´ epartement d’Oc´ eanographie Spatiale, Institut Fran¸ cais de Recherche pour l’Exploitation de la Mer, (IFREMER), 29280 Plouzan´ e, France (e-mail: [email protected]). J. C. Morland is with the Department of Meteorology, University of Reading, Reading, U.K. (e-mail: [email protected]). Publisher Item Identifier S 0196-2892(97)05523-X. time interval between the emission and reception of the pulse, the satellite height above the sea surface can be calculated. Given information about the satellite orbit and the earth’s geoid, together with various instrumental, atmospheric and tide corrections, it is possible to derive the dynamic topography of the oceans. For most oceanographic studies, the accuracy required for the topographic measurement is of the order of a few centimeters, i.e., the limit of the present systems. To increase the accuracy of the altimeter height measurement, corrections are routinely applied to account for various factors such as atmospheric water vapor, ionospheric time delay, etc. [1]. Among the different atmospheric phenomena which can affect the altimeter measurement, rain is one of the less well understood and at present no reliable correction can be made for the whole range of geophysical parameters. To avoid any contamination by rain, data which are possibly affected are simply discarded using a flag set by concurrent passive microwave measurements. These passive microwave data are also used to calculate an atmospheric water vapor correction to the height and can also give an estimate of atmospheric liquid water [2]. As already pointed out by [3], there are two problems with the discarding of data possibly affected by rain. Firstly, rain events are not randomly distributed in time and space across the oceans and discarding data affected by rain in regions where precipitation is common (such as the intertropical convergence zone or the Arabian sea during the monsoon) might bias the analysis of dynamic topography. Second, the efficacy of the rain flagging algorithm has never been fully assessed, nor has the effect of rain on altimeter measurements. Thus, it is still questionable whether all rain-affected data are flagged or whether good data are falsely discarded due to an incorrect rain detection algorithm. In previous studies [4], [5], careful subjective analysis of the altimeter geophysical parameters have been used to identified possible rain events. This method allowed a good description of the effects of rain on Seasat and ERS-1 altimeter data. However, it can only applied for case studies and can not be used operationally. The main motivations for this study are firstly, to better understand the behavior of altimeter data when rain is present, and secondly, to show that the differential effect of rain on Ku and C band microwave signals [6], [7] can be used to define a better and possibly operational rain flag. A further goal is to investigate the possibility of using dual-frequency altimeter data to make direct measurements of rainfall over the ocean. Precipitation over the ocean is a poorly known quantity 0196–2892/97$10.00 1997 IEEE
Transcript
IEEE TRANSACTIONS ON GEOSCIENCE AND REMOTE SENSING, VOL. 35, NO. 5, SEPTEMBER 1997 1117
The Effects of Rain onTOPEX/Poseidon Altimeter Data
Jean Tournadre and June C. Morland
Abstract—The presence of rain in the sub-satellite track cansignificantly degrade altimeter measurements by causing an at-tenuation of the backscattered signal, a change in its path lengththrough the atmosphere and a change in the mean square slopeof the sea surface. This can cause errors, not only in the mea-surement of the satellite altitude, but also in the determination ofwind speed and wave height. TOPEX/Poseidon dual-frequencyaltimeter data (cycles 3 and 8) were searched for instanceswhere the data were possibly degraded by the presence of rainover the North and inter-Tropical Atlantic. A subjective analysisof the data, similar to the one used in previous studies wasconducted on the backscatter coefficient, wind speed, significantwave height, sea surface height, TOPEX Microwave Radiometer(TMR) brightness temperatures, liquid water content and dataquality flags to identify the orbits possibly affected by rain. Fromthe 105 probable rain events identified, the effects of rain onthe TOPEX measurements and data quality parameters werecharacterized. The strong differential effect of rain on the Ku andC band measurements was then used to define a new rain flagbased on a departure from the normal relationship between the Cand Ku band backscatter. This new rain flag was shown to detectall the identified rain events, as well as new ones. The TMR rainflag, used operationally, was shown to flag too many altimetersamples and too few rain events, mainly because of its largeresolution (few tens of kilometers compared to few kilometersfor the altimeter). An estimation of the rainfall rate from theattenuation of the Ku band backscatter was proposed.
Index Terms—Ku and C bands�0, rain flag, TOPEX altimeter.
I. INTRODUCTION
SINCE the launch of Geosat (1985–1989) and thesubsequent launches of ERS-1 (1991 to the present),
TOPEX/Poseidon (1992–present) and ERS-2 (1995–present),a nearly continuous series of altimeter data is now available foroceanographic studies. Altimeter data have become over thepast years a major and standard tool for analyzing the worldocean circulation. The fundamental parameters measured by analtimeter are the significant wave height (), the backscatterpower ( ) (related to the surface wind) and the time takenfor a radar pulse to be reflected from the sea surface. From the
Manuscript received April 9, 1996; revised March 3, 1997. This work wassupported in part by a contract from the European Union, program MAST,entitled European Community Wave Model (ECAWOM), N� MAS2-CT94-0091.
J. Tournadre is with the D´epartement d’Oc´eanographie Spatiale, InstitutFrancais de Recherche pour l’Exploitation de la Mer, (IFREMER), 29280Plouzane, France (e-mail: [email protected]).
J. C. Morland is with the Department of Meteorology, University ofReading, Reading, U.K. (e-mail: [email protected]).
Publisher Item Identifier S 0196-2892(97)05523-X.
time interval between the emission and reception of the pulse,the satellite height above the sea surface can be calculated.Given information about the satellite orbit and the earth’sgeoid, together with various instrumental, atmospheric and tidecorrections, it is possible to derive the dynamic topographyof the oceans. For most oceanographic studies, the accuracyrequired for the topographic measurement is of the order ofa few centimeters, i.e., the limit of the present systems. Toincrease the accuracy of the altimeter height measurement,corrections are routinely applied to account for various factorssuch as atmospheric water vapor, ionospheric time delay,etc. [1]. Among the different atmospheric phenomena whichcan affect the altimeter measurement, rain is one of the lesswell understood and at present no reliable correction can bemade for the whole range of geophysical parameters. To avoidany contamination by rain, data which are possibly affectedare simply discarded using a flag set by concurrent passivemicrowave measurements. These passive microwave data arealso used to calculate an atmospheric water vapor correctionto the height and can also give an estimate of atmosphericliquid water [2].
As already pointed out by [3], there are two problems withthe discarding of data possibly affected by rain. Firstly, rainevents are not randomly distributed in time and space acrossthe oceans and discarding data affected by rain in regionswhere precipitation is common (such as the intertropicalconvergence zone or the Arabian sea during the monsoon)might bias the analysis of dynamic topography. Second, theefficacy of the rain flagging algorithm has never been fullyassessed, nor has the effect of rain on altimeter measurements.Thus, it is still questionable whether all rain-affected data areflagged or whether good data are falsely discarded due toan incorrect rain detection algorithm. In previous studies [4],[5], careful subjective analysis of the altimeter geophysicalparameters have been used to identified possible rain events.This method allowed a good description of the effects of rainon Seasat and ERS-1 altimeter data. However, it can onlyapplied for case studies and can not be used operationally.
The main motivations for this study are firstly, to betterunderstand the behavior of altimeter data when rain is present,and secondly, to show that the differential effect of rain onKu and C band microwave signals [6], [7] can be used todefine a better and possibly operational rain flag. A furthergoal is to investigate the possibility of using dual-frequencyaltimeter data to make direct measurements of rainfall over theocean. Precipitation over the ocean is a poorly known quantity
0196–2892/97$10.00 1997 IEEE
1118 IEEE TRANSACTIONS ON GEOSCIENCE AND REMOTE SENSING, VOL. 35, NO. 5, SEPTEMBER 1997
that is crucial for calculating the ocean-atmosphere freshwaterflux.
A good overview of the theory of the effect of rain onaltimeter signals is given in [7], [8]. At Ku and C-band fre-quencies, where the TOPEX dual-frequency altimeter operates,the prime effect of rain is the attenuation of the pulse. It is anorder of magnitude larger at Ku band than at C-band [6]. Athigh rain rates, in addition to attenuation, rain can also changethe shape of the return pulse and hence the measurement of
and sea surface height (ssh) can also be affected [8].Anomalies in radar return due to rain have been reported
for Seasat [9] and ERS-1 [4], [5]. The results from thesestudies can be summarized as follows: 1) all rain events wereassociated with an attenuation of the Ku band backscattercoefficient and with increased variability in the signal; 2)high rain rates can distort the return waveforms leading toerroneous and ssh measurements; and 3) a small numberof cases where the backscatter was attenuated and enhanced inthe presence of rain were found. The backscatter enhancementis in general located on the edge of the rain cell [3]. A possibleexplanation is the damping of short-scale waves by rain [10],which would decrease the mean square slope of the surface andhence increase the backscatter. However, other explanationmay exist (see for example [11]).
These past studies mostly constituted preliminary investi-gations where only particular cases were analyzed. A morecomprehensive study of the effects of rain on ERS-1 altimeterdata was presented by [3]. However, these studies of single fre-quency altimeter data lacked the additional information from asecond altimeter frequency available on the TOPEX/Poseidonaltimeter.
The data available from the NASA Radar Altimeter (NRA)on board the TOPEX/Poseidon satellite allow a more sys-tematic study of the effect of rain to be carried out. Thedual-frequency capabilities of NRA is used to define a moreeffective rain flag.
The paper is laid out as follows. Section II presents abrief summary of the principal results of theoretical studiesand of the main results of earlier studies of ERS-1 andTOPEX/Poseidon data. The method used to detect data possi-bly affected by rain is described in Section III. Several casestudies and a statistical analysis of the behavior of differentaltimeter parameters during rain events are also presented inthis section. Section IV presents a new rain flag based on Kuand C band and compares it with the TMR rain flag. Section Vexamines the attenuation as a function of liquid water contentand investigates the possibility of estimating rainfall rate fromaltimeter data.
II. BACKGROUND
A. TOPEX/Poseidon Data
The TOPEX/Poseidon satellite, which was developed by theNational Aeronautics and Space Administration (NASA) andthe French Space Agency (CNES) was launched on August10, 1992. TOPEX/Poseidon is dedicated to ocean altimetry: theorbit, satellite bus and payload are optimized to map the ocean
surface. The satellite carries two altimeters, one developedby CNES and the other by NASA. The single frequencySolid State Altimeter developed by CNES is an experimentalinstrument intended to demonstrate a new technology. Itoperates approximately 10% of the time. The NASA RadarAltimeter (NRA), which operates at 13.6 GHz (Ku band) and5.3 GHz (C band) simultaneously, is the primary sensor of themission. Only the dual-frequency NRA data will be consideredin this study.
NRA emits radar pulses at a rate of 4500 Hz in the Ku bandand 1200 Hz in the C band [12], [13]. The waveforms receivedafter reflection from the surface and transmission through theatmosphere are averaged onboard in groups of 228 in the Kuband and 50 in the C band, to minimize the impact of noise.These 20 Hz waveforms are interpreted to yield geophysicalvariables of interest, i.e., the travel time of the radar pulseand thus the altimetric height as well as the significant waveheight. The automatic gain control (AGC) of the altimeter isused to calculate the radar cross section, which is related tothe surface wind speed [14]. The so-called Witter and Cheltonalgorithm [15] is used operationally to infer wind speeds fromthe radar cross section. A detailed description of the NRAinstrument and data processing is given in [12], [16].
The TOPEX Microwave Radiometer (TMR) measures thesea surface microwave brightness temperatures at three fre-quencies (18, 21, and 37 GHz) to provide the total watervapor content of the atmosphere. A detailed description ofthe instrument and its brightness temperature algorithms isgiven in [2], [17]. The 21 GHz channel is used primarily forwater vapor measurements. The 18 and 37 GHz channels areused to remove the effects of wind speed and cloud cover.The wet tropospheric range correction as well as the liquidwater content of the atmosphere are estimated from the triplefrequency TMR measurements using the algorithms describedby [18]. The liquid water content is used to calculate the delaydue to water vapor and to flag the data possibly affected byrain (see Appendix C). It should be noted that these estimateof liquid water are not yet fully validated and are still underquestion.
The TOPEX/Poseidon Geophysical Data Records (GDR’s)used in this study come from the AVISO CD-ROM’s [1]. Foreach altimeter sample, 128 parameters are available. Theyare grouped into 11 sets: time, location, altitude, attitude,altimeter range, environmental correction, significant waveheight, backscatter coefficient and AGC, geophysical quantity,brightness temperature and data quality flag [1]. In this study,the backscatter coefficient, significant wave height and dataquality flag groups are of primary interest.
The GDR’s in the Ku and C bands are corrected forthe atmospheric attenuation. The Ku band estimate is used tocorrect both even though the C band correction is smaller.The correction ( ) is computed from the radiometer vaporinduced path delay ( ) and liquid water content ( ) by [24]:
(1)
where is defined as
(2)
TOURNADRE AND MORLAND: EFFECTS OF RAIN ON TOPEX/POSEIDON ALTIMETER DATA 1119
where is given in cm and , in m are the followingconstants for the Ku band:
(3)
For the C band, the correction should be computed with thefollowing parameters [24]:
(4)
The difference between the two corrective terms is small (0.5dB with a mean value of 0.15 dB). The water vapor correctionterm ( ) is alway almost negligible. It is lessthan 0.0025 dB in the Ku band and 0.0001 dB in the C bandfor less than 50 cm. The liquid water term ( ) is ingeneral very small but can reach 0.6 dB (0.1 dB) in the Ku (C)band for a integrated content of 2000m. As the correctionis not fully validated, especially for the liquid water term andas we are mainly interested with the attenuation of the signalby rain, the GDR atmospheric correction have been subtractedfrom the Ku and C band . The have then been correctedfor water vapor attenuation ( ) using thecoefficients given in (3) and (4). The difference between thetwo corrections is almost constant at 0.03 dB.
B. Rain Effects on Altimeter Data
All geophysical variables measured by an altimeter can beaffected by rain. The results of the principal past studies aresummarized in this section.
Rain has three possible effects on microwave pulses. Firstly,liquid water alters the refractive index of the atmosphereand lowers the velocity at which microwaves propagate. Thearrival of the pulse is thus retarded, artificially increasing therange measured by the altimeter. This error was modeled by[6] and it was showed that at Ku and C-band frequencies therange errors induced by rain can be considered as negligible,except during heavy thunderstorms.
Secondly, raindrops scatter some of the energy of theincident pulse back to the sensor, and thus increase the powerbackscattered to the altimeter. At Ku and C band frequencies,scattering is weak and can be neglected [6]
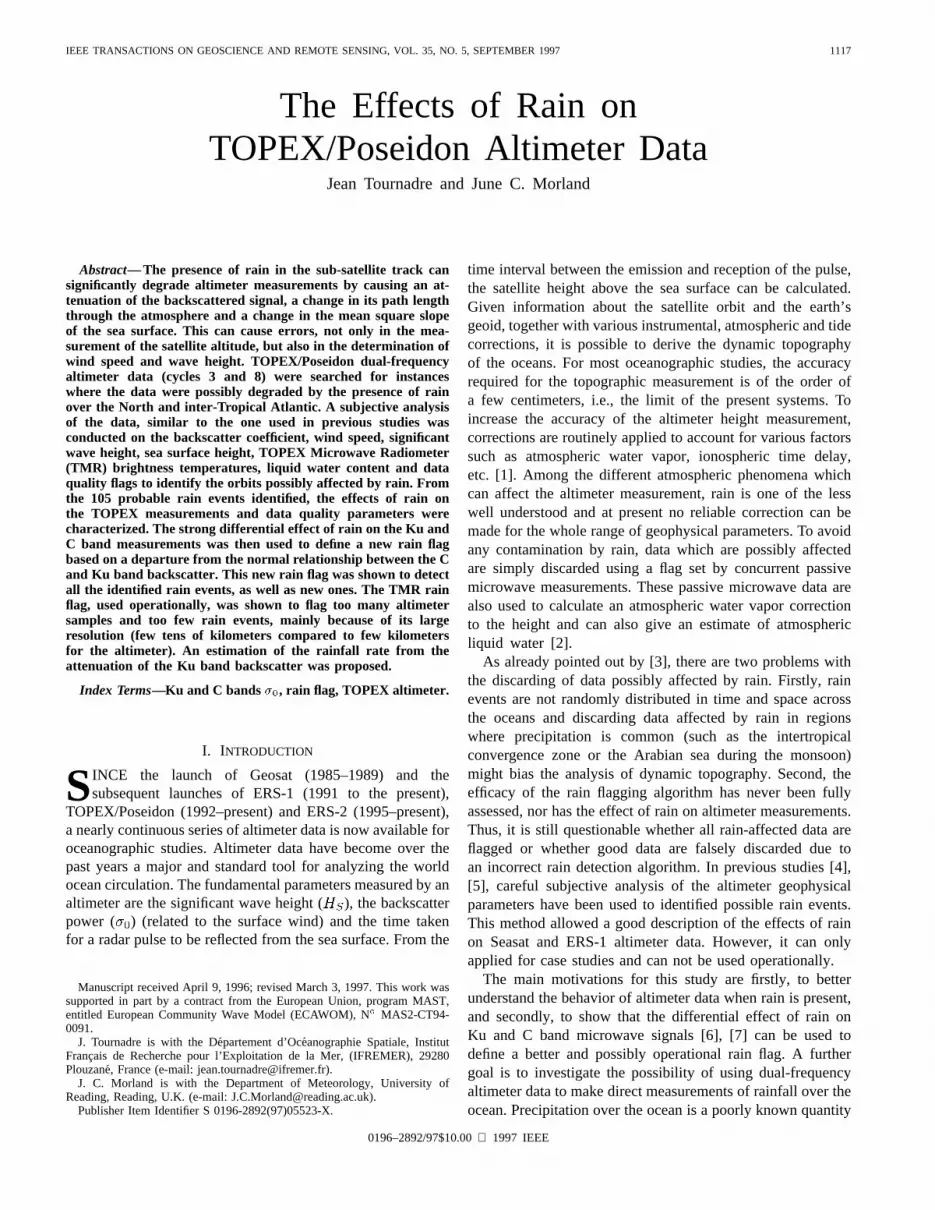
Thirdly, raindrops absorb the altimeter pulse and cause adecrease in the return pulse power. Absorption is the primecontribution of rain to the signal in the Ku and C bands andthe attenuation increases with frequency [6]. Fig. 1 shows thedependence of the absorption coefficient on rain rate at variousfrequencies as calculated by these authors. The attenuation isan order of magnitude larger in the Ku band than in the Cband. For instance, a rain rate of 10 mm hand a 5-km thickrain cell causes an attenuation about 4 dB in the Ku band and0.35 dB in the C band (see the table in Fig. 1).
Rain may not be homogeneous over the altimeter footprint,i.e., a rain cell might not completely fill the footprint or therainfall might vary in intensity across the footprint. When thisoccurs, the signal received by the altimeter is distorted. Theecho return power for given rain cell dimensions was modeledby [8] in order to investigate the effect of changing the positionof the rain cell relative to the altimeter nadir. When the rainfallis light, is reduced, and the distortion in the pulse shape is
Fig. 1. The dependence of the absorption coefficient on rain rate at variousfrequencies [6].
small. For heavier rains, more severe distortion occurs, leadingto biases in and ssh measurements. Such distortions wereobserved on ERS-1 altimeter waveforms [5].
III. REVIEWS OF PAST STUDIES
The discussion so far has been based on theoretical modelsof rain effects. This section goes on to discuss studies madeusing altimeter data.
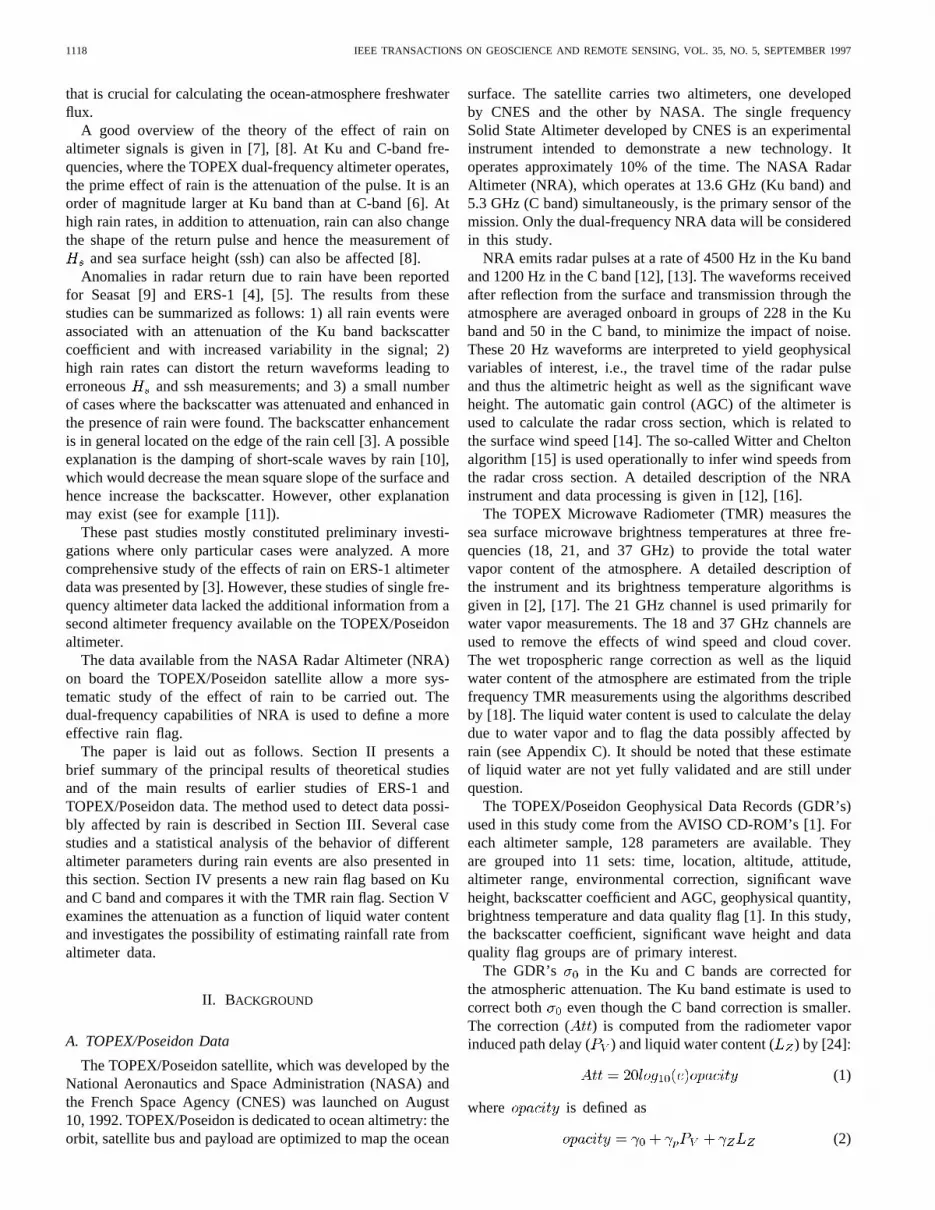
A preliminary assessment of the effects of rain on ERS-1altimeter data was made by [4]. They based their criteria foridentifying rain events on the experience of [9] that an abruptchange in is always associated with rain. Altimeter datacovering a two month period were searched to find 2dB/50 km. This gradient was judged to be sufficiently steep toeliminate changes caused by wind speed fluctuations. Whenthe wind speed is low, small variations in wind speed cancause large changes in , and to avoid these situations theychose to eliminate cases where dB.
For the two month period studied, they found 38 possiblerain events. For each event in , the and atmosphericliquid water content along the orbit were examined. Theyfound that rain events were normally associated with decreasedbackscatter, although they also found one instance of enhancedbackscatter. Since the latter was observed at the edge of arain area, they postulated that it might be due to the rain cellnot completely filling the altimeter footprint. Changes inassociated with the rain events were also observed. In oneinstance, where the altimeter passed over Hurricane Andrew,it temporarily lost lock and stopped tracking. An increase in
1120 IEEE TRANSACTIONS ON GEOSCIENCE AND REMOTE SENSING, VOL. 35, NO. 5, SEPTEMBER 1997
(a)
(b)
Fig. 2. Location of the TOPEX/Poseidon cycle 3 altimeter data (a): whichdo not pass the�0 Ku band gradient criterion and (b) which do not pass theHS Ku band gradient criterion.
liquid water content was observed with each of the possiblerain events. They concluded that although the liquid watercontent, calculated from the Microwave Sounder data, was apromising rain flag, the changes in liquid water content werenot proportional to those in .
The study of rain effects was continued by [3] on ERS-1altimeter data. They used the same criteria as were previouslyoutlined in [4] and searched data covering a two month timeperiod for sharp changes in . Their paper described theobserved changes in , atmospheric liquid water contentand examined, for two cases, the echo waveforms.
They also present an example of enhanced backscatter forwhich they believe the variation to be totally attributable torain. An attenuation in followed by a rise was observed,
(a)
(b)
Fig. 3. Rain events identified using gradient criterion (+) and TMR flaggedrain events (o). (a) cycle 3 and (b) cycle 8.
as was an increase in the liquid water content. No changein occurred. They attribute this secondary effect of rainto the damping of short waves on the ocean surface. This canreduce the sea surface mean square slope and thus increase thesurface backscatter. They suggest that this effect might occurto some extent in most of the rain events but that it can onlybe detected in the few cases where and wind speed arelow and where the increase due to wave damping overcomesthe atmospheric attenuation effect at the edge of a rain cell.
Sharp drops in , coincident with sharp rises inand a rise in the liquid water content, were associated withanother event. When the waveforms were examined, theleading edge was observed to become progressively shalloweras the altimeter footprint passed over the rain cell. The leadingedge eventually disappeared, and the track point shifted toward
TOURNADRE AND MORLAND: EFFECTS OF RAIN ON TOPEX/POSEIDON ALTIMETER DATA 1121
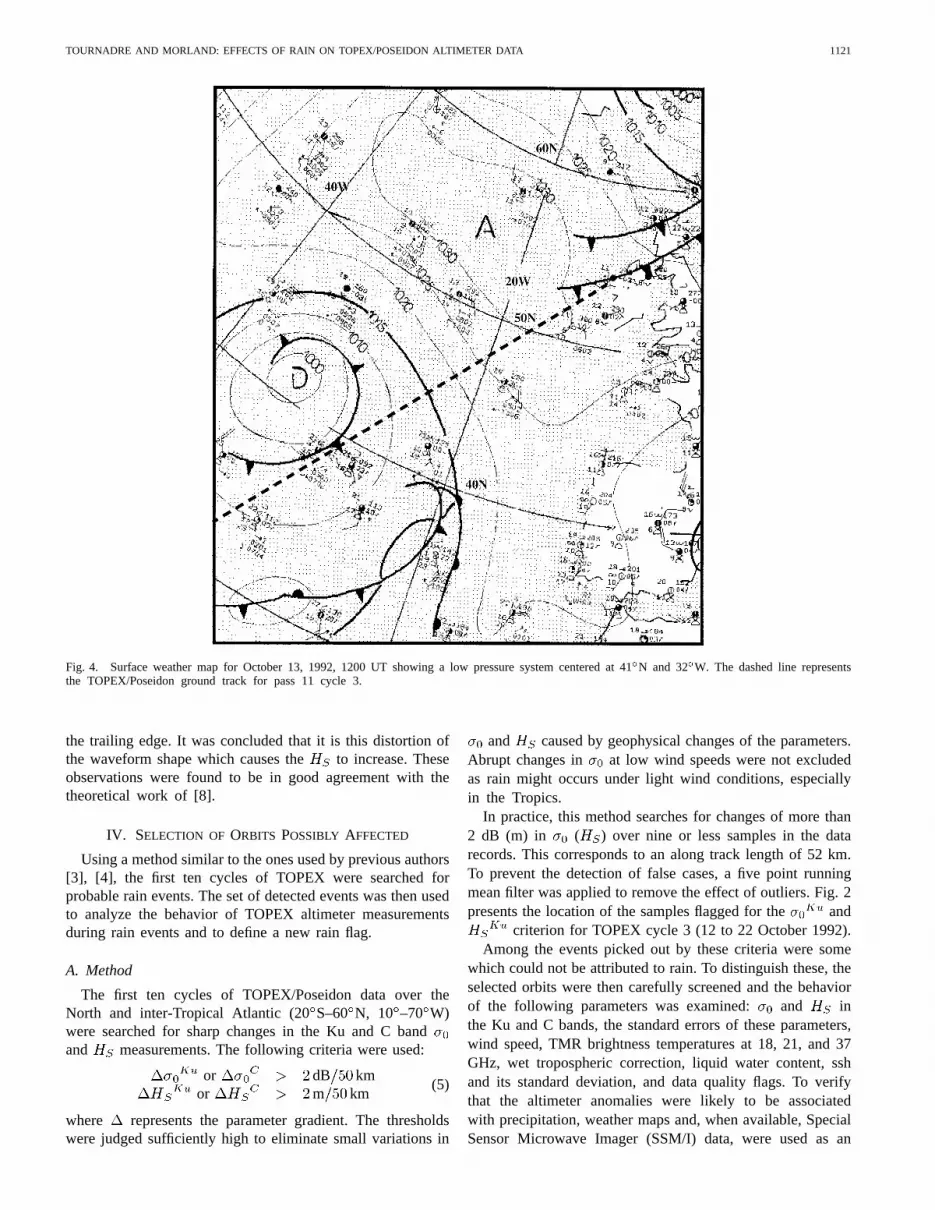
Fig. 4. Surface weather map for October 13, 1992, 1200 UT showing a low pressure system centered at 41�N and 32�W. The dashed line representsthe TOPEX/Poseidon ground track for pass 11 cycle 3.
the trailing edge. It was concluded that it is this distortion ofthe waveform shape which causes the to increase. Theseobservations were found to be in good agreement with thetheoretical work of [8].
IV. SELECTION OF ORBITS POSSIBLY AFFECTED
Using a method similar to the ones used by previous authors[3], [4], the first ten cycles of TOPEX were searched forprobable rain events. The set of detected events was then usedto analyze the behavior of TOPEX altimeter measurementsduring rain events and to define a new rain flag.
A. Method
The first ten cycles of TOPEX/Poseidon data over theNorth and inter-Tropical Atlantic (20S–60 N, 10 –70 W)were searched for sharp changes in the Ku and C bandand measurements. The following criteria were used:
or dB kmor m km
(5)
where represents the parameter gradient. The thresholdswere judged sufficiently high to eliminate small variations in
and caused by geophysical changes of the parameters.Abrupt changes in at low wind speeds were not excludedas rain might occurs under light wind conditions, especiallyin the Tropics.
In practice, this method searches for changes of more than2 dB (m) in ( ) over nine or less samples in the datarecords. This corresponds to an along track length of 52 km.To prevent the detection of false cases, a five point runningmean filter was applied to remove the effect of outliers. Fig. 2presents the location of the samples flagged for the and
criterion for TOPEX cycle 3 (12 to 22 October 1992).Among the events picked out by these criteria were some
which could not be attributed to rain. To distinguish these, theselected orbits were then carefully screened and the behaviorof the following parameters was examined: and inthe Ku and C bands, the standard errors of these parameters,wind speed, TMR brightness temperatures at 18, 21, and 37GHz, wet tropospheric correction, liquid water content, sshand its standard deviation, and data quality flags. To verifythat the altimeter anomalies were likely to be associatedwith precipitation, weather maps and, when available, SpecialSensor Microwave Imager (SSM/I) data, were used as an
1122 IEEE TRANSACTIONS ON GEOSCIENCE AND REMOTE SENSING, VOL. 35, NO. 5, SEPTEMBER 1997
(a)
(b)
(c)
(d)
Fig. 5. Pass 11 cycle 3 (0930 UT 13 October 1992) TOPEX altimeter measurements over North Atlantic, (a)�0 in the Ku band (solid line) and theC band (thin line), the stars denote the samples flagged by the TMR rain flag, (b)HS in the Ku band (solid line) and in the C band (thin line), (c)TMR liquid water content,LZ , and (d) ssh.
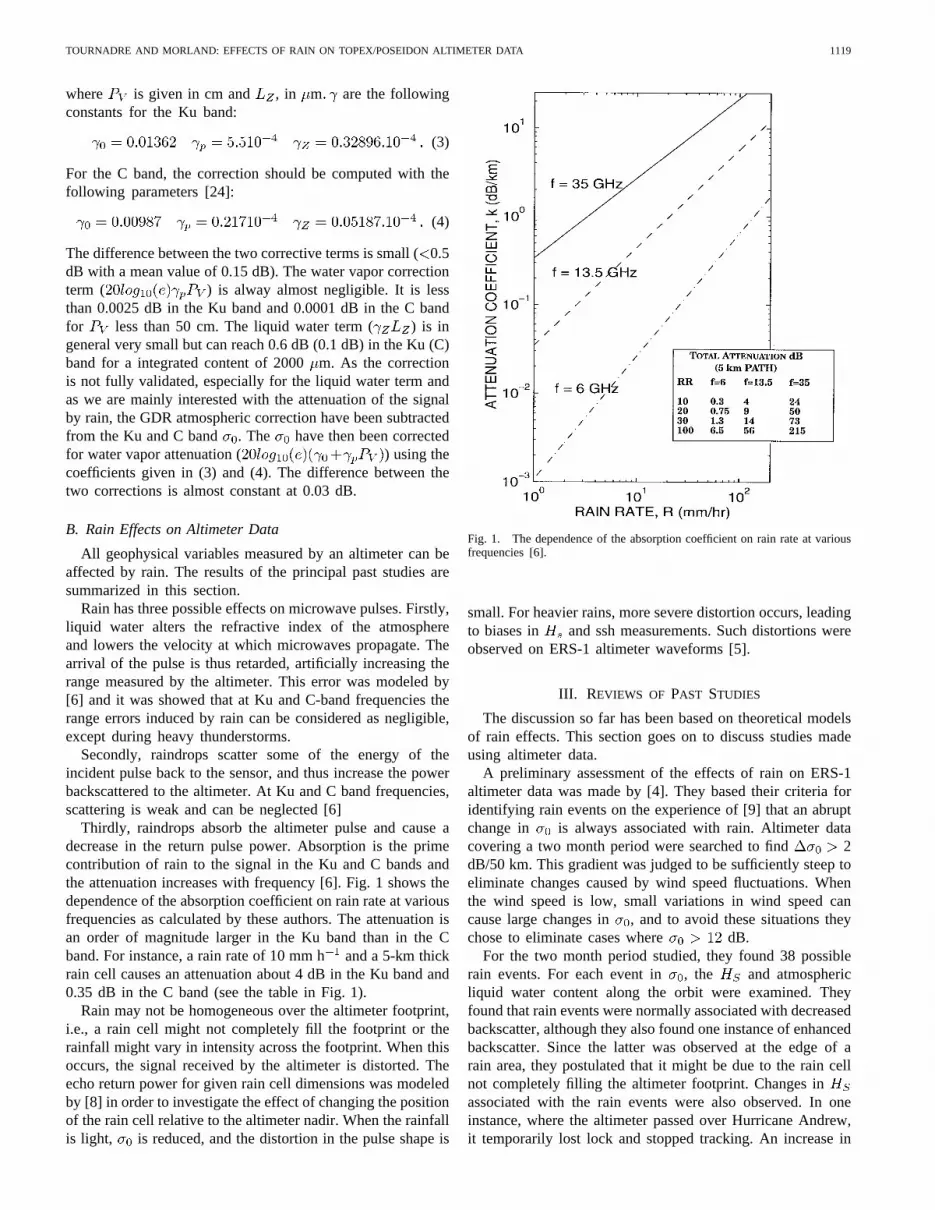
independent means of rain detection. Although it was notpossible to completely ascertain the presence of rain, thisanalysis eliminated problems due to sea ice, small islandor land contamination and small fluctuations of low windspeeds which can lead to large fluctuations in. This generalphilosophy was initially applied to Seasat data [9] and was alsoused to examine ERS-1 data [4]. Because of the quantity ofdata involved, only the two TOPEX cycles where the mostpossible rain events were detected (cycles 3 and 8) wereanalyzed in detail. This careful subjective analysis identified105 highly probable rain events, 57 in cycle 3 and 48 in cycle8. Fig. 3 presents the location of the identified rain events forboth cycles. Two groups of rain events can be distinguished
in Fig. 3. The first group is associated with low pressuresystems traveling across the North Atlantic. The second oneis centered around 5–10N and is associated with the InterTropical Convergence Zone.
B. Example of Rain Events
The cases presented in this section have been selected toshow examples of the wide diversity of behavior exhibited bythe altimeter parameters.
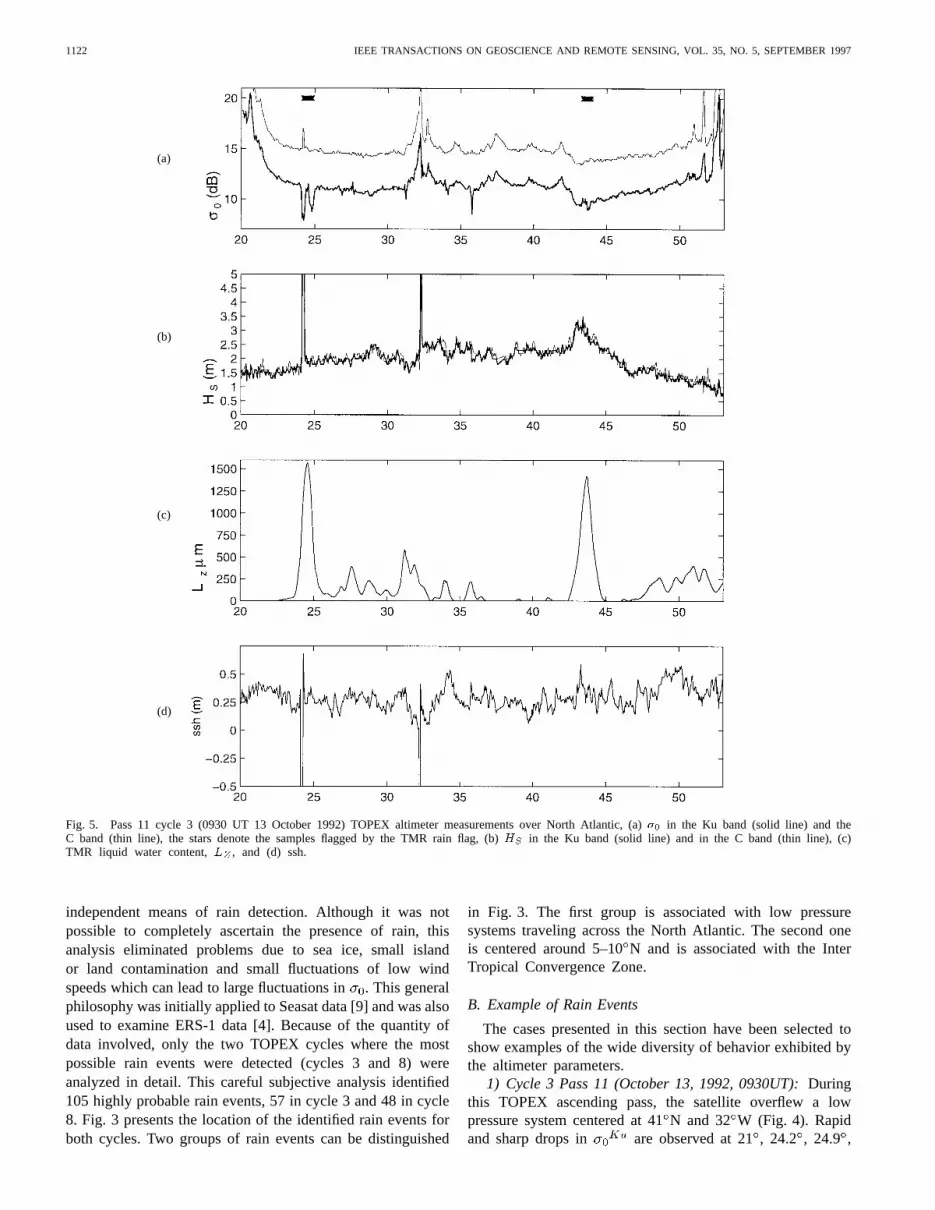
1) Cycle 3 Pass 11 (October 13, 1992, 0930UT):Duringthis TOPEX ascending pass, the satellite overflew a lowpressure system centered at 41N and 32W (Fig. 4). Rapidand sharp drops in are observed at 21, 24.2 , 24.9 ,
TOURNADRE AND MORLAND: EFFECTS OF RAIN ON TOPEX/POSEIDON ALTIMETER DATA 1123
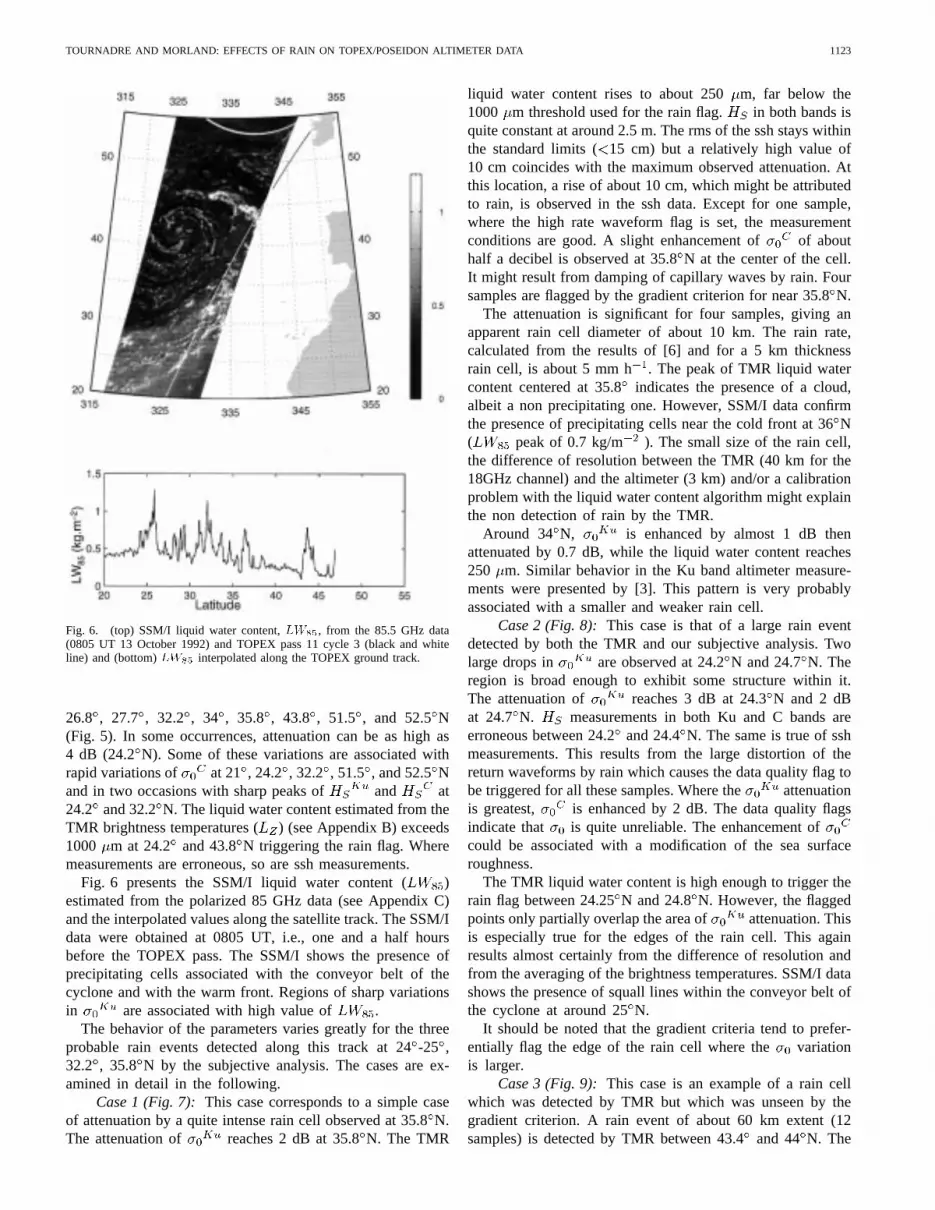
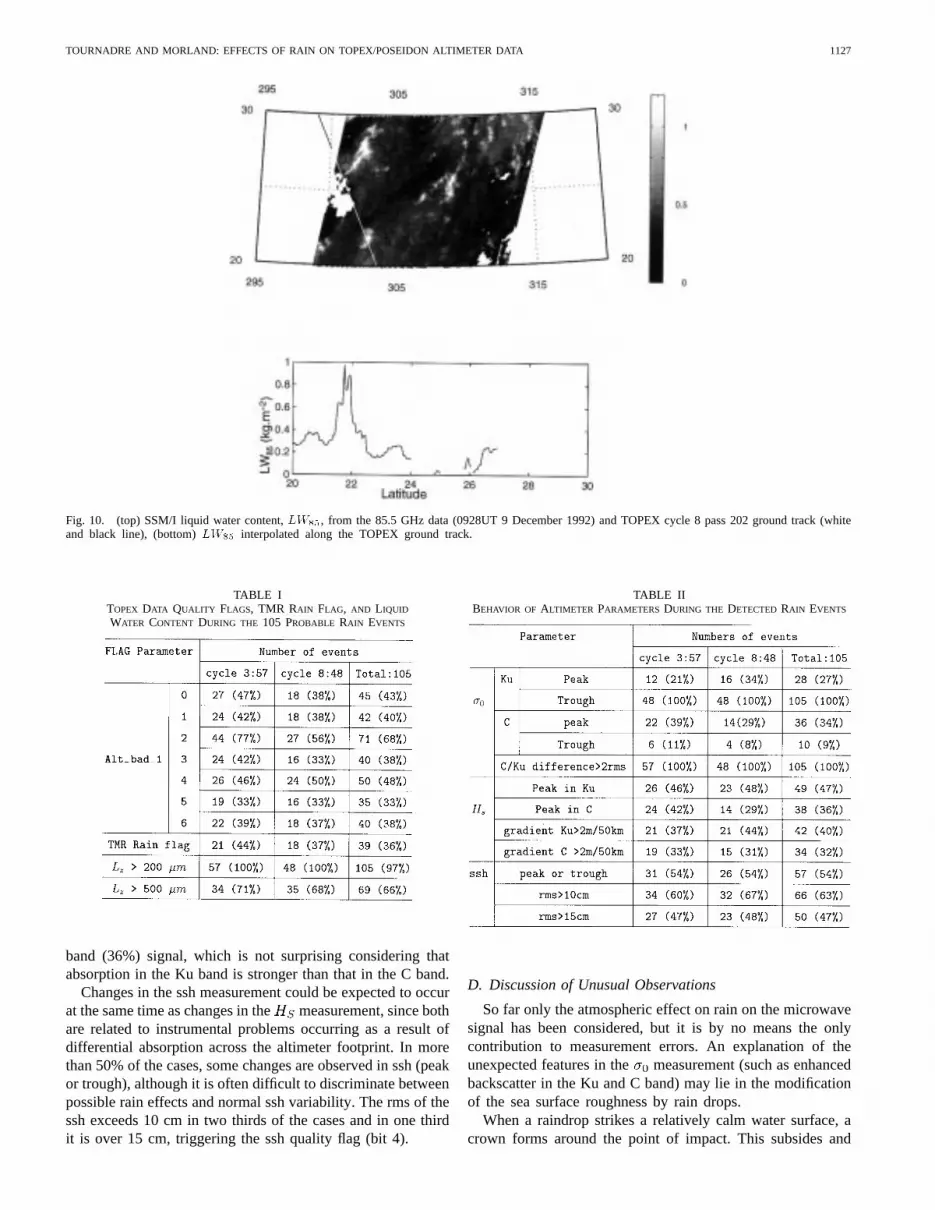
Fig. 6. (top) SSM/I liquid water content,LW85, from the 85.5 GHz data(0805 UT 13 October 1992) and TOPEX pass 11 cycle 3 (black and whiteline) and (bottom)LW85 interpolated along the TOPEX ground track.
26.8 , 27.7 , 32.2 , 34 , 35.8 , 43.8 , 51.5 , and 52.5N(Fig. 5). In some occurrences, attenuation can be as high as4 dB (24.2 N). Some of these variations are associated withrapid variations of at 21 , 24.2 , 32.2 , 51.5 , and 52.5Nand in two occasions with sharp peaks of and at24.2 and 32.2N. The liquid water content estimated from theTMR brightness temperatures () (see Appendix B) exceeds1000 m at 24.2 and 43.8N triggering the rain flag. Wheremeasurements are erroneous, so are ssh measurements.
Fig. 6 presents the SSM/I liquid water content ( )estimated from the polarized 85 GHz data (see Appendix C)and the interpolated values along the satellite track. The SSM/Idata were obtained at 0805 UT, i.e., one and a half hoursbefore the TOPEX pass. The SSM/I shows the presence ofprecipitating cells associated with the conveyor belt of thecyclone and with the warm front. Regions of sharp variationsin are associated with high value of .
The behavior of the parameters varies greatly for the threeprobable rain events detected along this track at 24-25 ,32.2 , 35.8 N by the subjective analysis. The cases are ex-amined in detail in the following.
Case 1 (Fig. 7): This case corresponds to a simple caseof attenuation by a quite intense rain cell observed at 35.8N.The attenuation of reaches 2 dB at 35.8N. The TMR
liquid water content rises to about 250m, far below the1000 m threshold used for the rain flag. in both bands isquite constant at around 2.5 m. The rms of the ssh stays withinthe standard limits (15 cm) but a relatively high value of10 cm coincides with the maximum observed attenuation. Atthis location, a rise of about 10 cm, which might be attributedto rain, is observed in the ssh data. Except for one sample,where the high rate waveform flag is set, the measurementconditions are good. A slight enhancement of of abouthalf a decibel is observed at 35.8N at the center of the cell.It might result from damping of capillary waves by rain. Foursamples are flagged by the gradient criterion for near 35.8N.
The attenuation is significant for four samples, giving anapparent rain cell diameter of about 10 km. The rain rate,calculated from the results of [6] and for a 5 km thicknessrain cell, is about 5 mm h . The peak of TMR liquid watercontent centered at 35.8indicates the presence of a cloud,albeit a non precipitating one. However, SSM/I data confirmthe presence of precipitating cells near the cold front at 36N( peak of 0.7 kg/m ). The small size of the rain cell,the difference of resolution between the TMR (40 km for the18GHz channel) and the altimeter (3 km) and/or a calibrationproblem with the liquid water content algorithm might explainthe non detection of rain by the TMR.
Around 34 N, is enhanced by almost 1 dB thenattenuated by 0.7 dB, while the liquid water content reaches250 m. Similar behavior in the Ku band altimeter measure-ments were presented by [3]. This pattern is very probablyassociated with a smaller and weaker rain cell.
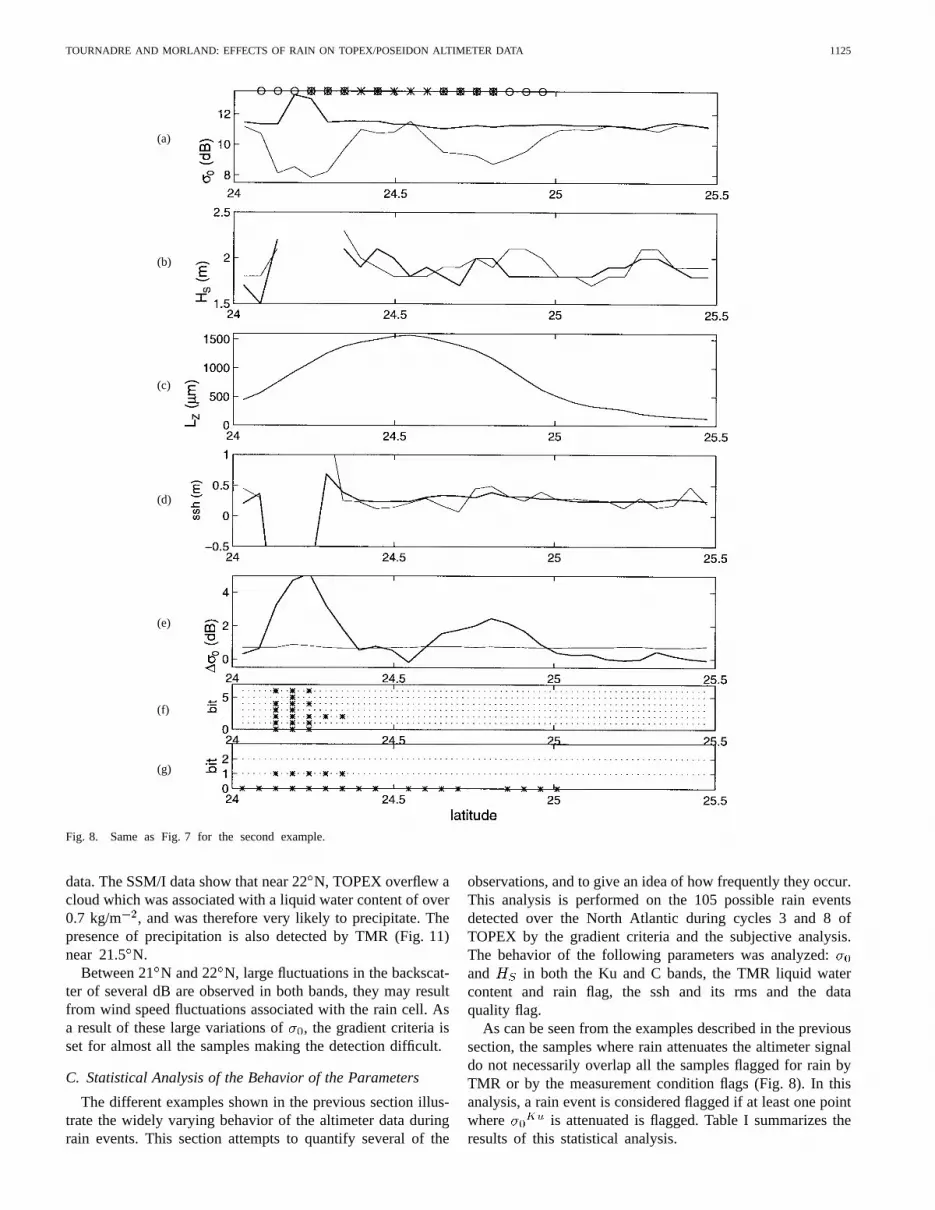
Case 2 (Fig. 8): This case is that of a large rain eventdetected by both the TMR and our subjective analysis. Twolarge drops in are observed at 24.2N and 24.7N. Theregion is broad enough to exhibit some structure within it.The attenuation of reaches 3 dB at 24.3N and 2 dBat 24.7 N. measurements in both Ku and C bands areerroneous between 24.2and 24.4N. The same is true of sshmeasurements. This results from the large distortion of thereturn waveforms by rain which causes the data quality flag tobe triggered for all these samples. Where the attenuationis greatest, is enhanced by 2 dB. The data quality flagsindicate that is quite unreliable. The enhancement ofcould be associated with a modification of the sea surfaceroughness.
The TMR liquid water content is high enough to trigger therain flag between 24.25N and 24.8N. However, the flaggedpoints only partially overlap the area of attenuation. Thisis especially true for the edges of the rain cell. This againresults almost certainly from the difference of resolution andfrom the averaging of the brightness temperatures. SSM/I datashows the presence of squall lines within the conveyor belt ofthe cyclone at around 25N.
It should be noted that the gradient criteria tend to prefer-entially flag the edge of the rain cell where the variationis larger.
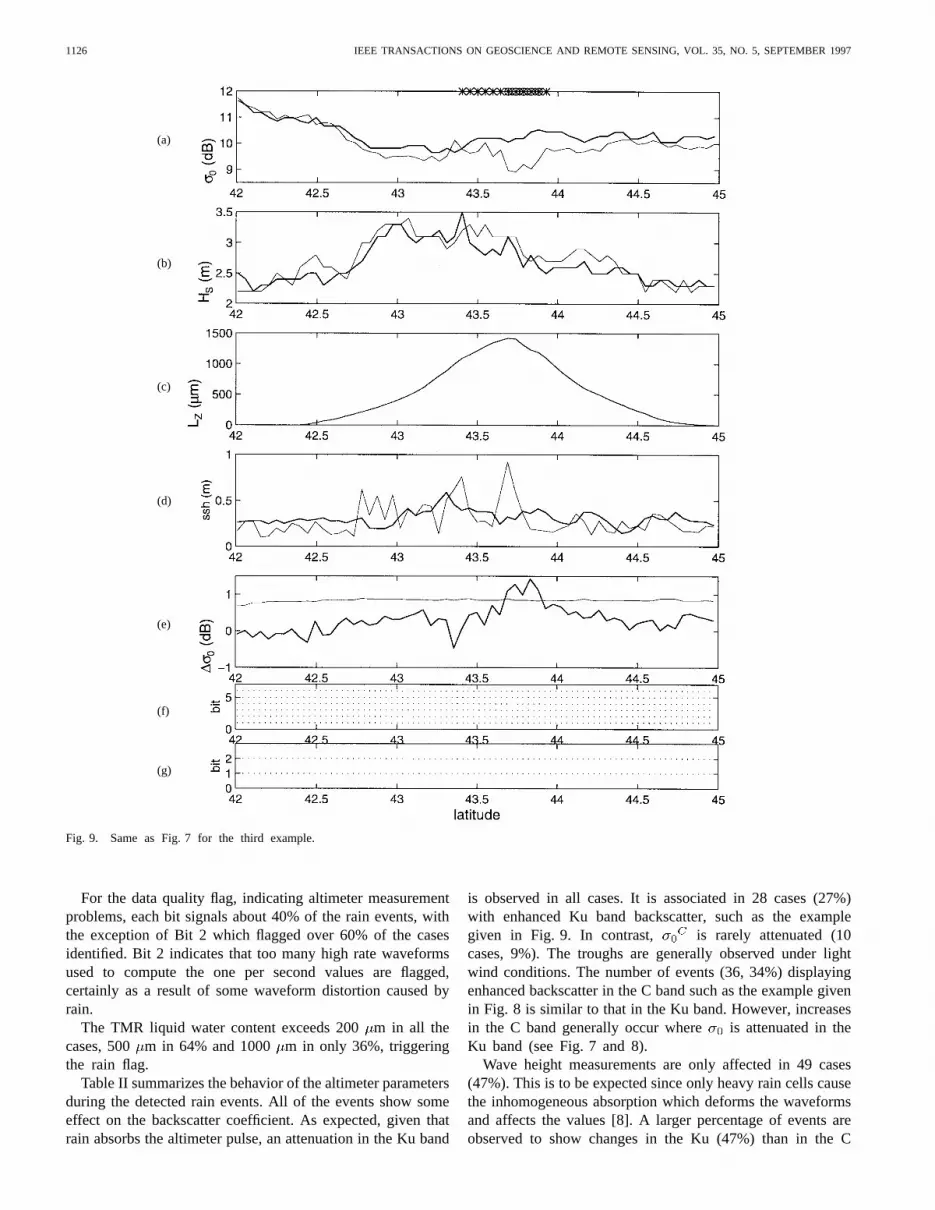
Case 3 (Fig. 9): This case is an example of a rain cellwhich was detected by TMR but which was unseen by thegradient criterion. A rain event of about 60 km extent (12samples) is detected by TMR between 43.4and 44N. The
1124 IEEE TRANSACTIONS ON GEOSCIENCE AND REMOTE SENSING, VOL. 35, NO. 5, SEPTEMBER 1997
(a)
(b)
(c)
(d)
(e)
(f)
(g)
Fig. 7. TOPEX altimeter profiles for TOPEX pass 11 cycle 3 (first example), (a)�0 in the Ku band (thin solid line) and the C band (solid line) (3.9 dBhave been subtracted from�C
0to give similar scales between Ku and C bands); samples flagged by the TMR: stars; samples flagged by the new rain flag:
circles, (b)HS in Ku (solid line) and C band (thin line), (c) TMR liquid water content, (d) ssh (solid line) and ten times the rms of the ssh (thin line),(e) departure from the normal C/Ku relationship (solid line) and rms of the relation (thin line), (f) data quality flag Alt_bad_1, the samples where a flagis set are represented by stars, (g) gradient flag (bit 0:�
Ku0
, bit 1: �C0
, bit 2 HKuS
, bit 3: HCS
).
liquid water content reaches 1500m. At this location,is attenuated by less than 1 dB and the gradient is not highenough to be signaled. An enhancement of 0.5 dB is observedat the southern edge of the cell associated with a small peak( 0.5m) of . Except for one sample where the rmsreaches 9 cm, ssh appears unaffected by rain.
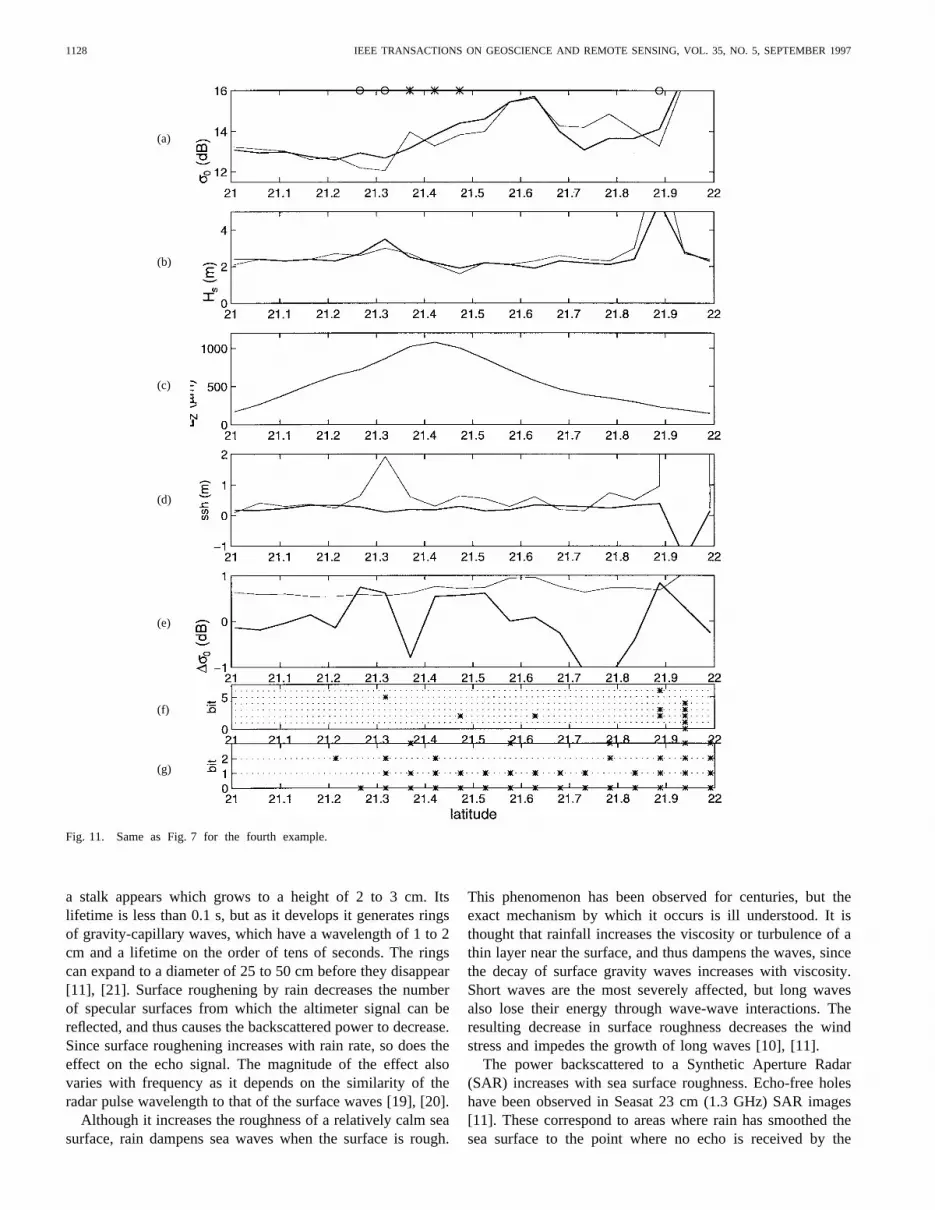
2) Cycle 8 Pass 202 (December 9, 1992, 0959UT) (Fig. 11):When looking for data possibly affected by rain, [3] discardeddata where exceeded 12 dB, i.e., light winds (4 m/s),because in this regime, small variation in wind speed can causelarge fluctuations in . However, especially in tropical and
equatorial regions, rain can occur under light wind conditionand for this reason, such a restriction was not applied in ouranalysis. The presence of rain is difficult to ascertain underlight wind condition, as in both the Ku and C bands canfluctuate by several decibels. Therefore, TMR liquid watercontent and SSM/I data were used to help in the decision.
The following case is an example of the detection of rainunder light wind speed conditions. Fig. 10 presents SSM/Iliquid water content obtained at 0928UT as well as the TOPEXground track. The time lag of less than half an hour betweenthe two satellite observations allows a good comparison of the
TOURNADRE AND MORLAND: EFFECTS OF RAIN ON TOPEX/POSEIDON ALTIMETER DATA 1125
(a)
(b)
(c)
(d)
(e)
(f)
(g)
Fig. 8. Same as Fig. 7 for the second example.
data. The SSM/I data show that near 22N, TOPEX overflew acloud which was associated with a liquid water content of over0.7 kg/m , and was therefore very likely to precipitate. Thepresence of precipitation is also detected by TMR (Fig. 11)near 21.5N.
Between 21N and 22N, large fluctuations in the backscat-ter of several dB are observed in both bands, they may resultfrom wind speed fluctuations associated with the rain cell. Asa result of these large variations of, the gradient criteria isset for almost all the samples making the detection difficult.
C. Statistical Analysis of the Behavior of the Parameters
The different examples shown in the previous section illus-trate the widely varying behavior of the altimeter data duringrain events. This section attempts to quantify several of the
observations, and to give an idea of how frequently they occur.This analysis is performed on the 105 possible rain eventsdetected over the North Atlantic during cycles 3 and 8 ofTOPEX by the gradient criteria and the subjective analysis.The behavior of the following parameters was analyzed:and in both the Ku and C bands, the TMR liquid watercontent and rain flag, the ssh and its rms and the dataquality flag.
As can be seen from the examples described in the previoussection, the samples where rain attenuates the altimeter signaldo not necessarily overlap all the samples flagged for rain byTMR or by the measurement condition flags (Fig. 8). In thisanalysis, a rain event is considered flagged if at least one pointwhere is attenuated is flagged. Table I summarizes theresults of this statistical analysis.
1126 IEEE TRANSACTIONS ON GEOSCIENCE AND REMOTE SENSING, VOL. 35, NO. 5, SEPTEMBER 1997
(a)
(b)
(c)
(d)
(e)
(f)
(g)
Fig. 9. Same as Fig. 7 for the third example.
For the data quality flag, indicating altimeter measurementproblems, each bit signals about 40% of the rain events, withthe exception of Bit 2 which flagged over 60% of the casesidentified. Bit 2 indicates that too many high rate waveformsused to compute the one per second values are flagged,certainly as a result of some waveform distortion caused byrain.
The TMR liquid water content exceeds 200m in all thecases, 500 m in 64% and 1000 m in only 36%, triggeringthe rain flag.
Table II summarizes the behavior of the altimeter parametersduring the detected rain events. All of the events show someeffect on the backscatter coefficient. As expected, given thatrain absorbs the altimeter pulse, an attenuation in the Ku band
is observed in all cases. It is associated in 28 cases (27%)with enhanced Ku band backscatter, such as the examplegiven in Fig. 9. In contrast, is rarely attenuated (10cases, 9%). The troughs are generally observed under lightwind conditions. The number of events (36, 34%) displayingenhanced backscatter in the C band such as the example givenin Fig. 8 is similar to that in the Ku band. However, increasesin the C band generally occur where is attenuated in theKu band (see Fig. 7 and 8).
Wave height measurements are only affected in 49 cases(47%). This is to be expected since only heavy rain cells causethe inhomogeneous absorption which deforms the waveformsand affects the values [8]. A larger percentage of events areobserved to show changes in the Ku (47%) than in the C
TOURNADRE AND MORLAND: EFFECTS OF RAIN ON TOPEX/POSEIDON ALTIMETER DATA 1127
Fig. 10. (top) SSM/I liquid water content,LW85, from the 85.5 GHz data (0928UT 9 December 1992) and TOPEX cycle 8 pass 202 ground track (whiteand black line), (bottom)LW85 interpolated along the TOPEX ground track.
TABLE ITOPEX DATA QUALITY FLAGS, TMR RAIN FLAG, AND LIQUID
WATER CONTENT DURING THE 105 PROBABLE RAIN EVENTS
band (36%) signal, which is not surprising considering thatabsorption in the Ku band is stronger than that in the C band.
Changes in the ssh measurement could be expected to occurat the same time as changes in the measurement, since bothare related to instrumental problems occurring as a result ofdifferential absorption across the altimeter footprint. In morethan 50% of the cases, some changes are observed in ssh (peakor trough), although it is often difficult to discriminate betweenpossible rain effects and normal ssh variability. The rms of thessh exceeds 10 cm in two thirds of the cases and in one thirdit is over 15 cm, triggering the ssh quality flag (bit 4).
TABLE IIBEHAVIOR OF ALTIMETER PARAMETERS DURING THE DETECTED RAIN EVENTS
D. Discussion of Unusual Observations
So far only the atmospheric effect on rain on the microwavesignal has been considered, but it is by no means the onlycontribution to measurement errors. An explanation of theunexpected features in the measurement (such as enhancedbackscatter in the Ku and C band) may lie in the modificationof the sea surface roughness by rain drops.
When a raindrop strikes a relatively calm water surface, acrown forms around the point of impact. This subsides and
1128 IEEE TRANSACTIONS ON GEOSCIENCE AND REMOTE SENSING, VOL. 35, NO. 5, SEPTEMBER 1997
(a)
(b)
(c)
(d)
(e)
(f)
(g)
Fig. 11. Same as Fig. 7 for the fourth example.
a stalk appears which grows to a height of 2 to 3 cm. Itslifetime is less than 0.1 s, but as it develops it generates ringsof gravity-capillary waves, which have a wavelength of 1 to 2cm and a lifetime on the order of tens of seconds. The ringscan expand to a diameter of 25 to 50 cm before they disappear[11], [21]. Surface roughening by rain decreases the numberof specular surfaces from which the altimeter signal can bereflected, and thus causes the backscattered power to decrease.Since surface roughening increases with rain rate, so does theeffect on the echo signal. The magnitude of the effect alsovaries with frequency as it depends on the similarity of theradar pulse wavelength to that of the surface waves [19], [20].
Although it increases the roughness of a relatively calm seasurface, rain dampens sea waves when the surface is rough.
This phenomenon has been observed for centuries, but theexact mechanism by which it occurs is ill understood. It isthought that rainfall increases the viscosity or turbulence of athin layer near the surface, and thus dampens the waves, sincethe decay of surface gravity waves increases with viscosity.Short waves are the most severely affected, but long wavesalso lose their energy through wave-wave interactions. Theresulting decrease in surface roughness decreases the windstress and impedes the growth of long waves [10], [11].
The power backscattered to a Synthetic Aperture Radar(SAR) increases with sea surface roughness. Echo-free holeshave been observed in Seasat 23 cm (1.3 GHz) SAR images[11]. These correspond to areas where rain has smoothed thesea surface to the point where no echo is received by the
TOURNADRE AND MORLAND: EFFECTS OF RAIN ON TOPEX/POSEIDON ALTIMETER DATA 1129
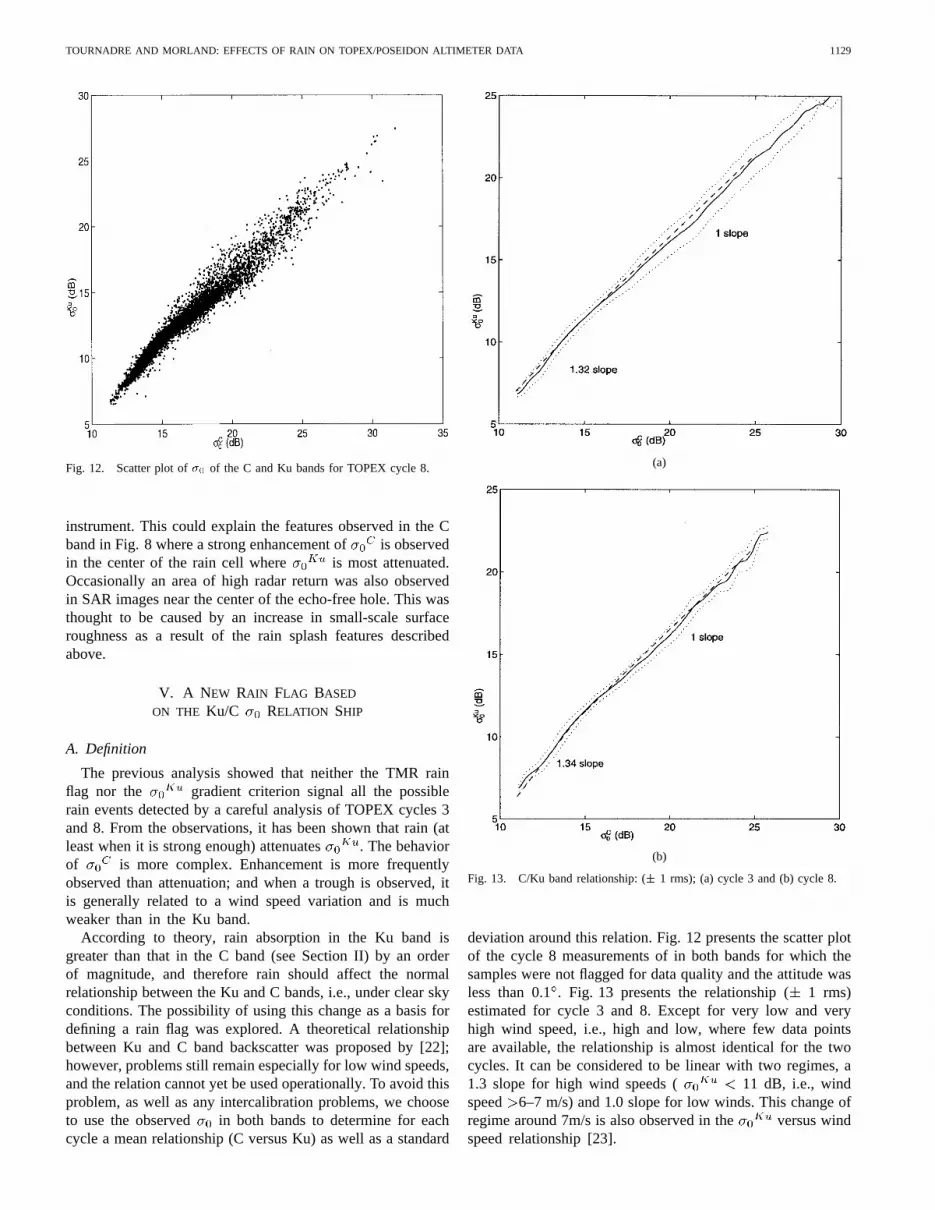
Fig. 12. Scatter plot of�0 of the C and Ku bands for TOPEX cycle 8.
instrument. This could explain the features observed in the Cband in Fig. 8 where a strong enhancement of is observedin the center of the rain cell where is most attenuated.Occasionally an area of high radar return was also observedin SAR images near the center of the echo-free hole. This wasthought to be caused by an increase in small-scale surfaceroughness as a result of the rain splash features describedabove.
V. A NEW RAIN FLAG BASED
ON THE Ku/C RELATION SHIP
A. Definition
The previous analysis showed that neither the TMR rainflag nor the gradient criterion signal all the possiblerain events detected by a careful analysis of TOPEX cycles 3and 8. From the observations, it has been shown that rain (atleast when it is strong enough) attenuates . The behaviorof is more complex. Enhancement is more frequentlyobserved than attenuation; and when a trough is observed, itis generally related to a wind speed variation and is muchweaker than in the Ku band.
According to theory, rain absorption in the Ku band isgreater than that in the C band (see Section II) by an orderof magnitude, and therefore rain should affect the normalrelationship between the Ku and C bands, i.e., under clear skyconditions. The possibility of using this change as a basis fordefining a rain flag was explored. A theoretical relationshipbetween Ku and C band backscatter was proposed by [22];however, problems still remain especially for low wind speeds,and the relation cannot yet be used operationally. To avoid thisproblem, as well as any intercalibration problems, we chooseto use the observed in both bands to determine for eachcycle a mean relationship (C versus Ku) as well as a standard
(a)
(b)
Fig. 13. C/Ku band relationship: (� 1 rms); (a) cycle 3 and (b) cycle 8.
deviation around this relation. Fig. 12 presents the scatter plotof the cycle 8 measurements of in both bands for which thesamples were not flagged for data quality and the attitude wasless than 0.1. Fig. 13 presents the relationship (1 rms)estimated for cycle 3 and 8. Except for very low and veryhigh wind speed, i.e., high and low, where few data pointsare available, the relationship is almost identical for the twocycles. It can be considered to be linear with two regimes, a1.3 slope for high wind speeds ( 11 dB, i.e., windspeed 6–7 m/s) and 1.0 slope for low winds. This change ofregime around 7m/s is also observed in the versus windspeed relationship [23].
1130 IEEE TRANSACTIONS ON GEOSCIENCE AND REMOTE SENSING, VOL. 35, NO. 5, SEPTEMBER 1997
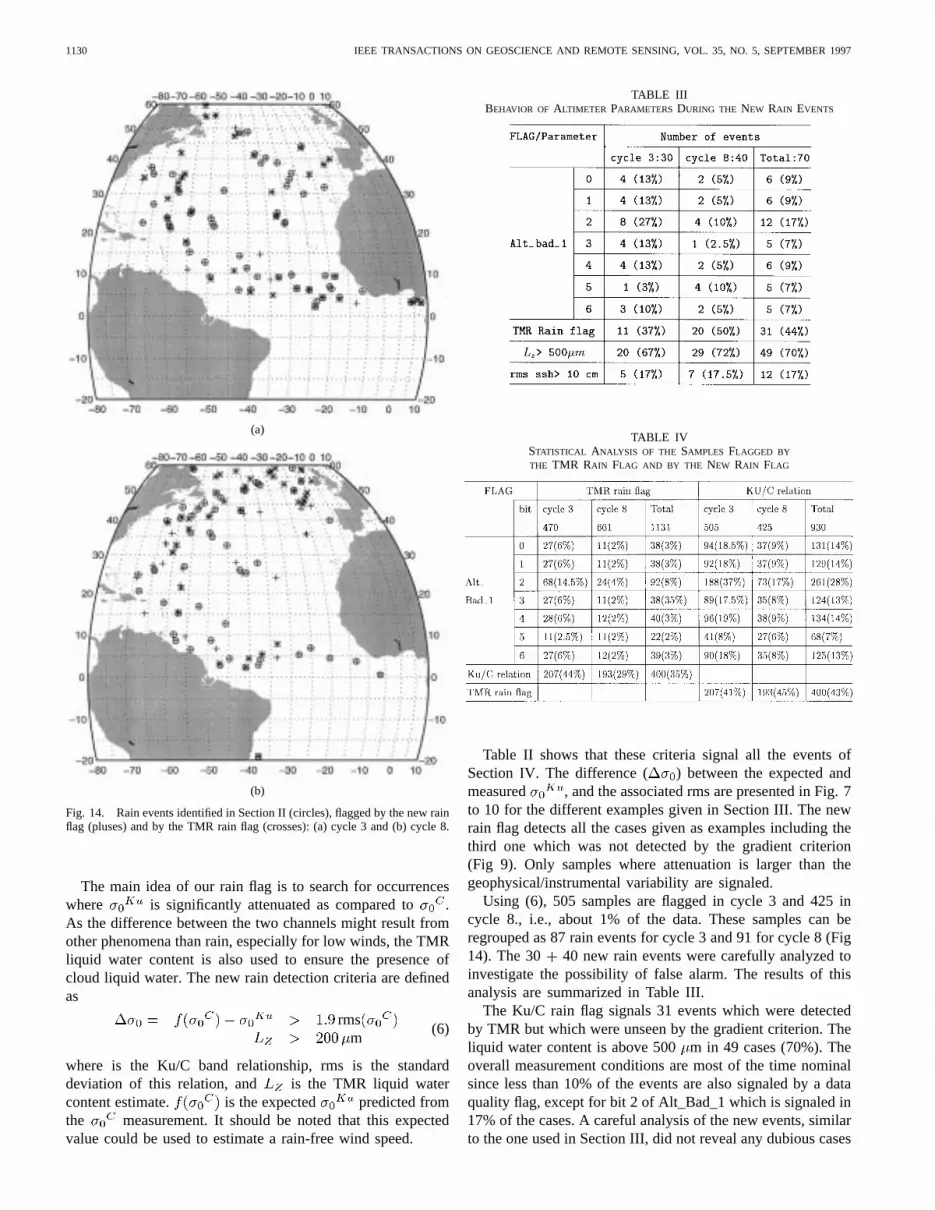
(a)
(b)
Fig. 14. Rain events identified in Section II (circles), flagged by the new rainflag (pluses) and by the TMR rain flag (crosses): (a) cycle 3 and (b) cycle 8.
The main idea of our rain flag is to search for occurrenceswhere is significantly attenuated as compared to .As the difference between the two channels might result fromother phenomena than rain, especially for low winds, the TMRliquid water content is also used to ensure the presence ofcloud liquid water. The new rain detection criteria are definedas
rmsm
(6)
where is the Ku/C band relationship, rms is the standarddeviation of this relation, and is the TMR liquid watercontent estimate. is the expected predicted fromthe measurement. It should be noted that this expectedvalue could be used to estimate a rain-free wind speed.
TABLE IIIBEHAVIOR OF ALTIMETER PARAMETERS DURING THE NEW RAIN EVENTS
TABLE IVSTATISTICAL ANALYSIS OF THE SAMPLES FLAGGED BY
THE TMR RAIN FLAG AND BY THE NEW RAIN FLAG
Table II shows that these criteria signal all the events ofSection IV. The difference ( ) between the expected andmeasured , and the associated rms are presented in Fig. 7to 10 for the different examples given in Section III. The newrain flag detects all the cases given as examples including thethird one which was not detected by the gradient criterion(Fig 9). Only samples where attenuation is larger than thegeophysical/instrumental variability are signaled.
Using (6), 505 samples are flagged in cycle 3 and 425 incycle 8., i.e., about 1% of the data. These samples can beregrouped as 87 rain events for cycle 3 and 91 for cycle 8 (Fig14). The 30 40 new rain events were carefully analyzed toinvestigate the possibility of false alarm. The results of thisanalysis are summarized in Table III.
The Ku/C rain flag signals 31 events which were detectedby TMR but which were unseen by the gradient criterion. Theliquid water content is above 500m in 49 cases (70%). Theoverall measurement conditions are most of the time nominalsince less than 10% of the events are also signaled by a dataquality flag, except for bit 2 of Alt_Bad_1 which is signaled in17% of the cases. A careful analysis of the new events, similarto the one used in Section III, did not reveal any dubious cases
TOURNADRE AND MORLAND: EFFECTS OF RAIN ON TOPEX/POSEIDON ALTIMETER DATA 1131
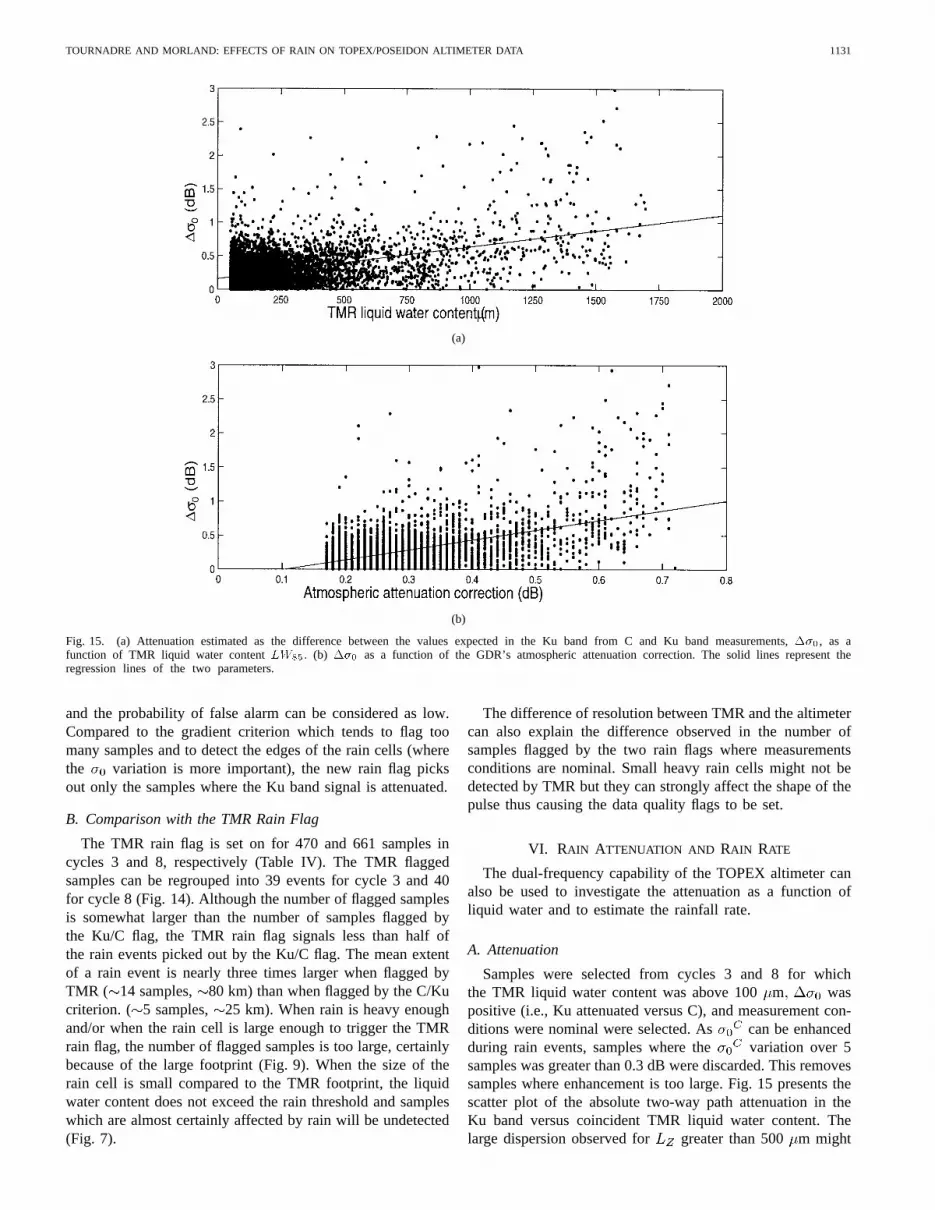
(a)
(b)
Fig. 15. (a) Attenuation estimated as the difference between the values expected in the Ku band from C and Ku band measurements,��0, as afunction of TMR liquid water contentLW85. (b) ��0 as a function of the GDR’s atmospheric attenuation correction. The solid lines represent theregression lines of the two parameters.
and the probability of false alarm can be considered as low.Compared to the gradient criterion which tends to flag toomany samples and to detect the edges of the rain cells (wherethe variation is more important), the new rain flag picksout only the samples where the Ku band signal is attenuated.
B. Comparison with the TMR Rain Flag
The TMR rain flag is set on for 470 and 661 samples incycles 3 and 8, respectively (Table IV). The TMR flaggedsamples can be regrouped into 39 events for cycle 3 and 40for cycle 8 (Fig. 14). Although the number of flagged samplesis somewhat larger than the number of samples flagged bythe Ku/C flag, the TMR rain flag signals less than half ofthe rain events picked out by the Ku/C flag. The mean extentof a rain event is nearly three times larger when flagged byTMR ( 14 samples, 80 km) than when flagged by the C/Kucriterion. ( 5 samples, 25 km). When rain is heavy enoughand/or when the rain cell is large enough to trigger the TMRrain flag, the number of flagged samples is too large, certainlybecause of the large footprint (Fig. 9). When the size of therain cell is small compared to the TMR footprint, the liquidwater content does not exceed the rain threshold and sampleswhich are almost certainly affected by rain will be undetected(Fig. 7).
The difference of resolution between TMR and the altimetercan also explain the difference observed in the number ofsamples flagged by the two rain flags where measurementsconditions are nominal. Small heavy rain cells might not bedetected by TMR but they can strongly affect the shape of thepulse thus causing the data quality flags to be set.
VI. RAIN ATTENUATION AND RAIN RATE
The dual-frequency capability of the TOPEX altimeter canalso be used to investigate the attenuation as a function ofliquid water and to estimate the rainfall rate.
A. Attenuation
Samples were selected from cycles 3 and 8 for whichthe TMR liquid water content was above 100m waspositive (i.e., Ku attenuated versus C), and measurement con-ditions were nominal were selected. As can be enhancedduring rain events, samples where the variation over 5samples was greater than 0.3 dB were discarded. This removessamples where enhancement is too large. Fig. 15 presents thescatter plot of the absolute two-way path attenuation in theKu band versus coincident TMR liquid water content. Thelarge dispersion observed for greater than 500 m might
1132 IEEE TRANSACTIONS ON GEOSCIENCE AND REMOTE SENSING, VOL. 35, NO. 5, SEPTEMBER 1997
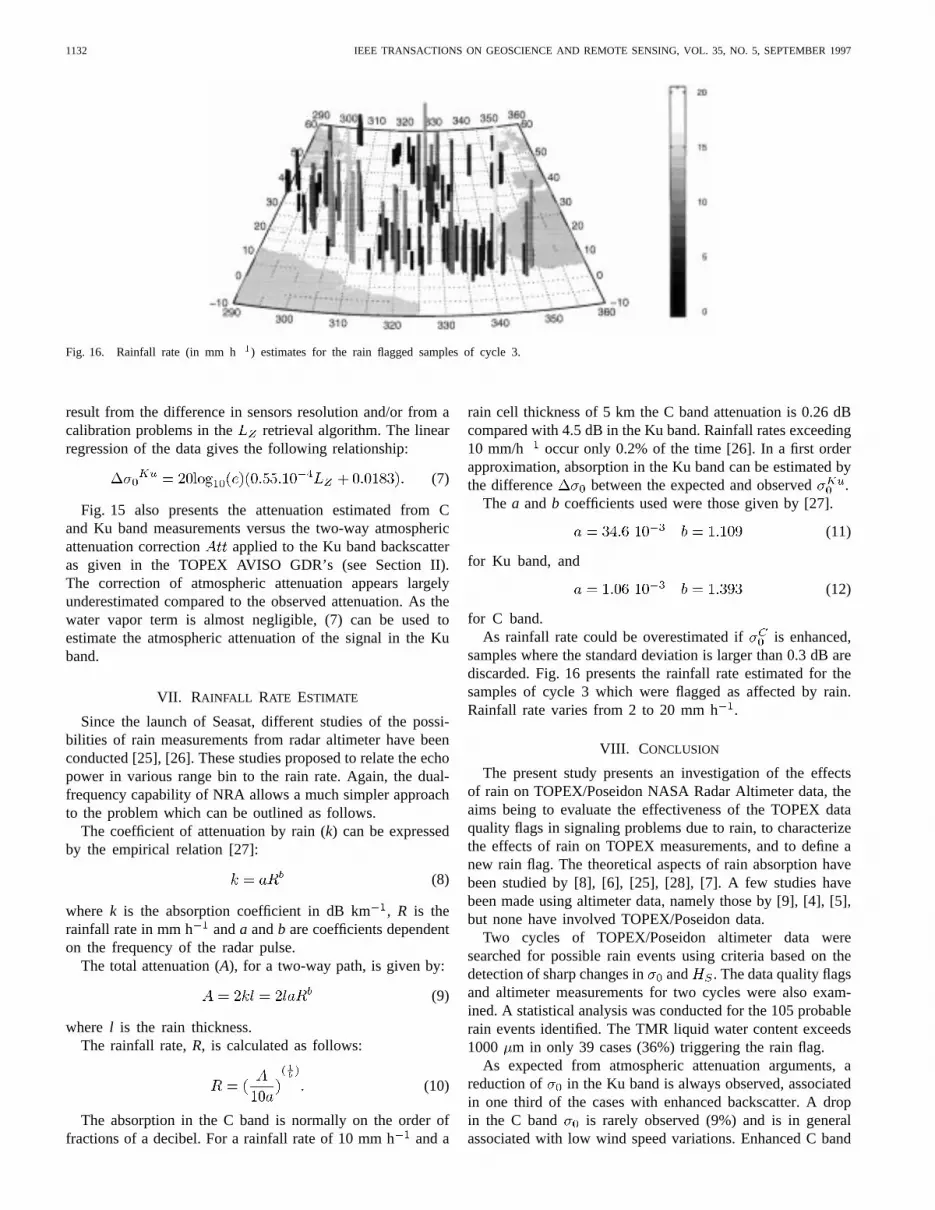
Fig. 16. Rainfall rate (in mm h�1) estimates for the rain flagged samples of cycle 3.
result from the difference in sensors resolution and/or from acalibration problems in the retrieval algorithm. The linearregression of the data gives the following relationship:
(7)
Fig. 15 also presents the attenuation estimated from Cand Ku band measurements versus the two-way atmosphericattenuation correction applied to the Ku band backscatteras given in the TOPEX AVISO GDR’s (see Section II).The correction of atmospheric attenuation appears largelyunderestimated compared to the observed attenuation. As thewater vapor term is almost negligible, (7) can be used toestimate the atmospheric attenuation of the signal in the Kuband.
VII. RAINFALL RATE ESTIMATE
Since the launch of Seasat, different studies of the possi-bilities of rain measurements from radar altimeter have beenconducted [25], [26]. These studies proposed to relate the echopower in various range bin to the rain rate. Again, the dual-frequency capability of NRA allows a much simpler approachto the problem which can be outlined as follows.
The coefficient of attenuation by rain (k) can be expressedby the empirical relation [27]:
(8)
where k is the absorption coefficient in dB km, R is therainfall rate in mm h anda andb are coefficients dependenton the frequency of the radar pulse.
The total attenuation (A), for a two-way path, is given by:
(9)
where l is the rain thickness.The rainfall rate,R, is calculated as follows:
(10)
The absorption in the C band is normally on the order offractions of a decibel. For a rainfall rate of 10 mm hand a
rain cell thickness of 5 km the C band attenuation is 0.26 dBcompared with 4.5 dB in the Ku band. Rainfall rates exceeding10 mm/h occur only 0.2% of the time [26]. In a first orderapproximation, absorption in the Ku band can be estimated bythe difference between the expected and observed .
The a andb coefficients used were those given by [27].
(11)
for Ku band, and
(12)
for C band.As rainfall rate could be overestimated if is enhanced,
samples where the standard deviation is larger than 0.3 dB arediscarded. Fig. 16 presents the rainfall rate estimated for thesamples of cycle 3 which were flagged as affected by rain.Rainfall rate varies from 2 to 20 mm h.
VIII. C ONCLUSION
The present study presents an investigation of the effectsof rain on TOPEX/Poseidon NASA Radar Altimeter data, theaims being to evaluate the effectiveness of the TOPEX dataquality flags in signaling problems due to rain, to characterizethe effects of rain on TOPEX measurements, and to define anew rain flag. The theoretical aspects of rain absorption havebeen studied by [8], [6], [25], [28], [7]. A few studies havebeen made using altimeter data, namely those by [9], [4], [5],but none have involved TOPEX/Poseidon data.
Two cycles of TOPEX/Poseidon altimeter data weresearched for possible rain events using criteria based on thedetection of sharp changes in and . The data quality flagsand altimeter measurements for two cycles were also exam-ined. A statistical analysis was conducted for the 105 probablerain events identified. The TMR liquid water content exceeds1000 m in only 39 cases (36%) triggering the rain flag.
As expected from atmospheric attenuation arguments, areduction of in the Ku band is always observed, associatedin one third of the cases with enhanced backscatter. A dropin the C band is rarely observed (9%) and is in generalassociated with low wind speed variations. Enhanced C band
TOURNADRE AND MORLAND: EFFECTS OF RAIN ON TOPEX/POSEIDON ALTIMETER DATA 1133
backscatter occurs in about 34% of the rain events. A possiblecause of the enhanced backscatter could lie in wave-dampingeffects due to rain.
For heavy rains, theory predicts that the echo waveforms canbe distorted, leading to erroneous and ssh measurements.When the distortion is important, data quality flags are set andthe data can easily be removed. However, in nearly 20% of thestudied rain events, some changes in ssh are observed undernominal measurement conditions. It is thus possible that a raincell can produce shifts of some centimeters in ssh, such as inFig. 8 at 24.8N, leading to artificially higher variability. Peaksin measurements observed in half of the cases can alsolead to an overestimation of electromagnetic bias correctionand can therefore affect the ssh measurements.
Since the criteria for detecting sharp changes of backscatterflagged too many samples as well as being difficult to imple-ment operationally, and since the rain flag based on coincidentbrightness temperature measurements does not detect all rainevents, a new rain flag based on the dual-frequency capabilitiesof TOPEX NRA is proposed. According to the theory andprevious studies of microwave signal, attenuation by rain isan order of magnitude larger in the Ku band than that in the Cband. The analysis of the identified rain events confirms thisresult. The new rain flag searches for occurrences where themeasured is attenuated compared to the value expectedfrom the measured by more than 1.9 rms. The expectedvalue and rms are calculated from the observed C/Kupairsto avoid any calibration problem. To ensure the presence ofcloud, samples where the TMR liquid water is under 200mare discarded. This new rain flag signals all the identified rainevents. It also flags new events where the variation due toattenuation was not high enough to be detected by the gradientcriterion. Some of these events were also detected by the TMR.
The signal is significantly attenuated in about half of the rainevents signaled by the TMR and this proportion falls to only35% after a sample by sample analysis. A large proportion ofthe samples flagged by the TMR could be used for analysis.The discrepancy between the two flags almost certainly resultsfrom the large difference of resolution of the two sensors, fewtens of kilometer for TMR, and few kilometers for NRA.
The new rain flag appears very promising for operational useas it relies on simple criteria and only flags affected samples.
The differential attenuation of the Ku and C band signalsby rain can be used to estimate the attenuation as a functionof liquid water content in view to improve the correction ofsingle frequency Ku band altimeter measurements, such as theERS-1 and ERS-2 ones [30]. The analysis of the data from twoTOPEX cycles shows that the correction used for the ERS-1altimeter might be underestimated by a factor of two. Thedifference between the expected and measured can beconsidered as an estimate of the attenuation by atmosphericliquid water and can be used to estimate the rainfall rate.
APPENDIX ADATA QUALITY FLAG
The data quality flag, named Alt-Bad_1 in the AVISOmerged products [1], indicates whether problems were detected
in the altimeter measurements conditions. It concerns thequality of the measuring conditions of the data productsobtained from averaging the ten per second echo waveforms.
Bit 0 Indicator is on if the compression used is median.Normally the mean of the ten measurements istaken, but if the data are anomalous, the medianvalue is used.
Bit 1 Indicator is on if the fit of the waveform leaves toomany invalid points.
Bit 2 Indicator is on if too many ten per second wave-forms cannot be fitted by a theoretical waveform.
Bit 3 Indicator is on for the TFLAG.Bit 4 Indicator is on if the slope fitted to the ten measure-
ments is too steep.Bit 5 Indicator is on if the r.m.s. of the one per second
altimeter range quality exceeds 15 cm.Bit 6 Indicator is on if too many errors are reported in
the dual-frequency ionospheric correction.
APPENDIX BTMR LIQUID WATER CONTENT AND RAIN FLAG
A complete description of the TMR instrument and bright-ness temperature algorithm is given in [2], [17], [18]. Ex-pressed in terms of kilometers on the ground seen at nadir fromthe TOPEX orbit, the half-power beam width is 43.4 km at 18GHz, 36.4 km at 21 GHz and 22.9 km at 37 GHz, whereas theeffective altimeter footprint diameter is on the order of 3 km[29]. Since the three channels may not integrate the same atmo-spheric patterns, ground processing partly solves the problemby averaging along track brightness temperatures [24]. Therain flag, given in the merged TOPEX/Poseidon products, isbased on an algorithm for detecting excess liquid water in theatmosphere [1]. The atmospheric liquid water content,, iscalculated from the TMR brightness temperatures at 18, 21,and 37 GHz [18], and [31], using the following relationship:
(13)
(14)
If m then
(15)
Otherwise, when mThe rain flag is signaled whenever exceeds 1000 m.
This threshold was chosen on the basis of observations madeby ground-based water vapor radiometers. Rain was almostalways present when the liquid water measurement exceeded1500 m. If Lz, averaged over a 40 km footprint, exceeds1000 m, rain is almost certainly present over a significantfraction of the footprint.
The rain flag is also triggered if the brightness temperatureare of the following limits:
(16)
1134 IEEE TRANSACTIONS ON GEOSCIENCE AND REMOTE SENSING, VOL. 35, NO. 5, SEPTEMBER 1997
APPENDIX CSSM/I LIQUID WATER CONTENT
To derive the integrated cloud liquid water (or, equivalently,the liquid water path), [32] showed that in the absence ofanisotropic extinction by precipitation particles, the normalizedpolarization difference () at any SSM/I frequency is wellapproximated by the effective transmittance associated withcloud liquid water, raised to a power. That is,
(17)
where is the effective mass extinction coefficient of theliquid water in the cloud, is the liquid water path, is theSSM/I viewing angle (53.1). Using a model and assumingconditions typical for marine stratocumulus to determine,[32] inverted the above expression to obtain the liquid waterpath ( ) from the 85.5 GHz channels (in kg. m):
(18)
The normalized polarization difference, is given by
(19)
where are the brightness temperature at 85.5 GHz in verticaland horizontal polarization, the wind speed estimated fromthe brightness temperature and the integrated watervapor.
ACKNOWLEDGMENT
The authors wish to thank B. Chapron and A. Cavanieof IFREMER for fruitful discussions and comments, to M.Srokosz of the James Rennell Center who initiated the study,and to D. Vandemark and G. Hayne of the NASA GoddardSpace Flight Center for their assistance with the TOPEX data.The authors acknowledge the AVISO group for providing themwith a copy of the TOPEX/Poseidon CD-ROM’s.
[2] C. Ruf, S. J. Keihm, and M. A. Janssen, “TOPEX/Poseidon MicrowaveRadiometer (TMR): I Instrument description and antenna temperaturecalibration,”IEEE Trans. Geosci. Remote Sensing, vol. 33, pp. 125–137,Jan. 1995.
[3] T. H. Guymer, G. D. Quartly, and M. A. Srokosz, “The effect ofrain on ERS-1 altimeter data,”J. Atmos. Ocean. Technol., vol. 12, pp.1229–1247, 1995.
[4] T. H. Guymer and G. D. Quartly, “The effect of rain on ERS-1altimeter data,”Proc. First ERS-1 Symp.—Space at the Service of ourEnvironment, Cannes, France, 4–6 Nov. 1992, ESA SP-359, 1993.
[5] G. D. Quartly, T. H. Guymer, and S. W. Laxon, “Detection of raincells in altimeter returns,”Proc. Second ERS-1 Symp. —Space at theService of our Environment, Hamburg, Germany, 11–14 Oct.1993, ESASP-361, pp. 799–804, 1994.
[6] J. Goldhirsh and J. R. Rowland, “A tutorial assessment of atmosphericheight uncertainties for high-precision satellite altimeter missions tomonitor ocean currents,”IEEE Trans. Geosci. Remote Sensing, vol.GE-20, pp. 418–434, 1982.
[7] E. J. Walsh, F. M. Monaldo, and J. Goldhirsh, “Rain and cloud effects ona satellite dual-frequency radar altimeter operating at 13.5 GHz and 35GHz,” IEEE Trans. Geosci. Remote Sensing, vol. GE-22, pp. 615–622,1984.
[8] D. E. Barrick and B. J. Lipa, “Analysis and interpretation of altimetersea echo,”Adv. Geophys., vol. 27, pp. 61–100, 1985.
[9] M. A. Srokosz and T. H. Guymer, “A study of the effect of rain on Seasatradar altimeter data,”Proc. IGARSS ‘88 Symp., Edinburgh, Scotland,13–16 Sept. 1988, ESA SP-284, pp. 651–654, 1988.
[10] M. Tsimplis and S. A. Thorpe, “Wave damping by rain,”Nature, vol.342, pp 893–895, 1989.
[11] D. Atlas, “Footprints of storms on the sea: A view from spacebornesynthetic aperture radar,”J. Geophys. Res., 99, C4, pp. 7961–7969,1994.
[12] A. R. Zieger, D. W. Hancock, G. S. Hayne, and C. L. Purdy, “NASAradar altimeter for the TOPEX/Poseidon project,”Proc. IEEE, vol. 79,pp. 810–826, June 1991.
[13] P. C. Marth, J. R., Jensen, C. C. Kilgus, J. A. Perschy, J. L. MacArthur,D. W. Hancock, G. S. Hayne, C. L. Purdy, L. C. Rossi, and C. J.Koblinsky, “Prelaunch performance of the NASA altimeter for theTOPEX/Poseidon project,”IEEE Trans. Geosci. Remote Sensing, vol.31, pp. 315–332, 1993.
[14] D. B. Chelton and P. J. MacCabe, “A review of satellite altimeter mea-surements of sea surface wind speed with a proposed new algorithm,”J. Geophys. Res., vol. 90, pp. 4707–4720, 1985.
[15] D. L. Witter, and D. B. Chelton, “A Geosat altimeter wind speed algo-rithm and a method for altimeter wind speed algorithm development,”J. Geophys. Res., vol. 96, pp. 9853–9860, 1991.
[16] G. S. Hayne, D. W. Hancock and C. L. Purdy, “The corrections forsignificant wave height and attitude effects in the TOPEX/Poseidon radaraltimeter,” J. Geophys. Res., vol. 90, pp. 24.941–24.955, 1994.
[17] M. A. Janssen, C. Ruf, and S. J. Keihm, “TOPEX/Poseidon MicrowaveRadiometer (TMR): II Antenna pattern corrections and brightness tem-perature algorithm,”IEEE Trans. Geosci. Remote Sensing, vol. 33, pp.138–146, 1995.
[18] S. J. Keihm, M. A. Janssen, and C. Ruf, “TOPEX/Poseidon MicrowaveRadiometer (TMR): III Wet troposphere range correction algorithm andprelaunch error budget,”IEEE Trans. Geosci. Remote Sensing, vol. 33,pp. 147–161, 1995.
[19] T. M. Elfouhaily, B. Chapron, and K. Katsaros, “Microwave scatteringdistributions from a rain-roughened water surface: Measurements andModeling,” Proc. IGARSS’94, vol. II, pp 9., Pasadena, CA, July 1994.
[20] L. Bliven, P. Sobieski, and T. Elfouhaily, “Ring wave frequency spectra:Measurements and model,”Proc. IGARSS’95, vol. I, pp 829, Florence,Italy, July 1995.
[21] P. Sobieski, L. Bliven, H. Branger, and J. P. Giovanangeli, “Experi-mental comparison of scatterometric signatures from a water surfaceagitated by wind and artificial rain,”Proc. IGARSS ‘93 Symp., Tokyo,Japan, 18–21 Aug. 1993.
[22] B. Chapron, K. Katsaros, T. Elfouhaily, and D. Vandemark, “A note onrelationships between sea surface roughness and altimeter backscatter,”Selected papers from Third Int. Symp. Air-Water Gas Transfer, Heidel-berg University, B. Jahne and E. C. Monahan, Eds., AEON Verlag andStudio, pp. 869–878, July 24–27, 1995.
[23] L. S. Fedor and G. S. Brown, “Waveheight and wind speed measure-ments from the SEASAT radar altimeter,”J. Geophys. Res., vol. 87, C5,pp. 3254–3260, 1982.
[25] J. Goldhirsh and E. J. Walsh, “Rain Measurements from space using amodified Seasat-type radar altimeter,”IEEE Trans. Antennas Propagat.,vol. AP-30, 4, pp. 726–733, 1982.
[26] J. Goldhirsh, “Rain cell size statistics as a function of rain rate forattenuation modeling,”IEEE Trans. Antennas Propagat., vol. AP-31,pp. 799–801, 1983.
[27] R. L. Olsen, D. V. Rogres, and D. B. Hodge, “The aRb Relation in thecalculation of rain attenuation,”IEEE Trans. Antennas Propagat., vol.AP-26, pp. 318–329, 1978.
[28] F. M. Monaldo, J. Goldhirsh, and E. J. Walsh, “Altimeter heightmeasurement error introduced by the presence of variable cloud andrain attenuation,”J. Geophys. Res.,” vol. 91, pp. 2345–2350, 1986.
[29] TOPEX. TOPEX Radar Altimeters Systems Specification, NASA Wal-lops Doc. WFF-672-85-004004, Rev. 6, 1989.
TOURNADRE AND MORLAND: EFFECTS OF RAIN ON TOPEX/POSEIDON ALTIMETER DATA 1135
[30] ERS-1 Altimeter products,User Manual, C1-EX-MUT-A21-01-CN,Rev. 6, IFREMER, BP 70, 29280 Plouzane, France, 1994.
[31] S. J. Keihm, personal communication 1995.[32] G. W. Petty, “On the response of the SSM/I to the marine environment:
Jean Tournadre was born in Clermont-Ferrand,France, in 1959. He received a diplˆome d’ingenieurdegree from the Ecole Centrale de Lyon, Lyon,France, and the Doctorate in Meteorology degreefrom the University Blaise Pascal, Clermont-Ferrand, France, in 1981 and 1984, respectively.
From 1984 to 1987, he was Post-doctoral re-searcher at the Scripps Institution of Oceanography,University of California, San Diego, and VisitingScientist at the National Center for AtmosphericResearch, Boulder, CO. In 1987, he joined the
Institut Francais de Recherche pour l’Exploitation de la Mer, Plouzane,France, where he works in the D´epartement d’Oc´eanographie Spatiale as aresearcher. His research interests are ocean surface winds and waves andprecipitations using remote sensing data, with a special emphasis on altimeterand scatterometer data.
Dr. Tournadre is a member of the American Geophysical Union.
June C. Morland was born in 1971 in Glasgow,Scotland. She received the B.Sc. degree in physicsand astronomy and astrophysics from the Universityof St. Andrews, St. Andrews, Scotland, in 1993, andattended the International Space University SummerSession. She received the M.Sc. degree in remotesensing from University College London, London,U.K., in 1994. This involved work at IFREMER(Institut Francais pour la Recherche et Exploitationde la MER) where she investigated a new rain flagfor the TOPEX-Poseidon satellite. She is currently a
post-graduate student in the TAMSAT (Tropical Meteorology using SATellitedata) group at the University of Reading, Reading, U.K. Her research interestis the influence of the land surface on microwave rainfall estimates.