Full Terms & Conditions of access and use can be found at https://www.tandfonline.com/action/journalInformation?journalCode=wjaa20 Journal of Applied Aquaculture ISSN: 1045-4438 (Print) 1545-0805 (Online) Journal homepage: https://www.tandfonline.com/loi/wjaa20 Substitution of fish meal with sunflower seed meal in diets for Nile tilapia (Oreochromis niloticus L.) reared in earthen ponds Erick Ochieng Ogello, Elijah M. Kembenya, Cecilia M. Githukia, Callen N. Aera, Jonathan M. Munguti & Chrispine S. Nyamweya To cite this article: Erick Ochieng Ogello, Elijah M. Kembenya, Cecilia M. Githukia, Callen N. Aera, Jonathan M. Munguti & Chrispine S. Nyamweya (2017) Substitution of fish meal with sunflower seed meal in diets for Nile tilapia (Oreochromis niloticus L.) reared in earthen ponds, Journal of Applied Aquaculture, 29:1, 81-99, DOI: 10.1080/10454438.2016.1275074 To link to this article: https://doi.org/10.1080/10454438.2016.1275074 Published online: 10 Jan 2017. Submit your article to this journal Article views: 252 View related articles View Crossmark data Citing articles: 4 View citing articles
Transcript
Full Terms & Conditions of access and use can be found athttps://www.tandfonline.com/action/journalInformation?journalCode=wjaa20
Substitution of fish meal with sunflower seed mealin diets for Nile tilapia (Oreochromis niloticus L.)reared in earthen ponds
Erick Ochieng Ogello, Elijah M. Kembenya, Cecilia M. Githukia, Callen N.Aera, Jonathan M. Munguti & Chrispine S. Nyamweya
To cite this article: Erick Ochieng Ogello, Elijah M. Kembenya, Cecilia M. Githukia, Callen N. Aera,Jonathan M. Munguti & Chrispine S. Nyamweya (2017) Substitution of fish meal with sunflowerseed meal in diets for Nile tilapia (Oreochromis�niloticus L.) reared in earthen ponds, Journal ofApplied Aquaculture, 29:1, 81-99, DOI: 10.1080/10454438.2016.1275074
To link to this article: https://doi.org/10.1080/10454438.2016.1275074
Substitution of fish meal with sunflower seed meal in dietsfor Nile tilapia (Oreochromis niloticus L.) reared in earthenpondsErick Ochieng Ogelloa, Elijah M. Kembenyaa, Cecilia M. Githukiaa, Callen N. Aeraa,Jonathan M. Mungutib, and Chrispine S. Nyamweyac
aKenya Marine & Fisheries Research Institute (KMFRI), Kegati Aquaculture Research Station, Kisii, Kenya;bKenya Marine & Fisheries Research Institute (KMFRI), National Aquaculture Research Development &Training Centre (NARDTC), Sagana, Kenya; cKenya Marine & Fisheries Research Institute (KMFRI),Kisumu, Kenya
ABSTRACTThis study investigated sunflower seed meal (SSM) as dietaryprotein replacement of fish meal (FM) for Nile tilapia(Oreochromis niloticus) juveniles (initial mean weight of19.8 ± 6.3 g) reared in earthen ponds for 210 days. SSMreplaced 25%, 50%, 75%, and 100% (i.e., D25, D50, D75, andD100, respectively) of FM in an isonitrogenous and isocaloricdiet. The optimum FM replacement level of D25 as predicted bythe equation y = 177.5 + 26.5x – 7.9x2 yielded an optimumweight of about 184 g within 100 days. Thus D25 was the mosteffective SSM level for Nile tilapia growth in earthen ponds.Fish growth declined as SSM exceeded D25. The length-weightrelationship (r ≥ 90%) depicted an isometric fish growth.Nutrient utilization parameters were similar in all the dietsexcept for D100. The protein content of fish carcass was highestin the control and D25, while fiber level was highest in D100.Amino acids imbalance and high fiber content could havereduced the fish growth at D50, D75, and D100.
In the last decade, the global demand for food fish has increased from about90 to 110 million metric tons with the share of aquaculture productionincreasing from 29% to 38% of global fish production (Fisheries andAgriculture Organization [FAO] 2013). The demand for the processed fishproducts has created gradual stagnation and decline of capture fisheriesresources (FAO 2013). This stagnation has placed the heavy responsibilityof food fish production on the aquaculture sector, which requires a fivefoldproduction increase to sustain the demand (Avnimelech 2009). However, thisgrowth is threatened by challenges of inadequate and expensive fish feeds.
CONTACT Erick Ochieng Ogello [email protected]; [email protected] Kenya Marine &Fisheries Research Institute (KMFRI), Kegati Aquaculture Research Station, P.O. Box 3259, 4200 Kisii, Kenya.Color versions of one or more of the figures in the article can be found online at www.tandfonline.com/wjaa.
JOURNAL OF APPLIED AQUACULTURE2017, VOL. 29, NO. 1, 81–99http://dx.doi.org/10.1080/10454438.2016.1275074
Fish feeds account for the highest operational costs in aquaculture, withfish meal (FM) being the most expensive protein source (Munguti et al. 2012;Tacon 1993). Protein is the most expensive ingredient and limiting factor forfish culture (Mugo-Bundi et al. 2013; Tacon and Metian 2008). For decades,the production of fish feeds has been traditionally based on FM as the chiefprotein source, thanks to its high protein content, balanced essential aminoacids (EAA), vitamins, minerals, attractants, and other unknown growthfactors (Abdelghany 2003; El-Saidy and Gaber 2003; Tacon 1993).However, the declining capture fisheries and the increasing competition forfish products question the sustainability of reliance on FM as chief source ofproteins in fish feed production (Naylor et al. 2000). As a strategy to conservefisheries resources, achieve aquaculture sustainability, and lower the cost ofaquaculture production, identification and use of FM alternatives remains ahigh priority in aquaculture nutrition research (Dayal et al. 2011; El-Sayed1999; Gatlin et al. 2007; Lazard et al. 2014; Ogello et al. 2014; Rehman et al.2013; Tacon and Jackson 1985).
Plant protein sources have been evaluated as partial or complete FMreplacers (El-Sayed 1999; Gomes et al. 1995; Liti et al. 2006; Olivera-Castillo et al. 2011; Richie and William 2011) despite their mismatchingamino acid profiles for most farmed fishes (El-Saidy and Gaber 2003; El-Sayed 1998, 1999; Tacon and Metian 2008). Jackson et al. (1982) found thatup to 25% of sunflower meal (Helianthus annuus) could replace FM proteinwithout significant effect on the growth of Mozambique tilapia (Oreochromismossambicus) under laboratory conditions. In another study with redbreasttilapia (Tilapia rendali), diets containing 10% and 20% sunflower proteinprovided similar growth and feeding efficiency results to those fed on FM asthe sole protein source (Olvera-Novoa et al. 2002). Bilguven and Baris (2011)reported similar growth performance between rainbow trout (Oncorhyncusmykiss) fed with either 65% sunflower meal or standard FM diets. However,Tahir et al. (2008) reported poor growth performance of Indian carp (Catlacatla) and rohu (Labeo rohita) fed diets containing 20%, 40%, and 60%sunflower seed meal.
Even though sunflower seed meal has great potential as an alternativeprotein source for fish feed production (El-Sayed 1999), its suitability as apartial or complete FM replacer for Nile tilapia (Oreochromis niloticus) hasnot been completely explored. Nile tilapia farming has assumed greaterimportance in most developing countries thanks to its ability to feed on awide range of foods, faster growth rate, and tolerance to wide environmentalstressors (El-Sayed 2002). Nile tilapia has an expanded penetration of avariety of products in markets, without any reports of social restrictions ontheir consumption (Fitzsimmons 2000). So far, there is a lack of commonconsensus in the degree of success for various sunflower seed meal inclusionlevels depending on the ingredient of the test feeds, culture system, as well as
82 E. O. OGELLO ET AL.
species of fish cultured. Most studies are conducted in laboratory-basedsystems (Jackson et al. 1982; Olvera-Novoa et al. 2002; Mugo-Bundi et al.2013; Rehman et al. 2013), whose findings may not exactly translate to actualearthen pond systems. Despite the availability of sunflower seed meal(Munguti et al. 2012), the magnitude of their contribution as FM replacershas not been adequately tested in earthen pond systems, which are popularfish farming systems in developing countries. The aim of the present studywas to determine the effects of various inclusion levels of sunflower seedmeal as a protein source on the growth performance and meat quality of Niletilapia juveniles cultured in earthen ponds.
Materials and methods
Study area
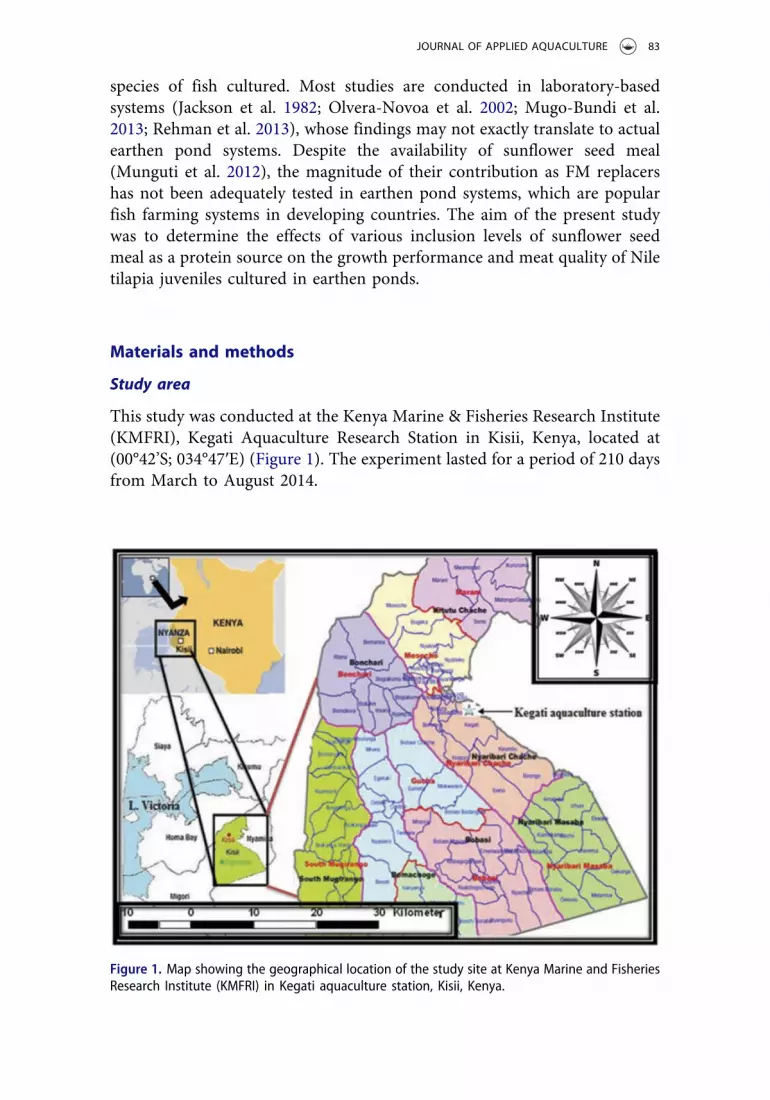
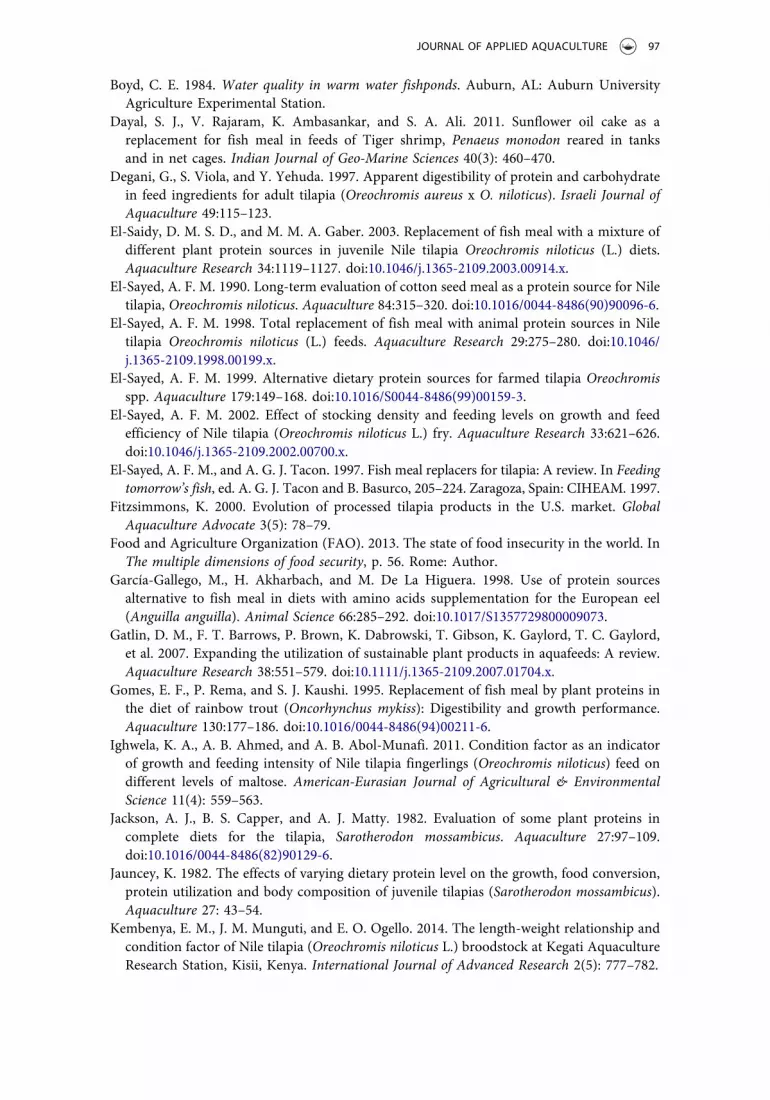
This study was conducted at the Kenya Marine & Fisheries Research Institute(KMFRI), Kegati Aquaculture Research Station in Kisii, Kenya, located at(00°42’S; 034°47ʹE) (Figure 1). The experiment lasted for a period of 210 daysfrom March to August 2014.
Figure 1. Map showing the geographical location of the study site at Kenya Marine and FisheriesResearch Institute (KMFRI) in Kegati aquaculture station, Kisii, Kenya.
JOURNAL OF APPLIED AQUACULTURE 83
Experimental fish and dietsThe experimental fish were obtained under controlled hatchery conditions inthe station. Fifteen mature female broodstock of Nile tilapia (meanweight = 175.3 ± 6.1 g) and 10 mature males (mean weight = 255.7 ± 5.9 g)were selected according to Viveen et al.’s (1985) protocol from our brood-stock ponds and transferred to the hatchery. Fish larvae were obtainedthrough induced breeding and seminatural spawning. Upon absorption ofegg yolk, the fish larvae were fed with Artemia nauplii (instar I & II) at adlibitum amount for 2 weeks before introducing them to a commercial tilapiafeed (Raanan Fish Feed Co., Israel: crude protein 270 g kg−1; crude lipid 56 gkg−1; crude fiber 61 g kg−1; ash 62 g kg−1; NFE, 551 g kg−1). About 4,000 Niletilapia fry were cultured for a period of 1 month to an initial mean weight of19.8 ± 6.3 g in 10 glass aquaria of 60-L each (500 fry in each aquarium).During the culture period, the solid wastes were physically siphoned out andhalf of the water replaced daily to maintain good water quality. The waterwas continuously aerated and temperature maintained thermostatically at27.0 ± 0.5°C.
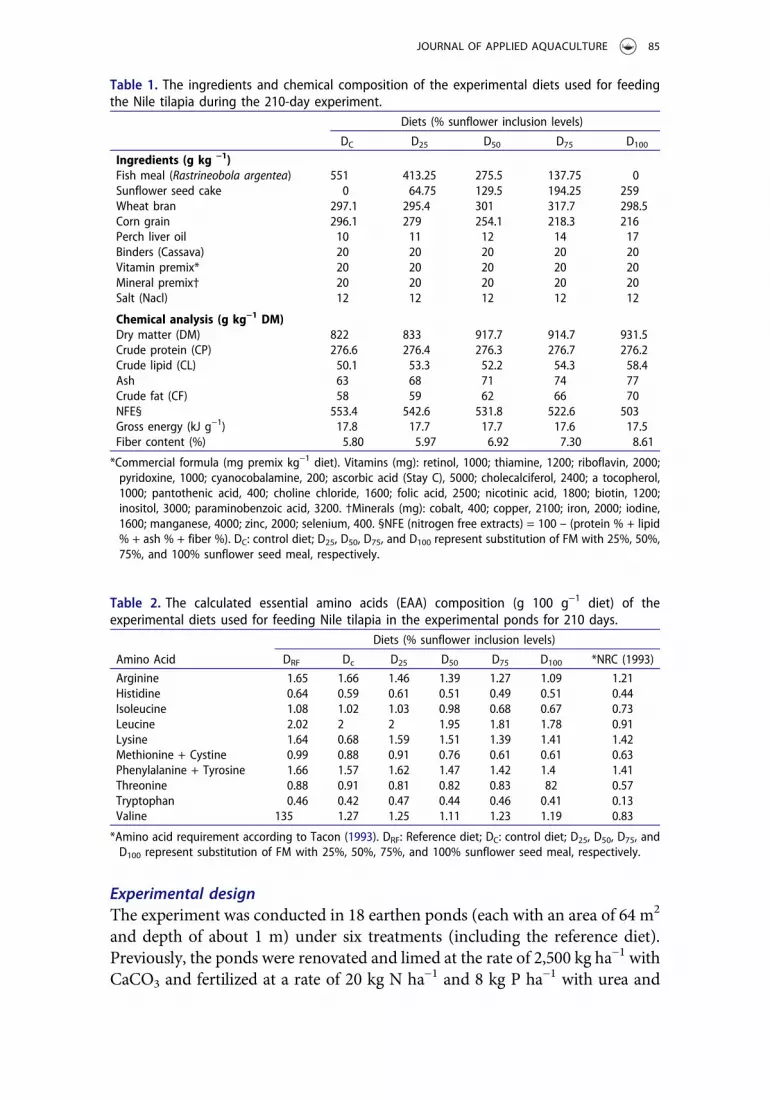
Five isonitrogenous and isocaloric diets (crude protein 27%, Gross energy17.7 kJ g−1) were formulated. The sunflower seed meal (SSM) was used as theprotein ingredient to replace FM (obtained from silver cyprinid[Rastrineobola argentea]) at 25%, 50%, 75%, and 100%, referred to as D25,D50, D75, and D100, respectively. The control diet (DC) was formulated withFM as the main protein source. Moisture, crude protein, lipid, crude fiber,and ash content were analyzed on the individual dietary ingredients and finaldiets at the beginning of the experiment using standard methods(Association of Official Analytical Chemists [AOAC] 1984). The ingredientproportions and proximate compositions of the experimental diets are shownin Table 1. A reference tilapia diet (DRF) purchased from Raanan Industries(Oshrat, Israel) as described previously was used to compare the fish perfor-mance with that of the experimental diets.
To prepare the experimental diets, the sunflower meal was not dehulled.The ingredients for the experimental diet were mixed and ground to uniformsize before cooking at high temperature (80°C) and pressure for 10 min tokill any pathogenic microbe and to improve the digestibility. This conditionwas achieved by boiling the ingredients in a tightly covered pot whilechecking the temperature and time. The ingredients were pressed in aHobart grinder (M-600; Hobart Corp., Troy, OH, USA) to form pellets (1-mm diameter). The pellets were top coated with perch oil, minerals, andvitamin premixes to improve the nutritional quality and then dried to 12%moisture content in a forced-air drier at room temperature for 24 h. Thefeeds were stored in plastic bags at 4°C for further use. The amino acidsprofiles of the formulated diets were calculated according to the NationalResearch Council (NRG 1993) and presented in Table 2.
84 E. O. OGELLO ET AL.
Experimental designThe experiment was conducted in 18 earthen ponds (each with an area of 64 m2
and depth of about 1 m) under six treatments (including the reference diet).Previously, the ponds were renovated and limed at the rate of 2,500 kg ha−1 withCaCO3 and fertilized at a rate of 20 kg N ha−1 and 8 kg P ha−1 with urea and
Table 1. The ingredients and chemical composition of the experimental diets used for feedingthe Nile tilapia during the 210-day experiment.
Table 2. The calculated essential amino acids (EAA) composition (g 100 g−1 diet) of theexperimental diets used for feeding Nile tilapia in the experimental ponds for 210 days.
*Amino acid requirement according to Tacon (1993). DRF: Reference diet; DC: control diet; D25, D50, D75, andD100 represent substitution of FM with 25%, 50%, 75%, and 100% sunflower seed meal, respectively.
JOURNAL OF APPLIED AQUACULTURE 85
diammonium phosphate (DAP), respectively. Stocking was done 2 weeks afterfertilization with Nile tilapia of average weight 19.8 ± 6.3 g and length7.5 ± 1.1 cm at a density of 3 fish m−2. Each diet was randomly applied tothree ponds (triplicate). The fish were daily fed by hand at 4% of the biomass ofeach pond divided into two feeding times, at 0800 and 1700 h.
Water quality measurementsTemperature (°C), dissolved oxygen (mgL−1), pH, and electrical conductivity(µS cm−1) were measured in situ using a multiprobe water checker (U-10model, Horiba, Tokyo, Japan) by dipping the probe into the water surface(about 20–30 cm). Algal densities (cm) were determined by secchi disk. Atevery sampling time, water samples were collected from each pond and takento the lab for further analysis. Unionized ammonia was measured usingDREL/2 HACH kits (HACH Co., Loveland, CO, USA), while total alkalinityas CaCO3 (mgL−1) and phosphorus (mgL−1) were determined using standardmethods (American Public Health Association [APHA] 1985).
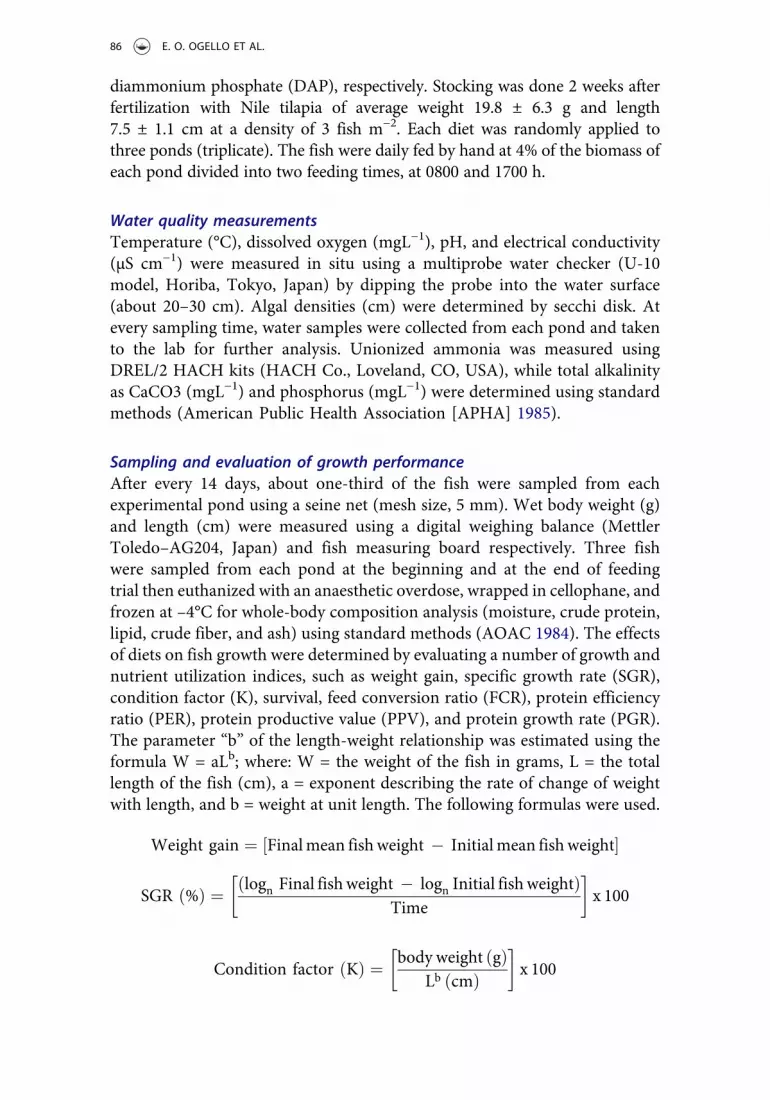
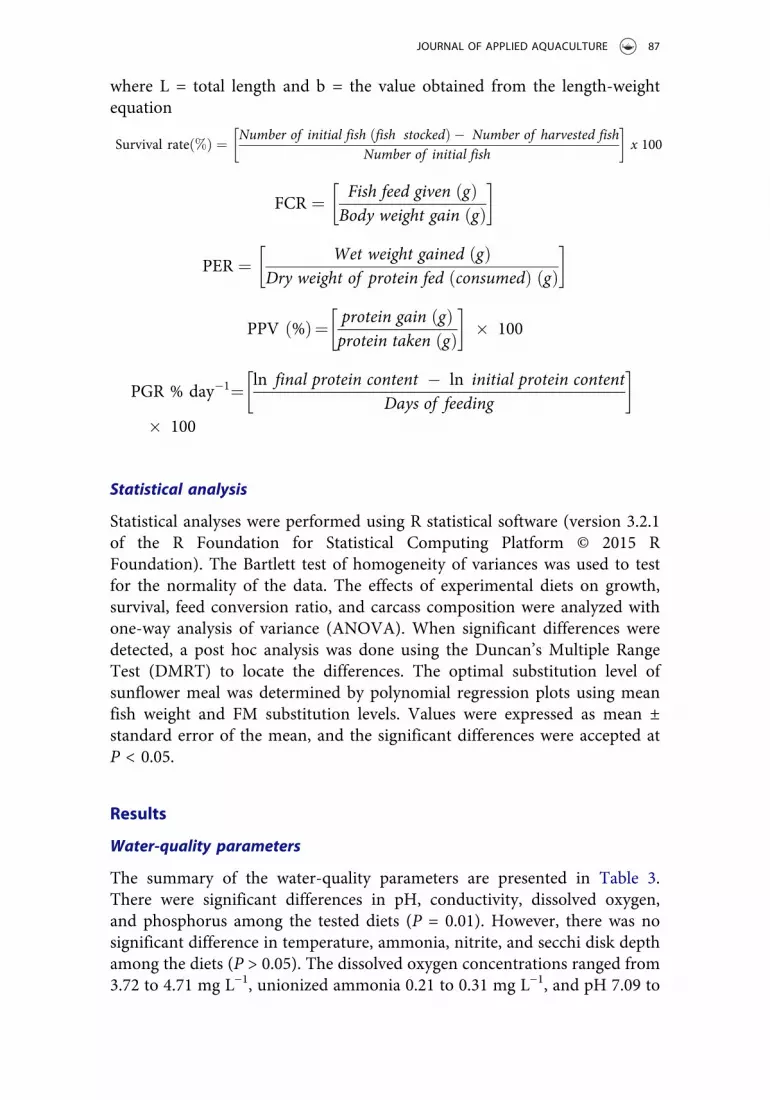
Sampling and evaluation of growth performanceAfter every 14 days, about one-third of the fish were sampled from eachexperimental pond using a seine net (mesh size, 5 mm). Wet body weight (g)and length (cm) were measured using a digital weighing balance (MettlerToledo–AG204, Japan) and fish measuring board respectively. Three fishwere sampled from each pond at the beginning and at the end of feedingtrial then euthanized with an anaesthetic overdose, wrapped in cellophane, andfrozen at –4°C for whole-body composition analysis (moisture, crude protein,lipid, crude fiber, and ash) using standard methods (AOAC 1984). The effectsof diets on fish growth were determined by evaluating a number of growth andnutrient utilization indices, such as weight gain, specific growth rate (SGR),condition factor (K), survival, feed conversion ratio (FCR), protein efficiencyratio (PER), protein productive value (PPV), and protein growth rate (PGR).The parameter “b” of the length-weight relationship was estimated using theformula W = aLb; where: W = the weight of the fish in grams, L = the totallength of the fish (cm), a = exponent describing the rate of change of weightwith length, and b = weight at unit length. The following formulas were used.
Weight gain ¼ Finalmean fishweight � Initialmean fishweight½ �
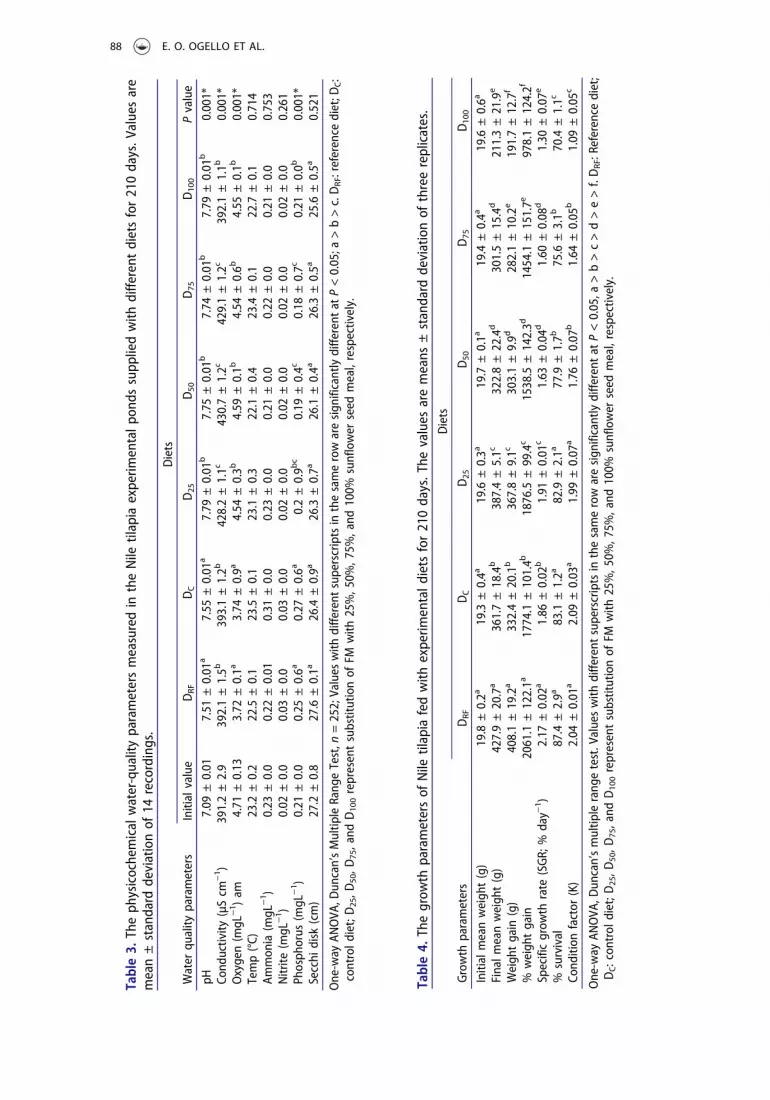
The summary of the water-quality parameters are presented in Table 3.There were significant differences in pH, conductivity, dissolved oxygen,and phosphorus among the tested diets (P = 0.01). However, there was nosignificant difference in temperature, ammonia, nitrite, and secchi disk depthamong the diets (P > 0.05). The dissolved oxygen concentrations ranged from3.72 to 4.71 mg L−1, unionized ammonia 0.21 to 0.31 mg L−1, and pH 7.09 to
JOURNAL OF APPLIED AQUACULTURE 87
Table3.
Theph
ysicochemicalwater-qualityparametersmeasuredin
theNile
tilapiaexperim
entalp
onds
supp
liedwith
diffe
rent
dietsfor210days.V
aluesare
mean±standard
deviationof
14recordings.
Diets
Water
quality
parameters
Initialvalue
DRF
DC
D25
D50
D75
D100
Pvalue
pH7.09
±0.01
7.51
±0.01
a7.55
±0.01
a7.79
±0.01
b7.75
±0.01
b7.74
±0.01
b7.79
±0.01
b0.001*
Cond
uctivity
(µScm
−1 )
391.2±2.9
392.1±1.5b
393.1±1.2b
428.2±1.1c
430.7±1.2c
429.1±1.2c
392.1±1.1b
0.001*
Oxygen(m
gL−1 )am
4.71
±0.13
3.72
±0.1a
3.74
±0.9a
4.54
±0.3b
4.59
±0.1b
4.54
±0.6b
4.55
±0.1b
0.001*
Temp(°C)
23.2
±0.2
22.5
±0.1
23.5
±0.1
23.1
±0.3
22.1
±0.4
23.4
±0.1
22.7
±0.1
0.714
Ammon
ia(m
gL−1 )
0.23
±0.0
0.22
±0.01
0.31
±0.0
0.23
±0.0
0.21
±0.0
0.22
±0.0
0.21
±0.0
0.753
Nitrite
(mgL
−1 )
0.02
±0.0
0.03
±0.0
0.03
±0.0
0.02
±0.0
0.02
±0.0
0.02
±0.0
0.02
±0.0
0.261
Phosph
orus
(mgL
−1 )
0.21
±0.0
0.25
±0.6a
0.27
±0.6a
0.2±0.9b
c0.19
±0.4c
0.18
±0.7c
0.21
±0.0b
0.001*
Secchi
disk
(cm)
27.2
±0.8
27.6
±0.1a
26.4
±0.9a
26.3
±0.7a
26.1
±0.4a
26.3
±0.5a
25.6
±0.5a
0.521
One-way
ANOVA
,Dun
can’sMultip
leRang
eTest,n
=252;Values
with
diffe
rent
superscriptsinthesamerowaresign
ificantlydiffe
rent
atP<0.05;a
>b>c.DRF:reference
diet;D
C:
controld
iet;D25,D
50,D
75,and
D100representsubstitutionof
FMwith
25%,5
0%,7
5%,and
100%
sunflower
seed
meal,respectively.
Table4.
Thegrow
thparametersof
Nile
tilapiafedwith
experim
entald
iets
for210days.The
values
aremeans
±standard
deviationof
threereplicates.
Diets
Growth
parameters
DRF
DC
D25
D50
D75
D100
Initialmeanweigh
t(g)
19.8
±0.2a
19.3
±0.4a
19.6
±0.3a
19.7
±0.1a
19.4
±0.4a
19.6
±0.6a
Finalm
eanweigh
t(g)
427.9±20.7a
361.7±18.4b
387.4±5.1c
322.8±22.4d
301.5±15.4d
211.3±21.9e
Weigh
tgain
(g)
408.1±19.2a
332.4±20.1b
367.8±9.1c
303.1±9.9d
282.1±10.2e
191.7±12.7f
%weigh
tgain
2061.1
±122.1a
1774.1
±101.4b
1876.5
±99.4c
1538.5
±142.3d
1454.1
±151.7e
978.1±124.2f
Specificgrow
thrate
(SGR;
%day−
1 )2.17
±0.02
a1.86
±0.02
b1.91
±0.01
c1.63
±0.04
d1.60
±0.08
d1.30
±0.07
e
%survival
87.4
±2.9a
83.1
±1.2a
82.9
±2.1a
77.9
±1.7b
75.6
±3.1b
70.4
±1.1c
Cond
ition
factor
(K)
2.04
±0.01
a2.09
±0.03
a1.99
±0.07
a1.76
±0.07
b1.64
±0.05
b1.09
±0.05
c
One-way
ANOVA
,Dun
can’smultip
lerang
etest.V
alueswith
diffe
rent
superscriptsin
thesamerowaresign
ificantlydiffe
rent
atP<0.05,a
>b>c>d>e>f.DRF:Reference
diet;
DC:con
trol
diet;D
25,D
50,D
75,and
D100representsubstitutionof
FMwith
25%,5
0%,7
5%,and
100%
sunflower
seed
meal,respectively.
88 E. O. OGELLO ET AL.
7.79. All the water-quality parameters were within the acceptable limits foroptimal growth of Nile tilapia in earthen pond systems (Boyd 1984).
The growth performance, survival, and condition factor
The summary of the growth performance parameters is shown in Table 4.Higher fish growth was obtained with diets DREF, Dc, and D25, but growthresponse declined as sunflower protein exceeded D25. In terms of final meanweight, weight gain, and SGR, the reference diet (DRF) was superior to all thetested diets, followed by the D25 and DC diets (Table 4). However, there wasno significant difference between the D25 and DC diets (P > 0.05). All thegrowth parameters were lower in the diet D100 compared to the rest.Similarly, the growth parameters of diets D50 and D75 were not significantlydifferent (P > 0.05) except weight gain, which was higher in the diet D50
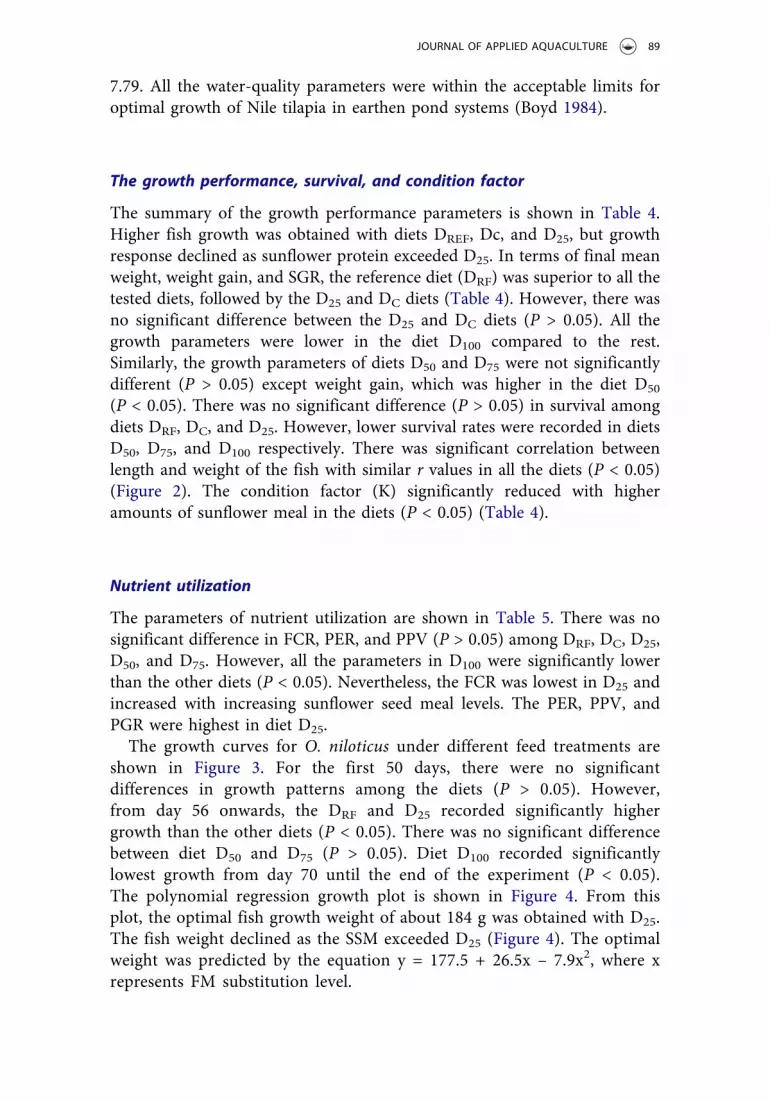
(P < 0.05). There was no significant difference (P > 0.05) in survival amongdiets DRF, DC, and D25. However, lower survival rates were recorded in dietsD50, D75, and D100 respectively. There was significant correlation betweenlength and weight of the fish with similar r values in all the diets (P < 0.05)(Figure 2). The condition factor (K) significantly reduced with higheramounts of sunflower meal in the diets (P < 0.05) (Table 4).
Nutrient utilization
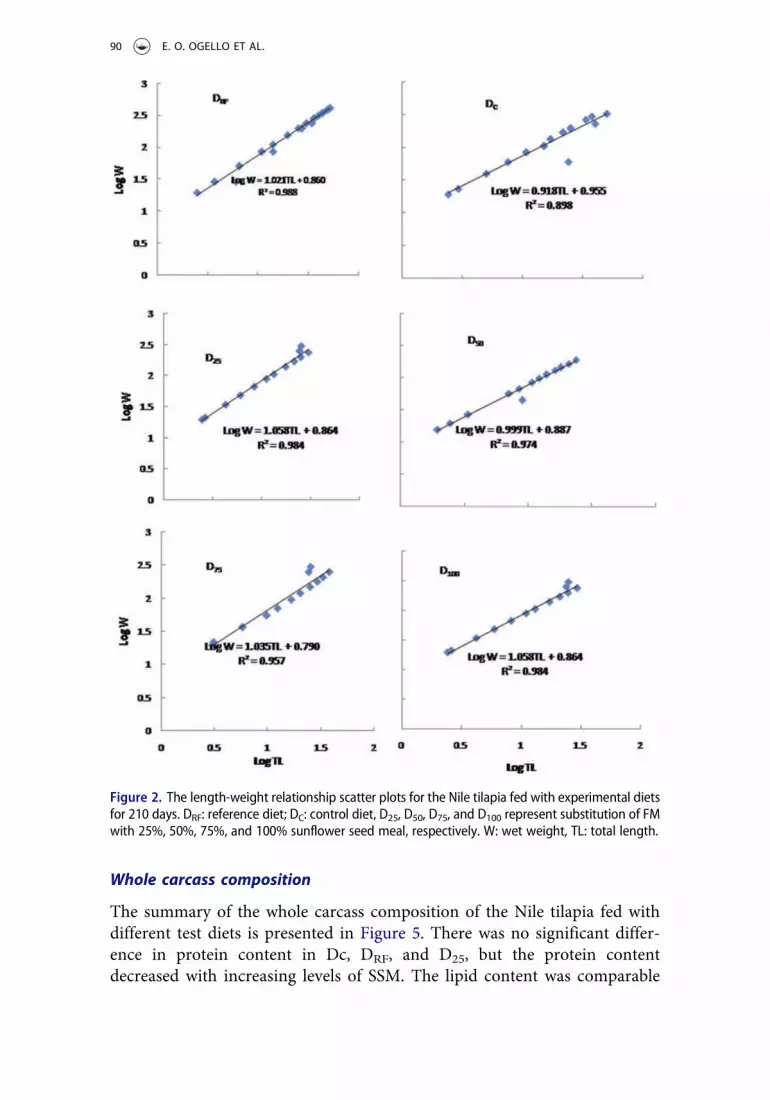
The parameters of nutrient utilization are shown in Table 5. There was nosignificant difference in FCR, PER, and PPV (P > 0.05) among DRF, DC, D25,D50, and D75. However, all the parameters in D100 were significantly lowerthan the other diets (P < 0.05). Nevertheless, the FCR was lowest in D25 andincreased with increasing sunflower seed meal levels. The PER, PPV, andPGR were highest in diet D25.
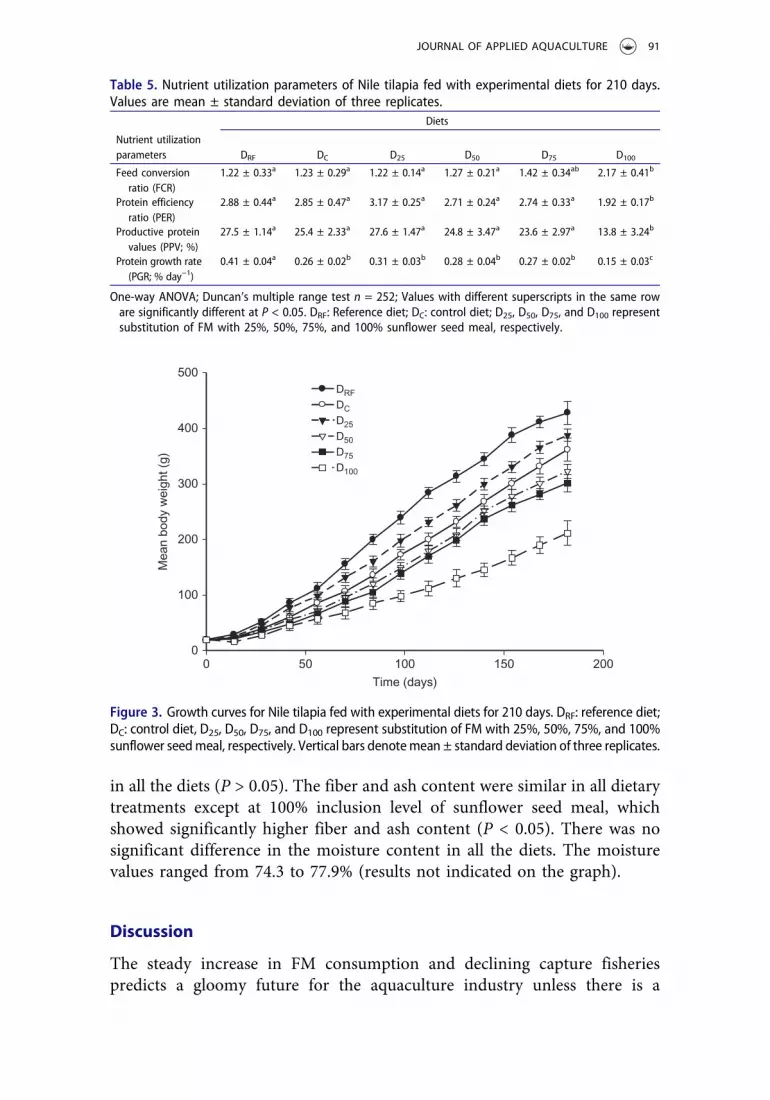
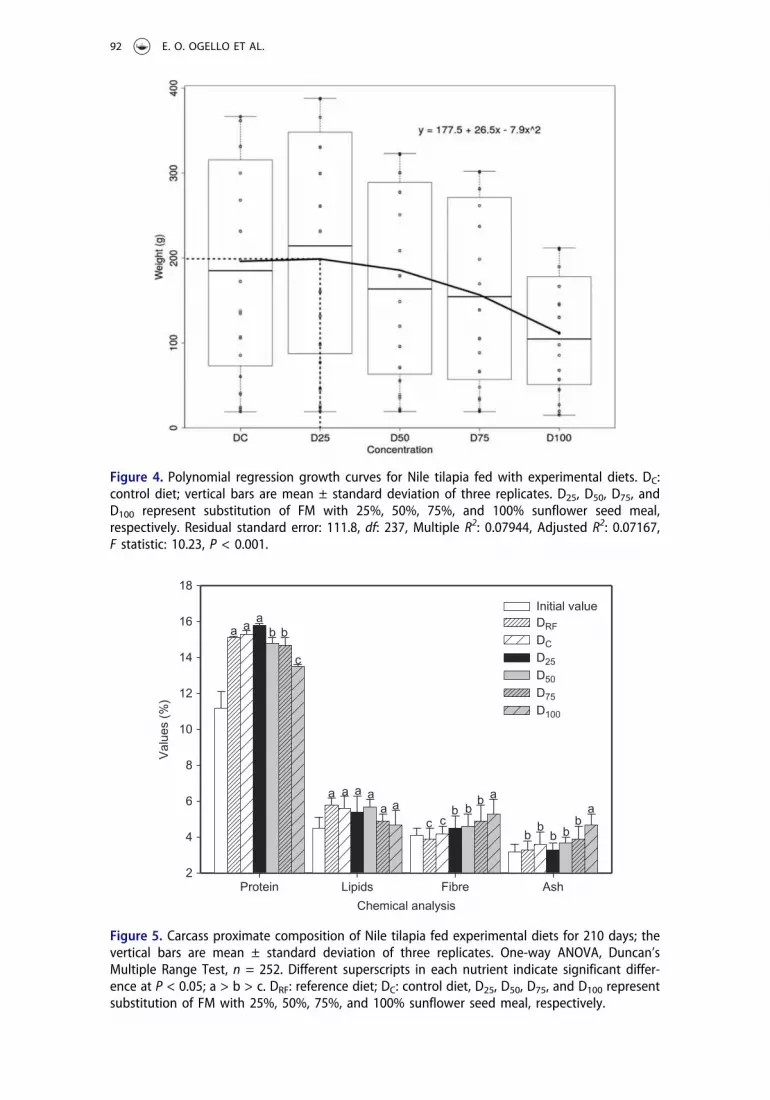
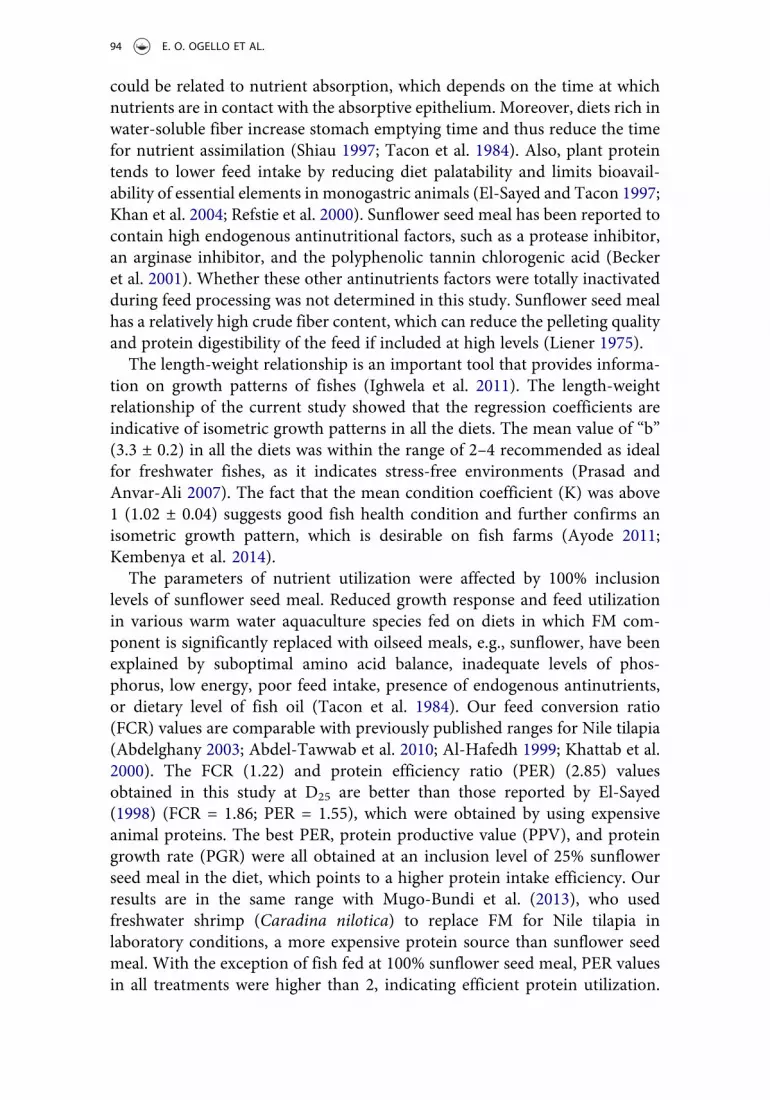
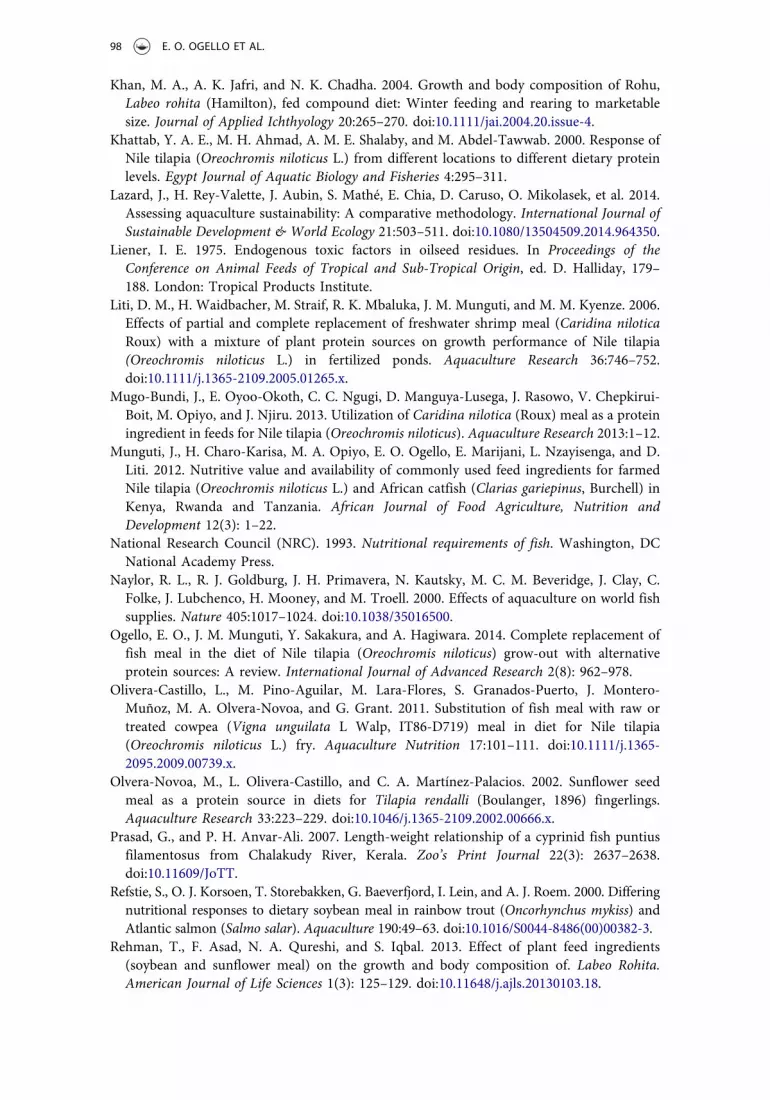
The growth curves for O. niloticus under different feed treatments areshown in Figure 3. For the first 50 days, there were no significantdifferences in growth patterns among the diets (P > 0.05). However,from day 56 onwards, the DRF and D25 recorded significantly highergrowth than the other diets (P < 0.05). There was no significant differencebetween diet D50 and D75 (P > 0.05). Diet D100 recorded significantlylowest growth from day 70 until the end of the experiment (P < 0.05).The polynomial regression growth plot is shown in Figure 4. From thisplot, the optimal fish growth weight of about 184 g was obtained with D25.The fish weight declined as the SSM exceeded D25 (Figure 4). The optimalweight was predicted by the equation y = 177.5 + 26.5x – 7.9x2, where xrepresents FM substitution level.
JOURNAL OF APPLIED AQUACULTURE 89
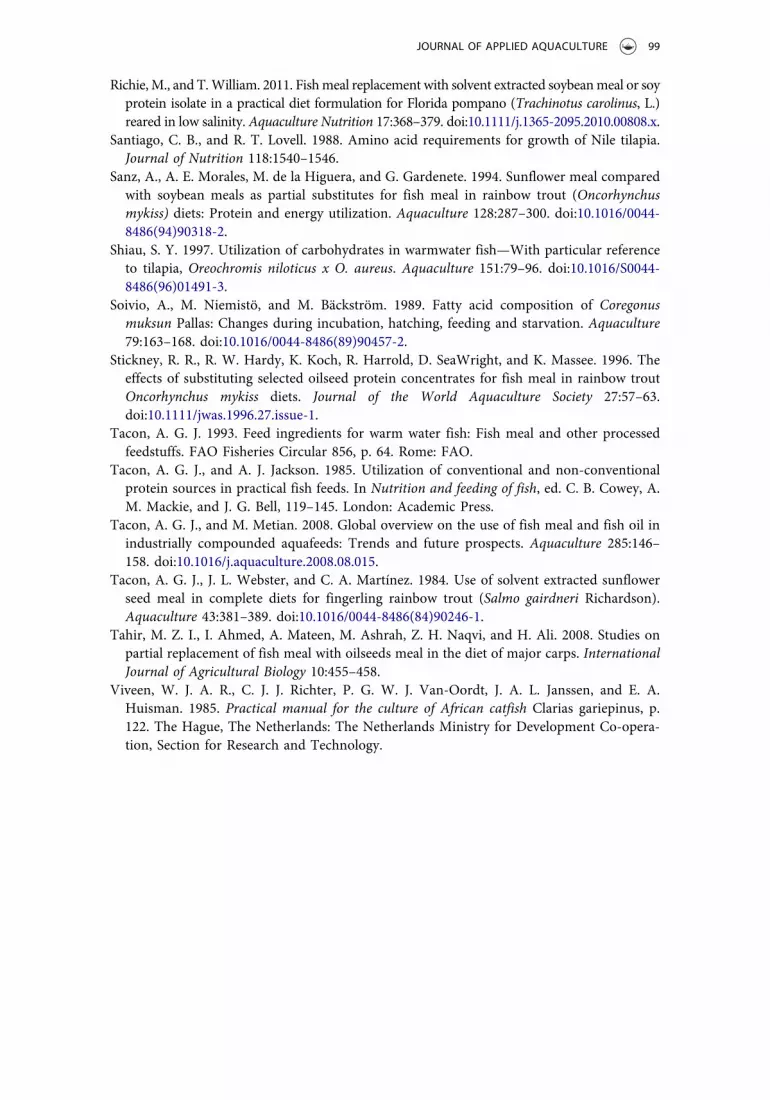
Whole carcass composition
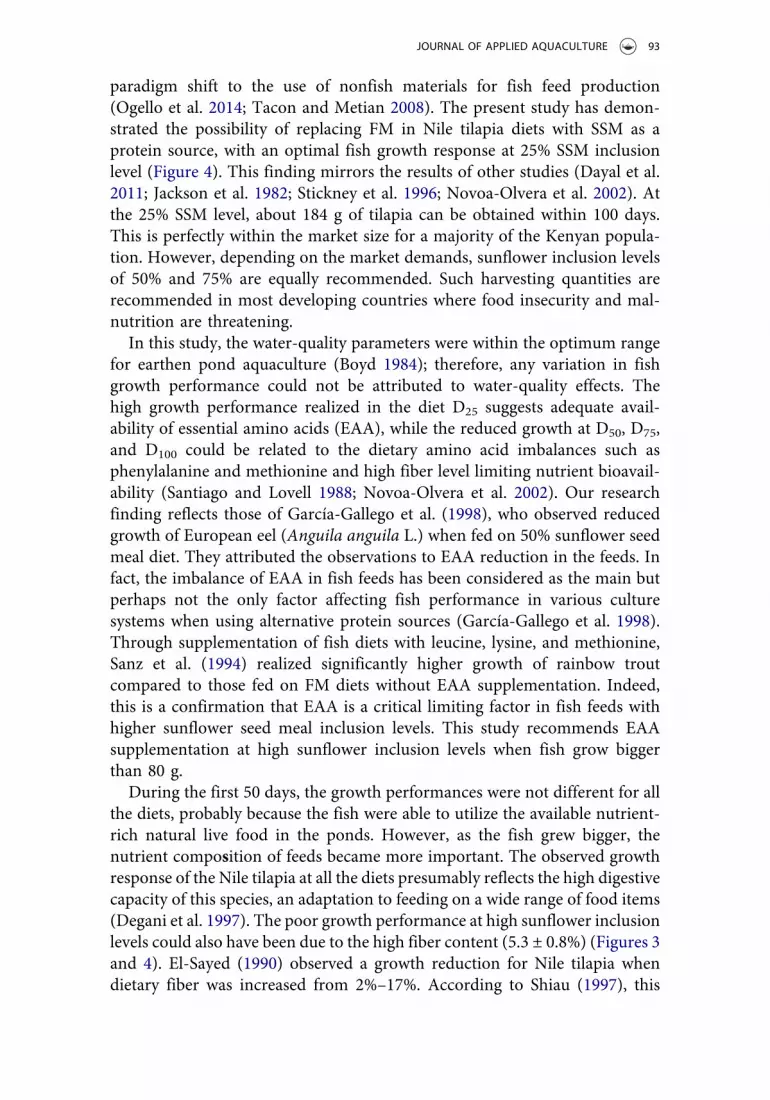
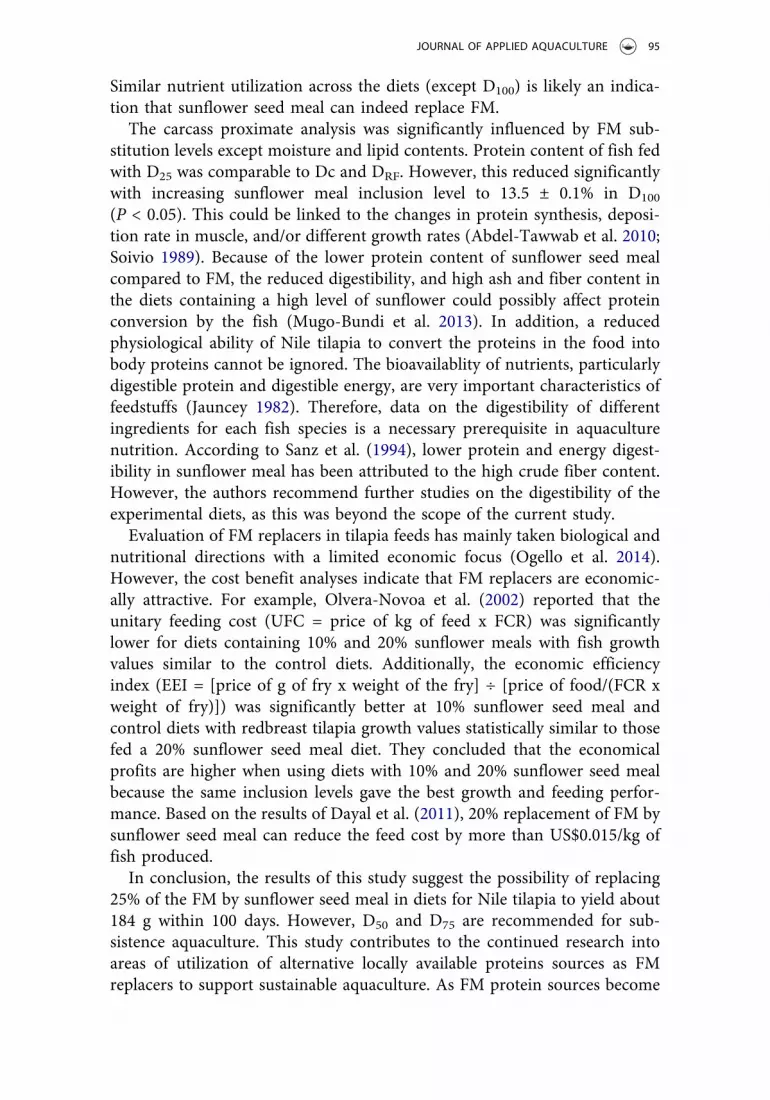
The summary of the whole carcass composition of the Nile tilapia fed withdifferent test diets is presented in Figure 5. There was no significant differ-ence in protein content in Dc, DRF, and D25, but the protein contentdecreased with increasing levels of SSM. The lipid content was comparable
Figure 2. The length-weight relationship scatter plots for the Nile tilapia fed with experimental dietsfor 210 days. DRF: reference diet; DC: control diet, D25, D50, D75, and D100 represent substitution of FMwith 25%, 50%, 75%, and 100% sunflower seed meal, respectively. W: wet weight, TL: total length.
90 E. O. OGELLO ET AL.
in all the diets (P > 0.05). The fiber and ash content were similar in all dietarytreatments except at 100% inclusion level of sunflower seed meal, whichshowed significantly higher fiber and ash content (P < 0.05). There was nosignificant difference in the moisture content in all the diets. The moisturevalues ranged from 74.3 to 77.9% (results not indicated on the graph).
Discussion
The steady increase in FM consumption and declining capture fisheriespredicts a gloomy future for the aquaculture industry unless there is a
Table 5. Nutrient utilization parameters of Nile tilapia fed with experimental diets for 210 days.Values are mean ± standard deviation of three replicates.
Diets
Nutrient utilizationparameters DRF DC D25 D50 D75 D100
One-way ANOVA; Duncan’s multiple range test n = 252; Values with different superscripts in the same roware significantly different at P < 0.05. DRF: Reference diet; DC: control diet; D25, D50, D75, and D100 representsubstitution of FM with 25%, 50%, 75%, and 100% sunflower seed meal, respectively.
Time (days)
0 50 100 150 200
Mea
n bo
dy w
eigh
t (g)
0
100
200
300
400
500DRF
DC
D25
D50
D75
D100
Figure 3. Growth curves for Nile tilapia fed with experimental diets for 210 days. DRF: reference diet;DC: control diet, D25, D50, D75, and D100 represent substitution of FM with 25%, 50%, 75%, and 100%sunflower seedmeal, respectively. Vertical bars denotemean ± standard deviation of three replicates.
JOURNAL OF APPLIED AQUACULTURE 91
Figure 4. Polynomial regression growth curves for Nile tilapia fed with experimental diets. DC:control diet; vertical bars are mean ± standard deviation of three replicates. D25, D50, D75, andD100 represent substitution of FM with 25%, 50%, 75%, and 100% sunflower seed meal,respectively. Residual standard error: 111.8, df: 237, Multiple R2: 0.07944, Adjusted R2: 0.07167,F statistic: 10.23, P < 0.001.
Chemical analysis
Protein Lipids Fibre Ash
Val
ues
(%)
2
4
6
8
10
12
14
16
18
Initial valueDRF
DC
D25
D50
D75
D100
aaa b b
c
a a a aa a
abbb
cca
b bb b
b
Figure 5. Carcass proximate composition of Nile tilapia fed experimental diets for 210 days; thevertical bars are mean ± standard deviation of three replicates. One-way ANOVA, Duncan’sMultiple Range Test, n = 252. Different superscripts in each nutrient indicate significant differ-ence at P < 0.05; a > b > c. DRF: reference diet; DC: control diet, D25, D50, D75, and D100 representsubstitution of FM with 25%, 50%, 75%, and 100% sunflower seed meal, respectively.
92 E. O. OGELLO ET AL.
paradigm shift to the use of nonfish materials for fish feed production(Ogello et al. 2014; Tacon and Metian 2008). The present study has demon-strated the possibility of replacing FM in Nile tilapia diets with SSM as aprotein source, with an optimal fish growth response at 25% SSM inclusionlevel (Figure 4). This finding mirrors the results of other studies (Dayal et al.2011; Jackson et al. 1982; Stickney et al. 1996; Novoa-Olvera et al. 2002). Atthe 25% SSM level, about 184 g of tilapia can be obtained within 100 days.This is perfectly within the market size for a majority of the Kenyan popula-tion. However, depending on the market demands, sunflower inclusion levelsof 50% and 75% are equally recommended. Such harvesting quantities arerecommended in most developing countries where food insecurity and mal-nutrition are threatening.
In this study, the water-quality parameters were within the optimum rangefor earthen pond aquaculture (Boyd 1984); therefore, any variation in fishgrowth performance could not be attributed to water-quality effects. Thehigh growth performance realized in the diet D25 suggests adequate avail-ability of essential amino acids (EAA), while the reduced growth at D50, D75,and D100 could be related to the dietary amino acid imbalances such asphenylalanine and methionine and high fiber level limiting nutrient bioavail-ability (Santiago and Lovell 1988; Novoa-Olvera et al. 2002). Our researchfinding reflects those of García-Gallego et al. (1998), who observed reducedgrowth of European eel (Anguila anguila L.) when fed on 50% sunflower seedmeal diet. They attributed the observations to EAA reduction in the feeds. Infact, the imbalance of EAA in fish feeds has been considered as the main butperhaps not the only factor affecting fish performance in various culturesystems when using alternative protein sources (García-Gallego et al. 1998).Through supplementation of fish diets with leucine, lysine, and methionine,Sanz et al. (1994) realized significantly higher growth of rainbow troutcompared to those fed on FM diets without EAA supplementation. Indeed,this is a confirmation that EAA is a critical limiting factor in fish feeds withhigher sunflower seed meal inclusion levels. This study recommends EAAsupplementation at high sunflower inclusion levels when fish grow biggerthan 80 g.
During the first 50 days, the growth performances were not different for allthe diets, probably because the fish were able to utilize the available nutrient-rich natural live food in the ponds. However, as the fish grew bigger, thenutrient composition of feeds became more important. The observed growthresponse of the Nile tilapia at all the diets presumably reflects the high digestivecapacity of this species, an adaptation to feeding on a wide range of food items(Degani et al. 1997). The poor growth performance at high sunflower inclusionlevels could also have been due to the high fiber content (5.3 ± 0.8%) (Figures 3and 4). El-Sayed (1990) observed a growth reduction for Nile tilapia whendietary fiber was increased from 2%–17%. According to Shiau (1997), this
JOURNAL OF APPLIED AQUACULTURE 93
could be related to nutrient absorption, which depends on the time at whichnutrients are in contact with the absorptive epithelium. Moreover, diets rich inwater-soluble fiber increase stomach emptying time and thus reduce the timefor nutrient assimilation (Shiau 1997; Tacon et al. 1984). Also, plant proteintends to lower feed intake by reducing diet palatability and limits bioavail-ability of essential elements in monogastric animals (El-Sayed and Tacon 1997;Khan et al. 2004; Refstie et al. 2000). Sunflower seed meal has been reported tocontain high endogenous antinutritional factors, such as a protease inhibitor,an arginase inhibitor, and the polyphenolic tannin chlorogenic acid (Beckeret al. 2001). Whether these other antinutrients factors were totally inactivatedduring feed processing was not determined in this study. Sunflower seed mealhas a relatively high crude fiber content, which can reduce the pelleting qualityand protein digestibility of the feed if included at high levels (Liener 1975).
The length-weight relationship is an important tool that provides informa-tion on growth patterns of fishes (Ighwela et al. 2011). The length-weightrelationship of the current study showed that the regression coefficients areindicative of isometric growth patterns in all the diets. The mean value of “b”(3.3 ± 0.2) in all the diets was within the range of 2–4 recommended as idealfor freshwater fishes, as it indicates stress-free environments (Prasad andAnvar-Ali 2007). The fact that the mean condition coefficient (K) was above1 (1.02 ± 0.04) suggests good fish health condition and further confirms anisometric growth pattern, which is desirable on fish farms (Ayode 2011;Kembenya et al. 2014).
The parameters of nutrient utilization were affected by 100% inclusionlevels of sunflower seed meal. Reduced growth response and feed utilizationin various warm water aquaculture species fed on diets in which FM com-ponent is significantly replaced with oilseed meals, e.g., sunflower, have beenexplained by suboptimal amino acid balance, inadequate levels of phos-phorus, low energy, poor feed intake, presence of endogenous antinutrients,or dietary level of fish oil (Tacon et al. 1984). Our feed conversion ratio(FCR) values are comparable with previously published ranges for Nile tilapia(Abdelghany 2003; Abdel-Tawwab et al. 2010; Al-Hafedh 1999; Khattab et al.2000). The FCR (1.22) and protein efficiency ratio (PER) (2.85) valuesobtained in this study at D25 are better than those reported by El-Sayed(1998) (FCR = 1.86; PER = 1.55), which were obtained by using expensiveanimal proteins. The best PER, protein productive value (PPV), and proteingrowth rate (PGR) were all obtained at an inclusion level of 25% sunflowerseed meal in the diet, which points to a higher protein intake efficiency. Ourresults are in the same range with Mugo-Bundi et al. (2013), who usedfreshwater shrimp (Caradina nilotica) to replace FM for Nile tilapia inlaboratory conditions, a more expensive protein source than sunflower seedmeal. With the exception of fish fed at 100% sunflower seed meal, PER valuesin all treatments were higher than 2, indicating efficient protein utilization.
94 E. O. OGELLO ET AL.
Similar nutrient utilization across the diets (except D100) is likely an indica-tion that sunflower seed meal can indeed replace FM.
The carcass proximate analysis was significantly influenced by FM sub-stitution levels except moisture and lipid contents. Protein content of fish fedwith D25 was comparable to Dc and DRF. However, this reduced significantlywith increasing sunflower meal inclusion level to 13.5 ± 0.1% in D100
(P < 0.05). This could be linked to the changes in protein synthesis, deposi-tion rate in muscle, and/or different growth rates (Abdel-Tawwab et al. 2010;Soivio 1989). Because of the lower protein content of sunflower seed mealcompared to FM, the reduced digestibility, and high ash and fiber content inthe diets containing a high level of sunflower could possibly affect proteinconversion by the fish (Mugo-Bundi et al. 2013). In addition, a reducedphysiological ability of Nile tilapia to convert the proteins in the food intobody proteins cannot be ignored. The bioavailablity of nutrients, particularlydigestible protein and digestible energy, are very important characteristics offeedstuffs (Jauncey 1982). Therefore, data on the digestibility of differentingredients for each fish species is a necessary prerequisite in aquaculturenutrition. According to Sanz et al. (1994), lower protein and energy digest-ibility in sunflower meal has been attributed to the high crude fiber content.However, the authors recommend further studies on the digestibility of theexperimental diets, as this was beyond the scope of the current study.
Evaluation of FM replacers in tilapia feeds has mainly taken biological andnutritional directions with a limited economic focus (Ogello et al. 2014).However, the cost benefit analyses indicate that FM replacers are economic-ally attractive. For example, Olvera-Novoa et al. (2002) reported that theunitary feeding cost (UFC = price of kg of feed x FCR) was significantlylower for diets containing 10% and 20% sunflower meals with fish growthvalues similar to the control diets. Additionally, the economic efficiencyindex (EEI = [price of g of fry x weight of the fry] ÷ [price of food/(FCR xweight of fry)]) was significantly better at 10% sunflower seed meal andcontrol diets with redbreast tilapia growth values statistically similar to thosefed a 20% sunflower seed meal diet. They concluded that the economicalprofits are higher when using diets with 10% and 20% sunflower seed mealbecause the same inclusion levels gave the best growth and feeding perfor-mance. Based on the results of Dayal et al. (2011), 20% replacement of FM bysunflower seed meal can reduce the feed cost by more than US$0.015/kg offish produced.
In conclusion, the results of this study suggest the possibility of replacing25% of the FM by sunflower seed meal in diets for Nile tilapia to yield about184 g within 100 days. However, D50 and D75 are recommended for sub-sistence aquaculture. This study contributes to the continued research intoareas of utilization of alternative locally available proteins sources as FMreplacers to support sustainable aquaculture. As FM protein sources become
JOURNAL OF APPLIED AQUACULTURE 95
scarce and more expensive, sunflower seed meal should be included in dietsfor Nile tilapia, especially for semi-intensive aquaculture where natural pondfood is available.
Acknowledgments
The authors wish to extend their gratitude to the Kenya Marine and Fisheries ResearchInstitute (KMFRI) and Kenya Agricultural Research Institute (KARI) for provision ofspace and equipment, respectively, for this study. We also thank the following laboratorytechnicians for all the assistance during the experiment: Mr. Ezekiel Nyarumba, Mr.Meshack Mikume, Mrs. Alice Osinde, Mr. Ezekiel Ongubo, and Mr. KennedyNyachongi. Special thanks to the anonymous reviewers for improving the quality of thisarticle.
Funding
This study was funded by the Kenya Agricultural Productivity and Agribusiness Project(KAPAP) grant number KAPAP — CGS/FP/2011/06.
References
Abdelghany, A. E. 2003. Partial and complete replacement of fish meal with gambusia meal indiets for red tilapia Oreochromis niloticus x O. mossambicus. Aquaculture Nutrition 9:145–154. doi:10.1046/j.1365-2095.2003.00234.x.
Abdel-Tawwab, M., H. Mohammad, M. H. Ahmad, Y. A. E. Khattab, and A. M. E. Shalaby.2010. Effect of dietary protein level, initial body weight, and their interaction on thegrowth, feed utilization, and physiological alterations of Nile tilapia, Oreochromis niloticus(L.). Aquaculture 298:267–274. doi:10.1016/j.aquaculture.2009.10.027.
Al-Hafedh, Y. S. 1999. Effects of dietary protein on growth and body composition of Niletilapia, Oreochromis niloticus L. Aquaculture Research 30:385–393. doi:10.1046/j.1365-2109.1999.00343.x.
American Public Health Assocation (APHA). 1985. American Public Health Associationstandard methods for the examination of water and wastewater, 16th ed. Washington,DC: Author.
Association of Official Analytical Chemists (AOAC). 1984. Official methods of analysis of theAssociation of Official Analytical Chemists, 14th ed. Arlington, VA: Author.
Avnimelech, Y. 2009. Biofloc technology: A practical guide book, p. 182. Baton Rouge, LA: TheWorld Aquaculture Society.
Ayode, A. A. 2011. Length-weight relationship and diet of African carp Labeo ogunensis(Boulenger, 1910) in Asejire Lake Southwestern Nigeria. Journal of Fisheries and AquaticSciences 6(4): 472–478.
Becker, K., G. Francis, and H. P. S. Makkar. 2001. Antinutritional factors present in plant-derived alternate fish feed ingredients and their effects in fish. Aquaculture 199:197–227.doi:10.1016/S0044-8486(01)00526-9.
Bilguven, M., and M. Baris. 2011. Effects of the feeds containing different plant proteinsources on growth performance and body composition of rainbow trout (Oncorhynchusmykiss, W.). Turkish Journal of Fisheries and Aquatic Sciences 11:345–350. doi:10.4194/1303-2712-v11_3_02.
Boyd, C. E. 1984. Water quality in warm water fishponds. Auburn, AL: Auburn UniversityAgriculture Experimental Station.
Dayal, S. J., V. Rajaram, K. Ambasankar, and S. A. Ali. 2011. Sunflower oil cake as areplacement for fish meal in feeds of Tiger shrimp, Penaeus monodon reared in tanksand in net cages. Indian Journal of Geo-Marine Sciences 40(3): 460–470.
Degani, G., S. Viola, and Y. Yehuda. 1997. Apparent digestibility of protein and carbohydratein feed ingredients for adult tilapia (Oreochromis aureus x O. niloticus). Israeli Journal ofAquaculture 49:115–123.
El-Saidy, D. M. S. D., and M. M. A. Gaber. 2003. Replacement of fish meal with a mixture ofdifferent plant protein sources in juvenile Nile tilapia Oreochromis niloticus (L.) diets.Aquaculture Research 34:1119–1127. doi:10.1046/j.1365-2109.2003.00914.x.
El-Sayed, A. F. M. 1990. Long-term evaluation of cotton seed meal as a protein source for Niletilapia, Oreochromis niloticus. Aquaculture 84:315–320. doi:10.1016/0044-8486(90)90096-6.
El-Sayed, A. F. M. 1998. Total replacement of fish meal with animal protein sources in Niletilapia Oreochromis niloticus (L.) feeds. Aquaculture Research 29:275–280. doi:10.1046/j.1365-2109.1998.00199.x.
El-Sayed, A. F. M. 1999. Alternative dietary protein sources for farmed tilapia Oreochromisspp. Aquaculture 179:149–168. doi:10.1016/S0044-8486(99)00159-3.
El-Sayed, A. F. M. 2002. Effect of stocking density and feeding levels on growth and feedefficiency of Nile tilapia (Oreochromis niloticus L.) fry. Aquaculture Research 33:621–626.doi:10.1046/j.1365-2109.2002.00700.x.
El-Sayed, A. F. M., and A. G. J. Tacon. 1997. Fish meal replacers for tilapia: A review. In Feedingtomorrow’s fish, ed. A. G. J. Tacon and B. Basurco, 205–224. Zaragoza, Spain: CIHEAM. 1997.
Fitzsimmons, K. 2000. Evolution of processed tilapia products in the U.S. market. GlobalAquaculture Advocate 3(5): 78–79.
Food and Agriculture Organization (FAO). 2013. The state of food insecurity in the world. InThe multiple dimensions of food security, p. 56. Rome: Author.
García-Gallego, M., H. Akharbach, and M. De La Higuera. 1998. Use of protein sourcesalternative to fish meal in diets with amino acids supplementation for the European eel(Anguilla anguilla). Animal Science 66:285–292. doi:10.1017/S1357729800009073.
Gatlin, D. M., F. T. Barrows, P. Brown, K. Dabrowski, T. Gibson, K. Gaylord, T. C. Gaylord,et al. 2007. Expanding the utilization of sustainable plant products in aquafeeds: A review.Aquaculture Research 38:551–579. doi:10.1111/j.1365-2109.2007.01704.x.
Gomes, E. F., P. Rema, and S. J. Kaushi. 1995. Replacement of fish meal by plant proteins inthe diet of rainbow trout (Oncorhynchus mykiss): Digestibility and growth performance.Aquaculture 130:177–186. doi:10.1016/0044-8486(94)00211-6.
Ighwela, K. A., A. B. Ahmed, and A. B. Abol-Munafi. 2011. Condition factor as an indicatorof growth and feeding intensity of Nile tilapia fingerlings (Oreochromis niloticus) feed ondifferent levels of maltose. American-Eurasian Journal of Agricultural & EnvironmentalScience 11(4): 559–563.
Jackson, A. J., B. S. Capper, and A. J. Matty. 1982. Evaluation of some plant proteins incomplete diets for the tilapia, Sarotherodon mossambicus. Aquaculture 27:97–109.doi:10.1016/0044-8486(82)90129-6.
Jauncey, K. 1982. The effects of varying dietary protein level on the growth, food conversion,protein utilization and body composition of juvenile tilapias (Sarotherodon mossambicus).Aquaculture 27: 43–54.
Kembenya, E. M., J. M. Munguti, and E. O. Ogello. 2014. The length-weight relationship andcondition factor of Nile tilapia (Oreochromis niloticus L.) broodstock at Kegati AquacultureResearch Station, Kisii, Kenya. International Journal of Advanced Research 2(5): 777–782.
Khan, M. A., A. K. Jafri, and N. K. Chadha. 2004. Growth and body composition of Rohu,Labeo rohita (Hamilton), fed compound diet: Winter feeding and rearing to marketablesize. Journal of Applied Ichthyology 20:265–270. doi:10.1111/jai.2004.20.issue-4.
Khattab, Y. A. E., M. H. Ahmad, A. M. E. Shalaby, and M. Abdel-Tawwab. 2000. Response ofNile tilapia (Oreochromis niloticus L.) from different locations to different dietary proteinlevels. Egypt Journal of Aquatic Biology and Fisheries 4:295–311.
Lazard, J., H. Rey-Valette, J. Aubin, S. Mathé, E. Chia, D. Caruso, O. Mikolasek, et al. 2014.Assessing aquaculture sustainability: A comparative methodology. International Journal ofSustainable Development & World Ecology 21:503–511. doi:10.1080/13504509.2014.964350.
Liener, I. E. 1975. Endogenous toxic factors in oilseed residues. In Proceedings of theConference on Animal Feeds of Tropical and Sub-Tropical Origin, ed. D. Halliday, 179–188. London: Tropical Products Institute.
Liti, D. M., H. Waidbacher, M. Straif, R. K. Mbaluka, J. M. Munguti, and M. M. Kyenze. 2006.Effects of partial and complete replacement of freshwater shrimp meal (Caridina niloticaRoux) with a mixture of plant protein sources on growth performance of Nile tilapia(Oreochromis niloticus L.) in fertilized ponds. Aquaculture Research 36:746–752.doi:10.1111/j.1365-2109.2005.01265.x.
Mugo-Bundi, J., E. Oyoo-Okoth, C. C. Ngugi, D. Manguya-Lusega, J. Rasowo, V. Chepkirui-Boit, M. Opiyo, and J. Njiru. 2013. Utilization of Caridina nilotica (Roux) meal as a proteiningredient in feeds for Nile tilapia (Oreochromis niloticus). Aquaculture Research 2013:1–12.
Munguti, J., H. Charo-Karisa, M. A. Opiyo, E. O. Ogello, E. Marijani, L. Nzayisenga, and D.Liti. 2012. Nutritive value and availability of commonly used feed ingredients for farmedNile tilapia (Oreochromis niloticus L.) and African catfish (Clarias gariepinus, Burchell) inKenya, Rwanda and Tanzania. African Journal of Food Agriculture, Nutrition andDevelopment 12(3): 1–22.
National Research Council (NRC). 1993. Nutritional requirements of fish. Washington, DCNational Academy Press.
Naylor, R. L., R. J. Goldburg, J. H. Primavera, N. Kautsky, M. C. M. Beveridge, J. Clay, C.Folke, J. Lubchenco, H. Mooney, and M. Troell. 2000. Effects of aquaculture on world fishsupplies. Nature 405:1017–1024. doi:10.1038/35016500.
Ogello, E. O., J. M. Munguti, Y. Sakakura, and A. Hagiwara. 2014. Complete replacement offish meal in the diet of Nile tilapia (Oreochromis niloticus) grow-out with alternativeprotein sources: A review. International Journal of Advanced Research 2(8): 962–978.
Olivera-Castillo, L., M. Pino-Aguilar, M. Lara-Flores, S. Granados-Puerto, J. Montero-Muñoz, M. A. Olvera-Novoa, and G. Grant. 2011. Substitution of fish meal with raw ortreated cowpea (Vigna unguilata L Walp, IT86-D719) meal in diet for Nile tilapia(Oreochromis niloticus L.) fry. Aquaculture Nutrition 17:101–111. doi:10.1111/j.1365-2095.2009.00739.x.
Olvera-Novoa, M., L. Olivera-Castillo, and C. A. Martínez-Palacios. 2002. Sunflower seedmeal as a protein source in diets for Tilapia rendalli (Boulanger, 1896) fingerlings.Aquaculture Research 33:223–229. doi:10.1046/j.1365-2109.2002.00666.x.
Prasad, G., and P. H. Anvar-Ali. 2007. Length-weight relationship of a cyprinid fish puntiusfilamentosus from Chalakudy River, Kerala. Zoo’s Print Journal 22(3): 2637–2638.doi:10.11609/JoTT.
Refstie, S., O. J. Korsoen, T. Storebakken, G. Baeverfjord, I. Lein, and A. J. Roem. 2000. Differingnutritional responses to dietary soybean meal in rainbow trout (Oncorhynchus mykiss) andAtlantic salmon (Salmo salar). Aquaculture 190:49–63. doi:10.1016/S0044-8486(00)00382-3.
Rehman, T., F. Asad, N. A. Qureshi, and S. Iqbal. 2013. Effect of plant feed ingredients(soybean and sunflower meal) on the growth and body composition of. Labeo Rohita.American Journal of Life Sciences 1(3): 125–129. doi:10.11648/j.ajls.20130103.18.
Richie,M., and T.William. 2011. Fishmeal replacement with solvent extracted soybeanmeal or soyprotein isolate in a practical diet formulation for Florida pompano (Trachinotus carolinus, L.)reared in low salinity. Aquaculture Nutrition 17:368–379. doi:10.1111/j.1365-2095.2010.00808.x.
Santiago, C. B., and R. T. Lovell. 1988. Amino acid requirements for growth of Nile tilapia.Journal of Nutrition 118:1540–1546.
Sanz, A., A. E. Morales, M. de la Higuera, and G. Gardenete. 1994. Sunflower meal comparedwith soybean meals as partial substitutes for fish meal in rainbow trout (Oncorhynchusmykiss) diets: Protein and energy utilization. Aquaculture 128:287–300. doi:10.1016/0044-8486(94)90318-2.
Shiau, S. Y. 1997. Utilization of carbohydrates in warmwater fish—With particular referenceto tilapia, Oreochromis niloticus x O. aureus. Aquaculture 151:79–96. doi:10.1016/S0044-8486(96)01491-3.
Soivio, A., M. Niemistö, and M. Bäckström. 1989. Fatty acid composition of Coregonusmuksun Pallas: Changes during incubation, hatching, feeding and starvation. Aquaculture79:163–168. doi:10.1016/0044-8486(89)90457-2.
Stickney, R. R., R. W. Hardy, K. Koch, R. Harrold, D. SeaWright, and K. Massee. 1996. Theeffects of substituting selected oilseed protein concentrates for fish meal in rainbow troutOncorhynchus mykiss diets. Journal of the World Aquaculture Society 27:57–63.doi:10.1111/jwas.1996.27.issue-1.
Tacon, A. G. J. 1993. Feed ingredients for warm water fish: Fish meal and other processedfeedstuffs. FAO Fisheries Circular 856, p. 64. Rome: FAO.
Tacon, A. G. J., and A. J. Jackson. 1985. Utilization of conventional and non-conventionalprotein sources in practical fish feeds. In Nutrition and feeding of fish, ed. C. B. Cowey, A.M. Mackie, and J. G. Bell, 119–145. London: Academic Press.
Tacon, A. G. J., and M. Metian. 2008. Global overview on the use of fish meal and fish oil inindustrially compounded aquafeeds: Trends and future prospects. Aquaculture 285:146–158. doi:10.1016/j.aquaculture.2008.08.015.
Tacon, A. G. J., J. L. Webster, and C. A. Martínez. 1984. Use of solvent extracted sunflowerseed meal in complete diets for fingerling rainbow trout (Salmo gairdneri Richardson).Aquaculture 43:381–389. doi:10.1016/0044-8486(84)90246-1.
Tahir, M. Z. I., I. Ahmed, A. Mateen, M. Ashrah, Z. H. Naqvi, and H. Ali. 2008. Studies onpartial replacement of fish meal with oilseeds meal in the diet of major carps. InternationalJournal of Agricultural Biology 10:455–458.
Viveen, W. J. A. R., C. J. J. Richter, P. G. W. J. Van-Oordt, J. A. L. Janssen, and E. A.Huisman. 1985. Practical manual for the culture of African catfish Clarias gariepinus, p.122. The Hague, The Netherlands: The Netherlands Ministry for Development Co-opera-tion, Section for Research and Technology.