Journal of Colloid and Interface Science 287 (2005) 338–350 www.elsevier.com/locate/jcis Simulations of a dielectrophoretic membrane filtration process for removal of water droplets from water-in-oil emulsions Shahnawaz H. Molla a , Jacob H. Masliyah b , Subir Bhattacharjee a,∗ a Department of Mechanical Engineering, University of Alberta, Edmonton, AB T6G 2G8, Canada b Department of Chemical and Materials Engineering, University of Alberta, Edmonton, AB T6G 2G8, Canada Received 2 February 2004; accepted 30 June 2004 Available online 24 August 2004 Abstract A novel separation technique based on simultaneous application of AC dielectrophoresis and preferential transport through a semiper- meable hydrophilic membrane is proposed for separation of small amounts of emulsified water droplets from a water-in-oil emulsion. Embedding an array of parallel microelectrodes on a membrane matrix, followed by application of an AC potential to these electrodes, can result in capturing the water droplets onto the membranes from the emulsion during a crossflow filtration process. The present paper describes the theoretical principles underlying such a process, and describes a simple mathematical framework based on trajectory analysis for assessing the separation efficiency of such a technique. The results indicate that superimposition of an AC dielectrophoretic field can significantly enhance the preferential transport of the emulsified water through the membrane in a crossflow filtration device. This can lead to a highly efficient continuous separation process for dilute emulsions. 2004 Elsevier Inc. All rights reserved. Keywords: AC electrokinetics; Dielectrophoresis; Water-in-oil emulsion; Membrane separation; Trajectory analysis; Parallel electrodes 1. Introduction AC electrokinetic techniques such as dielectrophoresis and electrorotation have been extensively utilized for manip- ulation, separation, and analysis of colloidal-scale particles for several decades [1–7]. The basic principle underlying dielectrophoresis is the interaction of induced dipoles in col- loidal entities with a spatially inhomogeneous electric field, giving rise to attractive or repulsive forces on the particles. These forces have been used to trap cells in specially de- signed electrode configurations in a manner analogous to optical trapping [8–11], for fractionation of components of a cellular mixture [12–15], and several other applications in- volving biological systems [13,16–23]. Dielectrophoretic fractionation has also been used in process engineering applications quite often, particularly for * Corresponding author. Fax: +1-780-492-2200. E-mail address: [email protected](S. Bhattacharjee). flocculation of colloidal entities in a uniform electric field [24,25]. In these processes, the local field gradients engen- dered by the different dielectric permittivities of the colloids and the suspending media result in an attractive force be- tween the particles, leading to flocculation. The flocs can then be separated by gravity or field-flow fractionation. In the earlier studies, macroscopic sizes of the electrodes re- sulted in fairly small dielectrophoretic forces. However, with improvements in microfabrication techniques, it is becom- ing increasingly feasible to create microelectrode arrays on a substrate that can generate intense electric field gradi- ents. For instance, microfabrication techniques for embed- ding electrode arrays 50–200 μm wide with a comparable pitch have been demonstrated [1,11,12,26,27]. These types of arrays can generate intense electrical field gradients on the order on 10 6 –10 7 V/m, which can be extremely effec- tive in field-flow fractionation of colloidal scale materials. Taking this concept one step further, we can conceive a membrane-based separation device for emulsions where a dilute emulsion can be subjected to a dielectrophoretic 0021-9797/$ – see front matter 2004 Elsevier Inc. All rights reserved. doi:10.1016/j.jcis.2004.06.096
Transcript
a semiper-mulsion.ectrodes,sent paperory analysisc field can
can lead
Journal of Colloid and Interface Science 287 (2005) 338–350www.elsevier.com/locate/jcis
Simulations of a dielectrophoretic membrane filtration processfor removal of water droplets from water-in-oil emulsions
Shahnawaz H. Mollaa, Jacob H. Masliyahb, Subir Bhattacharjeea,∗
a Department of Mechanical Engineering, University of Alberta, Edmonton, AB T6G 2G8, Canadab Department of Chemical and Materials Engineering, University of Alberta, Edmonton, AB T6G 2G8, Canada
Received 2 February 2004; accepted 30 June 2004
Available online 24 August 2004
Abstract
A novel separation technique based on simultaneous application of AC dielectrophoresis and preferential transport throughmeable hydrophilic membrane is proposed for separation of small amounts of emulsified water droplets from a water-in-oil eEmbedding an array of parallel microelectrodes on a membrane matrix, followed by application of an AC potential to these elcan result in capturing the water droplets onto the membranes from the emulsion during a crossflow filtration process. The predescribes the theoretical principles underlying such a process, and describes a simple mathematical framework based on trajectfor assessing the separation efficiency of such a technique. The results indicate that superimposition of an AC dielectrophoretisignificantly enhance the preferential transport of the emulsified water through the membrane in a crossflow filtration device. Thisto a highly efficient continuous separation process for dilute emulsions. 2004 Elsevier Inc. All rights reserved.
AC electrokinetic techniques such as dielectrophorand electrorotation have been extensively utilized for maulation, separation, and analysis of colloidal-scale partifor several decades[1–7]. The basic principle underlyindielectrophoresis is the interaction of induced dipoles inloidal entities with a spatially inhomogeneous electric fiegiving rise to attractive or repulsive forces on the particThese forces have been used to trap cells in speciallysigned electrode configurations in a manner analogouoptical trapping[8–11], for fractionation of components ofcellular mixture[12–15], and several other applications ivolving biological systems[13,16–23].
Dielectrophoretic fractionation has also been usedprocess engineering applications quite often, particularly
0021-9797/$ – see front matter 2004 Elsevier Inc. All rights reserved.doi:10.1016/j.jcis.2004.06.096
-
flocculation of colloidal entities in a uniform electric fie[24,25]. In these processes, the local field gradients endered by the different dielectric permittivities of the colloiand the suspending media result in an attractive forcetween the particles, leading to flocculation. The flocsthen be separated by gravity or field-flow fractionation.the earlier studies, macroscopic sizes of the electrodesulted in fairly small dielectrophoretic forces. However, wimprovements in microfabrication techniques, it is becoing increasingly feasible to create microelectrode arraya substrate that can generate intense electric field gents. For instance, microfabrication techniques for embding electrode arrays 50–200 µm wide with a comparapitch have been demonstrated[1,11,12,26,27]. These typesof arrays can generate intense electrical field gradientthe order on 106–107 V/m, which can be extremely effective in field-flow fractionation of colloidal scale materials.
Taking this concept one step further, we can conceivea membrane-based separation device for emulsions wherea dilute emulsion can be subjected to a dielectrophoretic
force in a crossflow filtration channel, in which the permable membrane has an embedded array of parallel melectrodes. When actuated by an ac voltage, such a dcan selectively attract suspended droplets of a phase whigh dielectric constant from a suspending medium witlow dielectric constant toward the membrane. The perable membrane then allows these droplets to be remfrom the feed stream. Such a process can be extremelyful in a variety of applications involving separation of tcomponents of a microemulsion. For instance, during exttion of bitumen from tar sands using water-based procesabout 1% (by volume fraction) water remains suspendethe extracted dilute bitumen as microscopic droplets[28,29].These droplets are difficult to remove by centrifugal seption and pose serious problems in the downstream procewhich include corrosion of the equipment, unwanted cheical reactions leading to products that can be corrosive,numerous other difficulties. In this context, a technologyremoval of this residual water from diluted bitumen hascome a major focus of attention during recent years.process described in this study attempts to address thislem. Apart from this example, there are several othercrofluidic separation scenarios in which this type of seption technique could theoretically be applied.
The study reported here is a mathematical analysis oseparation process currently being developed in our labtory based on the above principles. The objectives of thisper are to identify the key parameters influencing the dietrophoretic trapping of water droplets from a dilute orgamedium on a permeable membrane, model the transporhavior of the droplets, and simulate the separation proproviding a measure of the separation efficiency. Wepresent a brief conceptual description of the crossflowtration device for the separation. Following this, we presan analytical expression for the dielectrophoretic force baon a series approximation for the dielectrophoretic potial on an infinite parallel array of electrodes originally prposed and solved by Clague and Wheeler[30]. Finally a tra-jectory analysis considering the combined dielectrophorand permeation drag forces on the droplets is develoto predict the separation efficiency of a crossflow filtratmodule with a permeable wall containing an embeddedray of parallel electrodes.
2. Dielectrophoretic membrane filtration of dilutemicroemulsions
In this section we briefly describe the concept of dieltrophoretic membrane filtration, outlining the key elemeof the separation technique and some of the key conerations that should be borne in mind when designingseparation process.
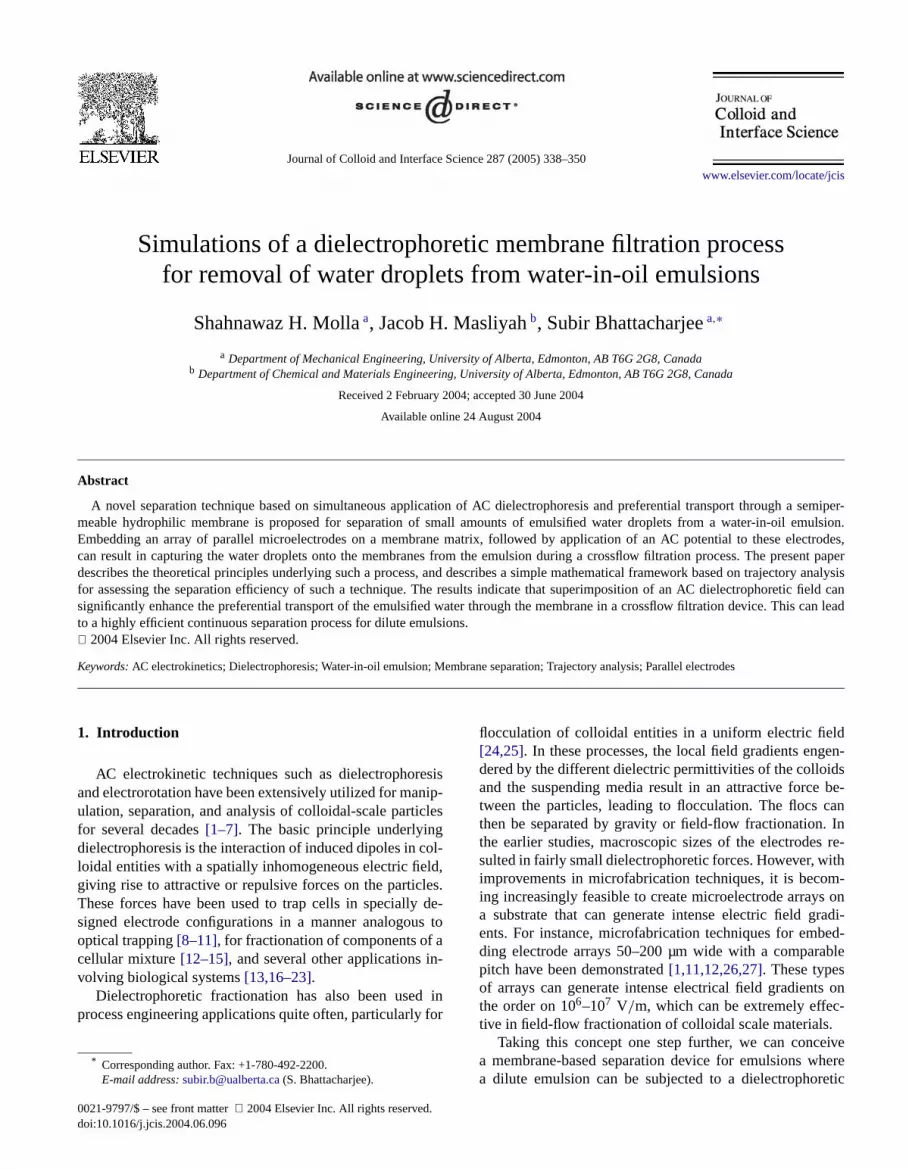
Fig. 1a depicts a schematic representation of the setupto be employed for the dielectrophoretic membrane filtra-tion based separation process. This proposed process utilize
Interface Science 287 (2005) 338–350 339
-
,
,
-
-
(a)
(b)
(c)
Fig. 1. (a) Schematic diagram showing the conceptual picture of theposed system for dielectrophoretic membrane filtration.W andP are thewidth and pitch of the electrodes on the parallel electrode array, restively. 2H represents the total height of the channel.V̄x andVw are averagecross flow velocity in the channel and suction velocity on the membrrespectively. (b) Schematic diagram showing the coordinates and thetrode configuration.aj andbj are the leading and trailing edge of thej thelectrode.λk is the midpoint ofkth pair of electrode. (c) Schematic diagradepicting drop size, separation distance from the membrane surface aforces acting on each drop in the system.
dielectrophoresis to separate the target species from a couous medium and enhances the process by adding memfiltration to dispose of the separated particles. As indicateFig. 1a, the channel under consideration is rectangular wa height 2H and the bottom surface of the channel is a mebrane embedded with an array of electrodes. With the ladevelopments in microfabrication technology, it is possito build an array of electrodes, each 30–50 µm wide(W),with equal or larger spacing(G) in between the electrodeFor the simulations presented here, the electrode surfaceconsidered to be coated with a layer of low-dielectric marial to avert short-circuiting of the electrodes. This coat
s
should be sufficiently thin not to significantly attenuate theelectric field. The dielectrophoretic (DEP) force field createdover the electrode array is perfectly periodic in the axial di-
rection and diminishes almost exponentially with increastransverse distance from the membrane.
In our simulations of dielectrophoretic membrane filttion in a tangential flow system, the water-in-oil emulsiapproaches the electrode plane with an initial concentraof water droplets and flows across the channel lengthan average velocity governed by the axial volumetric flrate. As the emulsion flows over the electrode array, theelectric force field acts on the water droplets and pulls thdown toward the bottom surface of the channel. As the ccentration of the water droplets increases on the membsurface, the membrane filters the droplets to the permside. The process can be enhanced by applying a smaltion on the permeate side of the membrane. The permeof the water rich phase through the membrane will eveally reduce the water concentration in the feed solutionemerges downstream of the crossflow channel.
The efficiency of the entire process depends on sevfactors, such as the electrode and channel design, apvoltage and frequency, flow rate of emulsion, and mostportantly, the dielectric properties of the target speciesthe continuous media. The process can be limited by sefactors. For instance, as the water drops are attracted tothe electrode plane residing on the membrane, a thin lof water may build up on the electrode surface, therebyfecting the functionality of the electrodes by causing shcircuits and attenuating the electric fields. Therefore, inecessary to remove the accumulated water from thetom (membrane) surface. Currently, we hypothesize thadroplets can be removed by permeation through the mbrane while the electrical field is switched on. Howeverreality, one might have to switch off the electrical field tolow removal of the water through the membrane. Seconddroplet–droplet attraction due to the modification of the loelectrostatic field as they come closer during their downwjourney toward the membrane can lead to coalescenceformation of larger droplets. Since larger drops experiegreater DEP force, coalescence may be beneficial to thearation process.
3. Dielectrophoretic forces for a parallel electrode array
In this section, we briefly summarize the key goveing equations used in this model to describe the elecfield over an array of electrodes and the movement ofpended droplets in a crossflow channel. The present anais based on an analytic approach for obtaining the potial distribution over an array of parallel microelectroddeveloped earlier by Clague and Wheeler[30]. The prin-cipal geometric and parametric considerations used inmodel are shown inFig. 1, which illustrates the paraboli
flow profile over the electrode array and the effect of posi-tive dielectrophoretic force on the suspended water droplets,which pulls the droplets towards the electrodes.
Interface Science 287 (2005) 338–350
-
ld
ld
d
-
s
3.1. Mathematical formulation
We develop the mathematical formulation in a 2-dimeional Cartesian framework. The length of the electrodesbe considered infinite compared to the other two dimensinside the channel. InFig. 1, x and y represent the axiaand transverse directions, respectively. The pitch of the etrode array, i.e., the center-to-center spacing betweenelectrodes is denoted by 2d and the electrode width isW .
The time-averaged dielectrophoretic (DEP) force[31,32]acting on a single particle (droplet in the present case)to a nonuniform external electrical field can be approximain terms of dipole effects as
(1)FDEP= 2πa3εm Re[K
(ε∗
p, ε∗m
)]∇(E · E),
where E is the applied electric field,a is the suspendedroplet radius, and Re[K(ε∗
p, ε∗m)] is the real component o
the frequency-dependent Clausius–Mossotti factor,
(2)K(ε∗
p, ε∗m
) = ε∗p − ε∗
m
ε∗p + 2ε∗
m,
determined byε∗p andε∗
m, the complex permittivities of thedroplet and the suspending medium, respectively. The cplex permittivity isε∗ = ε − i(σ/ω), wherei = √−1, ε isthe permittivity,σ is the conductivity, andω is the angularfrequency of the applied field. The Clausius–Mossotti ftor can theoretically have a value that ranges between+1.0and −0.5. According to the above equations, the signthe Clausius–Mossotti factor determines whether a drois repelled from or attracted to regions of high electric fistrength. A positive factor indicates attraction, which is gerally referred to as positive DEP.
Solution for the potential field produced by the electroarray inside the channel has been obtained by followinghalf-plane Green’s function approach presented earlieClague and Wheeler[30]. We rederived the governing equtions as per[30], and present the expressions for the pottial and the field intensity gradients, since the corresponequations in the original article[30] have several typographical errors. For this analysis, the electric field is produby an ac voltage applied to the electrodes with consecuphase increments ofπ for each electrode in the array. Herey
is the vertical position above the electrode plane andx is thehorizontal position along the plane. The potential appliethej th, electrode (Fig. 1b) is given by
(3)ψe(x) = V0 cos
(ωt + 2πj
n
),
whereV0 is the magnitude of applied rms (root mean squavoltage,ω is the frequency of the applied signal,j is theelectrode identification number, andn is the mode. For thisanalysis we are interested only in stationary wave DEP,
accordingly,n will be set to 2.
The surface potential in the gap between the electrodes isassumed to change linearly, thereby ensuring continuity and
d and
ecut areen-be
nend-rib-
forr.
em.nt
tricbi-
h
EPas
g ar-de-
ops,thel tolets
tricer a
m-eldofetradi-dlets
erty
S.H. Molla et al. / Journal of Colloi
smoothness of the surface potential profile between constive electrodes. This approximation produces results thain accord with results obtained by application of charge dsity method[33]. The surface potential in the gaps canexpressed as
ψg(x) = V0
([cosj+1 −cosj
2d − W
]
(4)×[x −
{λk − d + W
2
}]+ cosj
),
ψg(x) = C1 + C2x + C3,
C1 = V0 cosj , C2 = V0
[cosj+1 −cosj
2d − W
],
(5)C3 = −(
λk − d + W
2
)C2,
whereλk is the midpoint of thekth electrode pair (Fig. 1b)and cosj is an abbreviated form of the term cos(ωt +2πj/n).
By performing a piecewise integration of the half-plaGreen’s function with appropriate surface potential bouary conditions along the entire surface, the potential distution above the electrode array can be obtained as[30]
ψ(x, y) = − 1
π
N∑j=1
ψe
(tan−1
[x − bj
y
]− tan−1
[x − aj
y
])
+ 1
π
N−1∑j=1
{−ψg(x)
(tan−1
[x − aj+1
y
]
− tan−1[x − bj
y
])
+ C2(y)
2
[ln
(1+
[x − aj+1
y
]2)
(6)− ln
(1+
[x − bj
y
]2)]}
.
Equation(6) is presented here since the original equationthe potential distribution in[30] had a typographical erroThe constantC2 in Eq. (5) is same as in Eq.(4) for the po-tential in the gaps, while the termsaj andbj stand for thedistances of the leading and trailing edges of thej th elec-trode, respectively, from the origin of the coordinate syst
The term∇(E · E) in Eq.(1) defines the force componeengendered by the nonuniform fieldE. Equation(1) impliesthat the DEP force is proportional to the gradient of elecfield intensity,∇(E · E), which can be expressed as a comnation of the following derivatives
∂
∂x(E · E) = 2
(Ex
∂Ex
∂x+ Ey
∂Ey
∂x
),
(7)∂
∂y(E · E) = 2
(Ex
∂Ex
∂y+ Ey
∂Ey
∂y
).
Interface Science 287 (2005) 338–350 341
- Expressions for the electric field components in botx
andy direction and the partial derivatives ofEx andEy aregiven in the appendix. Utilizing these expressions, the Dforce along the two principal directions can be writtenfollows:
(FDEP)x = 2πa3εm Re[K
(ε∗
p, ε∗m
)] ∂
∂x(E · E),
(8)(FDEP)y = 2πa3εm Re[K
(ε∗
p, ε∗m
)] ∂
∂y(E · E).
The dielectrophoretic force is generated by applyinnonuniform electric field on dielectrically polarizable paticles. The magnitude and the direction of the force arependent on the electric field gradient, the size of the drand the dielectric properties of the droplets relative tosurrounding medium. Since the DEP force is proportionathe gradient in electric field intensity, the suspended dropwill be attracted to the regions with high gradient of elecfield intensity. In the following, we will briefly discuss thnature of the electric field and the DEP force profile overepresentative section of the electrode array.
3.2. Electric field and gradients of field intensity
To understand the behavior of the DEP force, a coplete picture of the electric field and gradient of the fiintensity is essential. Equation(1) reflects the dependenceDEP force on complex dielectric permittivities of the targspecies and the suspending medium, drop size, and gent in field intensity[19,31]. All the simulations describehere are performed for a system comprising of water dropsuspended in dilute oil. The physical and chemical propranges used in these simulations are listed inTable 1.
Table 1Physical and chemical properties of the system studied
Property Value
System Water in decaneDroplet radius 1–2 µmDensity of water 1000 kg/m3
Specific gravity of medium (decane) ≈1.0Viscosity of decane 1.0× 10⁻³ Ns/m2
Temperature 298 KBoltzmann constant 1.38× 10⁻²³ J/K
Electrode propertiesElectrode width 20–75 µmElectrode pitch 100 µmRMS voltage range 50–250 VFrequency 600–2000 HzConductivity of water 5.0× 10⁻⁸ S/mRelative permittivity of water 78–80Conductivity of decane 1.0× 10⁻¹⁰ S/mRelative permittivity of decane 5–6
Channel dimensionsChannel length 10 mmChannel height 0.1–2 mm
Volumetric flow rate 1–6 ml/minSuction velocity 1× 10⁻⁶–6× 10⁻⁵ m/s
and
anttheryigh-
r ofTheandal totureion-vers areero
on-s inh iscon-ltage
lute, is
ode.sityecayivenelingecaygn
y
thetion,
for
crces
thets,odesity
nifi-litylec-
ssedctge,
ac-
en-rcethe
l axis
342 S.H. Molla et al. / Journal of Colloid
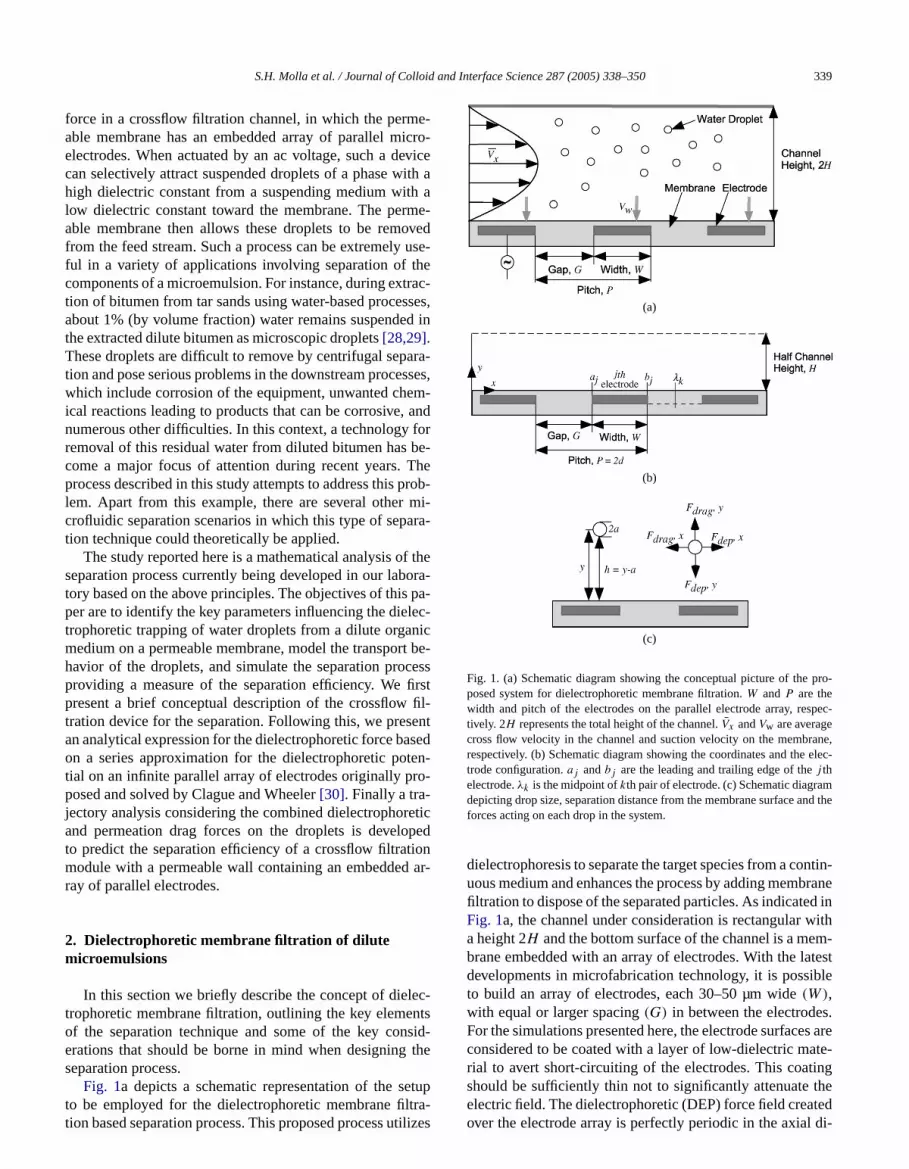
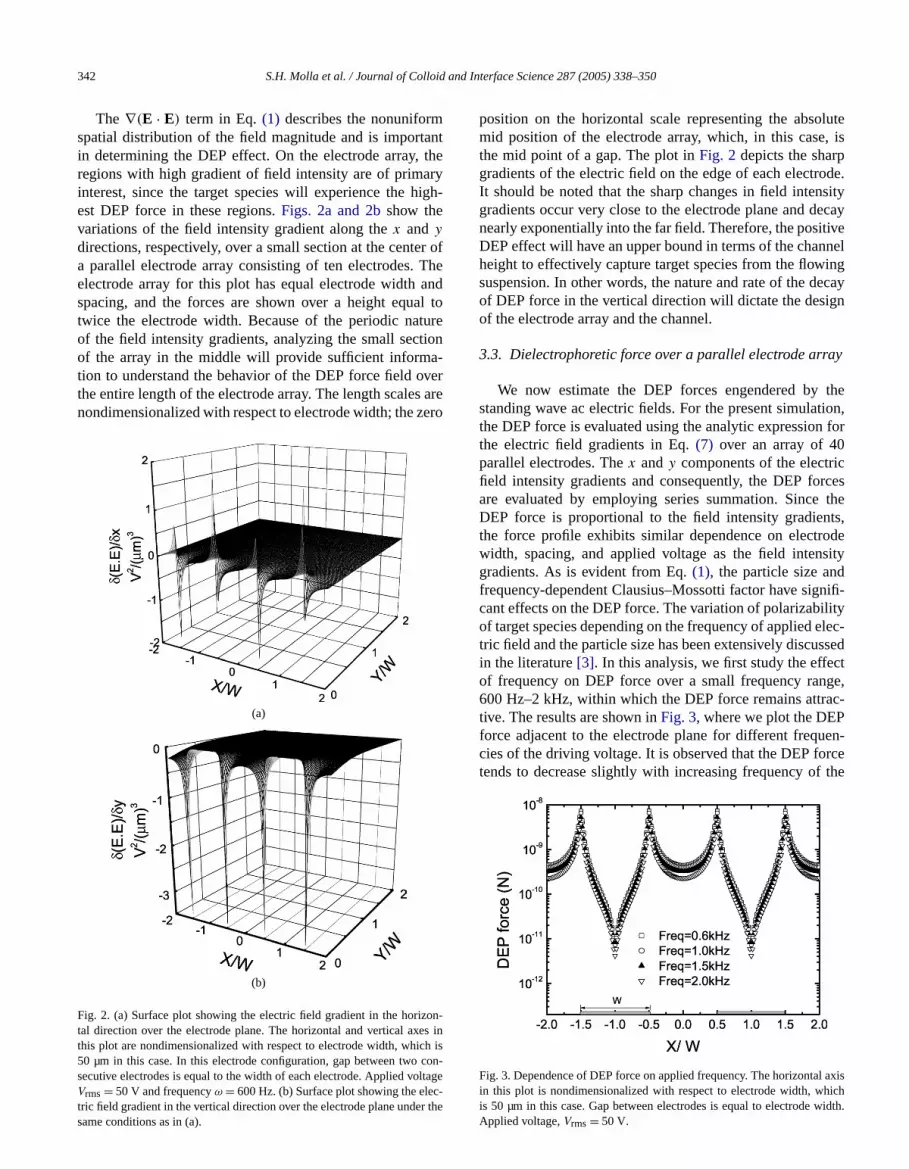
The ∇(E · E) term in Eq.(1) describes the nonuniformspatial distribution of the field magnitude and is importin determining the DEP effect. On the electrode array,regions with high gradient of field intensity are of primainterest, since the target species will experience the hest DEP force in these regions.Figs. 2a and 2bshow thevariations of the field intensity gradient along thex andy
directions, respectively, over a small section at the centea parallel electrode array consisting of ten electrodes.electrode array for this plot has equal electrode widthspacing, and the forces are shown over a height equtwice the electrode width. Because of the periodic naof the field intensity gradients, analyzing the small sectof the array in the middle will provide sufficient information to understand the behavior of the DEP force field othe entire length of the electrode array. The length scalenondimensionalized with respect to electrode width; the z
(a)
(b)
Fig. 2. (a) Surface plot showing the electric field gradient in the horiztal direction over the electrode plane. The horizontal and vertical axethis plot are nondimensionalized with respect to electrode width, whic50 µm in this case. In this electrode configuration, gap between twosecutive electrodes is equal to the width of each electrode. Applied vo
Vrms= 50 V and frequencyω = 600 Hz. (b) Surface plot showing the elec-tric field gradient in the vertical direction over the electrode plane under thesame conditions as in (a).
Interface Science 287 (2005) 338–350
position on the horizontal scale representing the absomid position of the electrode array, which, in this casethe mid point of a gap. The plot inFig. 2 depicts the sharpgradients of the electric field on the edge of each electrIt should be noted that the sharp changes in field intengradients occur very close to the electrode plane and dnearly exponentially into the far field. Therefore, the positDEP effect will have an upper bound in terms of the chanheight to effectively capture target species from the flowsuspension. In other words, the nature and rate of the dof DEP force in the vertical direction will dictate the desiof the electrode array and the channel.
3.3. Dielectrophoretic force over a parallel electrode arra
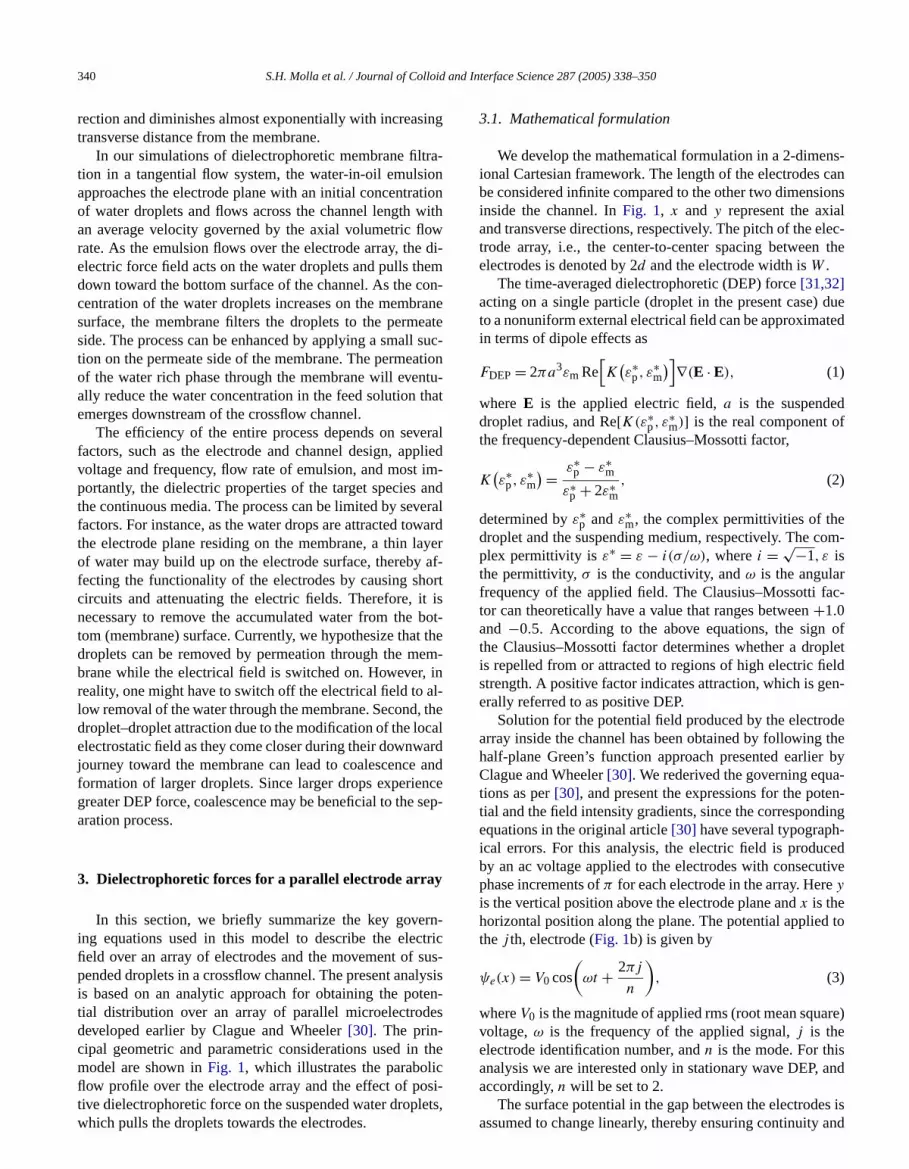
We now estimate the DEP forces engendered bystanding wave ac electric fields. For the present simulathe DEP force is evaluated using the analytic expressionthe electric field gradients in Eq.(7) over an array of 40parallel electrodes. Thex andy components of the electrifield intensity gradients and consequently, the DEP foare evaluated by employing series summation. SinceDEP force is proportional to the field intensity gradienthe force profile exhibits similar dependence on electrwidth, spacing, and applied voltage as the field intengradients. As is evident from Eq.(1), the particle size andfrequency-dependent Clausius–Mossotti factor have sigcant effects on the DEP force. The variation of polarizabiof target species depending on the frequency of applied etric field and the particle size has been extensively discuin the literature[3]. In this analysis, we first study the effeof frequency on DEP force over a small frequency ran600 Hz–2 kHz, within which the DEP force remains attrtive. The results are shown inFig. 3, where we plot the DEPforce adjacent to the electrode plane for different frequcies of the driving voltage. It is observed that the DEP fotends to decrease slightly with increasing frequency of
Fig. 3. Dependence of DEP force on applied frequency. The horizonta
in this plot is nondimensionalized with respect to electrode width, whichis 50 µm in this case. Gap between electrodes is equal to electrode width.Applied voltage,Vrms= 50 V.
d and
androdeelec-
idth,ce is
onstially
the-t inar-onel
kenainEP
reks incid-
ts.nearitudered
atthewson-
t isddleroderomdis-
ffer-izedodes,
planeizedequal
rray
EPncero-ity
nearlec-liedde
S.H. Molla et al. / Journal of Colloi
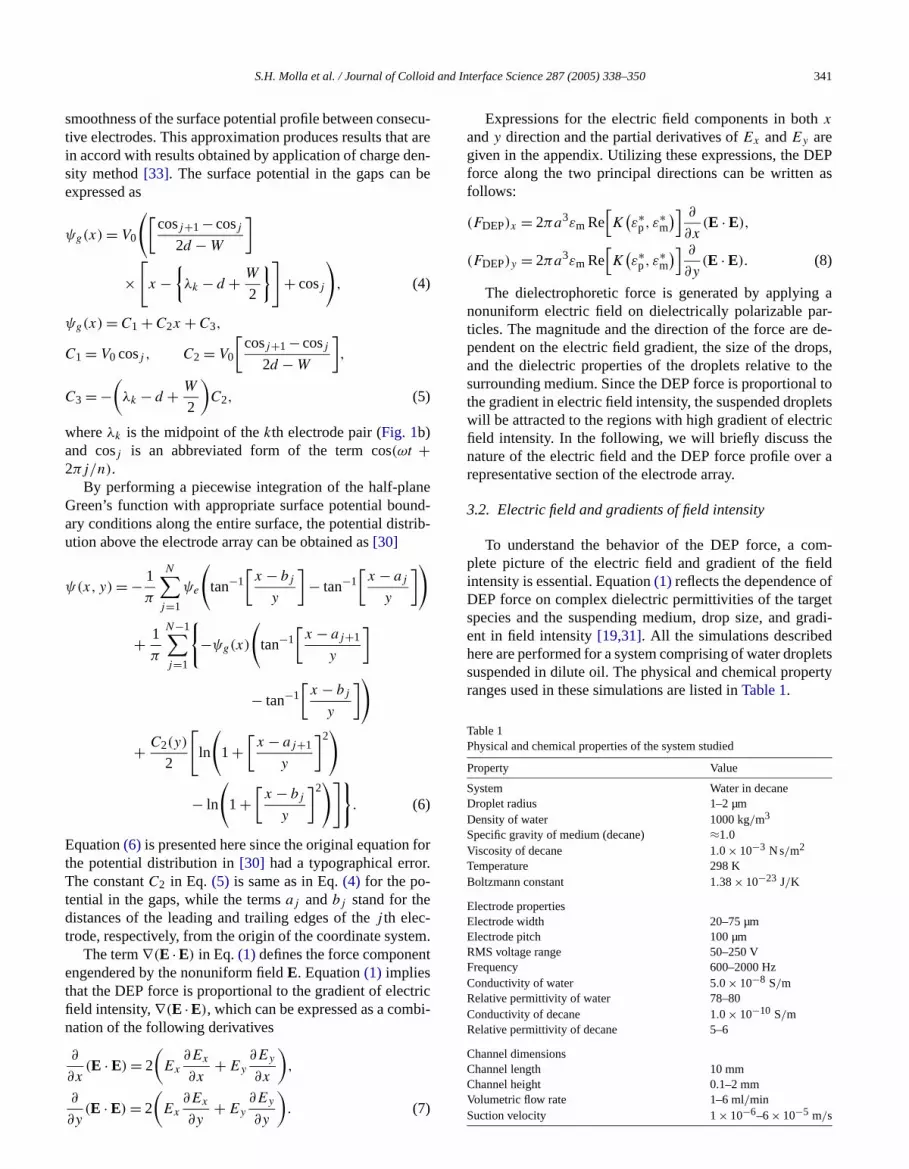
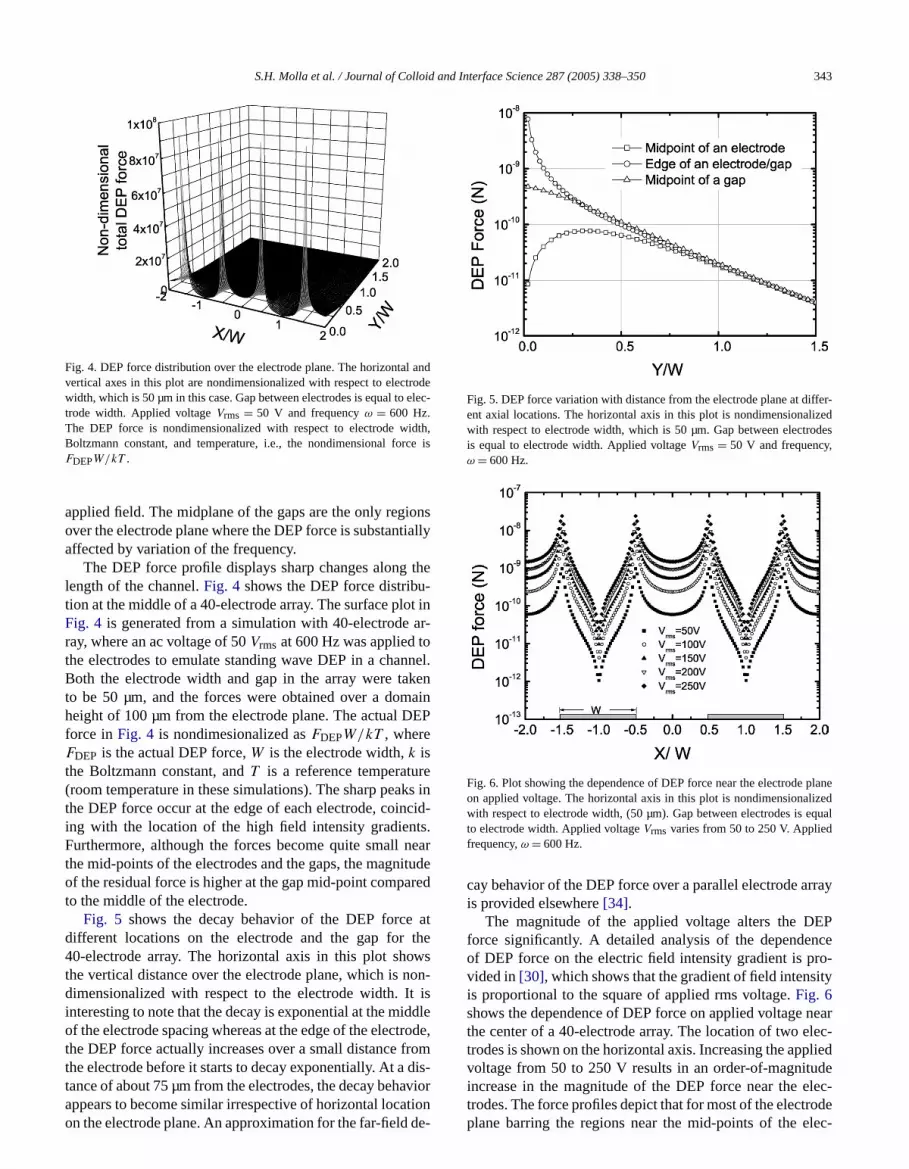
Fig. 4. DEP force distribution over the electrode plane. The horizontalvertical axes in this plot are nondimensionalized with respect to electwidth, which is 50 µm in this case. Gap between electrodes is equal totrode width. Applied voltageVrms = 50 V and frequencyω = 600 Hz.The DEP force is nondimensionalized with respect to electrode wBoltzmann constant, and temperature, i.e., the nondimensional forFDEPW/kT .
applied field. The midplane of the gaps are the only regiover the electrode plane where the DEP force is substanaffected by variation of the frequency.
The DEP force profile displays sharp changes alonglength of the channel.Fig. 4 shows the DEP force distribution at the middle of a 40-electrode array. The surface ploFig. 4 is generated from a simulation with 40-electroderay, where an ac voltage of 50Vrms at 600 Hz was applied tthe electrodes to emulate standing wave DEP in a chanBoth the electrode width and gap in the array were tato be 50 µm, and the forces were obtained over a domheight of 100 µm from the electrode plane. The actual Dforce inFig. 4 is nondimesionalized asFDEPW/kT , whereFDEP is the actual DEP force,W is the electrode width,k isthe Boltzmann constant, andT is a reference temperatu(room temperature in these simulations). The sharp peathe DEP force occur at the edge of each electrode, coining with the location of the high field intensity gradienFurthermore, although the forces become quite smallthe mid-points of the electrodes and the gaps, the magnof the residual force is higher at the gap mid-point compato the middle of the electrode.
Fig. 5 shows the decay behavior of the DEP forcedifferent locations on the electrode and the gap for40-electrode array. The horizontal axis in this plot shothe vertical distance over the electrode plane, which is ndimensionalized with respect to the electrode width. Iinteresting to note that the decay is exponential at the miof the electrode spacing whereas at the edge of the electthe DEP force actually increases over a small distance fthe electrode before it starts to decay exponentially. At a
tance of about 75 µm from the electrodes, the decay behavioappears to become similar irrespective of horizontal locationon the electrode plane. An approximation for the far-field de-
Interface Science 287 (2005) 338–350 343
.
,
Fig. 5. DEP force variation with distance from the electrode plane at dient axial locations. The horizontal axis in this plot is nondimensionalwith respect to electrode width, which is 50 µm. Gap between electris equal to electrode width. Applied voltageVrms = 50 V and frequencyω = 600 Hz.
Fig. 6. Plot showing the dependence of DEP force near the electrodeon applied voltage. The horizontal axis in this plot is nondimensionalwith respect to electrode width, (50 µm). Gap between electrodes isto electrode width. Applied voltageVrms varies from 50 to 250 V. Appliedfrequency,ω = 600 Hz.
cay behavior of the DEP force over a parallel electrode ais provided elsewhere[34].
The magnitude of the applied voltage alters the Dforce significantly. A detailed analysis of the dependeof DEP force on the electric field intensity gradient is pvided in[30], which shows that the gradient of field intensis proportional to the square of applied rms voltage.Fig. 6shows the dependence of DEP force on applied voltagethe center of a 40-electrode array. The location of two etrodes is shown on the horizontal axis. Increasing the appvoltage from 50 to 250 V results in an order-of-magnitu
rincrease in the magnitude of the DEP force near the elec-trodes. The force profiles depict that for most of the electrodeplane barring the regions near the mid-points of the elec-
and
w-tiallyd inyertly,the
for-llelthesus-ideayanton-
es on inheh asus-
rag
pe,the
ita-m.
canthe
rce,
-ntalthech,
par-the
delac-the
red,per-rm
ity
city
hece
m-Theep-
iththellelle-rsof
he
dic-
rossbolictiononaller
oner thetheaxi-blyifiedim-tomtra-id
344 S.H. Molla et al. / Journal of Colloid
trodes, the DEP forces typically range from 10 pN (piconetons) to 10 nN (nanonewtons). These forces are substanlarge compared to typical electrokinetic forces observeDC electrokinetics, namely, the electrostatic double-laforces, which usually range from 1 to 10 pN. Consequena colloidal size droplet can migrate more rapidly underinfluence of AC dielectrophoretic forces.
4. Trajectory analysis for parallel flow geometry
In this section, we present the general mathematicalmulation for evaluating droplet trajectories during a paraflow in presence of different normal forces acting ondroplet. In this analysis, the species of interest in thepension, namely, the water droplets, are modeled asspherical particles and are assumed to be neutrally buoThe droplets are sparsely distributed in the flow and are ninteracting. Consequently, we assume constant propertithe droplets and neglect any droplet–droplet interactiothe bulk medium arising from local modifications of telectrical field distribution. The physical parameters sucviscosity and bulk density are taken to be that of the spending medium.
When moving in a fluid, a droplet experiences a dforcef u, whereu is the particle velocity andf is the frictionfactor [35]. The friction factor is related to the size, shaand surface characteristics of the droplet. Compared todielectrophoretic forces, the effect of Brownian and gravtional forces is insignificant for particles greater than 1 µAssuming micron-sized droplets for the simulations, wesafely neglect Brownian motion and gravity effects onsuspended droplets and we can obtain its velocity,u, by bal-ancing the Stokes drag force and the dielectrophoretic fo
FDEP= 6πµau,
(9)u = FDEP/6πµa,
wherea is the droplet radius andµ is the viscosity of suspending medium. The velocity components in the horizoand vertical directions can be evaluated by consideringdielectrophoretic forces in those directions. This approahowever, does not provide sufficient details about theticle trajectories very close to the channel walls, sincehydrodynamic interactions are not considered in Eq.(9).Consequently, we employ a more rigorous trajectory mothat accounts for the hydrodynamic interactions to trackcurately the trajectories of the droplets as they approachelectrode plane.
4.1. Solvent velocity profiles
Two cases of the trajectory analysis are considenamely, the flow of a suspension between parallel immeable walls and flow in a crossflow system, where unifo
transverse suction is applied to the channel wall represent-ing the membrane. The first case corresponds to a onedimensional flow, while the second case represents a two-
Interface Science 287 (2005) 338–350
l.
f
dimensional flow. In the following, we describe the velocprofiles for these cases.
For an impermeable channel, the axial solvent veloprofile is parabolic and is given by
(10)vx = 3
2V̄x
[2
(y
H
)−
(y
H
)2],
whereH is the height of the midplane of the channel. Ttransverse position,y, varies between the electrode surfaand midplane of the channel and̄Vx is the average flowvelocity in the channel, defined through the Reynolds nuber based on the hydraulic diameter of the channel.Reynolds number for this analysis is restricted to the creing flow regime (Re< 1).
For the two-dimensional crossflow filtration process wuniform wall suction, general analytic expressions forundisturbed fluid flow components in the directions paraand perpendicular to the channel walls were given by Kinstreuer and Paller[36]. For transverse Reynolds numbemuch smaller than unity, appropriately simplified formsthese velocity components are
(11)vx(x,λ) = 3
2V̄x
(1− λ2)
and
(12)vy(λ) = Vw
4
(−λ3 + 3λ + 2),
respectively. Hereλ is a dimensionless distance from tpermeable wall defined as (1−y/H ) wherey is the distancefrom the membrane surface to the center of a drop andH isthe height of the midplane of the channel as shown inFig. 1.V̄x is the average crossflow velocity inside the channeltated by emulsion flow rate andVw is the uniform suctionvelocity at the bottom wall of the channel. The average cflow velocity at the channel entrance is same as the paraflow used in case of the impermeable wall. The wall suceffect diminishes far away from the wall. The wall suctiin these simulations is several orders of magnitude smthan the average crossflow velocity as indicated inTable 1.
4.2. Trajectory equations
Since the effect of dielectrophoretic force fades out asmoves away from the electrode plane, the droplets neaelectrode-bearing wall (which is also permeable whenelectrodes are on the membrane) will experience the mmum attractive force. This effective region is considerasmall compared to the channel height but can be modby manipulation of the electrical forces. Therefore, the sulations were focused on a narrow region near the botwall of the channel (similar to the thickness of a concention boundary layer). The velocity of the droplets in the fluflow can be defined as[37]
-u‖ = f3v‖ = f3vx = ux,
(13)u⊥ = f1f2v⊥ = f1f2vy = uy,
d and
a-ly.
ice-
ated
n inund
s-micly-an
elyhell
termtheter-ons)ounnotfol-
seat a
s
thecor-erch
k tonu-
tvalutedledThewall
tiveletsim-
the
act-achath
sionossolicldsan-s inµm
olt-e
Theodere-
age,
S.H. Molla et al. / Journal of Colloi
with u‖ and u⊥ being the velocity components of a wter drop in the axial and vertical directions, respectiveThe termsf1, f2, f3, f4 are the universal hydrodynamcorrection factors to account for the modification of vlocity of drops near the planar surface and are calculbased on nondimensional separation distance,h/a, whereh is surface-to-surface separation distance as showFig. 1c. Tabulated values for these factors can be fofrom [38].
Neglecting gravity and colloidal interactions, the supended drops are subjected to only the hydrodynaforce and the deterministic dielectrophoretic force. Apping Newton’s second law of motion for each drop, we cexpress the equation of motion as
(14)mdui
dt=
∑Fi,
wherei corresponds to the two principal directions, namx and y, andm is the mass of each suspended drop. Tright-hand side of Eq.(14) represents the summation of athe forces acting on each drop inside the channel. Thisincludes the fluid drag and the dielectrophoretic force ondrop. Other forces (for instance gravity, van der Waals inactions, and for charged droplets, electrostatic interactican be appropriately added to the right hand side to accfor different considerations. Assuming that the drops doaccelerate and balancing the forces, we can derive thelowing trajectory equations for each drop[37,38]:
(15)dx
dt= f3vx + Fdep,x
6πµa,
(16)dy
dt= f1f2vy + Fdep,y
6πµa.
Here,Fdep,x and Fdep,y represent the axial and transvercomponents of the dielectrophoretic force on the dropgiven location over the electrode plane. The factor 6πµa isthe Stokes–Einstein drag coefficient on a drop of radiua,similar to Eq.(9). We note that Eqs.(15) and (16), in contrastto Eq. (9), consider the hydrodynamic retardation nearwall depending on the magnitudes of the hydrodynamicrection functions. Solving the above two ODEs with propinitial conditions provides the complete trajectory for eadrop inside the channel up to the point where they sticthe electrode-bearing wall. To prevent divergence of themerical calculations at contact (h = 0), the point of contacbetween the droplet and the membrane was assigned aof 0.159 nm. The simulation methodology was implemenusing Matlab® ODE solvers. The step sizes were controlto ensure accuracy and convergence of the solution.model described here is applicable to both impermeable
and permeable wall dielectrophoresis, and provides a facilemeans of comparing the droplet trajectories in presence andabsence of wall suction.
Interface Science 287 (2005) 338–350 345
t
e
5. Droplet migration in an impermeable wall channel
In this section, we explore the scope of using the posiDEP effect to attract and capture micrometer-sized dropsuspended in a flowing suspension inside a channel withpermeable walls. As outlined in the previous section,droplet velocity can be calculated by balancing thex andy components of the DEP force and hydrodynamic draging on each droplet. The time required for a droplet to rethe electrode plane can be calculated by following the pof each droplet from the time of its release.
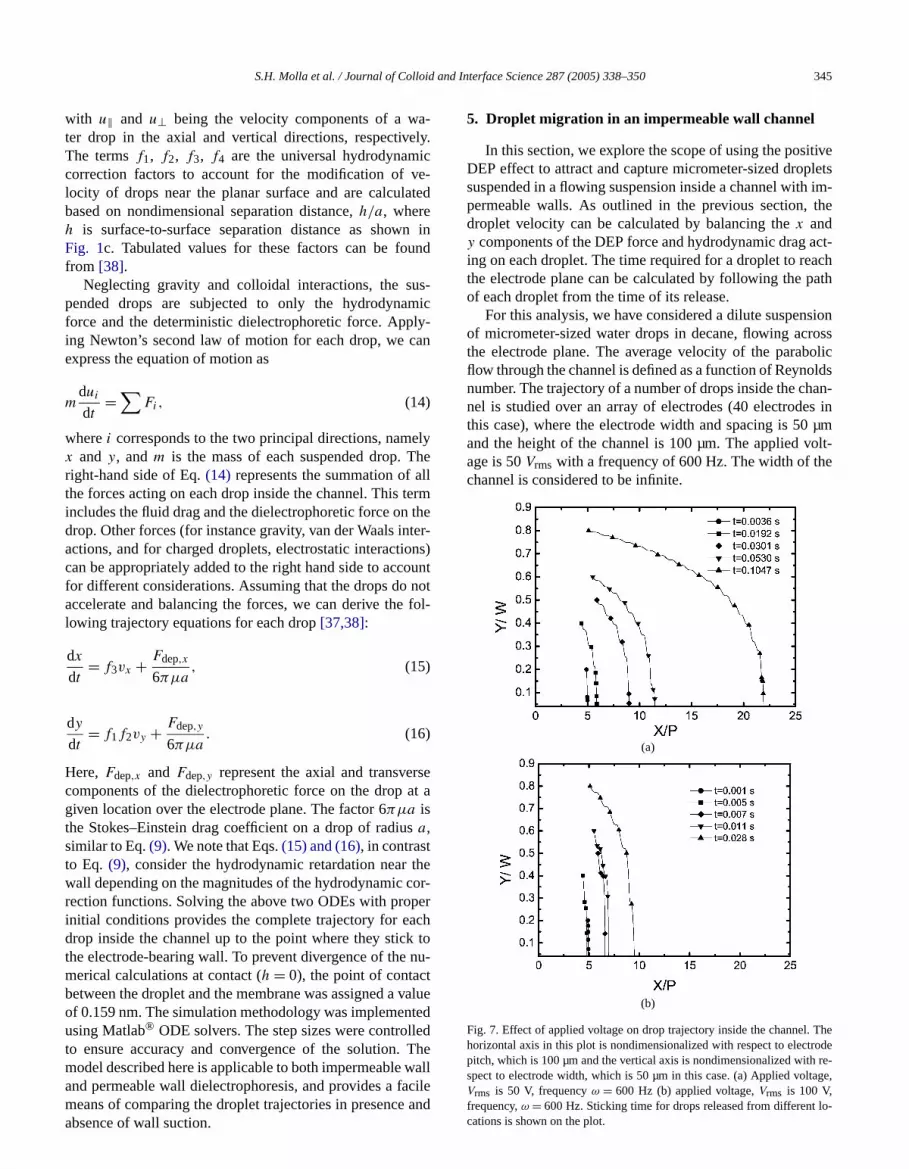
For this analysis, we have considered a dilute suspenof micrometer-sized water drops in decane, flowing acrthe electrode plane. The average velocity of the parabflow through the channel is defined as a function of Reynonumber. The trajectory of a number of drops inside the chnel is studied over an array of electrodes (40 electrodethis case), where the electrode width and spacing is 50and the height of the channel is 100 µm. The applied vage is 50Vrms with a frequency of 600 Hz. The width of thchannel is considered to be infinite.
(a)
(b)
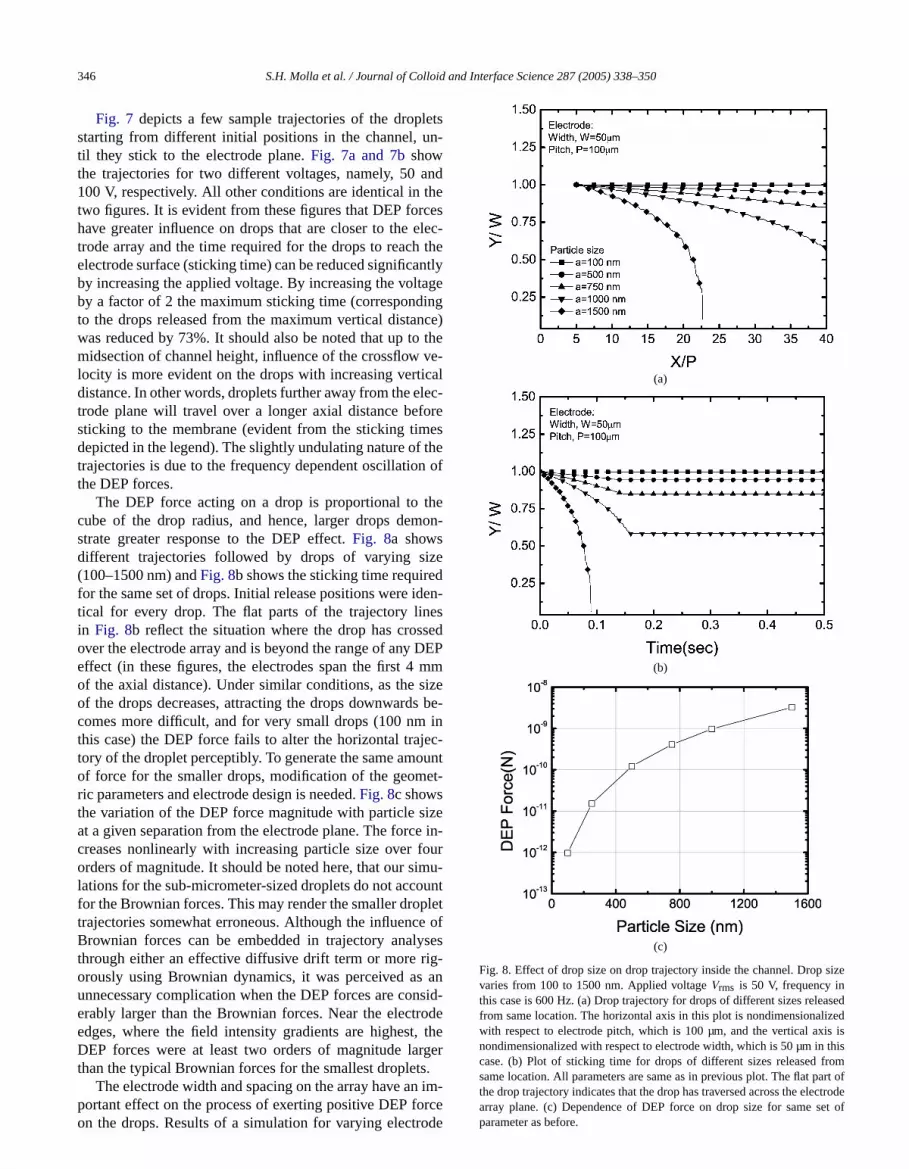
Fig. 7. Effect of applied voltage on drop trajectory inside the channel.horizontal axis in this plot is nondimensionalized with respect to electrpitch, which is 100 µm and the vertical axis is nondimensionalized withspect to electrode width, which is 50 µm in this case. (a) Applied volt
Vrms is 50 V, frequencyω = 600 Hz (b) applied voltage,Vrms is 100 V,frequency,ω = 600 Hz. Sticking time for drops released from different lo-cations is shown on the plot.
and
etsn-
ndheceselec
thentlyageingce)the
ve-callec-oreesthen of
theon-
zeden-
essedDEPmmize
s bein
jec-ountet-
izee in-ourmu-unt
plete ofses
g-ansid
ode, therger.
346 S.H. Molla et al. / Journal of Colloid
Fig. 7 depicts a few sample trajectories of the droplstarting from different initial positions in the channel, util they stick to the electrode plane.Fig. 7a and 7bshowthe trajectories for two different voltages, namely, 50 a100 V, respectively. All other conditions are identical in ttwo figures. It is evident from these figures that DEP forhave greater influence on drops that are closer to thetrode array and the time required for the drops to reachelectrode surface (sticking time) can be reduced significaby increasing the applied voltage. By increasing the voltby a factor of 2 the maximum sticking time (correspondto the drops released from the maximum vertical distanwas reduced by 73%. It should also be noted that up tomidsection of channel height, influence of the crossflowlocity is more evident on the drops with increasing vertidistance. In other words, droplets further away from the etrode plane will travel over a longer axial distance befsticking to the membrane (evident from the sticking timdepicted in the legend). The slightly undulating nature oftrajectories is due to the frequency dependent oscillatiothe DEP forces.
The DEP force acting on a drop is proportional tocube of the drop radius, and hence, larger drops demstrate greater response to the DEP effect.Fig. 8a showsdifferent trajectories followed by drops of varying si(100–1500 nm) andFig. 8b shows the sticking time requirefor the same set of drops. Initial release positions were idtical for every drop. The flat parts of the trajectory linin Fig. 8b reflect the situation where the drop has crosover the electrode array and is beyond the range of anyeffect (in these figures, the electrodes span the first 4of the axial distance). Under similar conditions, as the sof the drops decreases, attracting the drops downwardcomes more difficult, and for very small drops (100 nmthis case) the DEP force fails to alter the horizontal tratory of the droplet perceptibly. To generate the same amof force for the smaller drops, modification of the geomric parameters and electrode design is needed.Fig. 8c showsthe variation of the DEP force magnitude with particle sat a given separation from the electrode plane. The forccreases nonlinearly with increasing particle size over forders of magnitude. It should be noted here, that our silations for the sub-micrometer-sized droplets do not accofor the Brownian forces. This may render the smaller drotrajectories somewhat erroneous. Although the influencBrownian forces can be embedded in trajectory analythrough either an effective diffusive drift term or more riorously using Brownian dynamics, it was perceived asunnecessary complication when the DEP forces are conerably larger than the Brownian forces. Near the electredges, where the field intensity gradients are highestDEP forces were at least two orders of magnitude lathan the typical Brownian forces for the smallest droplets
The electrode width and spacing on the array have an im-portant effect on the process of exerting positive DEP forceon the drops. Results of a simulation for varying electrode
Interface Science 287 (2005) 338–350
-
-
-
(a)
(b)
(c)
Fig. 8. Effect of drop size on drop trajectory inside the channel. Drop sizevaries from 100 to 1500 nm. Applied voltageVrms is 50 V, frequency inthis case is 600 Hz. (a) Drop trajectory for drops of different sizes releasedfrom same location. The horizontal axis in this plot is nondimensionalizedwith respect to electrode pitch, which is 100 µm, and the vertical axis isnondimensionalized with respect to electrode width, which is 50 µm in thiscase. (b) Plot of sticking time for drops of different sizes released fromsame location. All parameters are same as in previous plot. The flat part of
the drop trajectory indicates that the drop has traversed across the electrodearray plane. (c) Dependence of DEP force on drop size for same set ofparameter as before.
d and
liedrti-ch is
ienttheries, therge
gapthe
ereof
husphe-or abothge.
d-ivedra-
romper-cesrosslatethe
tantionni-e.,us tdi-
tem.ffect
tageers
ere-se.
e sothe
m-tra-ld
encere-eythency
henncee di-ne
ropm-hanlets
ithane.letserss-
uidn
S.H. Molla et al. / Journal of Colloi
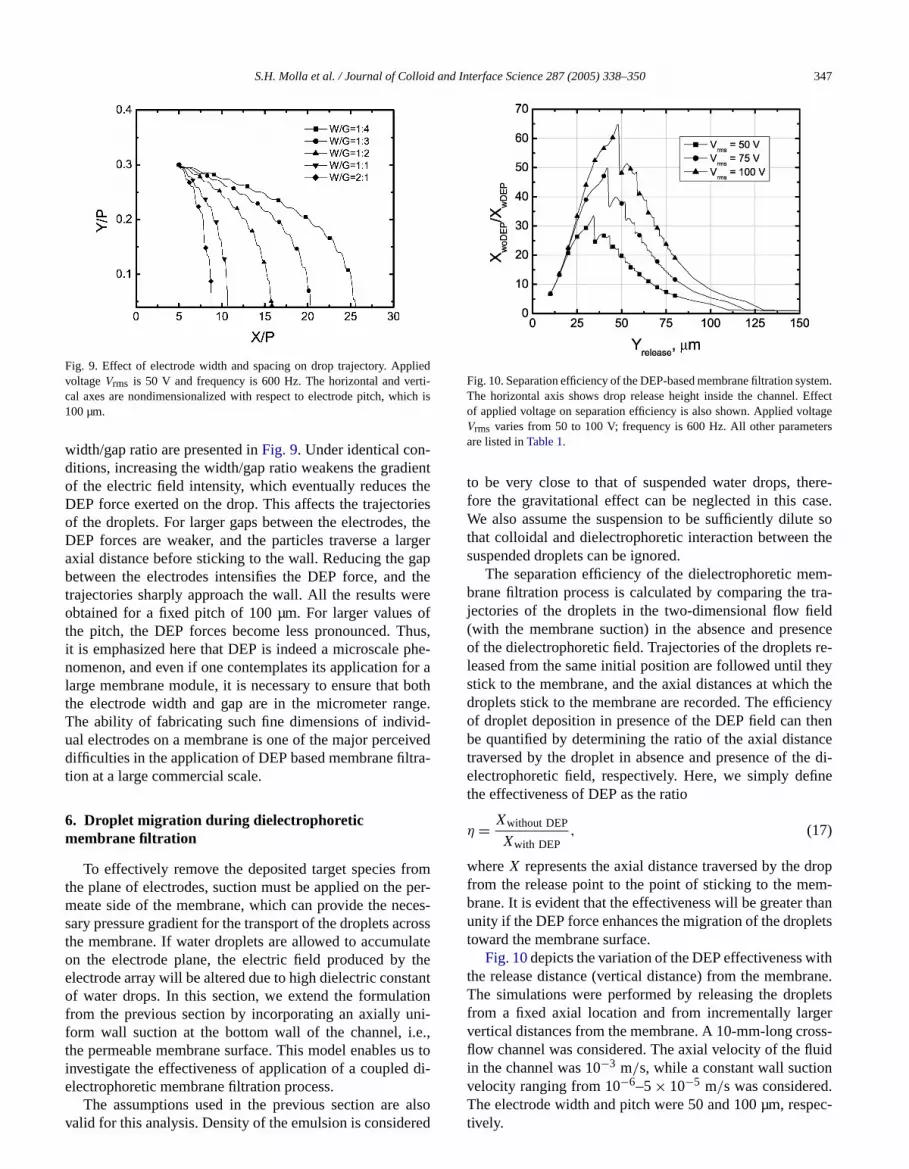
Fig. 9. Effect of electrode width and spacing on drop trajectory. AppvoltageVrms is 50 V and frequency is 600 Hz. The horizontal and vecal axes are nondimensionalized with respect to electrode pitch, whi100 µm.
width/gap ratio are presented inFig. 9. Under identical con-ditions, increasing the width/gap ratio weakens the gradof the electric field intensity, which eventually reducesDEP force exerted on the drop. This affects the trajectoof the droplets. For larger gaps between the electrodesDEP forces are weaker, and the particles traverse a laaxial distance before sticking to the wall. Reducing thebetween the electrodes intensifies the DEP force, andtrajectories sharply approach the wall. All the results wobtained for a fixed pitch of 100 µm. For larger valuesthe pitch, the DEP forces become less pronounced. Tit is emphasized here that DEP is indeed a microscalenomenon, and even if one contemplates its application flarge membrane module, it is necessary to ensure thatthe electrode width and gap are in the micrometer ranThe ability of fabricating such fine dimensions of indiviual electrodes on a membrane is one of the major percedifficulties in the application of DEP based membrane filttion at a large commercial scale.
6. Droplet migration during dielectrophoreticmembrane filtration
To effectively remove the deposited target species fthe plane of electrodes, suction must be applied on themeate side of the membrane, which can provide the nesary pressure gradient for the transport of the droplets acthe membrane. If water droplets are allowed to accumuon the electrode plane, the electric field produced byelectrode array will be altered due to high dielectric consof water drops. In this section, we extend the formulatfrom the previous section by incorporating an axially uform wall suction at the bottom wall of the channel, i.the permeable membrane surface. This model enablesinvestigate the effectiveness of application of a coupled
electrophoretic membrane filtration process.
The assumptions used in the previous section are alsovalid for this analysis. Density of the emulsion is considered
Interface Science 287 (2005) 338–350 347
r
,
-
o
Fig. 10. Separation efficiency of the DEP-based membrane filtration sysThe horizontal axis shows drop release height inside the channel. Eof applied voltage on separation efficiency is also shown. Applied volVrms varies from 50 to 100 V; frequency is 600 Hz. All other parametare listed inTable 1.
to be very close to that of suspended water drops, thfore the gravitational effect can be neglected in this caWe also assume the suspension to be sufficiently dilutthat colloidal and dielectrophoretic interaction betweensuspended droplets can be ignored.
The separation efficiency of the dielectrophoretic mebrane filtration process is calculated by comparing thejectories of the droplets in the two-dimensional flow fie(with the membrane suction) in the absence and presof the dielectrophoretic field. Trajectories of the dropletsleased from the same initial position are followed until thstick to the membrane, and the axial distances at whichdroplets stick to the membrane are recorded. The efficieof droplet deposition in presence of the DEP field can tbe quantified by determining the ratio of the axial distatraversed by the droplet in absence and presence of thelectrophoretic field, respectively. Here, we simply defithe effectiveness of DEP as the ratio
(17)η = Xwithout DEP
Xwith DEP,
whereX represents the axial distance traversed by the dfrom the release point to the point of sticking to the mebrane. It is evident that the effectiveness will be greater tunity if the DEP force enhances the migration of the droptoward the membrane surface.
Fig. 10depicts the variation of the DEP effectiveness wthe release distance (vertical distance) from the membrThe simulations were performed by releasing the dropfrom a fixed axial location and from incrementally largvertical distances from the membrane. A 10-mm-long croflow channel was considered. The axial velocity of the flin the channel was 10−3 m/s, while a constant wall suctio
−6 −5
velocity ranging from 10 –5× 10 m/s was considered.The electrode width and pitch were 50 and 100 µm, respec-tively.
and
µm.rs
-rce
m thef-
s beater
. Foltep. Thualted
earasetedtsran
leasnot
e torodeis,nseardw-
ge oodeodes o
canp-
in
ormealbil-
vol-ghbed-em-theider-the
loc-ly.f thewiller
ane.are
ond-benesss-fore
m-repre-able
thew-esect-tive
ther-em-cts
daryablerds,
iallyces.mayper-the
etsren-ane.
lec-raneing
ahescess.an ber-
348 S.H. Molla et al. / Journal of Colloid
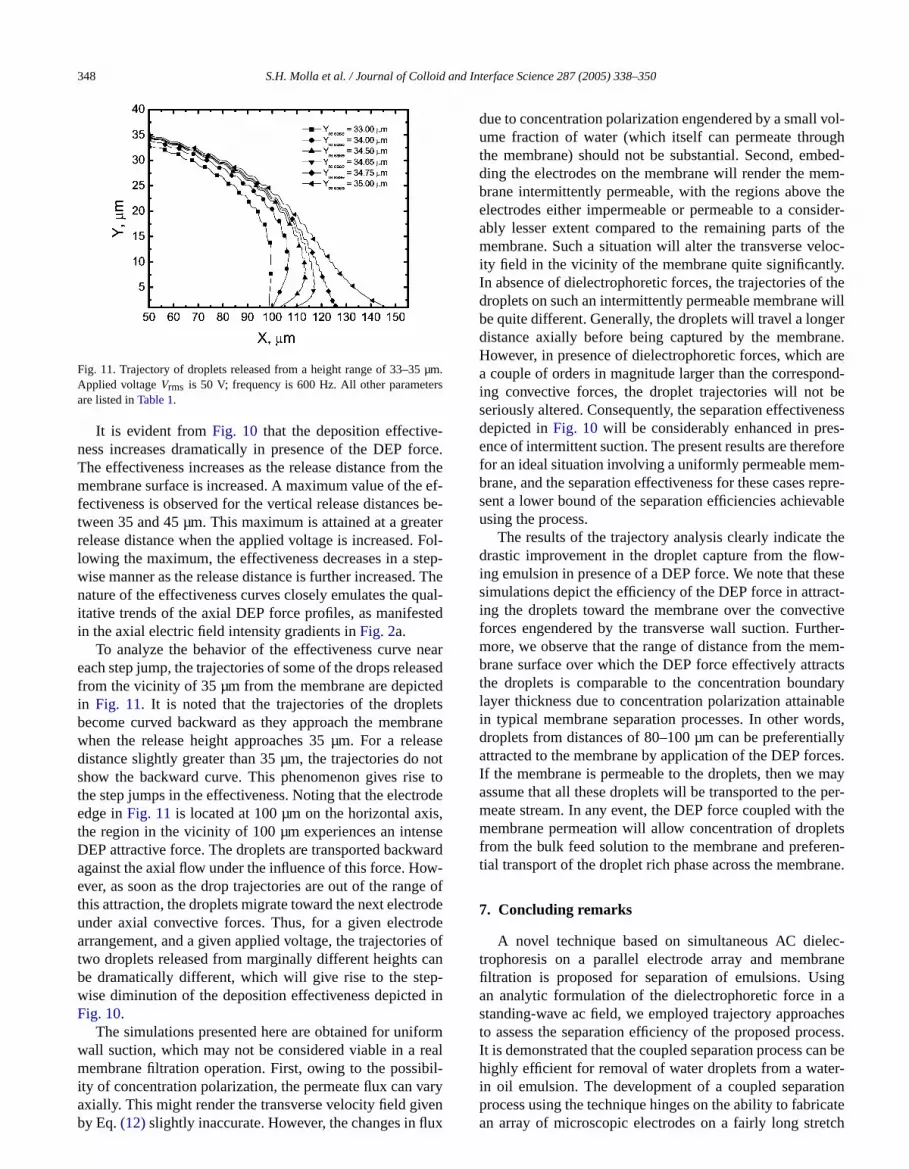
Fig. 11. Trajectory of droplets released from a height range of 33–35Applied voltageVrms is 50 V; frequency is 600 Hz. All other parameteare listed inTable 1.
It is evident fromFig. 10 that the deposition effectiveness increases dramatically in presence of the DEP foThe effectiveness increases as the release distance fromembrane surface is increased. A maximum value of thefectiveness is observed for the vertical release distancetween 35 and 45 µm. This maximum is attained at a grerelease distance when the applied voltage is increasedlowing the maximum, the effectiveness decreases in a swise manner as the release distance is further increasednature of the effectiveness curves closely emulates the qitative trends of the axial DEP force profiles, as manifesin the axial electric field intensity gradients inFig. 2a.
To analyze the behavior of the effectiveness curve neach step jump, the trajectories of some of the drops relefrom the vicinity of 35 µm from the membrane are depicin Fig. 11. It is noted that the trajectories of the droplebecome curved backward as they approach the membwhen the release height approaches 35 µm. For a redistance slightly greater than 35 µm, the trajectories doshow the backward curve. This phenomenon gives risthe step jumps in the effectiveness. Noting that the electedge inFig. 11is located at 100 µm on the horizontal axthe region in the vicinity of 100 µm experiences an inteDEP attractive force. The droplets are transported backwagainst the axial flow under the influence of this force. Hoever, as soon as the drop trajectories are out of the ranthis attraction, the droplets migrate toward the next electrunder axial convective forces. Thus, for a given electrarrangement, and a given applied voltage, the trajectorietwo droplets released from marginally different heightsbe dramatically different, which will give rise to the stewise diminution of the deposition effectiveness depictedFig. 10.
The simulations presented here are obtained for unifwall suction, which may not be considered viable in a rmembrane filtration operation. First, owing to the possi
ity of concentration polarization, the permeate flux can varyaxially. This might render the transverse velocity field givenby Eq.(12)slightly inaccurate. However, the changes in flux
Interface Science 287 (2005) 338–350
.e
-
--e-
d
ee
f
f
due to concentration polarization engendered by a smallume fraction of water (which itself can permeate throuthe membrane) should not be substantial. Second, emding the electrodes on the membrane will render the mbrane intermittently permeable, with the regions aboveelectrodes either impermeable or permeable to a consably lesser extent compared to the remaining parts ofmembrane. Such a situation will alter the transverse veity field in the vicinity of the membrane quite significantIn absence of dielectrophoretic forces, the trajectories odroplets on such an intermittently permeable membranebe quite different. Generally, the droplets will travel a longdistance axially before being captured by the membrHowever, in presence of dielectrophoretic forces, whicha couple of orders in magnitude larger than the corresping convective forces, the droplet trajectories will notseriously altered. Consequently, the separation effectivedepicted inFig. 10 will be considerably enhanced in preence of intermittent suction. The present results are therefor an ideal situation involving a uniformly permeable mebrane, and the separation effectiveness for these casessent a lower bound of the separation efficiencies achievusing the process.
The results of the trajectory analysis clearly indicatedrastic improvement in the droplet capture from the floing emulsion in presence of a DEP force. We note that thsimulations depict the efficiency of the DEP force in attraing the droplets toward the membrane over the convecforces engendered by the transverse wall suction. Furmore, we observe that the range of distance from the mbrane surface over which the DEP force effectively attrathe droplets is comparable to the concentration bounlayer thickness due to concentration polarization attainin typical membrane separation processes. In other wodroplets from distances of 80–100 µm can be preferentattracted to the membrane by application of the DEP forIf the membrane is permeable to the droplets, then weassume that all these droplets will be transported to themeate stream. In any event, the DEP force coupled withmembrane permeation will allow concentration of droplfrom the bulk feed solution to the membrane and prefetial transport of the droplet rich phase across the membr
7. Concluding remarks
A novel technique based on simultaneous AC dietrophoresis on a parallel electrode array and membfiltration is proposed for separation of emulsions. Usan analytic formulation of the dielectrophoretic force instanding-wave ac field, we employed trajectory approacto assess the separation efficiency of the proposed proIt is demonstrated that the coupled separation process chighly efficient for removal of water droplets from a wate
in oil emulsion. The development of a coupled separationprocess using the technique hinges on the ability to fabricatean array of microscopic electrodes on a fairly long stretch
d and
desro-ese
larlyeti-vealex-
ge-adaed.
the
enici-
ionsof
.3)d
S.H. Molla et al. / Journal of Colloi
of a membrane. Although the dimensions of the electrospecified in this study are quite readily attainable in micfabrication processes, the problem lies in embedding thelectrodes on large surfaces of the membrane, particufor commercial polymeric membranes. However, theorcal considerations described in this paper hopefully rea separation potential that is too lucrative to overlook theploitation of this technique.
Acknowledgment
The research is made possible through the Alberta Innuity Fund Establishment Award. Support from the CanResearch Chairs Program is also gratefully acknowledg
Appendix A
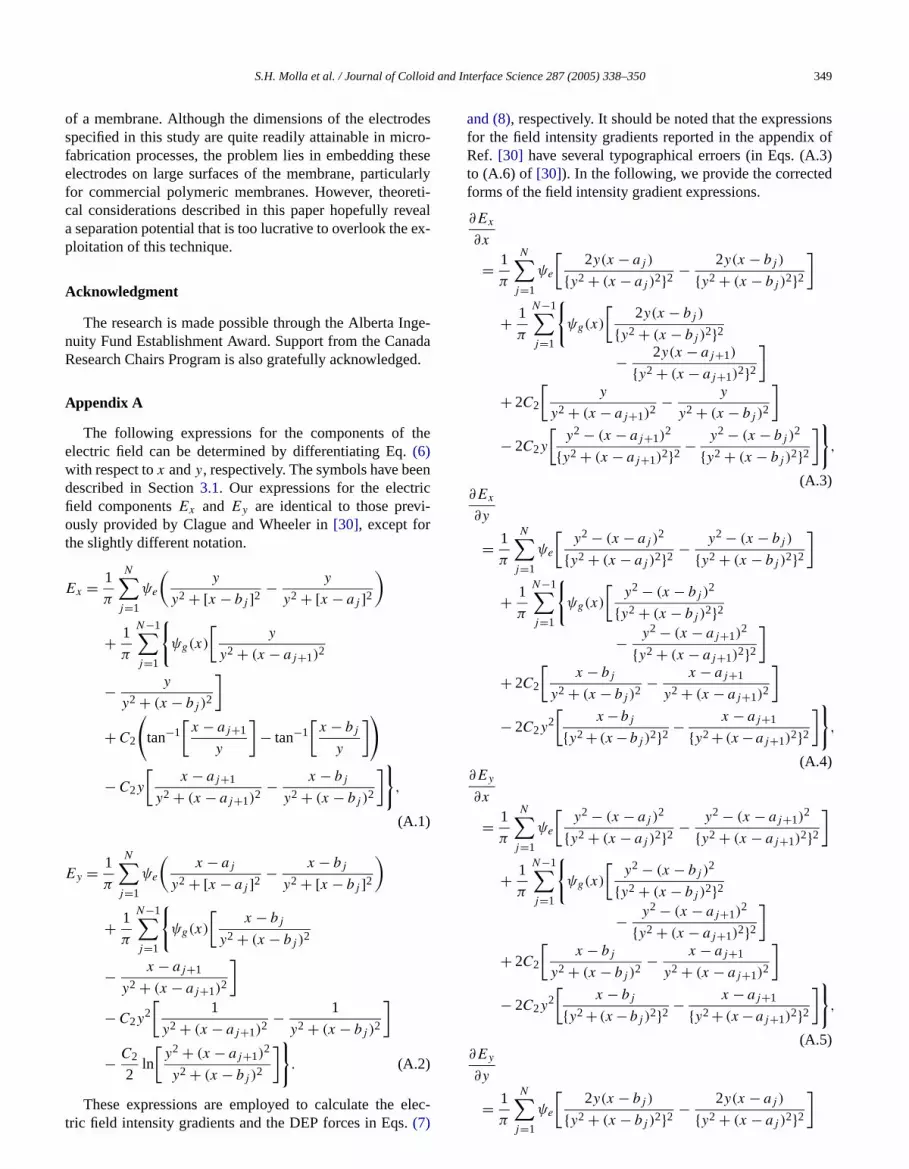
The following expressions for the components ofelectric field can be determined by differentiating Eq.(6)with respect tox andy, respectively. The symbols have bedescribed in Section3.1. Our expressions for the electrfield componentsEx and Ey are identical to those prevously provided by Clague and Wheeler in[30], except forthe slightly different notation.
Ex = 1
π
N∑j=1
ψe
(y
y2 + [x − bj ]2 − y
y2 + [x − aj ]2)
+ 1
π
N−1∑j=1
{ψg(x)
[y
y2 + (x − aj+1)2
− y
y2 + (x − bj )2
]
+ C2
(tan−1
[x − aj+1
y
]− tan−1
[x − bj
y
])
(A.1)
− C2y
[x − aj+1
y2 + (x − aj+1)2− x − bj
y2 + (x − bj )2
]},
Ey = 1
π
N∑j=1
ψe
(x − aj
y2 + [x − aj ]2 − x − bj
y2 + [x − bj ]2)
+ 1
π
N−1∑j=1
{ψg(x)
[x − bj
y2 + (x − bj )2
− x − aj+1
y2 + (x − aj+1)2
]
− C2y2[
1
y2 + (x − aj+1)2− 1
y2 + (x − bj )2
]
(A.2)− C2
2ln
[y2 + (x − aj+1)
2
y2 + (x − bj )2
]}.
These expressions are employed to calculate the electric field intensity gradients and the DEP forces in Eqs.(7)
Interface Science 287 (2005) 338–350 349
and (8), respectively. It should be noted that the expressfor the field intensity gradients reported in the appendixRef. [30] have several typographical erroers (in Eqs. (Ato (A.6) of [30]). In the following, we provide the correcteforms of the field intensity gradient expressions.
∂Ex
∂x
= 1
π
N∑j=1
ψe
[2y(x − aj )
{y2 + (x − aj )2}2− 2y(x − bj )
{y2 + (x − bj )2}2
]
+ 1
π
N−1∑j=1
{ψg(x)
[2y(x − bj )
{y2 + (x − bj )2}2
− 2y(x − aj+1)
{y2 + (x − aj+1)2}2
]
+ 2C2
[y
y2 + (x − aj+1)2− y
y2 + (x − bj )2
]
(A.3)
− 2C2y
[y2 − (x − aj+1)
2
{y2 + (x − aj+1)2}2− y2 − (x − bj )
2
{y2 + (x − bj )2}2
]},
∂Ex
∂y
= 1
π
N∑j=1
ψe
[y2 − (x − aj )
2
{y2 + (x − aj )2}2− y2 − (x − bj )
{y2 + (x − bj )2}2
]
+ 1
π
N−1∑j=1
{ψg(x)
[y2 − (x − bj )
2
{y2 + (x − bj )2}2
− y2 − (x − aj+1)2
{y2 + (x − aj+1)2}2
]
+ 2C2
[x − bj
y2 + (x − bj )2− x − aj+1
y2 + (x − aj+1)2
]
(A.4)
− 2C2y2[
x −bj
{y2 + (x −bj )2}2− x − aj+1
{y2 + (x −aj+1)2}2
]},
∂Ey
∂x
= 1
π
N∑j=1
ψe
[y2 − (x − aj )
2
{y2 + (x − aj )2}2− y2 − (x − aj+1)
2
{y2 + (x − aj+1)2}2
]
+ 1
π
N−1∑j=1
{ψg(x)
[y2 − (x − bj )
2
{y2 + (x − bj )2}2
− y2 − (x − aj+1)2
{y2 + (x − aj+1)2}2
]
+ 2C2
[x − bj
y2 + (x − bj )2− x − aj+1
y2 + (x − aj+1)2
]
(A.5)
− 2C2y2[
x − bj
{y2 + (x −bj )2}2− x − aj+1
{y2 + (x −aj+1)2}2
]},
∂Ey
∂y
- = 1
π
N∑j=1
ψe
[2y(x − bj )
{y2 + (x − bj )2}2− 2y(x − aj )
{y2 + (x − aj )2}2
]
and
is
dis-
on
ium
3.
pl.
00)
02)
re-
997)
nal.
nd.
el.
do,
.C.
cta
zel,
ans.
.C.
ys.
03)
84
.H.
19
x-01.
ge,
ress,
. D
ker,
si-ion,
nds
350 S.H. Molla et al. / Journal of Colloid
+ 1
π
N−1∑j=1
{ψg(x)
[2y(x − aj+1)
{y2 + (x − aj+1)2}2
− 2y(x − bj )
{y2 + (x − bj )2}2
]
− 2C2
[y(x − aj+1)
2
y2 + (x − aj+1)2− y(x − bj )
2
y2 + (x − bj )2
]
(A.6)− C2y
[1
y2 + (x −aj+1)2− 1
y2 + (x −bj )2
]}.
Appendix B. Nomenclature
a drop radius (m)aj , bj distance of leading and trailing edge ofj th elec-
trode (m)d half of center to center electrode distance, pitch
2d (m)E electric field vector (V m−1)Ex , Ey electric field components inx andy direction, re-
spectively (V m−1)fi universal hydrodynamic correction factorsF force magnitudes (N)FDEP dielectrophoretic force (N)G spacing between two consecutive electrodesh surface to surface separation distance (m)H Half channel heightk Boltzmann constant (1.38× 10⁻²³ JK−1)K Clausius–Mossotti factorm mass of each dropP pitch of the electrode array, i.e, center-to-center
tance of two consecutive electrodesu drop velocity (m s−1)vx , vy undisturbed fluid flow components inx andy di-
rection, respectively (m s−1)V0 applied rms voltage (volts)Vw uniform suction velocity at the bottom wall (m s−1)V̄x average crossflow velocity in horizontal directi
(m s−1)W electrode width
Greek symbols
εp, εm relative permittivity of droplet or surrounding medη separation efficiency of the systemλ dimensionless distance from bottom wallµ viscosity of the suspending medium (N s m−2)σ electrical conductivity (S m−1)ψ electric potential (V)ω frequency of applied voltage (Hz)
References
[1] N.G. Green, H. Morgan, J. Phys. D Appl. Phys. 30 (1997) L41.
[2] H. Morgan, N.G. Green, J. Electrostat. 42 (1997) 279.[3] N.G. Green, H. Morgan, J. Phys. D Appl. Phys. 31 (1998) L25.[4] H. Morgan, M.P. Hughes, N.G. Green, Biophys. J. 77 (1999) 516.
Interface Science 287 (2005) 338–350
[5] A.D. Dussaud, B. Khusid, A. Acrivos, J. Appl. Phys. 88 (2000) 546[6] P.R.C. Gascoyne, J. Vykoukal, Electrophoresis 23 (2002) 1973.[7] R. Pethig, Y. Huang, X.B. Wang, J.P.H. Burt, J. Phys. D Ap
Phys. 25 (1992) 881.[8] N.G. Green, A. Ramos, H. Morgan, J. Phys. D Appl. Phys. 33 (20
[21] X.B. Wang, J. Yang, Y. Huang, J. Vykoukal, F.F. Becker, P.RGascoyne, Anal. Chem. 72 (2000) 832.
[22] M.P. Hughes, H. Morgan, F.J. Rixon, Eur. Biophys. J. BiophLett. 30 (2001) 268.
[23] J. Suehiro, D. Noutomi, M. Shutou, M. Hara, J. Electrostat. 58 (20229.
[24] J.S. Eow, M. Ghadiri, A.O. Sharif, T.J. Williams, Chem. Eng. J.(2001) 173.
[25] M. Shapiro, A.L. Shalom, I.J. Lin, J. Appl. Phys. 58 (1985) 1028.[26] L. Cui, H. Morgan, J. Micromech. Microeng. 10 (2000) 72.[27] Y. Huang, J.M. Yang, P.J. Hopkins, S. Kassegne, M. Tirado, A
Forster, H. Reese, Biomed. Microdev. 5 (2003) 217.[28] Y. Xu, T. Dabros, H. Hamza, W. Shelfantook, Pet. Sci. Technol.
(1999) 1051.[29] D. Wallace, B. Kadatz, R. Tipman, S. Snaychuk, in: CONRAD E
traction Fundamentals and Process Affected Water Workshop, 20[30] D.S. Clague, E.K. Wheeler, Phys. Rev. E 6402 (2001).[31] H.A. Pohl, Dielectrophoresis, Cambridge Univ. Press, Cambrid
UK, 1978.[32] T.B. Jones, Electromechanics of Particles, Cambridge Univ. P
Cambridge, UK, 1995.[33] X.B. Wang, Y. Huang, J.P.H. Burt, G.H. Markx, R. Pethig, J. Phys
Appl. Phys. 26 (1993) 1278.[34] N.G. Green, A. Ramos, H. Morgan, J. Electrostat. 56 (2002) 235.[35] P.C. Hiemenz, Principles of Colloid and Surface Chemistry, Dek
New York, 1986.[36] C. Kleinstreuer, M.S. Paller, AIChE J. 29 (1983) 1563.[37] M. Elimelech, X. Jia, J. Gregory, R. Williams, Particle Depo
tion and Aggregation: Measurement, Modelling and SimulatButterworth–Heinemann, 1995.
[38] J. Masliyah, Electrokinetic Transport Phenomena, Alberta Oil SaTechnology and Research Authority, 1994.
Further reading
[39] P.E. Eaton, AIChE Spring Conference, Houston, Texas, Peper 61c,2000.