PLEASE SCROLL DOWN FOR ARTICLE This article was downloaded by: [De Campeneere, Sam] On: 1 April 2010 Access details: Access Details: [subscription number 920647912] Publisher Taylor & Francis Informa Ltd Registered in England and Wales Registered Number: 1072954 Registered office: Mortimer House, 37- 41 Mortimer Street, London W1T 3JH, UK Archives of Animal Nutrition Publication details, including instructions for authors and subscription information: http://www.informaworld.com/smpp/title~content=t713453455 Reducing nitrogen excretion and soybean meal use by feeding a lower rumen degradable protein balance and protected soybean meal to dairy cattle Sam De Campeneere a ; Johan L. De Boever a ; José M. Vanacker a ;Daniël L. De Brabander a a Institute for Agricultural and Fisheries Research (ILVO), Animal Sciences Unit, Belgium Online publication date: 31 March 2010 To cite this Article De Campeneere, Sam , De Boever, Johan L. , Vanacker, José M. andDe Brabander, Daniël L.(2010) 'Reducing nitrogen excretion and soybean meal use by feeding a lower rumen degradable protein balance and protected soybean meal to dairy cattle', Archives of Animal Nutrition, 64: 2, 85 — 97 To link to this Article: DOI: 10.1080/17450391003625011 URL: http://dx.doi.org/10.1080/17450391003625011 Full terms and conditions of use: http://www.informaworld.com/terms-and-conditions-of-access.pdf This article may be used for research, teaching and private study purposes. Any substantial or systematic reproduction, re-distribution, re-selling, loan or sub-licensing, systematic supply or distribution in any form to anyone is expressly forbidden. The publisher does not give any warranty express or implied or make any representation that the contents will be complete or accurate or up to date. The accuracy of any instructions, formulae and drug doses should be independently verified with primary sources. The publisher shall not be liable for any loss, actions, claims, proceedings, demand or costs or damages whatsoever or howsoever caused arising directly or indirectly in connection with or arising out of the use of this material.
Transcript
PLEASE SCROLL DOWN FOR ARTICLE
This article was downloaded by: [De Campeneere, Sam]On: 1 April 2010Access details: Access Details: [subscription number 920647912]Publisher Taylor & FrancisInforma Ltd Registered in England and Wales Registered Number: 1072954 Registered office: Mortimer House, 37-41 Mortimer Street, London W1T 3JH, UK
Archives of Animal NutritionPublication details, including instructions for authors and subscription information:http://www.informaworld.com/smpp/title~content=t713453455
Reducing nitrogen excretion and soybean meal use by feeding a lowerrumen degradable protein balance and protected soybean meal to dairycattleSam De Campeneere a; Johan L. De Boever a; José M. Vanacker a;Daniël L. De Brabander a
a Institute for Agricultural and Fisheries Research (ILVO), Animal Sciences Unit, Belgium
Online publication date: 31 March 2010
To cite this Article De Campeneere, Sam , De Boever, Johan L. , Vanacker, José M. andDe Brabander, Daniël L.(2010)'Reducing nitrogen excretion and soybean meal use by feeding a lower rumen degradable protein balance and protectedsoybean meal to dairy cattle', Archives of Animal Nutrition, 64: 2, 85 — 97To link to this Article: DOI: 10.1080/17450391003625011URL: http://dx.doi.org/10.1080/17450391003625011
Full terms and conditions of use: http://www.informaworld.com/terms-and-conditions-of-access.pdf
This article may be used for research, teaching and private study purposes. Any substantial orsystematic reproduction, re-distribution, re-selling, loan or sub-licensing, systematic supply ordistribution in any form to anyone is expressly forbidden.
The publisher does not give any warranty express or implied or make any representation that the contentswill be complete or accurate or up to date. The accuracy of any instructions, formulae and drug dosesshould be independently verified with primary sources. The publisher shall not be liable for any loss,actions, claims, proceedings, demand or costs or damages whatsoever or howsoever caused arising directlyor indirectly in connection with or arising out of the use of this material.
Reducing nitrogen excretion and soybean meal use by feeding a lower
rumen degradable protein balance and protected soybean meal to
dairy cattle
Sam De Campeneere*, Johan L. De Boever, Jose M. Vanacker andDaniel L. De Brabander
Institute for Agricultural and Fisheries Research (ILVO), Animal Sciences Unit, Belgium
(Received 6 May 2009; accepted 18 November 2009)
To reduce N pollution by dairy cows, two levels of rumen degradable proteinbalance (RDPB) and the use of protected protein sources were studied in twofeeding trials. Trial 1 investigated if the effect of lowering the RDPB, at a constantDPI (digestible protein in the intestine) supply, could be compensated by usingprotected protein sources (formaldehyde treated (¼ formolated) soybean meal(FSBM) or a combination of FSBM and formolated rapeseed meal at a ratio of60:40). Trial 2 studied if FSBM is as effective as soybean meal (SBM) at a lowRDPB level. Each trial was set up as a Latin square design, with three treatmentsand three periods, involving 18 lactating Holstein cows. Reducing RDPB fromabout 150 g/d to below 740 g/d resulted in small negative effects on the milkproduction, independent of the protein source (protected or not). However, Nexcretion per kg fat and protein corrected milk (FPCM) and N efficiency wereboth improved. At a low RDPB level, the performance of FSBM (35.0 kg FPCM)was no better than after feeding a combination of FSBM and formolatedrapeseed meal (34.7 kg FPCM). The use of FSBM (32.8 kg FPCM and 34.2% Nefficiency) was as effective as SBM (32.5 kg FPCM and 34.2% N efficiency). Assuch, SBM use can approximately be halved by using FSBM, possibly incombination with locally produced rapeseed meal.
Rumen studies with cows fed normal rations twice daily show a considerable peakammonia concentration 1–2 h after feeding (on average 27 mg NH3-N/dl), butseldom do the levels drop too low in the course of the day (De Boever et al. 2005).The surplus ammonia is absorbed and after conversion to urea in the liver, the mainpart is excreted in the urine, which can potentially cause pollution. As farmers fear aprotein shortage more than a surplus in the course of the day, they formulate rationswith a relatively large positive safety margin in rumen degradable protein balance(RDPB), which leads to substantial NH3 surpluses in the rumen and increased Nexcretion. To avoid this, dairy rations should be formulated to produce a morelevelled rumen ammonia curve, with a lower peak post-feeding, but with sufficient
Downloaded By: [De Campeneere, Sam] At: 11:34 1 April 2010
ammonia throughout the day. Decreasing the peak concentration could be achievedby decreasing the RDPB of the diets, while protected protein sources could be usedto maintain a certain level throughout the rest of the day. We have studied the effectof protected protein sources on the ammonia profile and cellulolytic activity in therumen, on the microbial protein synthesis, and on the N balance (De Campeneereet al. 2009). Protected protein sources were not successful in flattening the ammoniacurve or in improving N-efficiency. The former study involved too few animals toproperly study the effects on performance. Therefore, two feeding trials wereperformed to study the effect of decreasing the RDPB and the use of formaldehydetreated (formolated) protein sources on dairy cow performances and nitrogenbalance. This paper describes the results of those studies.
Compared with soybean meal (SBM), the protected SBM contains much moreDPI (digestible protein in the intestine). This means that DPI requirements can bemet with far lower quantities of SBM, which is mostly imported from abroad. Theuse of protected SBM might help to significantly reduce the use of SBM andconsequently reduce its imports.
The objectives of these trials were to evaluate if a decrease in RDPB can becompensated by feeding rumen protected SBM and to evaluate if the total amount ofSBM fed to dairy cattle can be reduced.
2. Materials and methods
2.1. Diets
Trial 1 investigated if the effect of lowering the RDPB, at a constant DPI supply,could be compensated by using protected protein sources (formolated SBM(¼ FSBM)) or a combination of FSBM and formolated rapeseed meal (FSR)).Treatments involved following groups: Group HS1 (high RDPB with SBM asprotein source), Group LFS1 and LFSR1 (both with a low RDPB and withFSBM or FSR as protein source, respectively). Trial 2 was set up to study if theFSBM is as effective as SBM at a low RDPB level. Treatments involved: GroupHS2 – high RDPB with SBM as protein source; Groups LS2 and LFS2 – bothwith a low RDPB and with SBM or FSBM as protein source, respectively.
All treatments used the same type of roughage: maize silage, pre-wilted grasssilage and ensiled pressed sugar beet pulp, mixed on DM basis in a ratio of55/30/15 and 55/20/25 for Trial 1 and Trial 2, respectively. The maize silage andpre-wilted grass silage for Trials 1 and 2 had a different origin, while the pressedbeet pulp originated from the same silage. For all treatments, roughage was fed adlibitum at 08:15 h and 15:30 h. Concentrates were fed at 05:00 h and 19:00 h.Concentrate supply for all treatments was calculated per cow at the start of thetrial, based on ad libitum roughage intake supplemented with concentrates to cover105% of the animal requirements for net energy (van Es 1978) and digestibleprotein in the intestine (Tamminga et al. 1994). This was realised by combining oneor more concentrates differing in protein content (high, moderate and low)with the protein sources involved in each treatment (SBM, FSBM and FSR). ForFSR, the FSBM (commercial name: Rumi-S, Schouten Products, The Netherlands)and the formolated rapeseed meal (commercial name: Mervobest-R, Pre-Mervo,The Netherlands) were mixed in a ratio of 60:40. We chose these products basedon our results from a previous extensive screening test, in which both products
86 S. De Campeneere et al.
Downloaded By: [De Campeneere, Sam] At: 11:34 1 April 2010
performed well in the intestinal digestibility of the undegradable protein (DeBoever et al. 2009, personal communication): 98.1 and 98.5% for FSBM and FSR,respectively. The concentrate with high protein content was more like a proteinsource, with SBM (67%), coconut expeller (16.8%), beet molasses (7%), fat (2%),chalk (1.8%), salt (1.5%), feed phosphate (1.2%), trace elements (1%), ligninsulfonate (1%) and MgO (0.7%) as ingredients. The concentrate with mediumprotein content consisted of dehydrated sugar beet pulp (30%), coconut expeller(15%), maize (11.5%), SBM (11%), maize gluten feed (10%), beet molasses (7%),rapeseed meal (5%), wheat (5%), fat (1%), feed phosphate (1%), trace elements(1%), lignin sulfonate (1%), salt (0.6%), chalk (0.4%) and MgO (0.5%). Theconcentrate with low protein content was composed of dehydrated sugar beet pulp(32%), coconut expeller (17.2%), maize gluten feed (13.8%), maize (13%), beetmolasses (7.9%), rapeseed meal (5%), wheat (5.6%), fat (1%), feed phosphate(1.0%), trace elements (1%), lignin sulfonate (1%), salt (0.6%), MgO (0.5%) andchalk (0.4%) as ingredients. Apart from the proportion of SBM, these concentratesdo not differ much in composition. To supply the planned RDPB level, urea (460 gN/kg urea) was given with the roughage.
To account for the decreasing milk production in the course of the trial, dailyconcentrate quantity was decreased according to a pre-planned scheme (minus 300 gconcentrate each week, except for cows in first lactation: 150 g/week).
2.2. Experimental design
Both trials were a 3 6 3 Latin square arrangement, comparing three treatments inthree periods. Each period lasted four weeks, with the first two weeks for adaptationto the diet and the last two weeks as the experimental period.
At the beginning of Trial 1, one primiparous and 17 multiparous Holstein-Friesian cows, yielding between 31 and 47 kg milk per day, were divided into threesimilar groups of six cows. At the beginning of Trial 2, the same was done with fourprimiparous and 14 multiparous Holstein-Friesian cows, yielding between 28 and45 kg milk per day. At the start of each of both trials, the 18 cows were assigned toone of the three groups with the aim of creating group averages as comparable aspossible for the following parameters: parity, milk production, fat and proteincontent of the milk, body weight, and days in milk. At the beginning of the trial,these parameters were, on average for the three groups, 2.7th lactation, 36 kg milk,44.0 g fat and 32.1 g protein per kg, 584 kg BW and 147 days in milk for Trial 1, and2.6th lactation, 35 kg milk, 39.7 g fat and 33.0 g protein per kg, 623 kg BW, and 174days in milk for Trial 2, with little variation between groups. Each group wasallocated to one of the three treatments in each period. All animals were housedindividually in a tie-stall with rubber bedding, separate mangers and continuousaccess to water.
2.3. Measurements and sampling
All feed administered was weighed individually. Refusals (roughage) from each cowwere weighed on the last day of each week and, if more than 2 kg (only in a fewcases), analysed for DM and crude protein concentration. From these analyses, thecomposition of the refusals was estimated and intake was corrected accordingly.
Archives of Animal Nutrition 87
Downloaded By: [De Campeneere, Sam] At: 11:34 1 April 2010
Cows were weighed on two consecutive days at the beginning of the first trial periodand at the end of each trial period. Milk yield was recorded at each milking and milkfrom the last four milkings of the last two weeks of each period was sampled foranalysis.
During the trial, maize silage, pressed beet pulp, protein sources and concentrateswere sampled once weekly, while pre-wilted grass silage was sampled twice weekly.The samples of the roughages were pooled per period, the samples of theconcentrates and protein sources were pooled per trial and all samples were furtheranalysed for nutrient composition.
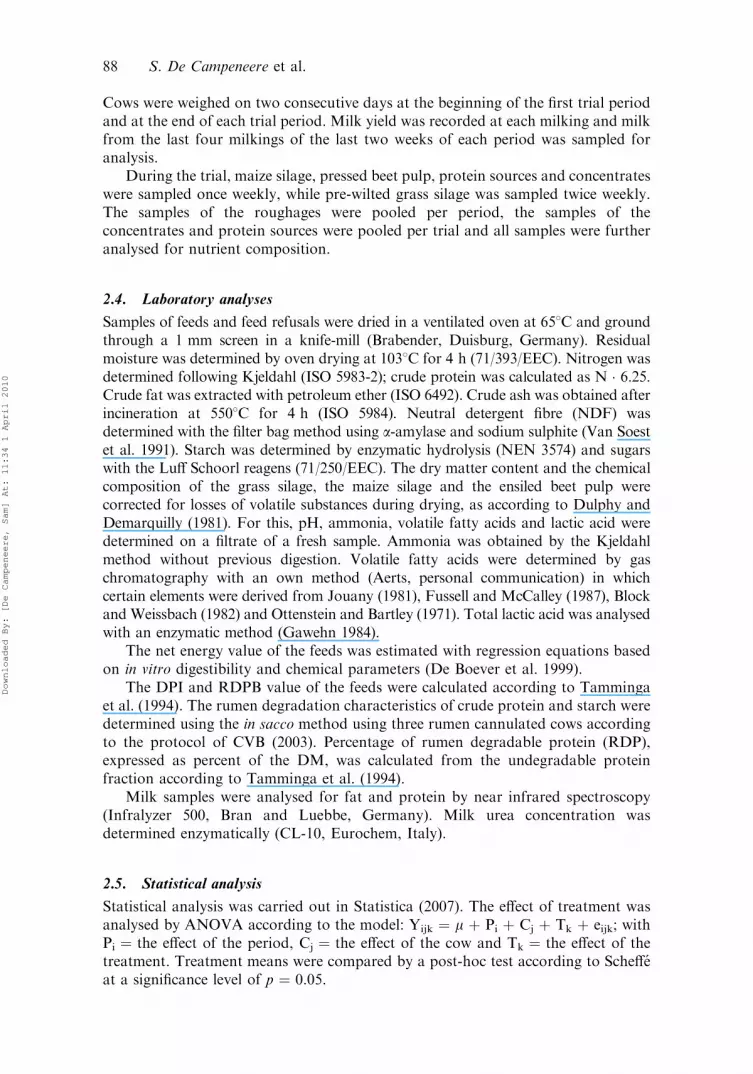
2.4. Laboratory analyses
Samples of feeds and feed refusals were dried in a ventilated oven at 658C and groundthrough a 1 mm screen in a knife-mill (Brabender, Duisburg, Germany). Residualmoisture was determined by oven drying at 1038C for 4 h (71/393/EEC). Nitrogen wasdetermined following Kjeldahl (ISO 5983-2); crude protein was calculated as N � 6.25.Crude fat was extracted with petroleum ether (ISO 6492). Crude ash was obtained afterincineration at 5508C for 4 h (ISO 5984). Neutral detergent fibre (NDF) wasdetermined with the filter bag method using a-amylase and sodium sulphite (Van Soestet al. 1991). Starch was determined by enzymatic hydrolysis (NEN 3574) and sugarswith the Luff Schoorl reagens (71/250/EEC). The dry matter content and the chemicalcomposition of the grass silage, the maize silage and the ensiled beet pulp werecorrected for losses of volatile substances during drying, as according to Dulphy andDemarquilly (1981). For this, pH, ammonia, volatile fatty acids and lactic acid weredetermined on a filtrate of a fresh sample. Ammonia was obtained by the Kjeldahlmethod without previous digestion. Volatile fatty acids were determined by gaschromatography with an own method (Aerts, personal communication) in whichcertain elements were derived from Jouany (1981), Fussell and McCalley (1987), Blockand Weissbach (1982) and Ottenstein and Bartley (1971). Total lactic acid was analysedwith an enzymatic method (Gawehn 1984).
The net energy value of the feeds was estimated with regression equations basedon in vitro digestibility and chemical parameters (De Boever et al. 1999).
The DPI and RDPB value of the feeds were calculated according to Tammingaet al. (1994). The rumen degradation characteristics of crude protein and starch weredetermined using the in sacco method using three rumen cannulated cows accordingto the protocol of CVB (2003). Percentage of rumen degradable protein (RDP),expressed as percent of the DM, was calculated from the undegradable proteinfraction according to Tamminga et al. (1994).
Milk samples were analysed for fat and protein by near infrared spectroscopy(Infralyzer 500, Bran and Luebbe, Germany). Milk urea concentration wasdetermined enzymatically (CL-10, Eurochem, Italy).
2.5. Statistical analysis
Statistical analysis was carried out in Statistica (2007). The effect of treatment wasanalysed by ANOVA according to the model: Yijk ¼ m þ Pi þ Cj þ Tk þ eijk; withPi ¼ the effect of the period, Cj ¼ the effect of the cow and Tk ¼ the effect of thetreatment. Treatment means were compared by a post-hoc test according to Scheffeat a significance level of p ¼ 0.05.
88 S. De Campeneere et al.
Downloaded By: [De Campeneere, Sam] At: 11:34 1 April 2010
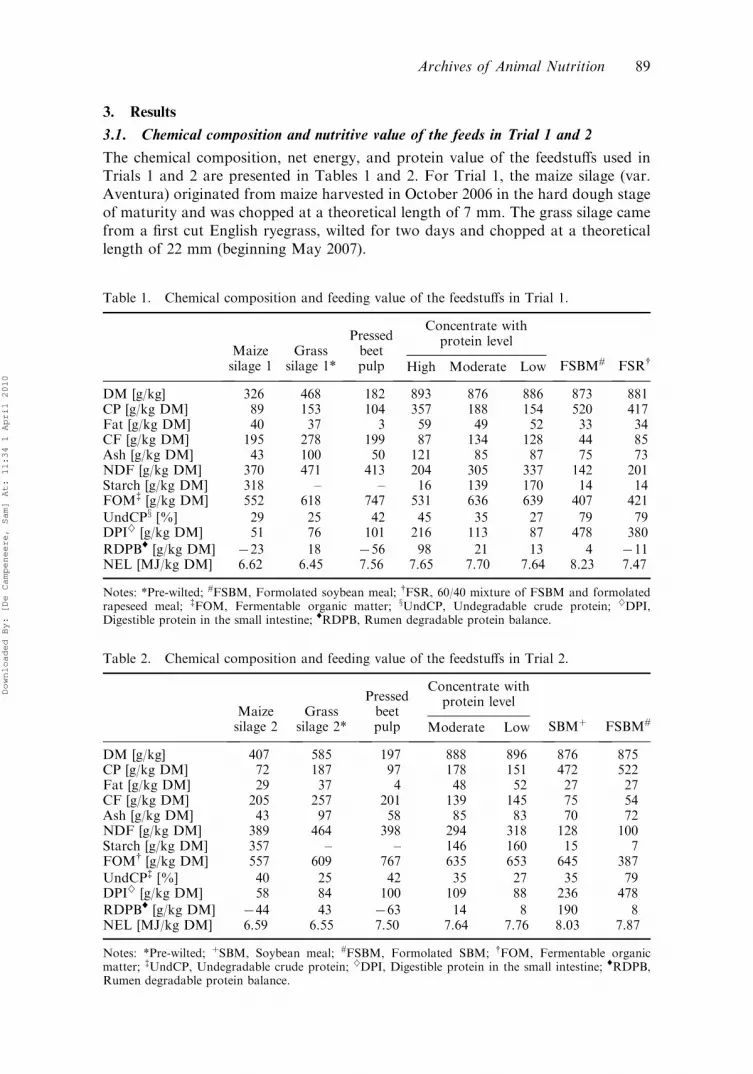
3.1. Chemical composition and nutritive value of the feeds in Trial 1 and 2
The chemical composition, net energy, and protein value of the feedstuffs used inTrials 1 and 2 are presented in Tables 1 and 2. For Trial 1, the maize silage (var.Aventura) originated from maize harvested in October 2006 in the hard dough stageof maturity and was chopped at a theoretical length of 7 mm. The grass silage camefrom a first cut English ryegrass, wilted for two days and chopped at a theoreticallength of 22 mm (beginning May 2007).
Table 1. Chemical composition and feeding value of the feedstuffs in Trial 1.
Notes: *Pre-wilted; #FSBM, Formolated soybean meal; {FSR, 60/40 mixture of FSBM and formolatedrapeseed meal; {FOM, Fermentable organic matter; xUndCP, Undegradable crude protein; }DPI,Digestible protein in the small intestine; 'RDPB, Rumen degradable protein balance.
Table 2. Chemical composition and feeding value of the feedstuffs in Trial 2.
Notes: *Pre-wilted; þSBM, Soybean meal; #FSBM, Formolated SBM; {FOM, Fermentable organicmatter; {UndCP, Undegradable crude protein; }DPI, Digestible protein in the small intestine; 'RDPB,Rumen degradable protein balance.
Archives of Animal Nutrition 89
Downloaded By: [De Campeneere, Sam] At: 11:34 1 April 2010
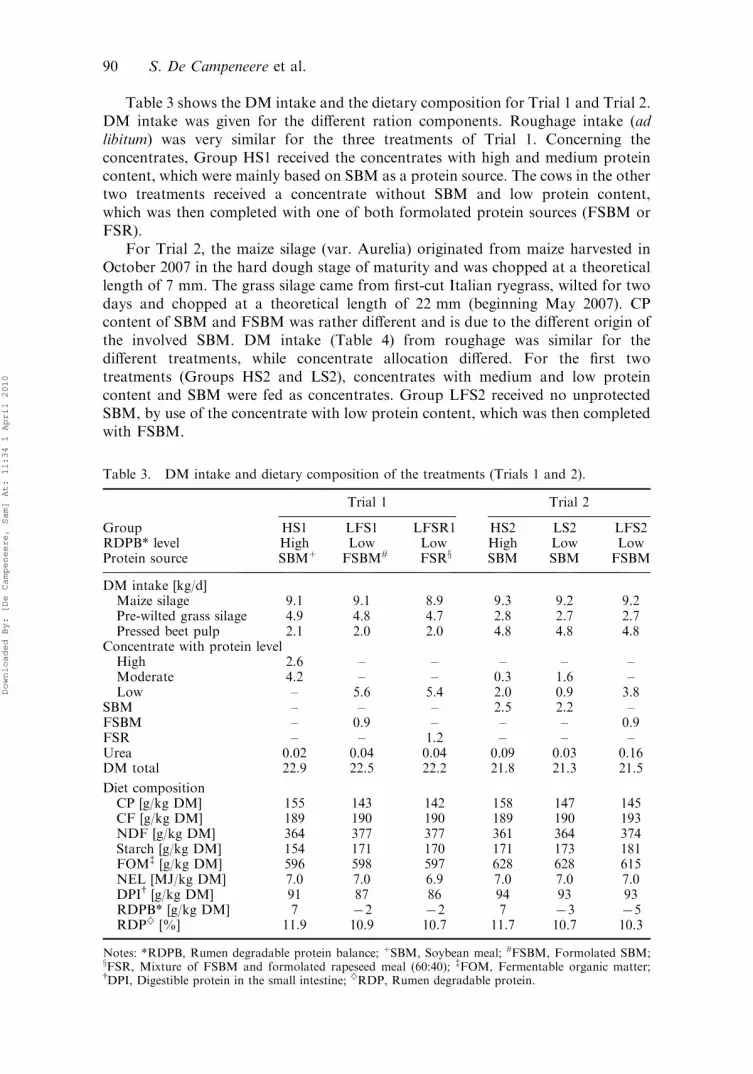
Table 3 shows the DM intake and the dietary composition for Trial 1 and Trial 2.DM intake was given for the different ration components. Roughage intake (adlibitum) was very similar for the three treatments of Trial 1. Concerning theconcentrates, Group HS1 received the concentrates with high and medium proteincontent, which were mainly based on SBM as a protein source. The cows in the othertwo treatments received a concentrate without SBM and low protein content,which was then completed with one of both formolated protein sources (FSBM orFSR).
For Trial 2, the maize silage (var. Aurelia) originated from maize harvested inOctober 2007 in the hard dough stage of maturity and was chopped at a theoreticallength of 7 mm. The grass silage came from first-cut Italian ryegrass, wilted for twodays and chopped at a theoretical length of 22 mm (beginning May 2007). CPcontent of SBM and FSBM was rather different and is due to the different origin ofthe involved SBM. DM intake (Table 4) from roughage was similar for thedifferent treatments, while concentrate allocation differed. For the first twotreatments (Groups HS2 and LS2), concentrates with medium and low proteincontent and SBM were fed as concentrates. Group LFS2 received no unprotectedSBM, by use of the concentrate with low protein content, which was then completedwith FSBM.
Table 3. DM intake and dietary composition of the treatments (Trials 1 and 2).
Notes: *RDPB, Rumen degradable protein balance; þSBM, Soybean meal; #FSBM, Formolated SBM;xFSR, Mixture of FSBM and formolated rapeseed meal (60:40); {FOM, Fermentable organic matter;{DPI, Digestible protein in the small intestine; }RDP, Rumen degradable protein.
90 S. De Campeneere et al.
Downloaded By: [De Campeneere, Sam] At: 11:34 1 April 2010
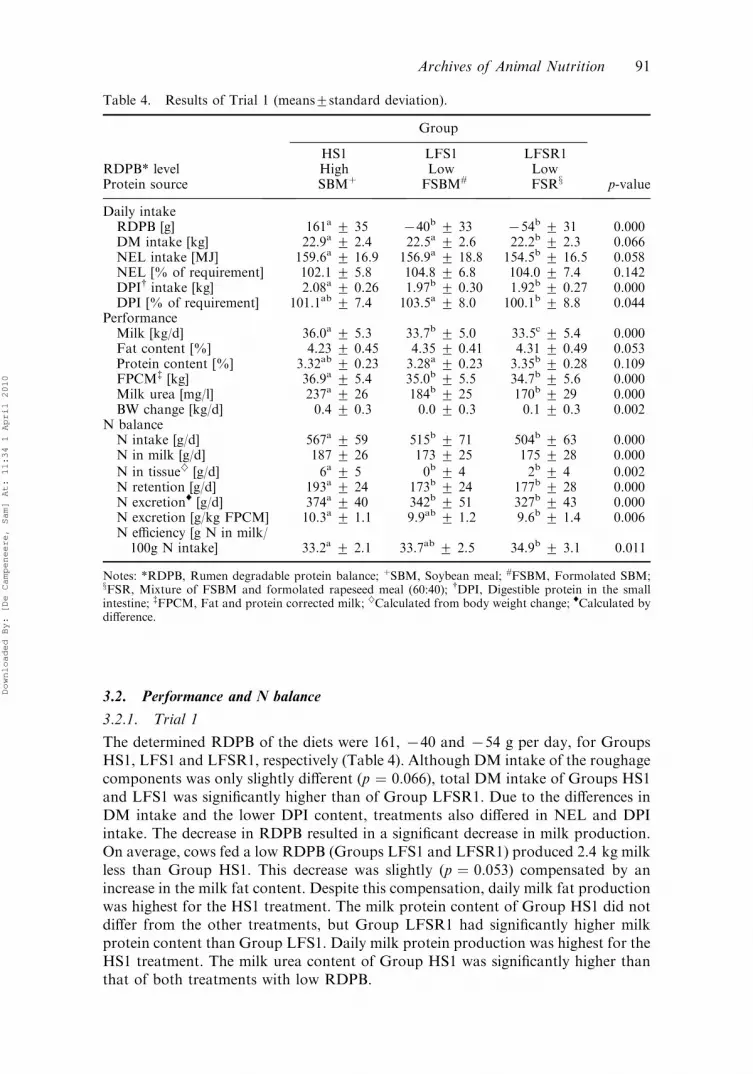
3.2. Performance and N balance
3.2.1. Trial 1
The determined RDPB of the diets were 161, 740 and 754 g per day, for GroupsHS1, LFS1 and LFSR1, respectively (Table 4). Although DM intake of the roughagecomponents was only slightly different (p ¼ 0.066), total DM intake of Groups HS1and LFS1 was significantly higher than of Group LFSR1. Due to the differences inDM intake and the lower DPI content, treatments also differed in NEL and DPIintake. The decrease in RDPB resulted in a significant decrease in milk production.On average, cows fed a low RDPB (Groups LFS1 and LFSR1) produced 2.4 kg milkless than Group HS1. This decrease was slightly (p ¼ 0.053) compensated by anincrease in the milk fat content. Despite this compensation, daily milk fat productionwas highest for the HS1 treatment. The milk protein content of Group HS1 did notdiffer from the other treatments, but Group LFSR1 had significantly higher milkprotein content than Group LFS1. Daily milk protein production was highest for theHS1 treatment. The milk urea content of Group HS1 was significantly higher thanthat of both treatments with low RDPB.
Table 4. Results of Trial 1 (means+standard deviation).
Notes: *RDPB, Rumen degradable protein balance; þSBM, Soybean meal; #FSBM, Formolated SBM;xFSR, Mixture of FSBM and formolated rapeseed meal (60:40); {DPI, Digestible protein in the smallintestine; {FPCM, Fat and protein corrected milk; }Calculated from body weight change; 'Calculated bydifference.
Archives of Animal Nutrition 91
Downloaded By: [De Campeneere, Sam] At: 11:34 1 April 2010
N intake of Group HS1 was significantly higher, owing to the combination ofthe somewhat lower DM intake and the lower crude protein of Groups LFS1 andLFSR1 (Table 3). Milk N retention was also highest for Group HS1 (higher milkyield), as well as the amount of N retained in tissue. However, when expressedrelatively, N efficiency was higher for both treatments with the low RDPB (onaverage 9.7 vs. 10.3 g per kg fat and protein corrected milk [FPCM]), with thebest N efficiency for Group LFSR1, being 34.9% of N intake retained in themilk.
3.2.2. Trial 2
The determined RDPB of the diets was 150, 760 and 7105 g/d for Groups HS2,LS2 and LFS2, respectively (Table 5). These differences in RDPB did not result insignificant effects on the DM intake, although the DM intake of Group HS2 wassomewhat higher (not significant) than in both low RDPB treatments, as we alsofound in the first trial. NEL and DPI intake did not differ between treatments,neither when expressed absolutely or as a percentage of the requirements. Asignificant effect of the treatments on the milk production was found, but no post-
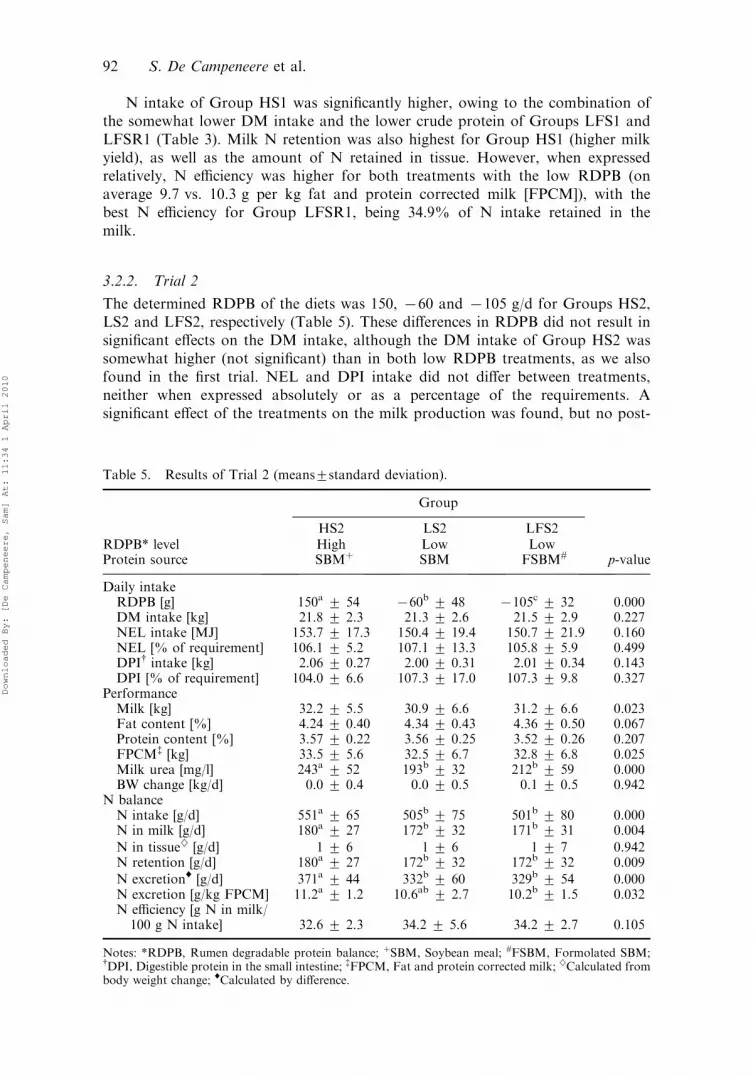
Table 5. Results of Trial 2 (means+standard deviation).
Notes: *RDPB, Rumen degradable protein balance; þSBM, Soybean meal; #FSBM, Formolated SBM;{DPI, Digestible protein in the small intestine; {FPCM, Fat and protein corrected milk; }Calculated frombody weight change; 'Calculated by difference.
92 S. De Campeneere et al.
Downloaded By: [De Campeneere, Sam] At: 11:34 1 April 2010
hoc (Statistica 2009) differences were found between treatments. Compared withGroup HS2, milk production of Groups LS2 and LFS2 was 1.3 and 1.0 kg lower.Although RDPB levels differed somewhat more in this trial, effects on milkproduction were smaller than in Trial 1. But, similar to Trial 1, the milk fatcontent of the treatments with low RDPB tended to increase (p ¼ 0.067) ascompared to Group HS2. As such, daily milk fat production was similar forthe treatments. The milk protein content was not affected, but due to the higherdaily milk production, Group HS2 had the highest daily milk protein production.As such, milk production expressed as FPCM of Group HS2 was 1.0 kg higherthan for Group LS2 and 0.7 higher than for Group LFS2. Milk urea content wasagain strongly determined by the RDPB, with a significant higher value for GroupHS2.
Due to the lower dietary protein content of Groups LS2 and LFS2 (Table 3) theN intake of Group HS2 was significantly higher. N retained in the milk (higher milkproduction) was also highest for Group HS2, as was the amount of N retained(including live weight change). However, when expressed relatively, N retention washigher for both treatments with the low RDPB (on average 10.4 vs. 11.2 g/kgFPCM). N-efficiency for Groups LS2 and LFS2 was similar, being 34.2% of intakeN retained in the milk.
4. Discussion
4.1. Effects on intake and production parameters
Both trials indicate that a decrease in RDPB from values around 150 g/d to valuesbeneath 740 g/d affect milk production and, to a lesser extent, DM intake.Although the difference between the low and high RDPB levels was higher for Trial 2than for Trial 1, effects on DM intake and milk production were more important forTrial 1. These results demonstrate that the protected protein cannot compensate forthe decreased RDPB, as hypothesised.
The decreased milk production in the low RDPB treatments in both trials seemsto have different causes. For Trial 1, the (unplanned) lower DPI content of the lowRDPB diets (87 and 86 vs. 91 g/kg DM) reduced DPI intake (about 100 g/d). ForTrial 1, DPI intake of LFS1 was 5% lower and that of Group LFSR1 was 8% lowerthan that of Group HS1. These reductions can explain the main part of the differencefound in FPCM, being a reduction of 5% for LFS1 and 6% for LFSR1 as comparedto Group HS1. The remaining part is due to the reduced DM intake. For Trial 2,differences in milk production were smaller and were mainly induced by the reducedDM intake (not significant), specifically the decreased roughage intake. Althoughstatistically insignificant, this resulted in relevant differences in NEL and DPI intake.Net energy and DPI intake of Group LS2 was 2 and 3% lower, and that of GroupLFS2 was 2 and 2% lower than that of Group HS2. This largely explains thedifference found in FPCM, being a reduction of 3% for Group LS2 and 2% forGroup LFS2 as compared to Group HS2.
DM intake can be decreased as a result of periodic shortage of RDP, inducing asub-optimal digestion and microbial protein synthesis and a slowing of the passagerate (Faverdin 1999). Ivan et al. (1996) also concluded that the increased supply offeed N into the small intestine from exchanging protein sources with protectedprotein sources was at the expense of decreased bacterial protein synthesis in therumen, probably because of a shortage of RDP in the diet. From Trial 1, one cannot
Archives of Animal Nutrition 93
Downloaded By: [De Campeneere, Sam] At: 11:34 1 April 2010
conclude if the RDPB or the DPI intake is limiting the DM intake. However, in Trial2, exchanging SBM for FSBM resulted in a larger difference in RDPB, but without asignificant effect on the DM intake. The combined results thus indicate that if aRDPB between zero and 7100 g/d induces a shortage of RDP in the rumen, theeffect on the DM-intake remains rather limited and is probably acceptable as acompromise between optimal production and concern for the environment.
Results of Cyriac et al. (2008) indicated from a comparison with four levelsof RDP (11.3, 10.1, 8.8 and 7.6), that DM intake started to be reduced whenRDP was 8.8%. Kalscheur et al. (1997) varied RDP between 6.8 and 11.0%without any effect on the DM intake, but milk yield, fat yield, and protein yieldall increased linearly when cows were fed diets with greater RDP. Kalscheuret al. (1997) concluded that there is an environmental benefit from underfeedingRDP to dairy cows according to National Research Council requirements, butthis happens only at a financial cost to the dairy producer. In our trial, RDP washigher with 11.9%, 10.9% and 10.7% for the treatments of Trial 1 and 11.7%,10.7% and 10.3% for the treatments of Trial 2. National Research Council(NRC 1988) requirements for RDP suggest 10.4% RDP as the minimal dietaryconcentration required for microbial growth in high-producing cows. From ourtreatments, only Group LFS2 had a lower RDP, but for that treatment DMintake was not decreased. Therefore, it is unlikely that RDP or RDPB as suchsignificantly limited the intake in our trial. Reynal and Broderick (2005) foundthat a compromise between profitability and environmental quality is achieved ata dietary level of 11.7% RDP. This value corresponds well with the high RDPBvalues we applied in our study. We found a positive effect on the N efficiencyfrom lowering the RDP further, but with a negative effect on the productionresults.
The second trial gave a direct comparison between unprotected and formalde-hyde treated (formolated) SBM (FSBM) at a rather comparable RDPB level and acomparable DPI intake. Milking performance was similar for both treatments,indicating that SBM input can be reduced by feeding smaller amounts of protectedSBM. Folman et al. (1981) concluded that feeding protected SBM increased theamount of undegraded dietary protein supply at the duodenum, but may reduce thequantity of bacterial protein as a result of the lower rumen ammonia level. WhileCrooker et al. (1983) found milk protein produced by cows fed FSBM was less thanby cows fed untreated SBM during days 22–119 of lactation (103 vs. 97 kg/cow),they could not pinpoint the reason for that difference. Wachira et al. (1974)concluded from a study with cows that no effect was found on milk production fromusing FSBM. As such, several studies have evaluated the effects of formaldehydetreatment of SBM on milk production and composition in the 1970s and 80s withinconsistent results. However, treatment doses of formaldehyde varied widely from0.1% (Mahadevan et al. 1983) to 1.2% (Schmidt et al. 1974). Akif Yoruk et al.(2006) studied the effect of different doses of formaldehyde on SBM on the amountof bypass protein in the rumen and the amino acid absorption from the smallintestine. They concluded that 0.3% and 0.6% formaldehyde treatment enhancedbio-availability of protein in SBM. In Rumi-S, the SBM used in this trial, 0.4%formaldehyde was used for protection.
From our observations, we cannot guarantee that cows in Group HS1 werereceiving enough RDPB for maximal production, but Smits et al. (1995) found thatabove 40 g RDPB/d, no effect on milk production is to be expected.
94 S. De Campeneere et al.
Downloaded By: [De Campeneere, Sam] At: 11:34 1 April 2010
Given that we aimed to reduce the RDPB without decreasing the DPI, N intake wasstrongly related with the RDPB level of the treatments, with significantly reducedvalues for the treatments with a low RDPB. Although this was always incombination with a reduced N retention in the milk (not significant in Trial 1), Nexcretion, as expressed in g per day, was always significantly reduced. In both trials,N excretion [g/kg FPCM] and N efficiency were most favourable for the treatmentswith the lowest RDPB, being each time significantly better than the treatments withthe highest RDPB. At the same time, in both trials milk production was somewhatreduced. This slight reduction in production may be the sacrifice required for moreenvironmental efficiency. In recent years, other researchers also reported thatdecreasing the amount of dietary crude protein while correcting for predictedshortages of limiting amino acids for milk production by including rumenundegradable protein supplements (Castillo et al. 2001; Noftsger and St-Pierre2003) and (or) rumen-protected amino acids (Krober et al. 2000; Noftsger and St-Pierre 2003) in the diet can reduce excretion of N in urine and sustain production ofmilk and milk protein. Rotz et al. (1999) modelled different farm strategies andconcluded that in all scenarios evaluated, there was economic incentive forimproving the efficiency of protein supplementation. Compared to SBM as thesole protein supplement, use of SBM along with a less rumen degradable protein feedreduced volatile N loss by 13–34 kg/ha of cropland.
4.3. Reducing soybean meal use
By using the protected protein sources, we also aimed to reduce the amount of SBMused for milk production. Treatments of Trial 1 received on average 2.52, 1.07 and0.82 kg SBM; the first as unprotected SBM, the latter two as FSBM. This means that68, 30 or 23 g of SBM has to be used for each kg of milk produced, accordingly.Treatments of Trial 2 received on average 2.89, 2.66 and 1.05 kg SBM; the first twoas unprotected SBM, the latter as FSBM. This means 86, 82 and 32 g of SBM has tobe used for each kg of milk produced, accordingly. Results of both trials suggest thatprotection of SBM can as such significantly reduce (approximately by half) theamount of imported SBM without any indication of adverse effects, when applied ata comparable RDPB level (Trial 2), on the performances. The use of local rapeseedmeal can contribute to that by further reducing the need of SBM (Trial 1). Rotz et al.(1999) concluded that using a more expensive but lower RDP supplement along withSBM improved the net return of the farms tested. Indeed, feeding cost of protectedSBM (Rumi-S) is mostly lower per unit of DPI than that of unprotected SBM.
5. Conclusion
Reducing RDPB from about 150 g/d to below 740 g/d was not possible withouthaving some negative effects on the milk production, partly induced by a smalldecrease in DM intake. However, N excretion per kg fat and protein corrected milkand N efficiency were both positively influenced when RDPB was decreased. The useof FSBM instead of SBM could not compensate for that decrease in RDPB. At thelow RDPB level, the use of FSBM was as effective as SBM. From Trial 1, using amixture of FSBM and formolated rapeseed meal as a protein source resulted in
Archives of Animal Nutrition 95
Downloaded By: [De Campeneere, Sam] At: 11:34 1 April 2010
comparable milk fat and protein productions as using FSBM. As such, SBM use canbe approximately halved by using protected protein sources, possibly in combinationwith locally produced rapeseed meal.
Acknowledgements
This research was funded by the Institute for the Promotion of Innovation through Scienceand Technology in Flanders (IWT Vlaanderen) (No. 050681). Thanks to Miriam Levenson forlanguage revision.
References
Akif Yoruk M, Taylan A, Mehmet G, Duran B. 2006. The effect of soybean meal treated withformaldehyde on amount of protected protein in the rumen and absorption of amino acidfrom small intestines. Turkish J Vet Anim Sci. 30:457–463.
Block H-J, Weissbach F. 1982. Zur gaschromatografiphischen Bestimmung fluchtigerFettsauren in Silagen mit innerem Standard. Arch Anim Nutr. 32:693–702.
Castillo AR, Kebreab E, Beever DE, Barbi JH, Sutton JD, Kirby HC, France J. 2001. Theeffect of protein supplementation on nitrogen utilization in lactating dairy cows fed grasssilage diets. J Anim Sci. 79:247–253.
Crooker BA, Clark JH, Shanks RD. 1983. Effects of formaldehyde treated soybean meal onmilk yield, milk composition, and nutrient digestibility in the dairy cow. J Dairy Sci.66:492–504.
CVB. 2003. Protocol voor in situ pensincubatie. Bepaling van afbraaksnelheid en uitwasbarefracties van eiwit, zetmeel, celwanden en organische restfractie. 1–14. Lelystad, TheNetherlands, Centraal Veevoederbureau.
Cyriac J, Rius AG, Mcgilliard ML, Pearson RE, Bequette BJ, Hanigan MD. 2008. Lactationperformance of mid-lactation dairy cows fed ruminally degradable protein at concentra-tions lower than national research council recommendations. J Dairy Sci. 91:4704–4713.
De Boever JL, Cottyn BG, De Brabander DL, Vanacker JM, Boucque CV. 1999. Equations topredict digestibility and energy value of grass silages, maize silages, grass hays, compoundfeeds and raw materials for cattle. Nutr Abstr Rev. 69:835–850.
De Boever JL, Vanacker JM, De Brabander DL. 2005. Dietary parameters affecting rumenammonia level indairycows. In: 30thConferenceof theDutchSpeakingNutritionResearchers.8-4-2005 Merelbeke: Department Animal Nutrition and Husbandry. p. 11–12.
De Campeneere S, De Boever JL, Vanacker JM, Messens W, De Brabander DL. 2009. Feedingmeasures to reduce nitrogen excretion in dairy cattle. Arch Anim Nutr. 63:87–103.
Dulphy JP, Demarquilly C. 1981. Problemes particuliers aux ensilages. Prevision de la valeurnutritive des aliments des ruminants. INRA Editions, Paris 81–104.
Faverdin P. 1999. The effect of nutrients on feed intake in ruminants. Proc Nutr Soc. 58:523–531.
Folman Y, Neumark H, Kaim M, Kaufmann W. 1981. Performance, rumen and bloodmetabolites in high-yielding cows fed varying protein percents and protected soybean. JDairy Sci. 64:759–768.
Fussell RJ, McCalley DV. 1987. Determination of volatile fatty acids (C2–C5) and lactic acidin silage by gas chromatography. Analyst. 112:1213–1216.
Gawehn K. 1984. Methods of enzymatic analysis. Weinheim, Germany: Verlag Chemie.Ivan M, Mahadevan S, Dayrell MD. 1996. Duodenal flow of microbial and feed nitrogen in
sheep fed normal soybean meal or soybean meal treated with modified zein. J Dairy Sci.79:121–126.
Jouany JP. 1981. Dosage des acides gras volatils et des alcools dans les ensilages parchromatographie en phase gazeuse. Bull Tech, CRZV Theix (INRA). 46:63–66.
Kalscheur KF, Teter BB, Piperova LS, Erdman RA. 1997. Effect of dietary forageconcentration and buffer addition on duodenal flow of trans-c18:1 fatty acids and milkfat production in dairy cows. J Dairy Sci. 80:2104–2114.
Krober TF, Kulling DR, Menzi H, Sutter F, Kreuzer M. 2000. Quantitative effects of feedprotein reduction and methionine on nitrogen use by cows and nitrogen emission fromslurry. J Dairy Sci. 83:2941–2951.
96 S. De Campeneere et al.
Downloaded By: [De Campeneere, Sam] At: 11:34 1 April 2010
Mahadevan S, Teather RM, Erfle JD, Sauer FD. 1983. Effect of formaldehyde treatment ofsoybean-meal on rates of protein-degradation and microbial protein-concentration in thebovine rumen. Can J Anim Sci. 63:181–190.
Noftsger S, St-Pierre NR. 2003. Supplementation of methionine and selection of highlydigestible rumen undegradable protein to improve nitrogen efficiency for milk production.J Dairy Sci. 86:958–969.
National Research Council (NRC). 1988. Nutrient requirements of dairy cattle. WashingtonDC: National Academy of Sciences.
Ottenstein DM, Bartley DA. 1971. Improved gas chromatography separation of free acidsC2��C5 in dilute solution. Anal Chem. 43:952–955.
Reynal SM, Broderick GA. 2005. Effect of dietary level of rumen-degraded protein onproduction and nitrogen metabolism in lactating dairy cows. J Dairy Sci. 88:4045–4064.
Schmidt SP, Beneveng NJ, Jorgense NA. 1974. Effect of formaldehyde treatment of soybean-meal on performance of growing steers and lambs. J Anim Sci. 38:646–653.
Smits MCJ, Valk H, Elzing A, Keen A. 1995. Effect of protein nutrition on ammonia emissionfrom a cubicle house for dairy cattle. Livest Sci. 44:147–156.
1994. The Dutch protein evaluation system: The DVE/OEB-system. Livest Sci. 40:139–155.
van Es AJH. 1978. Feed evaluation for ruminants. I. The system in use from May 1977onwards in the Netherlands. Livest Sci. 5:331–345.
Van Soest PJ, Robertson JB, Lewis BA. 1991. Methods for dietary fiber, neutral detergentfiber, and nonstarch polysaccharides in relation to animal nutrition. J Dairy Sci. 74:3583–3597.
Wachira JD, Satter LD, Brooke GP, Pope AL. 1974. Evaluation of formaldehyde-treatedprotein for growing lambs and lactating cows. J Anim Sci. 39:796–807.
Archives of Animal Nutrition 97
Downloaded By: [De Campeneere, Sam] At: 11:34 1 April 2010