On the correlation of moth flight to characteristics of a turbulent plume Tal Hadad 1 , Ally Harari 2 , Alex Liberzon 3 , Roi Gurka 1 * 1 Department of Mechanical Engineering, Ben-Gurion University, Beer-Sheva, Israel 2 Department of Entomology, The Volcani Center, Bet Dagan, Israel 3 School of Mechanical Engineering, Tel-Aviv University, Tel-Aviv, Israel * E-mail: Corresponding [email protected]Abstract Several mechanisms control male moth’s navigation towards a female releasing sex pheromone. Optomotor anemotaxis is a visual mechanism for the moth flight direction relative to the ground, mechanoreceptors are used for calculating its speed relative to the air current and chemoreceptors on the antennae for sampling the pheromone concentration in the air. All together result in a zigzagging flight pattern of the male moth that depends on the charac- teristics of its encounters with the pheromone plume. The zigzagging flight pattern includes constant counter-turnings across the wind line in an angle up to 90 degree (casting). In this paper we address how air turbulence manifests the male flight behavior in respect to the streamwise current that carries the pheromone, emphasizing a relationship between the flight speed and the turbulent plume properties. The interaction between the moth flight and the flow field characteristics was examined in a wind tunnel where moth trajectory was recorded. Particle image velocimetry (PIV) and scalar imaging technique were utilized for measuring velocities and scalar concentration distribution in the tunnel. The role of turbulence in the moth navigation was evaluated by calculating the correlation function of the moth trajectory path, the velocity fluctuation in the streamwise and normal directions and the concentration fields. We have found that the moth navigates in a manner which is directly correlated with the turbulent flow characteristics: the upwind motion is related to the streamwise variations of the pheromone concentration while the zigzagging motion is correlated with the cross-stream turbulent flow fluctuations. This finding can explain 1 arXiv:1310.1411v1 [physics.flu-dyn] 4 Oct 2013
Transcript
On the correlation of moth flight to characteristics of aturbulent plumeTal Hadad1, Ally Harari2, Alex Liberzon3, Roi Gurka1 ∗
1 Department of Mechanical Engineering, Ben-Gurion University, Beer-Sheva,
Israel
2 Department of Entomology, The Volcani Center, Bet Dagan, Israel
3 School of Mechanical Engineering, Tel-Aviv University, Tel-Aviv, Israel
depends on its encounters with the pheromone plume (Preiss and Kramer, 1986; Kennedy,
1986; Baker, 1990; Willis and Arbas, 1991; Mafra-Neto and Cardé, 1994; Vickers and Baker,
1994). These counter-turns and surge flying along the current are suggested as sufficient to
understand the male flight behavior (Willis and Arbas, 1991; Mafra-Neto and Cardé, 1994;
Vickers and Baker, 1994b).
The significance of turbulence to the odor dispersal in respect to moth navigation was
acknowledged in previous papers (Kaissling, 1997), yet the mechanism by which male moths’
navigation is affected by turbulence is not fully understood. In particular, the assumptions
underline the understanding of male behavior is that the male knows its flight direction
relative to the ground (optomotor), its speed relative to the air current (through mechanore-
ceptors) and the concentration of the pheromone at time of sampling (chemoreceptors in
the antennae). The angles of the counter-turning flights relative to the main current was
proposed to be internally programmed at each encounter with the pheromone patch, result-
ing with the zigzagging flight pattern (Kennedy, 1983; Carde and Hagaman, 1984; Baker
et al., 1984). The angles between the counterturns is assumed to be related to upwind speed
(Ludlow, 1983; Willis and Arbas, 1998).
In this paper we study the way turbulence affects the male flight behavior in respect to
the streamwise current that carries the pheromone.
3
Methods
Wind tunnel and measurement tools
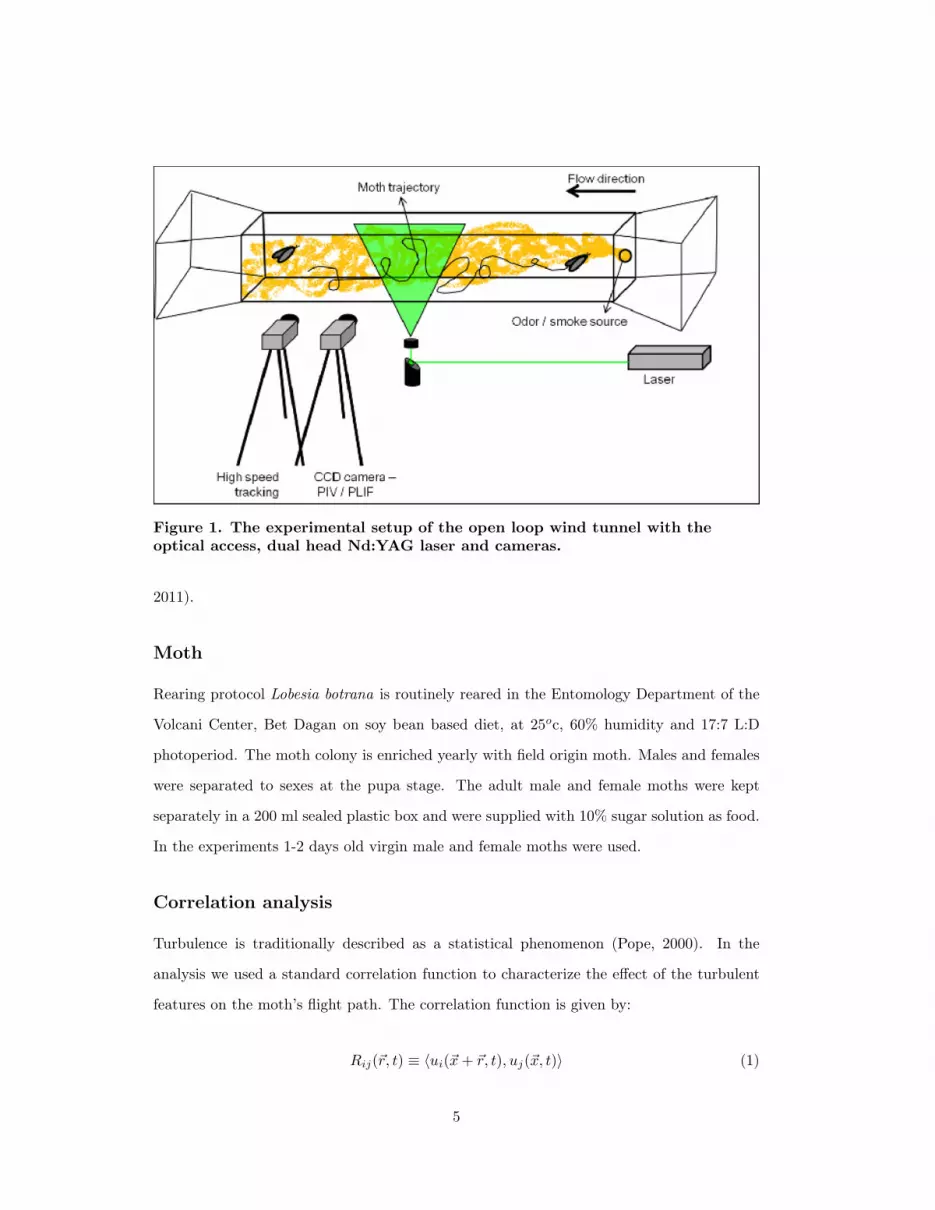
The interaction between the moth flight and the turbulent flow field was examined in an
open-loop wind tunnel with optical access, as shown in figure 1, operated at 0.3 m/sec,
velocity, similar to male moth flying towards the female in natural environment. The female
moth was placed at the center of the up-wind section of the tunnel. Next to it, a rubber
septa loaded with the synthetic pheromone main component (E7,Z9-12:Ac) was located in
the synthetic pheromone experiment. The male moths began to fly towards the female from
the downstream section of the wind tunnel. Particle image velocimetry (PIV) (Raffel et al.,
2007), and scalar imaging (Hanson, 1988; Sarathi et al., 2010), measured the velocities and
scalar concentration distributions in the tunnel, respectively. The flow was seeded with two
types of tracers: oil smoke (0.5 µm) for scalar imaging and oil aerosol (1.2 µm) for PIV.
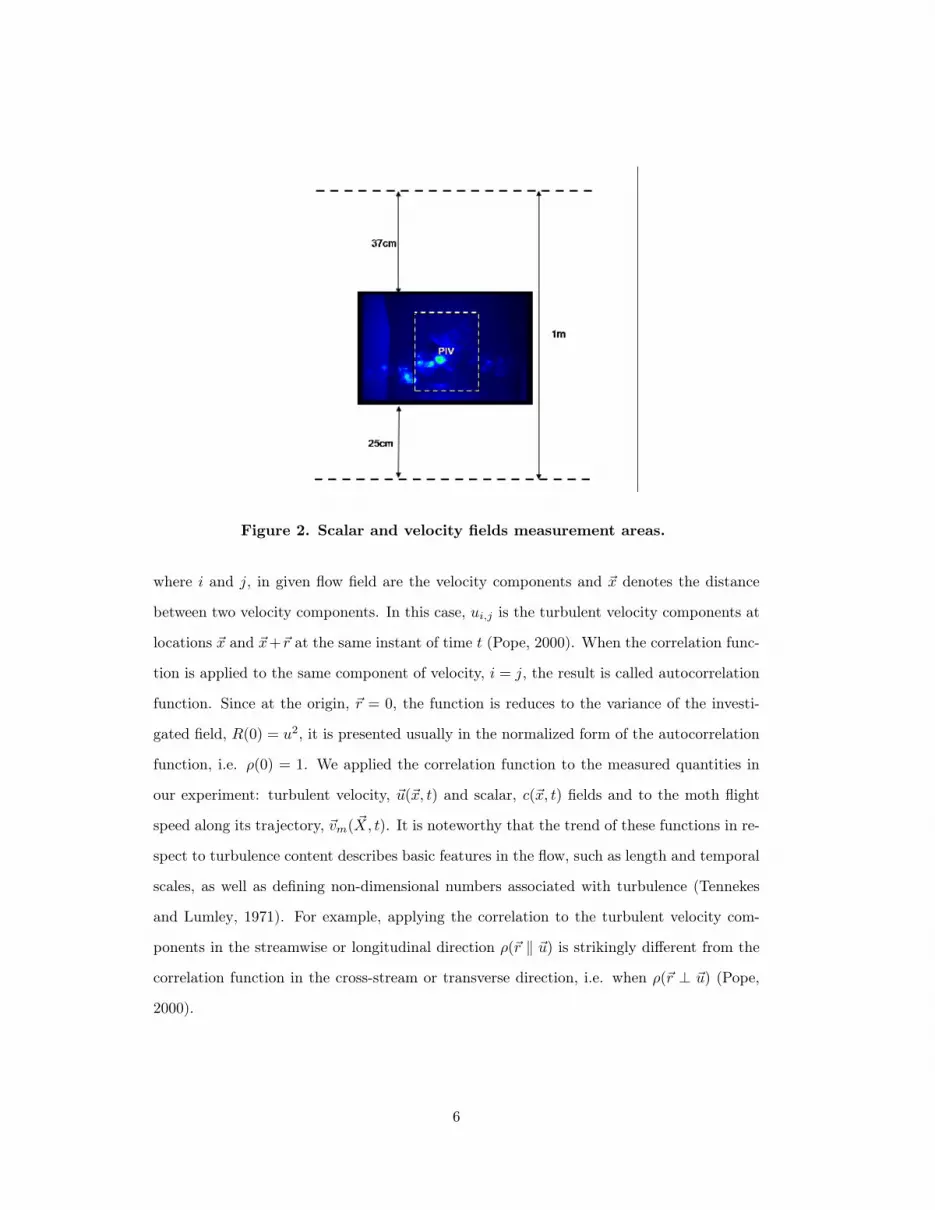
Measurements of the scalar and velocity fields were conducted in streamwise-vertical plane
at the mid-width of the wind tunnel as is shown in figure 2. Figure 2 shows an instantaneous
scalar image, whilst the dashed frame indicates the location of the PIV measurements and
the overlap region between PIV and scalar imaging.
For both PIV and scalar imaging techniques a dual-head pulsed Nd:YAG laser (NewWave
Solo 120 mJ/pulse, 532 nm) was used along with a laser sheet forming optics. High resolution
CCD camera (4008× 2672 pixels) operated at frame rate of 4 Hz and dynamic range of 12
bit was oriented perpendicular to the laser sheet imaged yielding a field of view of 21 × 27
cm2 (see figure 2). Standard FFT-based cross-correlation PIV analysis using 64× 64 pixels
correlation windows with 50% overlap was applied to 100 sequential images, resulting in
4760 velocity vectors for each velocity map (Taylor et al., 2010). Images of the smoke plume
were acquired at a frame rate of 4 frames per second for twenty seconds and a total of 38
frames were captured.
In addition, the male moth’s flight path along the wind tunnel was recorded using a
640×480 pixels video camera operated at the frame rate of 30 frames per second. The open
source particle tracking algorithm (www.openptv.net) was utilized to quantify the moth
location ~X(t) and flight speed ~vm(t) = d ~X/d t along its trajectory (Kreizer and Liberzon,
4
Figure 1. The experimental setup of the open loop wind tunnel with theoptical access, dual head Nd:YAG laser and cameras.
2011).
Moth
Rearing protocol Lobesia botrana is routinely reared in the Entomology Department of the
Volcani Center, Bet Dagan on soy bean based diet, at 25oc, 60% humidity and 17:7 L:D
photoperiod. The moth colony is enriched yearly with field origin moth. Males and females
were separated to sexes at the pupa stage. The adult male and female moths were kept
separately in a 200 ml sealed plastic box and were supplied with 10% sugar solution as food.
In the experiments 1-2 days old virgin male and female moths were used.
Correlation analysis
Turbulence is traditionally described as a statistical phenomenon (Pope, 2000). In the
analysis we used a standard correlation function to characterize the effect of the turbulent
features on the moth’s flight path. The correlation function is given by:
Rij(~r, t) ≡ 〈ui(~x+ ~r, t), uj(~x, t)〉 (1)
5
Figure 2. Scalar and velocity fields measurement areas.
where i and j, in given flow field are the velocity components and ~x denotes the distance
between two velocity components. In this case, ui,j is the turbulent velocity components at
locations ~x and ~x+~r at the same instant of time t (Pope, 2000). When the correlation func-
tion is applied to the same component of velocity, i = j, the result is called autocorrelation
function. Since at the origin, ~r = 0, the function is reduces to the variance of the investi-
gated field, R(0) = u2, it is presented usually in the normalized form of the autocorrelation
function, i.e. ρ(0) = 1. We applied the correlation function to the measured quantities in
our experiment: turbulent velocity, ~u(~x, t) and scalar, c(~x, t) fields and to the moth flight
speed along its trajectory, ~vm( ~X, t). It is noteworthy that the trend of these functions in re-
spect to turbulence content describes basic features in the flow, such as length and temporal
scales, as well as defining non-dimensional numbers associated with turbulence (Tennekes
and Lumley, 1971). For example, applying the correlation to the turbulent velocity com-
ponents in the streamwise or longitudinal direction ρ(~r ‖ ~u) is strikingly different from the
correlation function in the cross-stream or transverse direction, i.e. when ρ(~r ⊥ ~u) (Pope,
2000).
6
Results
Turbulent flow and scalar dispersion
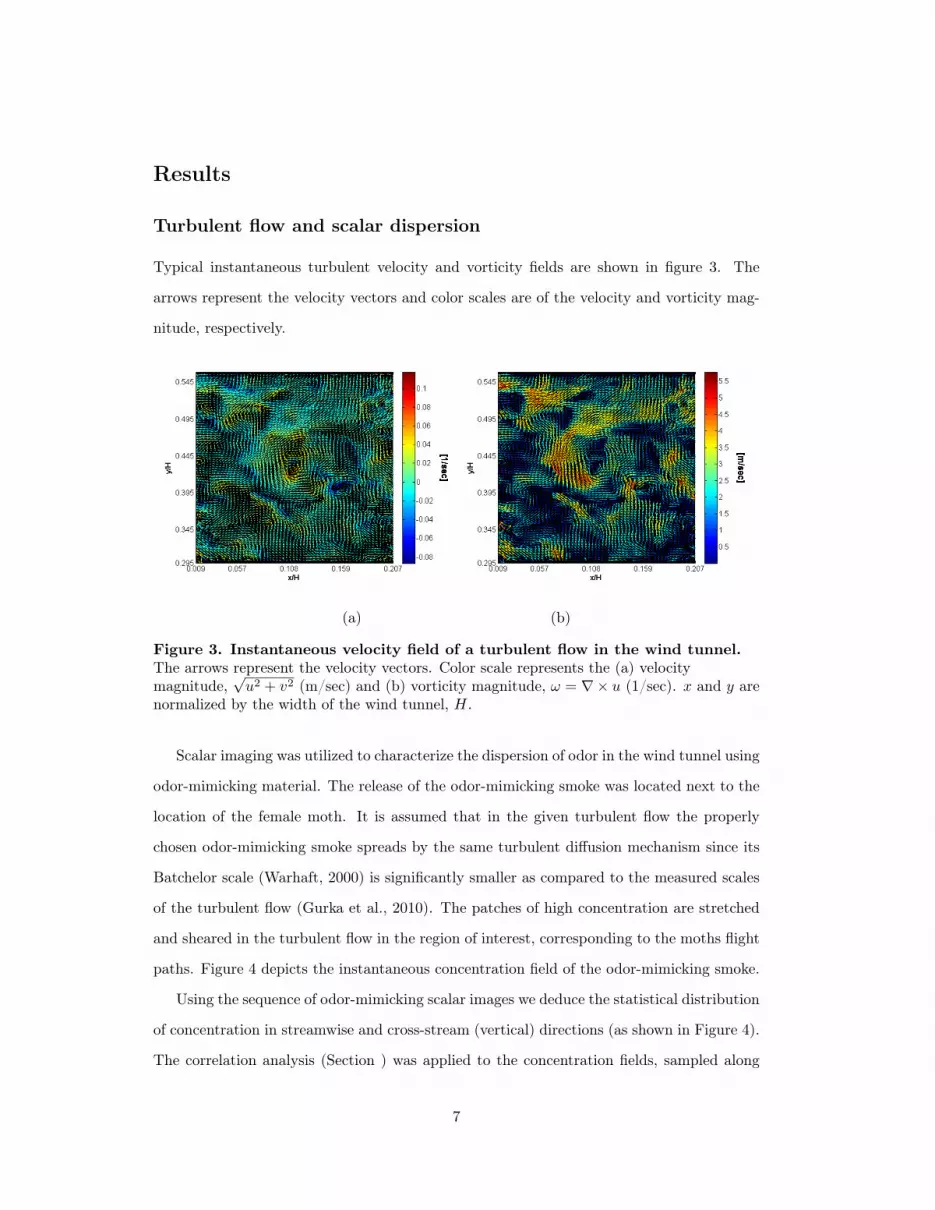
Typical instantaneous turbulent velocity and vorticity fields are shown in figure 3. The
arrows represent the velocity vectors and color scales are of the velocity and vorticity mag-
nitude, respectively.
(a) (b)
Figure 3. Instantaneous velocity field of a turbulent flow in the wind tunnel.The arrows represent the velocity vectors. Color scale represents the (a) velocitymagnitude,
√u2 + v2 (m/sec) and (b) vorticity magnitude, ω = ∇× u (1/sec). x and y are
normalized by the width of the wind tunnel, H.
Scalar imaging was utilized to characterize the dispersion of odor in the wind tunnel using
odor-mimicking material. The release of the odor-mimicking smoke was located next to the
location of the female moth. It is assumed that in the given turbulent flow the properly
chosen odor-mimicking smoke spreads by the same turbulent diffusion mechanism since its
Batchelor scale (Warhaft, 2000) is significantly smaller as compared to the measured scales
of the turbulent flow (Gurka et al., 2010). The patches of high concentration are stretched
and sheared in the turbulent flow in the region of interest, corresponding to the moths flight
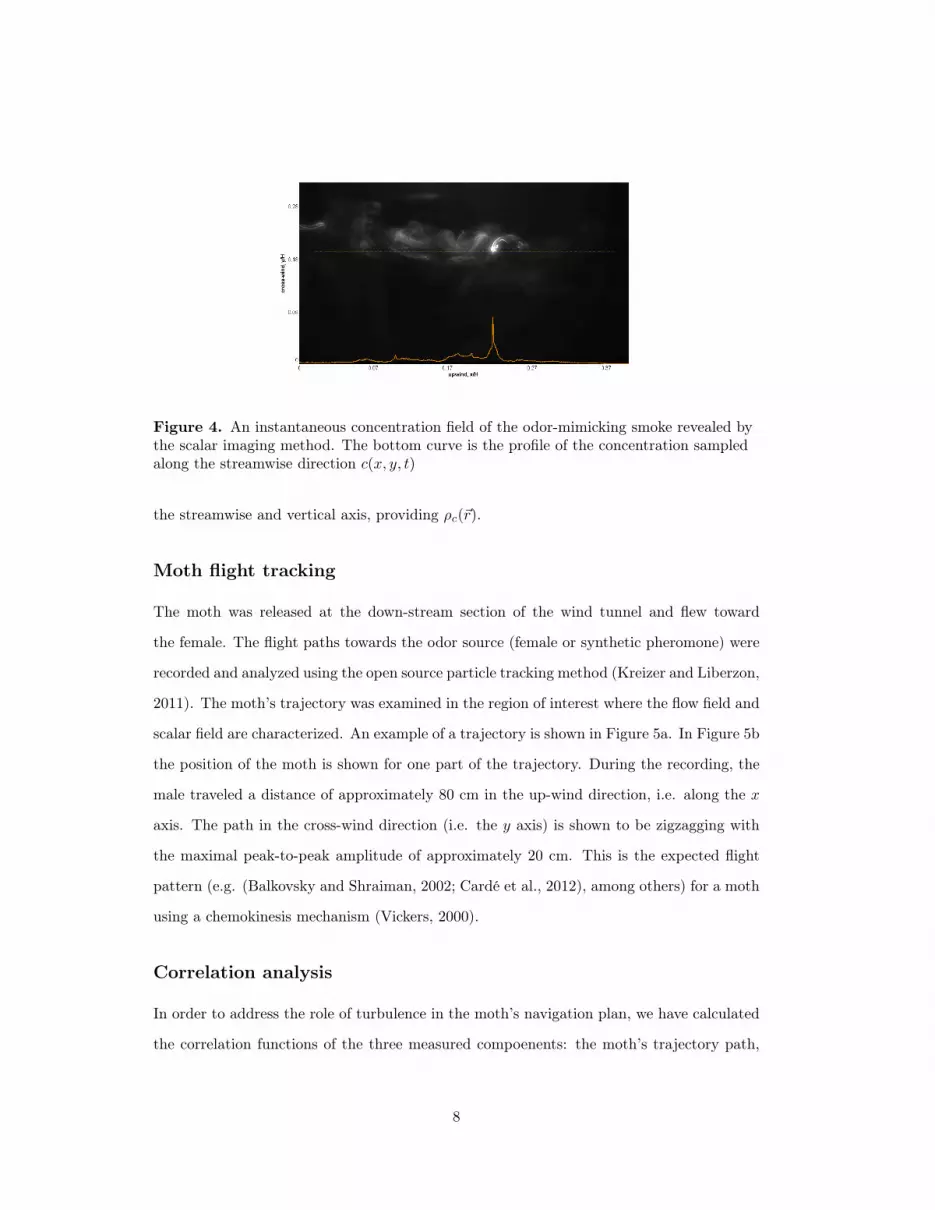
paths. Figure 4 depicts the instantaneous concentration field of the odor-mimicking smoke.
Using the sequence of odor-mimicking scalar images we deduce the statistical distribution
of concentration in streamwise and cross-stream (vertical) directions (as shown in Figure 4).
The correlation analysis (Section ) was applied to the concentration fields, sampled along
7
Figure 4. An instantaneous concentration field of the odor-mimicking smoke revealed bythe scalar imaging method. The bottom curve is the profile of the concentration sampledalong the streamwise direction c(x, y, t)
the streamwise and vertical axis, providing ρc(~r).
Moth flight tracking
The moth was released at the down-stream section of the wind tunnel and flew toward
the female. The flight paths towards the odor source (female or synthetic pheromone) were
recorded and analyzed using the open source particle tracking method (Kreizer and Liberzon,
2011). The moth’s trajectory was examined in the region of interest where the flow field and
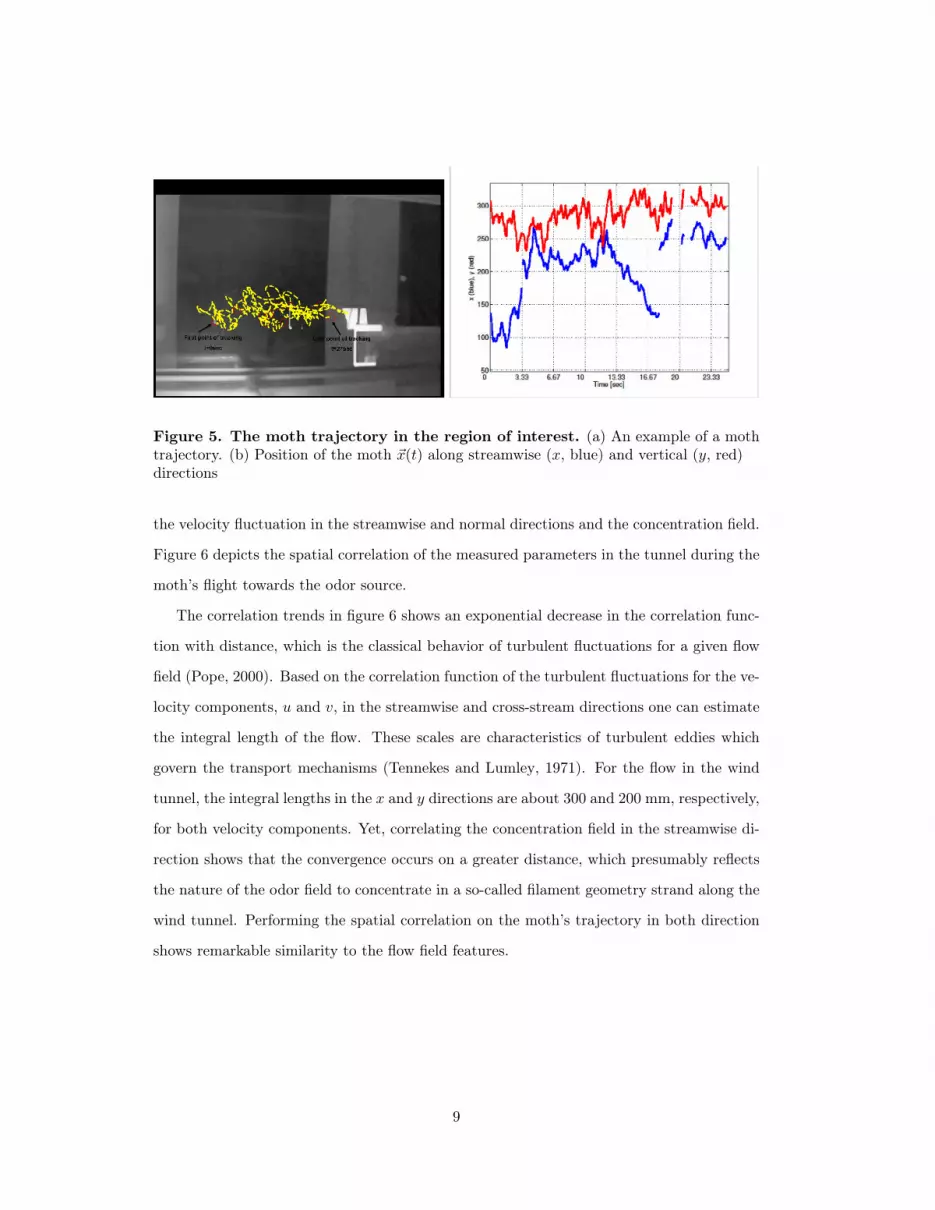
scalar field are characterized. An example of a trajectory is shown in Figure 5a. In Figure 5b
the position of the moth is shown for one part of the trajectory. During the recording, the
male traveled a distance of approximately 80 cm in the up-wind direction, i.e. along the x
axis. The path in the cross-wind direction (i.e. the y axis) is shown to be zigzagging with
the maximal peak-to-peak amplitude of approximately 20 cm. This is the expected flight
pattern (e.g. (Balkovsky and Shraiman, 2002; Cardé et al., 2012), among others) for a moth
using a chemokinesis mechanism (Vickers, 2000).
Correlation analysis
In order to address the role of turbulence in the moth’s navigation plan, we have calculated
the correlation functions of the three measured compoenents: the moth’s trajectory path,
8
Figure 5. The moth trajectory in the region of interest. (a) An example of a mothtrajectory. (b) Position of the moth ~x(t) along streamwise (x, blue) and vertical (y, red)directions
the velocity fluctuation in the streamwise and normal directions and the concentration field.
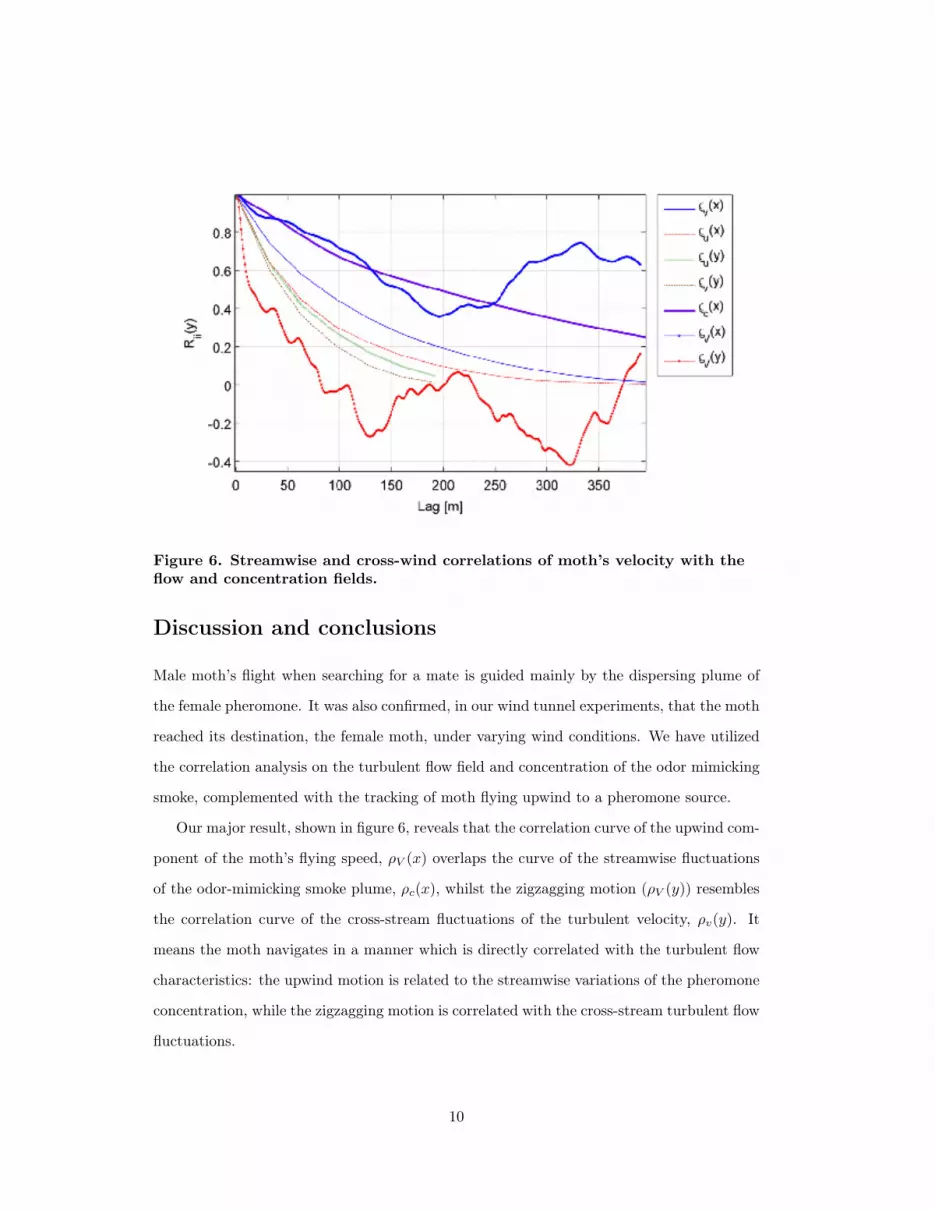
Figure 6 depicts the spatial correlation of the measured parameters in the tunnel during the
moth’s flight towards the odor source.
The correlation trends in figure 6 shows an exponential decrease in the correlation func-
tion with distance, which is the classical behavior of turbulent fluctuations for a given flow
field (Pope, 2000). Based on the correlation function of the turbulent fluctuations for the ve-
locity components, u and v, in the streamwise and cross-stream directions one can estimate
the integral length of the flow. These scales are characteristics of turbulent eddies which
govern the transport mechanisms (Tennekes and Lumley, 1971). For the flow in the wind
tunnel, the integral lengths in the x and y directions are about 300 and 200 mm, respectively,
for both velocity components. Yet, correlating the concentration field in the streamwise di-
rection shows that the convergence occurs on a greater distance, which presumably reflects
the nature of the odor field to concentrate in a so-called filament geometry strand along the
wind tunnel. Performing the spatial correlation on the moth’s trajectory in both direction
shows remarkable similarity to the flow field features.
9
Figure 6. Streamwise and cross-wind correlations of moth’s velocity with theflow and concentration fields.
Discussion and conclusions
Male moth’s flight when searching for a mate is guided mainly by the dispersing plume of
the female pheromone. It was also confirmed, in our wind tunnel experiments, that the moth
reached its destination, the female moth, under varying wind conditions. We have utilized
the correlation analysis on the turbulent flow field and concentration of the odor mimicking
smoke, complemented with the tracking of moth flying upwind to a pheromone source.
Our major result, shown in figure 6, reveals that the correlation curve of the upwind com-
ponent of the moth’s flying speed, ρV (x) overlaps the curve of the streamwise fluctuations
of the odor-mimicking smoke plume, ρc(x), whilst the zigzagging motion (ρV (y)) resembles
the correlation curve of the cross-stream fluctuations of the turbulent velocity, ρv(y). It
means the moth navigates in a manner which is directly correlated with the turbulent flow
characteristics: the upwind motion is related to the streamwise variations of the pheromone
concentration, while the zigzagging motion is correlated with the cross-stream turbulent flow
fluctuations.
10
It is plausible to assume that the moth uses flow field information of two quantities for
its navigation: concentration and velocity. However, the notion that the moth correlates its
transverse trajectory with the turbulent fluctuations leads to a new paradigm: the moth,
samples both velocity and concentration during flight. To reach its destination, it follows
the odor trail marked via the filaments strand along the plume, whilst the zigzagging motion
is controlled by adjusting its path to the transverse turbulent scales. Essentially, the moth,
while performing the zigzag motion, follows the integral scales of the flow. This is however,
not surprising from the fluid mechanics point of view, since the integral scales of the flow
dominants both the velocity fluctuations and the dispersion of concentration in a given
turbulent flow (Warhaft, 2000). This finding can explain how the angle of the counter-
turning flights, in respect to the main current, relates each encounter with the pheromone
patch to the zigzagging flight pattern (Kennedy, 1983; Carde and Hagaman, 1984; Baker
et al., 1984).
The correlation distributions hint that the moth’s path follows both the mean flow (up-
wind) using optomotor reaction, supplemented by some additional sensing capabilities to
the turbulent scales. The way the moth senses the flow could be through the velocity fluctu-
ations gradients (e.g.: vorticity) or through some other related fluctuation properties, such
as the Reynolds stress and this remained to be explored by additional set of experiments.
The combination of the wind speed and the turbulent intensity level in the flow can serve
as two quantities that a robot would need to sense in order to navigate.
Acknowledgments
References
Baker, T., Hansson, B., Lofstedt, C. and Lofqvist, J. (1988). Adaptation of antennal
neurons in moths is associated with cessation of pheromone-mediated upwind flight. Proc
Natl Acad Sci 85, 9826–9830.
Baker, T. C. (1990). Upwind flight and casting flight: Complementary phasic and tonic
11
systems used for location of sex pheromone sources by male moths. In Int Symp Olfaction
and Taste (ed. D. KB), pp. 18–22.
Baker, T. C., Willis, M. A. and Phelan, P. L. (1984). Optomotor anemotaxis polarizes
self-steered zigzagging in flying moths. Physiol Entomol 9, 365–376.
Balkovsky, E. and Shraiman, B. (2002). Olfactory search at high Reynolds number.
Proceedings of the National Academy of Sciences of the United States of America 99,
12589.
Belanger, J. and Arbas, E. (1998). Behavioral strategies underlying pheromone-
modulated flight in moths: lessons from simulation studies. J Comp Physiol A 183,
345–360.
Cardé, R. T., Cardé, A. M. and Girling, R. D. (2012). Observations on the flight
paths of the day-flying moth Virbia lamae during periods of mate location: do males
have a strategy for contacting the pheromone plume? The Journal of animal ecology 81,
268–76.
Carde, R. T. and Hagaman, T. E. (1984). Mate location strategies of gypsy moths in
dense populations. Chem Ecol 10, 25–31.
Christensen, T. A., Heinbockel, T. and Hildebrand, J. G. (1996). Olfactory in-
formation processing in the brain: encoding chemical and temporal features of odors. J
Neurobiol 30, 82–91.
David, C. T., Kennedy, J. S. and Ludlow, A. R. (1983). Finding of a sex pheromone
source by gypsy moths released in the field. Nature 303, 804–806.
Elkinton, J., Schal, C., Ono, T. and Carde, R. (1987). Pheromone puff trajectory
and upwind flight of male gypsy moth in a forest. Physiol Entomol 12, 399–406.
Gurka, R., Liberzon, A., Sarathi, P. and Sullivan, P. (2010). Diffusion of scalar
concentration from localized sources in turbulent flows. Reviews in Chemical Engineering
26, 13–27.
12
Hanson, R. K. (1988). Planar laser induced fluorescence imaging. J Quant Spectrosc
Radiat Transf 40, 343–362.
Kaissling, K.-E. (1997). Pheromone-controlled anemotaxis in months. In Orientation and
Communication in Arthropods, pp. 343–375. Birkhauser Verlag.
Kaissling, K.-E., Meng, L. Z. and Bestmann, H. (1989). Responses of bombykol
receptor cells to (z,e)-4,6-hexadecadiene and linalool. J Comp Physiol A 165, 147–154.
Kennedy, J. S. (1939). The visual responses of flying mosquitoes. J Zool A109, 221–242.
Kennedy, J. S. (1983). Zigzagging and casting as a programmed response to wind-borne
odour: a review. Physiol Entomol 8, 109–120.
Kennedy, J. S. (1986). Some current issues in orientation to odour sources. In Mechanisms
in insect olfaction (ed. B. M. K. C. Payne TL), pp. 11–25. Clarendon.
Kennedy, J. S. and Marsh, D. (1974). Pheromone regulated anemotaxis in flying moths.
Science 184.
Koehl, M. A. R. (1995). Fluid flow through hair-bearing appendages: feeding, smelling
and swimming at low and intermediate reynolds numbers. Symp Soc Exp Biol 49, 157–
182.
Koehl, M. A. R. (1996). Small scale fluid dynamics of olfactory antennae. Mar Freshw
Behav Physiol 27, 127–141.
Kramer, E. (1992). Attractivity of pheromone surpassed by time-patterned application of
two nonpheromone compounds. J Insect Behav 5, 83–97.
Kreizer, M. and Liberzon, A. (2011). Three-dimensional particle tracking method using
FPGA-based real-time image processing and four-view image splitter. Experiments in
fluids 50, 613–620.
Ludlow, A. R. (1983). Applications of computer modelling to behavioural coordination.
Ph.D. thesis, University of London.
13
Mafra-Neto, A. and Cardé, R. (1994). Fine-scale structure of pheromone plumes mod-
ulates upwind orientation of flying moths. Nature .
Murlis, J. (1986). The structure of odour plumes. In Mechanisms in insect olfaction (ed.
B. M. Payne TL, Kennedy CEJ), pp. 27–38. Clarendon Press: Oxford.
Murlis, J., Elkinton, J. S. and Carde, R. T. (1992). Odor plumes and how insects use
them. Annu Rev Entomol 37, 505–532.
Pope, S. B. (2000). Turbulent Flows. Cambridge University Press.
Preiss, R. and Kramer, E. (1986). Mechanism of pheromone orientation in flying moths.
Natur wissenschaften 72, 555–557.
Raffel, M., Willert, C., Wereley, S. and Kompenhans, J. (2007). Particle Image
Velocimetry. Springer.
Rumbo, E. and Kaissling, K.-E. (1989). Temporal resolution of odour pulses by three
types of pheromone receptor cells in antheraea polyphemus. J Comp Physiol A 165,
281–291.
Sarathi, P., Gurka, R., Sullivan, P. J. and Kopp, G. A. (2010). Experimental
measurements of expected mass fraction function in a contaminant plume. Boundary
Layer Meteorology 137, 167–185.
Taylor, Z. J., Gurka, R., Kopp, G. A. and Liberzon, A. (2010). Long duration, time-
resolved piv to study unsteady aerodynamics. IEEE Trans Instrum Meas 59, 3262–3269.
Tennekes, H. and Lumley, J. (1971). A first course in turbulence. MIT Press.
Vickers, N. J. (2000). Mechanisms of animal navigation in odor plumes. The Biological
bulletin 198, 203–12.
Vickers, N. J. (2006). Winging it: moth flight behavior and responses of olfactory neurons
are shaped by pheromone plume dynamics. Chemical senses 31, 155–66.
14
Vickers, N. J. and Baker, T. C. (1994). Reiterative responses to single strands of odor
promote sustained upwind flight and odor source location by moths. Proc Natl Acad Sci
91, 5756–5760.
Vickers, N. J. and Baker, T. C. (1994b). Visual feedback in the control of pheromone-