Page 1
1
Land Remote Sensing and Global Environmental Change: NASA’s Earth Observing System and
the Science of ASTER and MODIS
MODIS Ve g e t a t i o n In d i ces
Alfredo Huete1, Kamel Didan
1, Willem van Leeuwen
2, Tomoaki Miura
3, and Ed Glenn
4
1Deparment Soil, Water & Environmental Science, University of Arizona, Tucson, AZ
2Department Geography and Regional Development & Office of Arid Lands Studies, Univ. of Arizona,
Tucson, AZ
3Department of Natural Resources and Environmental Management, University of Hawaii, Honolulu, HI
4Environmental Research Lab, University of Arizona, Tucson, AZ
Corresponding author:
Alfredo R. Huete
Department of Soil, Water and Environmental Science
429 Shantz Bldg. #38
University of Arizona
Tucson, AZ 85721-0038
Tel: 520-621-3228; fax: 520-621-1647; mobile: 520-241-0958
Page 2
2
1. Introduction
Assessments of vegetation condition, cover, change, and processes are major components
of global change research programs and are topics of considerable societal relevance. Spectral
vegetation indices are among the most widely used satellite data products providing key
measurements for climate, hydrologic, and biogeochemical studies; phenology, land cover and
land cover change detection; natural resource management and sustainable development.
Vegetation indices (VI) are robust and seamless data products computed the same across all
pixels in time and space, regardless of biome type, land cover condition, and soil type, and thus
represent true surface measurements. As a result of their simplicity, VIs can be more readily
fused across sensor systems facilitating an underlying need to ensure continuity of critical data
sets for long term monitoring of the land surface and to study climate-related processes. There is
currently a consistent global normalized difference vegetation index (NDVI) land record
extending more than two decades from the NOAA Advanced Very High Resolution Radiometer
(AVHRR), that has contributed significantly to global biome, ecosystem, and agricultural
studies.
In this chapter we present the current status of the Moderate Resolution Imaging
Spectroradiometer (MODIS) Vegetation Index products, their algorithm state and heritage,
validation, and quality assurance. We highlight some important advancements in land remote
sensing science and discuss the full range of applications and societal benefits resulting from the
use of MODIS vegetation indices.
Page 3
3
2. Definition and theoretical basis
Vegetation indices are optical measures of vegetation canopy ‘greenness’, a composite
property of leaf chlorophyll, leaf area, canopy cover, and structure. Vegetation indices are not
“intrinsic physical quantities” but are widely used as proxies in the assessment of canopy
biophysical/ biochemical variables (leaf area index (LAI), fraction of absorbed
photosynthetically-active radiation (fPAR), chlorophyll content, green vegetation fraction (Fg),
biomass) and canopy biophysical processes (photosynthesis, transpiration) [1, 2].
A VI combines the chlorophyll-absorbing red spectral region with the non-absorbing leaf
reflectance signal in the near-infrared (NIR) to depict vegetation “greenness” or area-averaged
canopy photosynthetic capacity. There are a variety of ways in which the red and NIR bands may
be combined to estimate greenness, and this has resulted in a multitude of VI equations,
including band ratios and differences [3], normalized differences [2], linear combinations, and
‘optimized’ band combinations [4, 5]. All VIs have been empirically related with various
vegetation canopy properties, however, there are significant differences in how they depict
“greenness” and multiple VIs could be potentially useful and complementary.
The MODIS standard VI products include the NDVI and the enhanced vegetation index
(EVI) to more effectively characterize vegetation states and processes and to better encompass
the range of biophysical/biochemical information that can be extracted from vegetated surfaces.
The NDVI is a functional variant of the simple ratio (SR = NIR/red) that provides VI values
normalized between -1 to +1,
NDVI = (SR-1) / (SR-1) = (ρNIR - ρred) / (ρNIR + ρred) (1)
Many of the recent advancements of Earth System Science, in particular to global, biome,
Page 4
4
and agricultural primary production; interannual fluctuations and impacts of El Niño-Southern
Oscillation (ENSO) on primary production; phenology; and climate change and variability can
be attributed to the development and consistency of the AVHRR- NDVI time series, since 1981.
The NDVI data record has played a key role in detecting changes in vegetation caused by global
temperature increases [6], such as a lengthening of the growing season at northern latitudes in
response to global temperature increases [7]. An important advantage of the NDVI, as a ratio, is
its ability to normalize and produce stable values across large variations in incoming
direct/diffuse irradiances. However, this also results in some disadvantages including the non-
linear nature of ratios, sensitivity to soil background, and saturation at moderate to high
vegetation densities [8, 9].
The EVI gains its heritage from the soil adjusted vegetation index (SAVI) and the
atmosphere resistance vegetation index (ARVI) and is an optimized combination of blue, red and
NIR bands, based on Beer’s law application of canopy radiative transfer, designed to extract
canopy greenness, independent of the underlying soil background and atmospheric aerosol
variations [4, 10],
EVI = 2.5 (ρN - ρR ) / ( L + ρN + C1 ρR – C2 ρB ) (2)
where ρN,R,B are reflectances in the NIR, red, and blue bands, respectively; L is the canopy
background adjustment factor [11]; and C1 and C2 are the aerosol resistance weights [12]. The
coefficients of the MODIS EVI equation are L=1; C1=6 and C2 =7.5 [9].
Page 5
5
The blue band in the EVI is primarily used to stabilize aerosol influences in the red band
resulting from residual and mis-correction of aerosols [13, 14]. The NDVI is sensitive to the
canopy-absorbing ‘red’ band and has a lower optical penetrating depth in canopies and thus, will
saturate more quickly in high biomass areas. The EVI becomes increasingly sensitive to the NIR
band at moderate to high vegetation amounts with a greater optical depth penetration into
canopies. Thus, the EVI will better depict biophysical canopy structural variations and be less
prone to saturate in high biomass areas [15].
3 . A l g o r i t h m S t a t e a n d H e r i t a g e
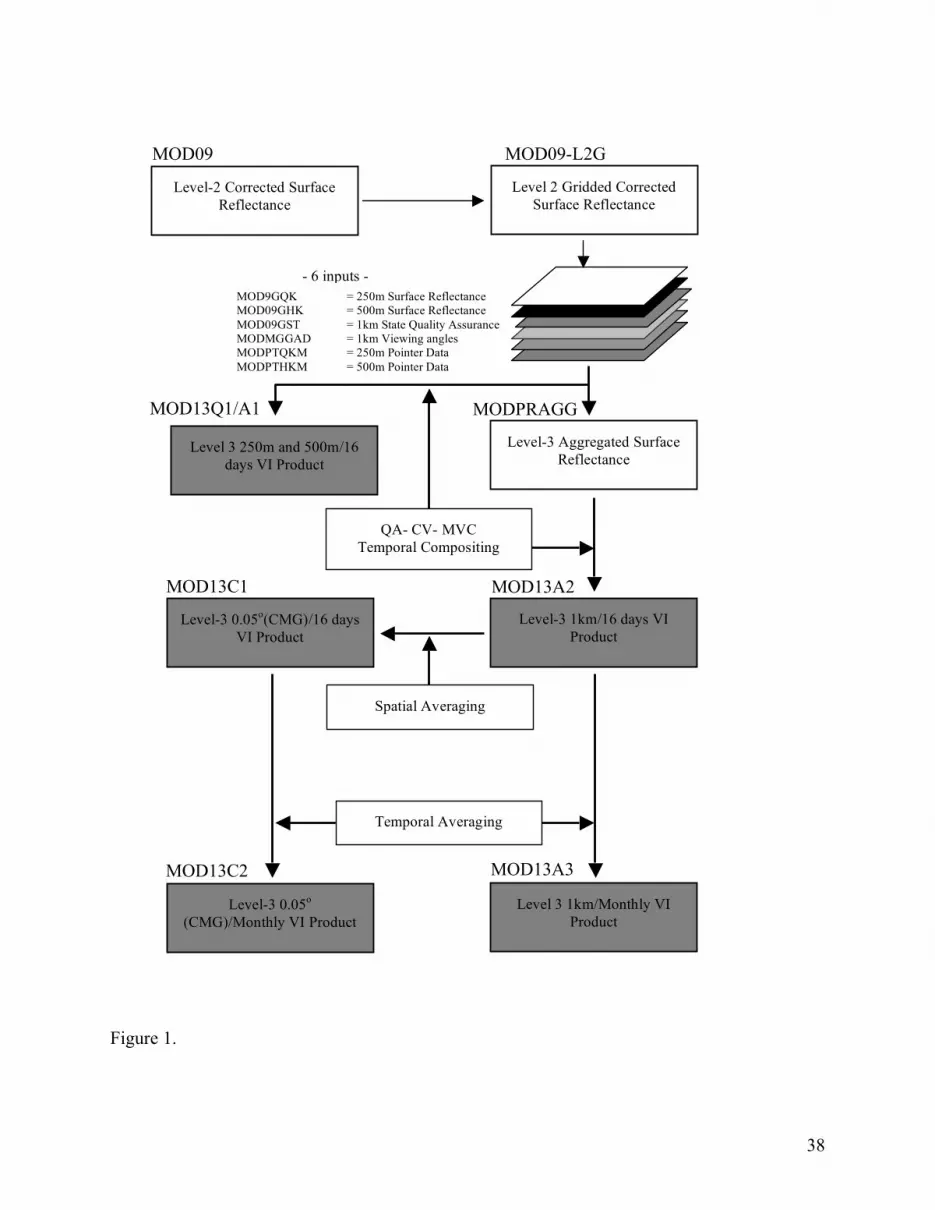
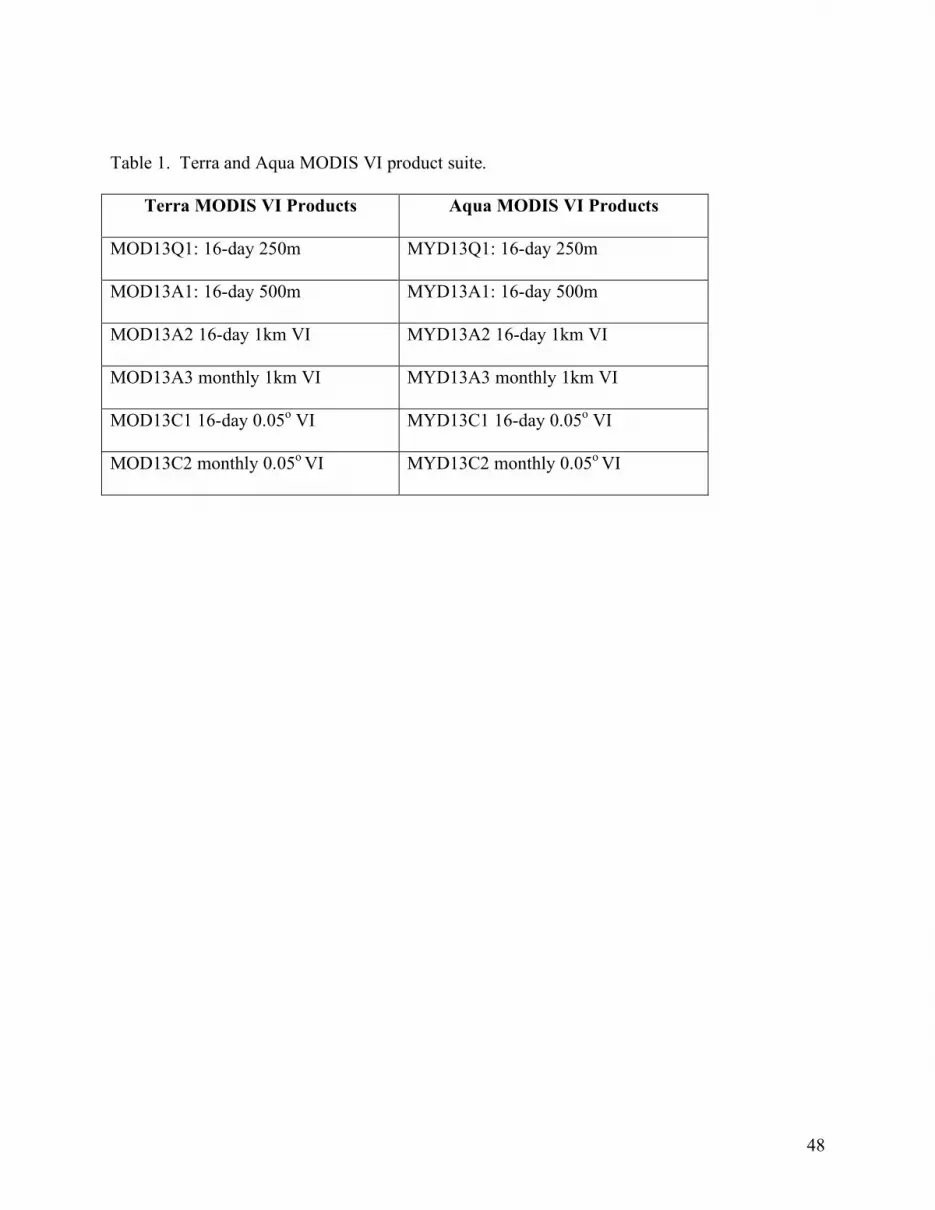
There are six VI products for each of the Terra and Aqua MODIS sensors, at varying
spatial and temporal resolutions to best capture the important spatial and temporal complexities
associated with vegetation dynamics, biogeochemical and hydrologic processes (Table 1). This
includes moderate resolution, 250m, 500m, and 1km, and coarse resolution, 0.05o (~5.6 km
Climate Modeling Grid, CMG) products generated each 16 days, while two standard calendar
month products are also generated at 1 km and CMG resolutions to meet the needs of the
research and application communities (Fig. 1). The products are generated globally over spatial
units called tiles that are 10o x 10
o (about 1200 km x 1200 km at the equator) in the equal area
sinusoidal projection. In the case of the global CMG product, there is no horizontal or vertical
tile number.
There have been several improvements and modifications to the MODIS science algorithms,
including the VIs. The most recent revision is termed ‘Collection 5’ (C5), and incorporates
changes to known issues and problems identified in the previous Collection 4 (C4). Each new
Page 6
6
Collection supersedes the previous and initiates a complete reprocessing of all MODIS land data
products from the first day of data acquisition.
The MODIS VI product suite contains a set of output parameters known as science data
sets (SDS) for each composited, selected pixel, including; (1) composited NDVI and EVI; (2)
NDVI/ EVI output quality; (3) reflectances in bands 1 (620 - 670 nm), 2 (841- 876 nm), 3 (459 -
479 nm), and 7 (2105- 2155 nm); (4) sensor zenith view angle, solar zenith angle, and relative
azimuth; (5) day of year, which was added in the Collection 5 product versions and; (6) pixel
reliability. The 500m and 1km VI products are computed from aggregated surface reflectances,
while the climate modeling grid (CMG, 0.050 resolution) VI product is computed from the
averaged reflectance values of good quality 1 km pixels, aggregated to 0.050 using a QA filter
scheme that removes lower quality, cloud contaminated pixels. The aggregated CMG VI
product includes (1) NDVI and EVI (2) NDVI and EVI standard deviations of the input 1km
pixels, (3) the number of QA-filtered pixels used in aggregation to CMG pixels and, (4) the
number of pixels within 30 degree sensor zenith angle in the CMG pixel.
3.1 Compositing approach
The MODIS sensor provides nearly complete Earth coverage every day. Due to the
ubiquitous presence of clouds and aerosols in daily global imaging sensors, temporal
compositing of frequent measurements over set time intervals is employed for the removal of
cloud, aerosol, and cloud shadow contamination. The composited VIs are produced at 16-day
intervals from atmospherically-corrected (MOD09), surface gridded reflectances with per pixel
quality assurance (QA) information, that have been cloud filtered. A constrained-view angle,
maximum value compositing (CV-MVC) method is used to select view angles to within ±300.
Page 7
7
This is carried out with a per-pixel QA-based methodology that selects the closest to nadir value
from the 2 or 3 highest NDVI values remaining after QA filtering lower quality pixels
contaminated by residual clouds, shadow, high aerosol loadings, and large viewing geometries.
The selected VI values represent actual, atmospherically-corrected VI measurements at local
solar zenith angle and close to nadir view geometries while retaining full traceability to the
sensor acquisition.
This is modified from the heritage AVHRR maximum value compositing (MVC)
methodology, which selects the highest NDVI value in a compositing cycle to best represent
pixel greenness status [16]. Although maximum NDVI values greatly reduce clouds and
aerosols, the highest NDVI value does not necessarily correspond to small sensor viewing angles
or to the least contaminated measurement. This is due to the bias resulting from the anisotropic
properties of most vegetated surfaces in which off-nadir view angles in the forward scatter
direction result in the highest NDVI values, even when contaminated by residual clouds and
aerosols [17]. With more recent advancements in atmosphere correction and sensor bandpass
avoidance of water vapor and other absorbing gases, surface anisotropy influences are more
pronounced and the highest NDVI is increasingly biased toward off-nadir pixel selection.
As the view/sun angle information is provided as SDSs, added value bidirectional
reflectance distribution function (BRDF) applications may be employed to further reduce angular
variations. For example, in [18], Los et al. adjusted AVHRR NDVI time series (Pathfinder
AVHRR Land data) to a standard illumination and viewing geometry by applying MODIS
derived kernels, resulting in a 50% to 85% reduction of BRDF effects.
3.2 Dynamic range of the VI products
Page 8
8
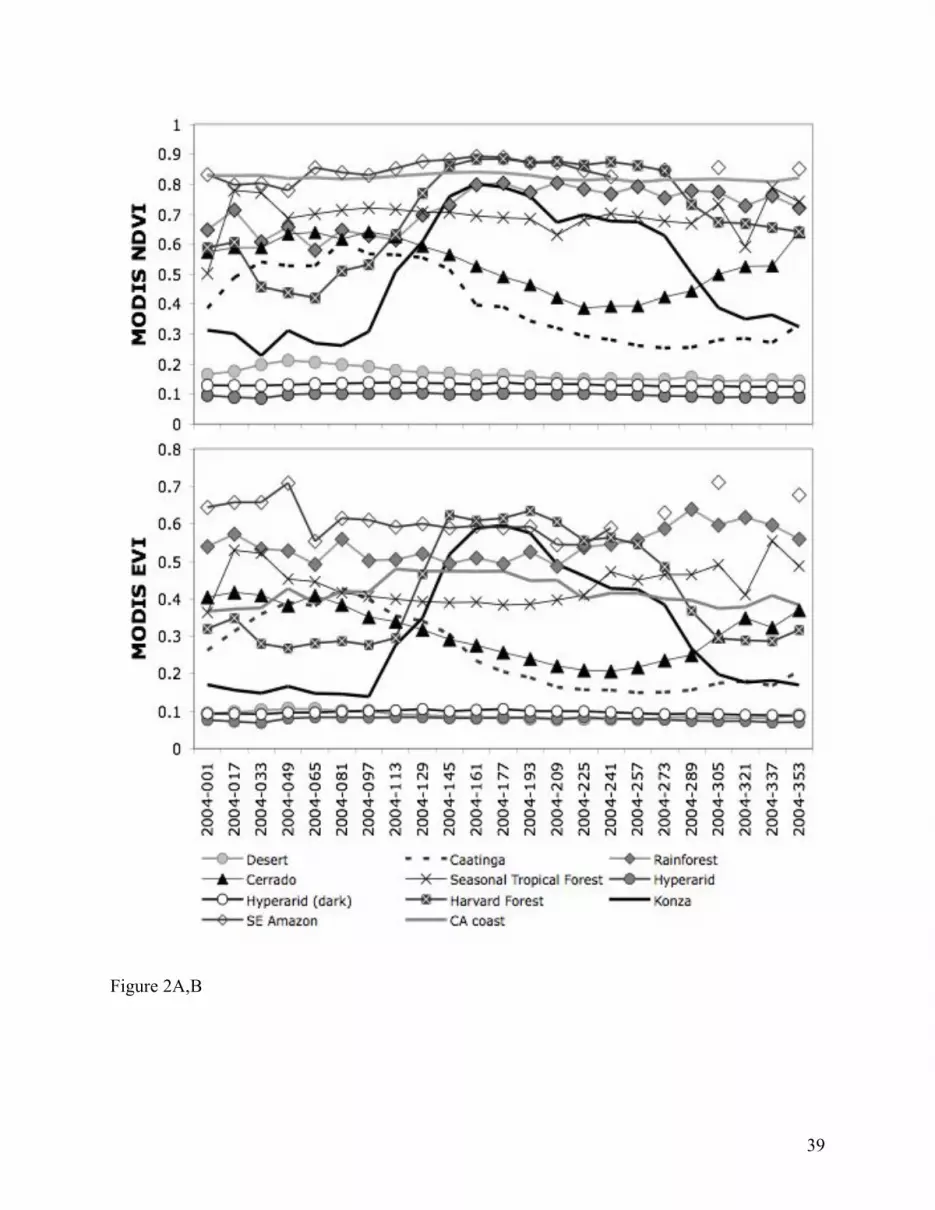
The spatial and temporal dynamic range of the MODIS VIs across a range of vegetation
cover types, hyperarid deserts to dense forests, are depicted in Fig. 2. Important vegetation
parameters used in climate and hydrologic modeling, such as the green vegetation fraction, Fg,
are commonly derived through simple linear combinations of high (vegetation) and low (soil)
NDVI within a scene or biome. In contrast to the AVHRR- NDVI dynamic range, NDVIsoil =
0.04 and NDVIdense= 0.52 [19], the dynamic range of MODIS NDVI is much greater (NDVI~0.1
to 0.90), due to narrower spectral bandwidths and more complete atmosphere correction
(aerosols, water vapor) in the MODIS NDVI product. EVI values varied from 0.07 to ~0.7 for
these same vegetation conditions at 1 km resolutions. There are several important differences
between the NDVI- and EVI-based phenology profiles, particularly in the separation of
needleleaf and broadleaf forests, the greenup and brown-down patterns of Harvard Forest and the
Amazon, and the variation in background values associated with minimum greenness conditions.
The EVI has sharper growing season peaks and is sensitive to canopy structure differences, while
the NDVI appears more sensitive at the lower range of vegetation conditions while saturating in
dense vegetation canopies (Fig. 2). The hyperarid desert baseline values are very stable
suggesting radiometrically calibrated bands through approximately six years of Terra-MODIS
with no aging or degradation effects.
4. Validation and accuracy of the VI product suite
The VI product attempts to retrieve cloud-free, near-nadir, top-of-canopy greenness at 16-
day intervals. Due to the global nature of the algorithm, some problems and uncertainties persist
at local scales, mostly associated with residual clouds, shadow, and aerosol, atmosphere
correction performance, and view-sun angle geometries, resulting in non-biologic artifacts and
noise in the VI values. The accuracy of the VI product will vary in space and time, due to
Page 9
9
geographic and seasonal variations in cloud persistence, unresolved clouds, the quality of
upstream surface reflectance retrievals, sun angle, cross band (red, NIR) spectral integrity,
canopy background (soil, water, snow), topography, and geolocation [20]. For example, in [21],
Miura et al. noted VI uncertainties due to sensor calibration of 0.01 and 0.02 for the NDVI and
EVI, respectively.
Each MODIS VI measurement will involve multiple, simultaneous variations in many of
these sources of noise, making it difficult to assess the influence of individual sources of
uncertainty. The MODIS VI product, however, uses a set of QA classes, from best quality
observations to fair quality data, to reduce aggregate uncertainties in VI values. The selection of
the highest QA levels result in the highest confidence of cloud free, low aerosol, and view angles
within 300 of nadir with accuracies and precision within 0.03 and 0.02, respectively. As shown
at the Jornada Experimental Range [22], VIs are readily computed from field-based, boom-
mounted, and aircraft-borne instruments, and from a wide variety of fine and coarse space-based
sensors, facilitating the comparison and radiometric validation of MODIS VIs. Light aircraft-
mounted sensors, such as MODIS Quick-Airborne Looks (MQUALS), acquire nadir, top-of-
canopy reflectance measurements from 150-500 m height, that greatly extend locally-constrained
field measurements to km lengths to aid in validation [23].
4.1 Angular sources of uncertainty
Differences in anisotropic properties between red and NIR reflectances result in unique VI-
dependent angular variations that need to be constrained in the composited VI products for more
accurate analysis of vegetation dynamics, including landscape phenology. Fensholt et al. [24]
studied the dependence of NDVI on solar and viewing geometries with MODIS and the Meteosat
Page 10
10
Second Generation (MSG) Spinning Enhanced Visible and Infrared Imager (SEVIRI) sensor, and
found higher red reflectances relative to NIR under backscatter conditions causing observed
NDVI to decrease. In the forward scatter direction, red reflectance data are much more strongly
reduced due to shadowing from the highly absorbing vegetated canopies, resulting in higher
NDVI. Whereas NDVI is biased positively in forward scatter view directions, the EVI responds
more positively to backscatter (sunlit vegetation) view directions, however, since MODIS CV-
MVC compositing is based on NDVI values, any positive bias present in NDVI pixel selection
will result in a negative bias in EVI values, or underestimation of greenness. In a compositing
study of MODIS and AVHRR daily data for mapping burned area over the Iberian Peninsula,
Chuvieco et al. [25] found the standard MODIS compositing procedure provided close to nadir
observation angles and good spatial coherency, while the traditional MVC compositing criterion
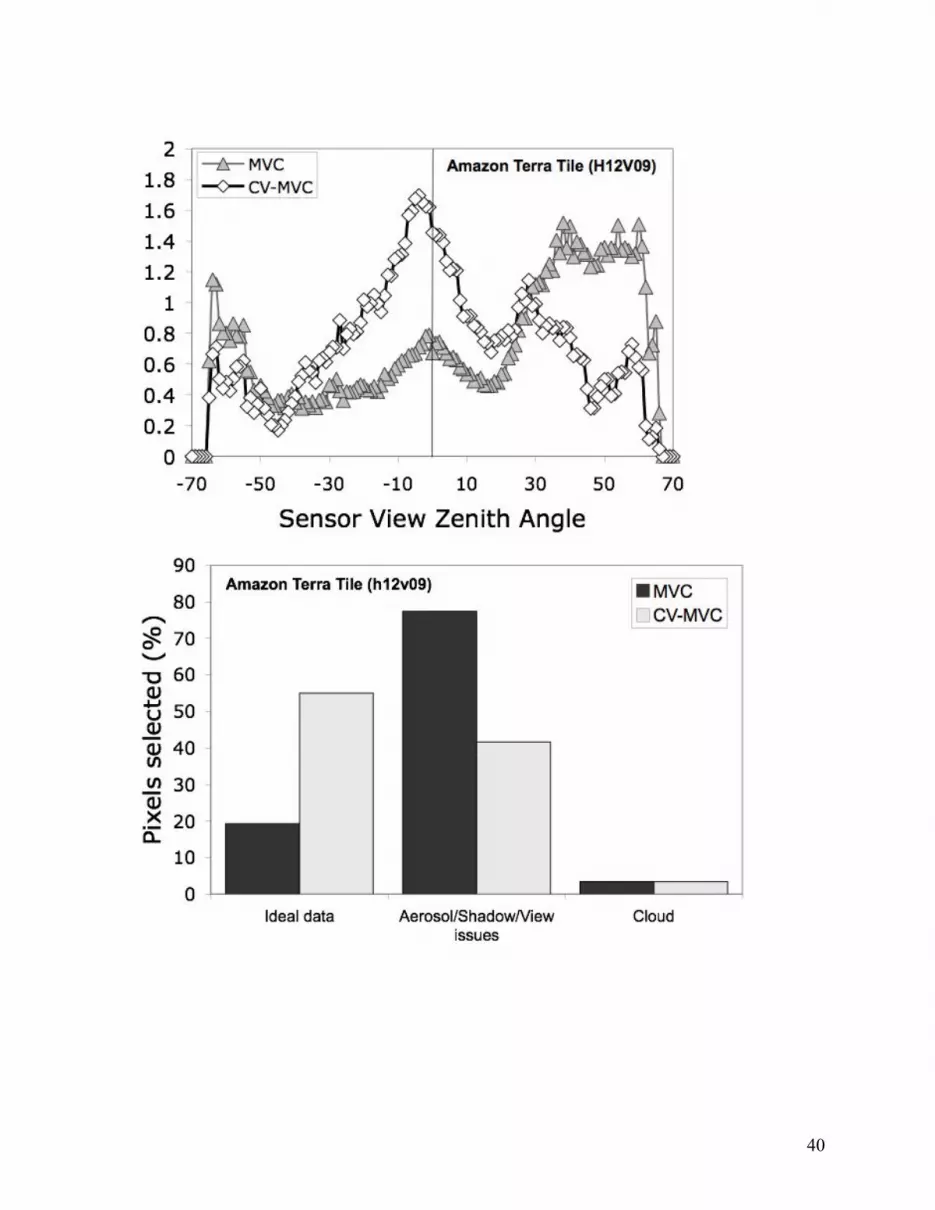
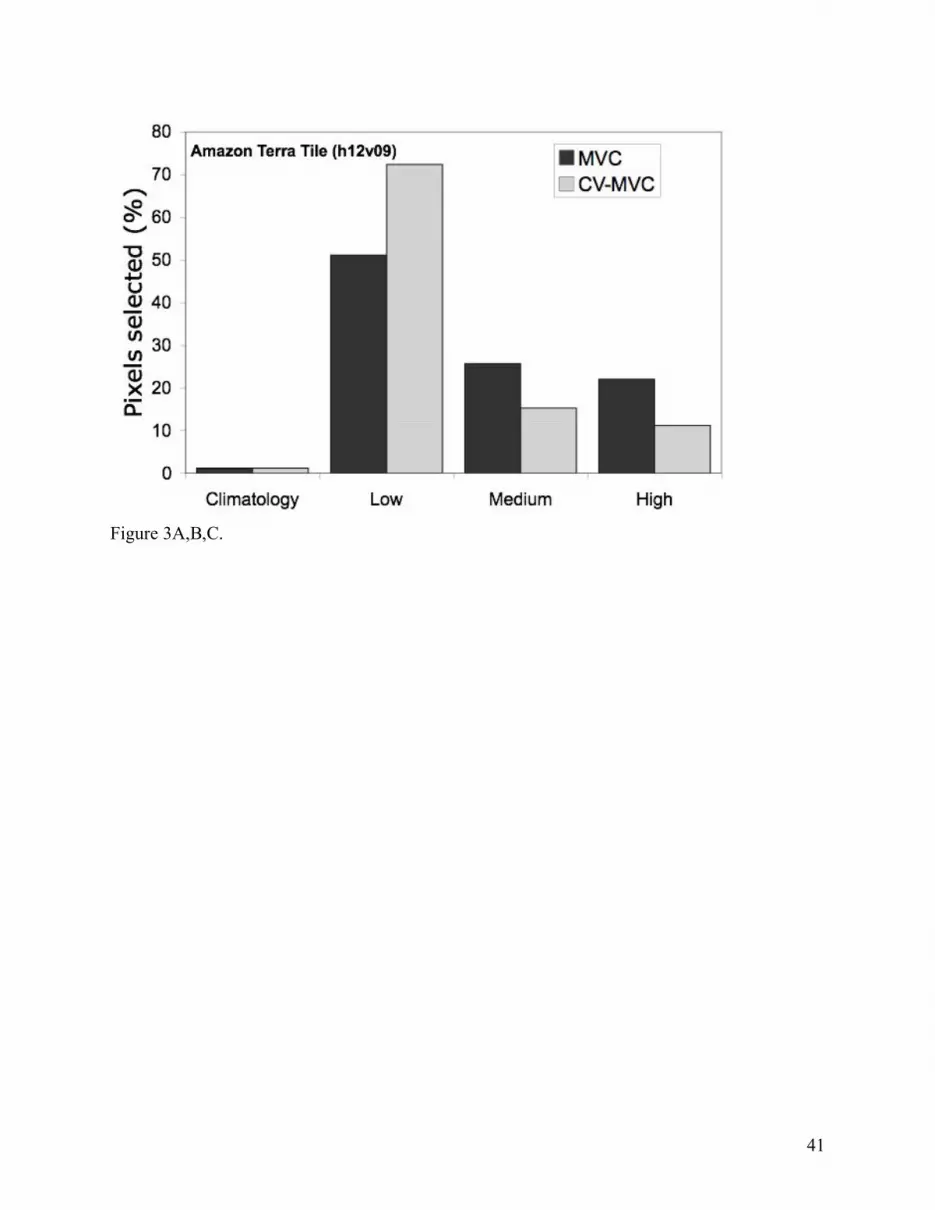
of maximizing NDVI values provided poor results. A comparison of the MODIS VI compositing
algorithm with the heritage MVC technique over an Amazon tile, show the significant reductions
in view angle influences and improvements in the quality of pixel selection (Fig. 3).
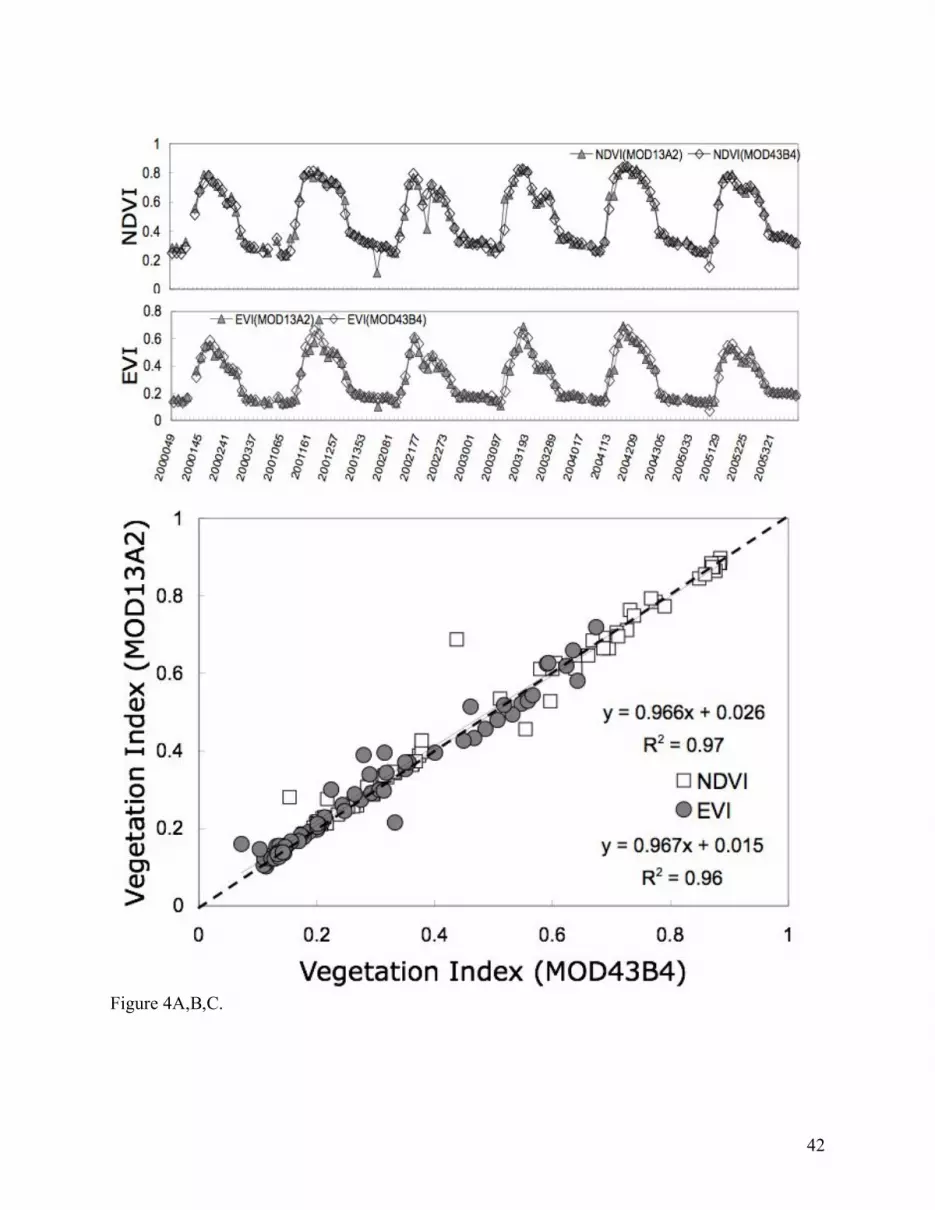
An alternative method to assess how well view angle variations are constrained is to
compare the VI product with VIs generated with the MODIS Nadir BRDF-Adjusted Reflectance
(NBAR) products, MOD43B4 and MCD43A4, which are generated at 1 km/ 16-day and 500 m/
8-day intervals, respectively [26] (Fig. 4). The NBAR product generates nadir reflectances
through BRDF model inversions applied to seven or more good QA and cloud-free acquisitions
within a 16-day composite cycle. Crossplots of NBAR VI with the standard VI product over 3
vegetation types reveal fairly consistent values with relatively small view angle biases (Fig. 4b).
The MODIS VI and NBAR products are produced at local solar zenith angle, and thus both
contain latitudinal and seasonal sun angle influences. Although sun angle bias may be significant
Page 11
11
seasonally, it is less of a problem in inter-annual time series data and trend analyses, as long as
there is no sensor orbital drift [18].
4.2. Atmosphere & clouds
The primary inputs to the MODIS compositing algorithm are atmospherically-corrected
surface reflectances (MOD09), resulting in a more accurate and consistent MODIS VI product.
However, residual effects and artifacts will invariably persist and aerosol mis-corrections may
occur with high aerosol pixels not corrected to the same accuracy as low aerosol pixels. There
are also uncertainties in aerosol correction due to assumptions in the ‘dark object subtraction’
and/ or use of aerosol climatology as well as the use of aerosol input parameters at coarser (> 10
km) resolution than the 250m to 1km VI pixels. Kaufman et al. [27] found significant problems
in aerosol correction attributed to residual cirrus and lower level cloud contamination and noted
the difficulty of defining cloud contamination versus aerosol growth. As a result, there may be
significant positive as well as negative error biases associated with atmospheric correction. An
overcorrection of aerosols will result in abnormally low red reflectances and very high VI values,
especially affecting the red-sensitive NDVI. The VIs are particularly sensitive to any
disproportionate correction of the red and NIR bands. The inclusion of the blue band may
improve or introduce more uncertainties in the EVI, however, the EVI was found to stabilize
atmospheric aerosol effects in the Amazon [28] and Northern Asia [14].
4.3 Biophysical validation
An important aspect in validating VIs concerns their ability to capture essential
biophysical phenomena with adequate fidelity and with minimal influences from the non-green
component of pixels (soil, non-photosynthetic vegetation). Numerous relationships between VIs
Page 12
12
and biophysical vegetation properties have been reported over the variable structural assemblages
of chlorophyll, vegetation cover, and LAI per plant species or biome type. VI sensitivities and
relationships are mostly based on empirical field measurements [29] and canopy radiative
transfer models [30]. Significant, but non-linear relationships have been found between NDVI
and EVI with field-derived LAI values in higher resolution satellite data (e.g. using Landsat data
in coniferous forest sites in Siberia [31]), and poorer relationships are common when using
coarser MODIS and SPOT-VGT VIs (e.g. NDVI - LAI relationships in a beech deciduous forest
in Europe varied significantly over different phenology periods, with poor correlations during
periods of maximum LAI due to saturation of NDVI [32]). Cohen et al. [29] also showed only
weak correlations between field measured LAI and several MODIS products, including VIs.
However, LAI is very difficult to measure on the ground, particularly at scales consistent with
MODIS measurements. There is evidence that EVI enables extended sensitivity over higher LAI/
biomass areas whereas the NDVI saturates [33]. Houborg and Soegaard [34] found MODIS EVI
was able to accurately describe the variation in green biomass, in agriculture areas in Denmark,
up to a maximum green LAI of 5 (r2=0.91).
On the other hand, the lack of a direct correspondence between VIs and canopy
biophysical properties, such as LAI or Fg, does not compromise the utility of VIs in predicting
biophysical processes such as photosynthesis or transpiration. Monteith and Unsworth [35]
noted that VIs can legitimately be used to estimate the rate of processes that depend on absorbed
light, such as primary production and transpiration, whereas the relationship of LAI or Fg to
absorbed PAR is strongly non-linear and depends on leaf architecture and spectral properties.
Furthermore, photosynthesis and transpiration are not evenly distributed through the canopy, but
are driven mainly by light absorbed by leaves (LAI) at the top of canopy.
Page 13
13
Field- and MODIS-based NDVI have been shown to be linear with fPAR across several
biome types and its integral over the growing season has been correlated with ecosystem net
primary production (NPP) [36, 37]. However, soil background variations introduce noise and
uncertainty in NDVI-biophysical relationships on the same order of magnitude as atmosphere
contamination [1, 38]. Strong, soil-dependent discrepancies in fPAR - NDVI relationships are
seen in which NDVI linearly varies with fPAR in canopies with bright soil backgrounds, while
the simple ratio (NIR/red) is linear with fPAR in canopies underlain with darker soil
backgrounds [39], hence a non-linear NDVI relationship with fPAR. The type of soil background
not only alters VI-biophysical relationships but affects their degree of linearity with important
consequences to scaling [8].
The EVI has also been found useful in estimating fPAR in vegetated canopies, with
relationships that are largely independent of soil background [15, 40]. Zhang et al. [41] used
MODIS data and a coupled leaf-canopy radiative transfer model (PROSAIL-2) and showed
significant differences between fPAR absorbed by a canopy (fPARcanopy) and fPAR absorbed by
leaf chlorophyll (fPARchl) in a broadleaf forest canopy, noting that only fPARchl is used for
photosynthesis and useful in quantifying primary production. They found MODIS NDVI
approximated fPARcanopy while EVI was closely coupled with fPARchl. This was also
demonstrated in [40, 42] with MODIS seasonal analyses in both needleleaf and broadleaf forests,
suggesting the EVI may be more simply related to the chlorophyll content or greenness of the
canopy.
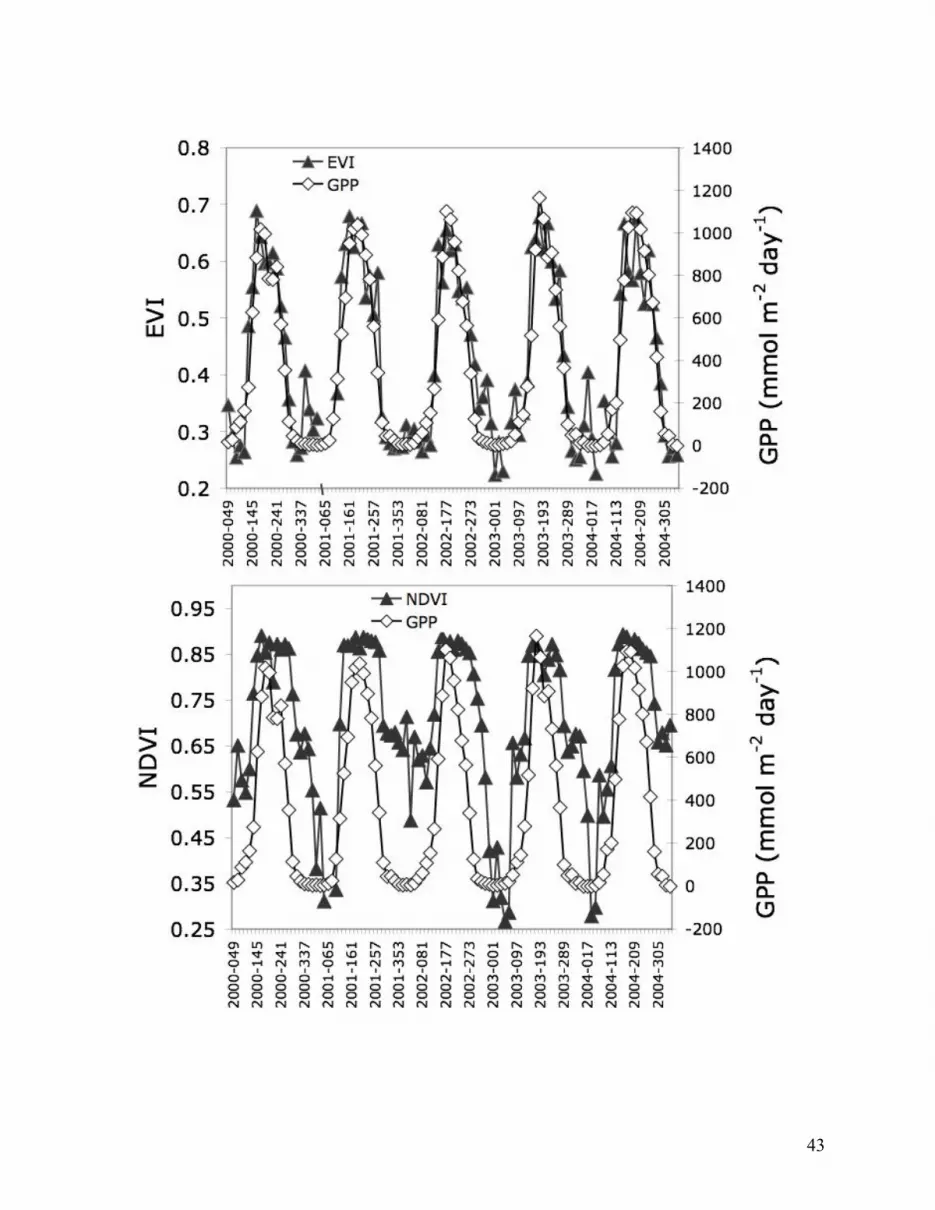
MODIS EVI has been shown to be highly correlated with gross primary productivity
(GPP) across a wide series of Ameriflux tower sites in North America [43, 44]. An example of
how well seasonal EVI tracks tower-calibrated GPP measurements of carbon fluxes at the
Page 14
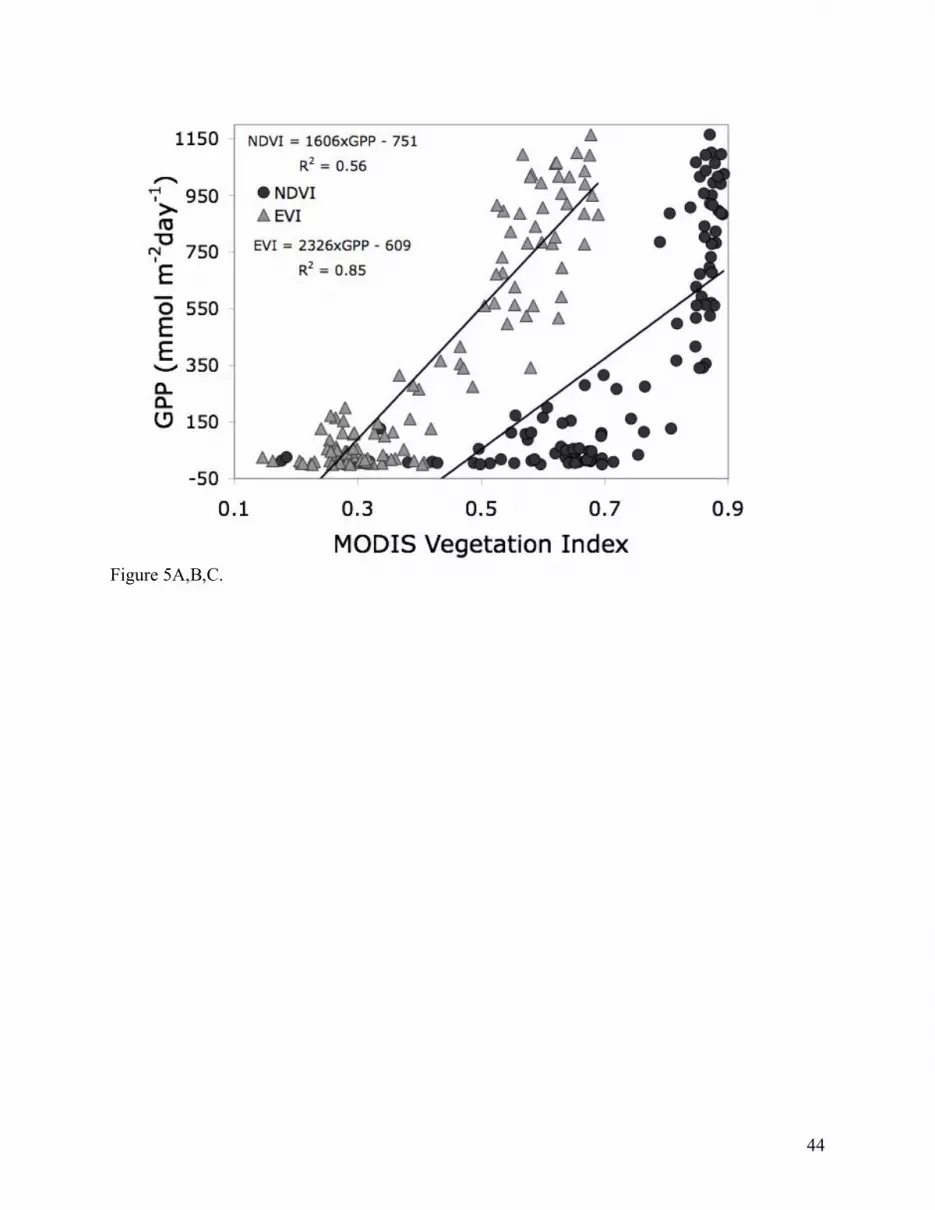
14
Harvard Forest site is shown in Fig. 5. In the case of NDVI, there is some saturation and an
overestimation of GPP, particularly after the peak of the growing season, a problem also
observed with MODIS NDVI at the Sky Oaks savanna field site [45]. The use of tower flux
measurements with remote sensing illustrates the power of integrating remote sensing and
ground data. The generality of local, single-tower site studies may be questioned, and
unexpected remote sensing observations may be due to artifacts (arising, for example, from a
seasonal interference pattern induced by cloud cover, aerosol, or sun angle), but the consistency
between the independent VI and tower-derived flux observations, lends confidence to both
findings.
With each MODIS product revision, or Collection, there are improvements in product
quality and product uncertainties and accuracies are better characterized. To guide the user
community in assessing the quality of individual MODIS products, various levels or stages of
validation have been defined [46]. The Collection 5 MODIS VI products are at stage 2
validation, i.e., their performance has been assessed over a widely distributed set of locations and
time periods with several in-situ and validation efforts. The highest, stage 3 validation, will
require complete and global product accuracy characterization in a systematic and statistically
robust way.
5 . S c i e n c e & A p p l i c a t i o n s
5.1 Carbon and water science
Recent applications of highly calibrated MODIS VIs have demonstrated their utility in
studies of ecosystem functioning which affect net ecosystem exchange of CO2 and water
between the land and the atmosphere. Huete et al. [47] found a strong linear and consistent
Page 15
15
relationship between seasonal EVI and tower-calibrated gross primary production (GPP)
measurements of carbon fluxes in both intact rainforest and forest conversion to pasture and
agriculture sites in the Amazon and suggested that basin-wide carbon fluxes can be constrained
by integrating MODIS and local flux measurements. EVI provides a more direct relationship
than NDVI with photosynthesis in high LAI Amazon forests by relying on the more sensitive
NIR canopy reflectance which is less prone to saturate. This is supported through theoretical
analyses concluding that spectral indices that are more functional on the NIR best describe area-
averaged canopy photosynthetic capacities and gross primary productivity [39].
The strength of the relationship between tower GPP fluxes and MODIS EVI is generally
highest in deciduous forests and lower for evergreen sites, however, the EVI can be used to
estimate GPP with relatively high accuracy for most sites without direct consideration of light-
use efficiency (LUE), thus simplifying carbon balance models over most vegetation types [43,
44]. Yang et al. [48] developed a continental-scale measure of gross primary production by
integrating MODIS EVI and AmeriFlux data using support vector machines.
Most carbon exchange models use a relationship in which LUE is derived and scaled down
with meteorological information available, normally, at very coarse resolution. MODIS EVI data
was incorporated into the Vegetation Photosynthesis Model (VPM) to produce tower-calibrated
predictions of gross primary productivity across a series of biomes, including evergreen and
deciduous forest sites in temperate North America and in seasonally moist tropical evergreen
forest in the Amazon [42, 49],
GPP = (ε0 × T × W × P) × fPARPAV × PAR (3)
where fPARPAV is derived from EVI and maximum LUE (ε0) is reduced by the temperature (T),
Page 16
16
moisture (W), and phenology (P) scalars. Net Primary Productivity (NPP) was modeled with
monthly EVI inputs to the NASA- CASA (Carnegie Ames Stanford Approach) model and
closely resembled both the measured high- and low-seasonal carbon fluxes, enabling prediction
of peak growing season uptake rates of CO2 in irrigated croplands and moist temperate forests
[50].
Combined remote sensing and in-situ tower flux measurements have also yielded close
relationships with water fluxes [51]. Yang et al. [52] derived continental-scale estimates of
evapotranspiration (ET) by combining MODIS data with eddy covariance flux tower
measurements using an inductive machine learning technique called support vector machine
(SVM). MODIS EVI was found to be the most important explanatory factor in their fairly
accurate estimates of ET (root mean square of 0.62 mm d-1
). At regional scales, ET
measurements from nine flux towers established in riparian plant communities dominated by five
major plant types on the Middle Rio Grande, Upper San Pedro River, and Lower Colorado River
were found to correlate strongly with MODIS EVI values and the inclusion of maximum daily
air temperatures (Ta) measured at the tower sites further improved this relationship (r2=0.74)
[53]. ET measured at flux tower sites in semiarid riparian and upland grass and shrub plant
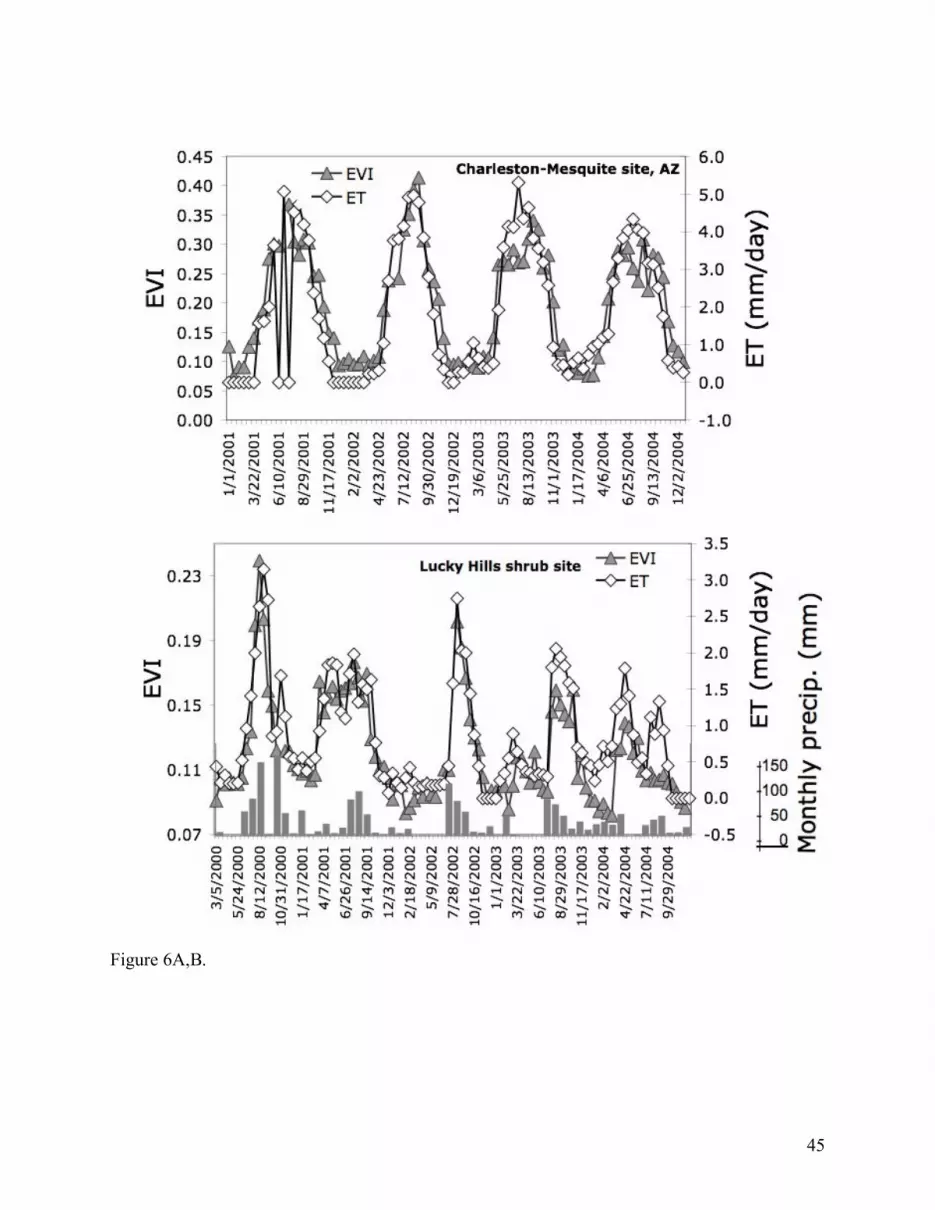
communities were also strongly correlated with MODIS EVI (r=0.80-0.94) [54]. Examples of
MODIS EVI- tower ET relationships at riparian and shrubland sites at the 2004 Soil Moisture
Experiment (SMEX04) are depicted in Fig. 6. Seasonal EVI profiles track ET fairly well when
transpiration dominates water fluxes, such as occurs in the riparian site and during interstorm
periods in the upland shrub site with coarse, well-drained soils [55].
The high direct correlation between VIs and GPP and ET in so many different
ecosystems may seem surprising since, in theory, CO2 and water exchanges are related not just to
Page 17
17
foliage density but to environmental variables (PAR, air temperature, vapor pressure deficit,
wind), which can vary considerably over short time periods. However, according to the
‘resource optimization paradigm’, plants tend to adjust their foliage density over time periods of
days to weeks, to match the level of photosynthesis that can be supported by the environment
[56].
5.2 Phenology studies
VIs are widely used in characterizing vegetation phenology (onset of greening and
subsequent browning and dormancy), which is critical to understanding ecosystem functioning
and associated seasonal patterns of carbon, water, and energy fluxes [57]. Phenology is also
important in quantifying ecosystem responses to climate variability and in coupling land
processes into global and regional climate models.
The extended sensitivity of the MODIS EVI has greatly facilitated phenology studies in
dense tropical rainforests [49, 58]. Using MODIS 250 m and CMG EVI, Huete et al. [47] were
able to detect phenological variations in greenness, attributed to leaf flushing and leaf exchange,
in densely vegetated Amazon tropical rainforests. They found rainforests to green-up by 25% in
the dry season in response to the availability of sunlight, a finding confirmed by close couplings
to tower-calibrated GPP measurements. Cleared forest areas, on the other hand, showed dry-
season declines in EVI, presumably because the more shallow-rooted vegetation had reduced
access to deep soil water. Ichii et al. [59] further combined MODIS EVI with the BIOME-BGC
(BioGeochemical Cycles), terrestrial ecosystem model to constrain spatial variability in rooting
depths of forest trees over the Amazon and improve the assessments of carbon, water and energy
cycles in tropical forests. They simulated seasonal variations in GPP with different rooting
Page 18
18
depths (1, 3, 5, and 10 m) at local and regional scales and determined which rooting depths
estimated GPP consistent with satellite-based observations, hence they were able to map rooting
depths across the Amazon with satellite data [59].
MODIS NDVI and EVI were used to characterize the phenology patterns and assess
woody plant crown cover across a gradient of physiognomic vegetation classes in the Brazilian
cerrado biome [60]. Kawamura et al. [61] monitored short-term phenological changes in
rangeland forage conditions with MODIS EVI in the semi-arid Xilingol steppe in Inner
Mongolia. They were able to estimate forage quantity and derive seasonal changes in live
biomass and standing crude protein concentration over areas with different grazing intensities,
useful in providing timing information for hay cutting based on nutritive value to range
managers. MODIS NDVI was successfully used to detect varying vegetation conditions caused
by locust infestation and provided a timely monitoring method of locust outbreaks in East China
[62].
AVHRR-NDVI time series analysis in high-latitude environments have been shown to be
particularly difficult due to the dominance of evergreen species with short growing seasons and
long periods of darkness with persistent snow cover in winter. Recently, however, Beck et al.
[63] applied double logistic functions to MODIS NDVI time series data and were able to
estimate biophysical parameters related to the timing of spring and autumn phenology events in
northern Scandinavia.
A MODIS- based algorithm was developed to generate timely and updated geospatial
information on paddy rice distributions for irrigation, food security, trace gas emission estimates,
and risk assessment of avian flu over South and Southeast Asia [64]. Initial periods of flooding
and the phenologic- growth patterns of paddy rice fields were assessed at regional scales with a
Page 19
19
three-index algorithm based on NDVI, EVI, and a Land Surface Water Index (LSWI) [64].
The MODIS vegetation phenology product (MOD12Q2) uses maximum inflections in
seasonal NBAR- derived EVI profiles to produce a global set of phenology metrics based on key
transition dates related to vegetation growth activity [65]. The NBAR- EVI has been
successfully used to map the phenology of single, double, and triple rice cropping patterns in the
Mekong delta where previously this was only accomplished with SAR data [66, 67]. NBAR-
EVI was also used to show the effect of urban climates on vegetation phenology transition dates
in North American cities [68]. Strong heat island effects were found in urban areas with
increases in the growing season of ~15 days and delays in the onset of dormancy, relative to
adjacent non-disturbed ecosystems, a pattern that decays exponentially with distance from urban
areas.
5.3 Societal Applications
MODIS VI data are routinely assimilated in a wide variety of different applications,
including agriculture, natural resource monitoring and forecasting systems, invasive species, pest
and famine early warning systems, and disease in support of scientific and societal purposes.
Several priority national application areas, such as Agricultural Efficiency, Carbon Management,
Disaster Management, Ecological Management, Homeland Security, Invasive Species, Public
Health and Water Management, assimilate MODIS VIs as part of their decision support tools of
value and benefit to resource management, policy decisions and resource exploration [69].
MODIS NDVI data are used in interactive monitoring tools for Famine Early
Warning Systems (FEWS) [70] and are assimilated into decision support systems operated by the
Production Estimates and Crop Assessment Division (PECAD) of the Foreign Agricultural
Page 20
20
Service (USDA-FAS) to disseminate global crop conditions and agricultural production
information for selected commodities at a global scale. The MODIS VI product is shared online
through Cropexplorer [71]. The Upper Midwest Aerospace Consortium provides a MODIS
NDVI data to farmers, ranchers, and foresters living in remote areas of the Upper Midwest, land
managers from the Native American Community, and Federal and State Agencies [72, 73].
An increasing number of natural resource managers are using web-based geospatial
decision support tools that integrate time series of both historical and current NDVI data derived
from multiple sensors to make better informed planning and management decisions [74].
MODIS VI data was used in an operational module, “Integrated Warning Deforestation System
for the Amazon” (SIAD), an initiative of the Brazilian government within the scope of the
Amazon Protection System (SIPAM) [75]. Jin and Sader [76] investigated the utility of MODIS
NDVI and reflectance products to detect and quantify forest disturbances in northern Maine.
MODIS VIs are also utilized as part of the Invasive Species Forecasting System (ISFS), a
successful partnership between multilevel agencies (USGS and NASA), academic institutions
and private organizations with the aim of monitoring the introduction and dissemination of
invasive species [77]. MODIS NDVI time series are used to predict potential invasive species
habitats so that control or preventative measures can be applied before irreversible changes occur
[78]. Using MODIS satellite NDVI, Franklin et al. [79] studied the negative impacts of an
invasive African grass species, buffelgrass (Pennisetum ciliare), on diversity of native rangeland
plant communities in Sonora, Mexico.
MODIS VIs contribute to carbon sequestration programs such as the web-based interface
(CASA-CQUEST Carbon Query and Evaluation Support Tools; [80]) to inform land managers
about carbon management and sequestration potential. Time series MODIS VI imagery are also
Page 21
21
used for epidemiological purposes (infectious and vector-borne diseases) to address many
environment-related health problems by visualizing regions that are either greener (wetter) than
average or less green (drier) than normal to aid in assessing outbreaks of Malaria, Rift Valley
Fever, and other mosquito-borne diseases [81].
6. VI Continuity and Long Term Data Records
Numerous satellite sensors useful for operational monitoring of Earth’s vegetation have
been launched and could be used to generate a seamless, long-term data record for global change
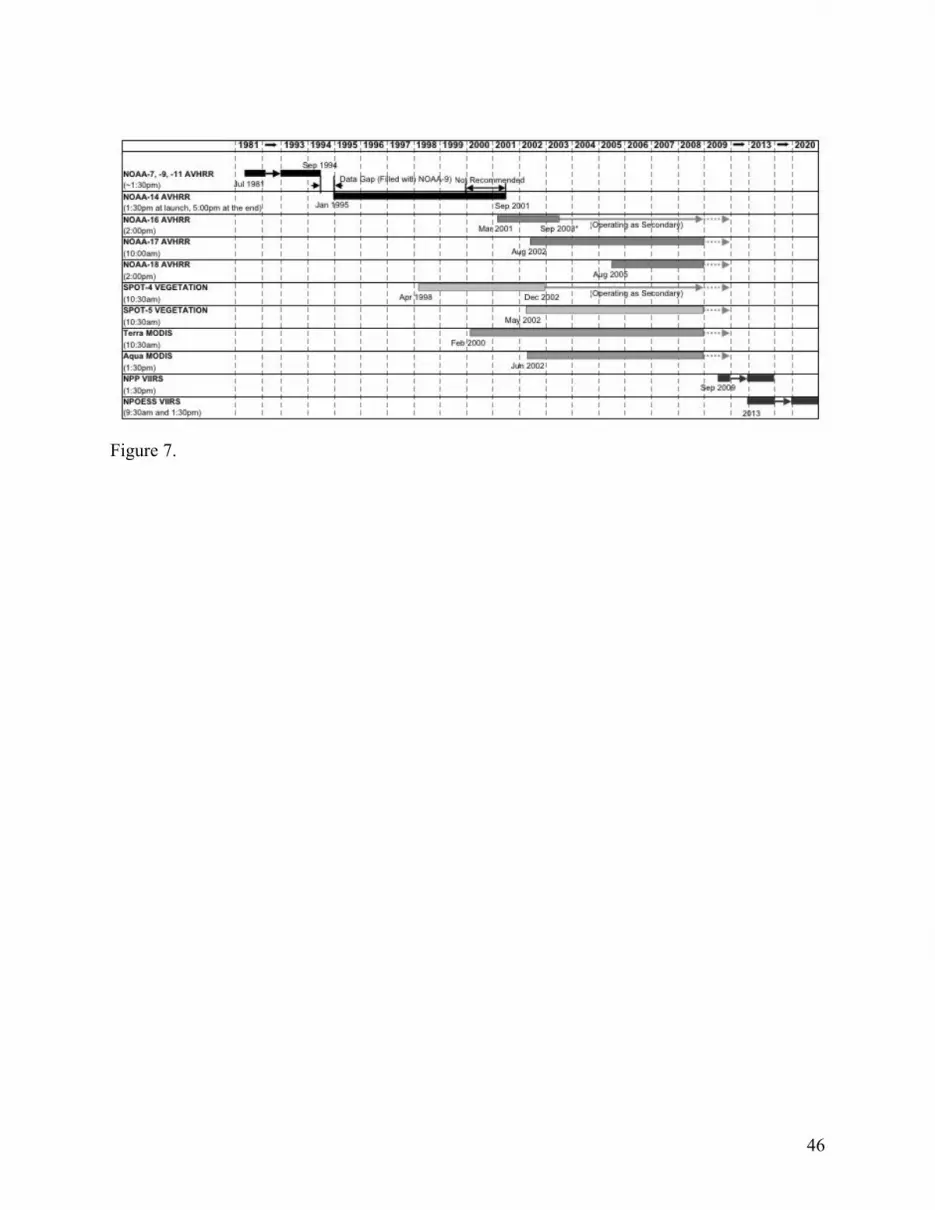
or climate change studies. The MODIS VI products will play an important role in extending VI
observations made previously with the AVHRR sensors and bridge a VI data record into the
follow-on operational sensor, the Visible Infrared Imaging Radiometer Suite (VIIRS) to be
launched as part of the National Polar Orbiting Environmental Sensor Suite (NPOESS)
Preparatory Project (NPP) (Fig. 7).
The MODIS and VIIRS sensors have similar bandwidths in the red (620-670 and 600-
680nm, respectively) and NIR (841-876 and 845-884nm, respectively) portions of the spectrum,
but differ in their blue channels (459-479 and 478-498nm, respectively), which may present
problems with EVI continuity [82]. The VIIRS pixel size is coarser than MODIS (375m vs
250m in the red and NIR) but finer than AVHRR (1.1km). The bandwidths of both sensors vary
considerably from those of the AVHRR, which may present challenges in data continuity and
fusion. A greater sensitivity and dynamic range of MODIS-NDVI in comparison with AVHRR-
NDVI have been shown and attributed to the higher spatial resolutions and narrower red and NIR
spectral bandwidths of MODIS which avoid atmospheric water vapor influences [9, 33, 74, 83,
84]. In a study of NDVI-LAI relationships with NOAA-14 AVHRR, SPOT-4 VGT, and Terra
Page 22
22
MODIS data, Wang et al. [32] found significant differences in slope, intercept, and strengths of
relationships.
However, recent operational water vapor corrections applied to AVHRR/3 data and the
narrower bandwidth of AVHRR/3 channel 1, have resulted in near 1:1 linear relationships in 1
km NDVI values derived from overlapping time periods of NOAA-16 and -17 AVHRR/3, and
Terra and Aqua MODIS sensors [84, 85]. This suggests that it may be feasible to reprocess
historical AVHRR data sets to provide continuity of NDVI through the NPOESS era. Brown et
al. [86] demonstrated the consistency of long-term NDVI time series derived from AVHRR,
SPOT-VGT, SeaWiFS, and MODIS sensors. MODIS VI data from Terra and Aqua were shown
interchangeable, despite their overpass time differences (10:30 vs 13:30h) [84]. As a result, a
MODIS “combined” Terra+Aqua VI product that improves temporal compositing frequency
from 16 to 8 days was accomplished in Collection 5, by offsetting the Aqua 16-day composite
with an 8-day phase difference so that the 2 products can be merged to generate VIs that are 8
days apart.
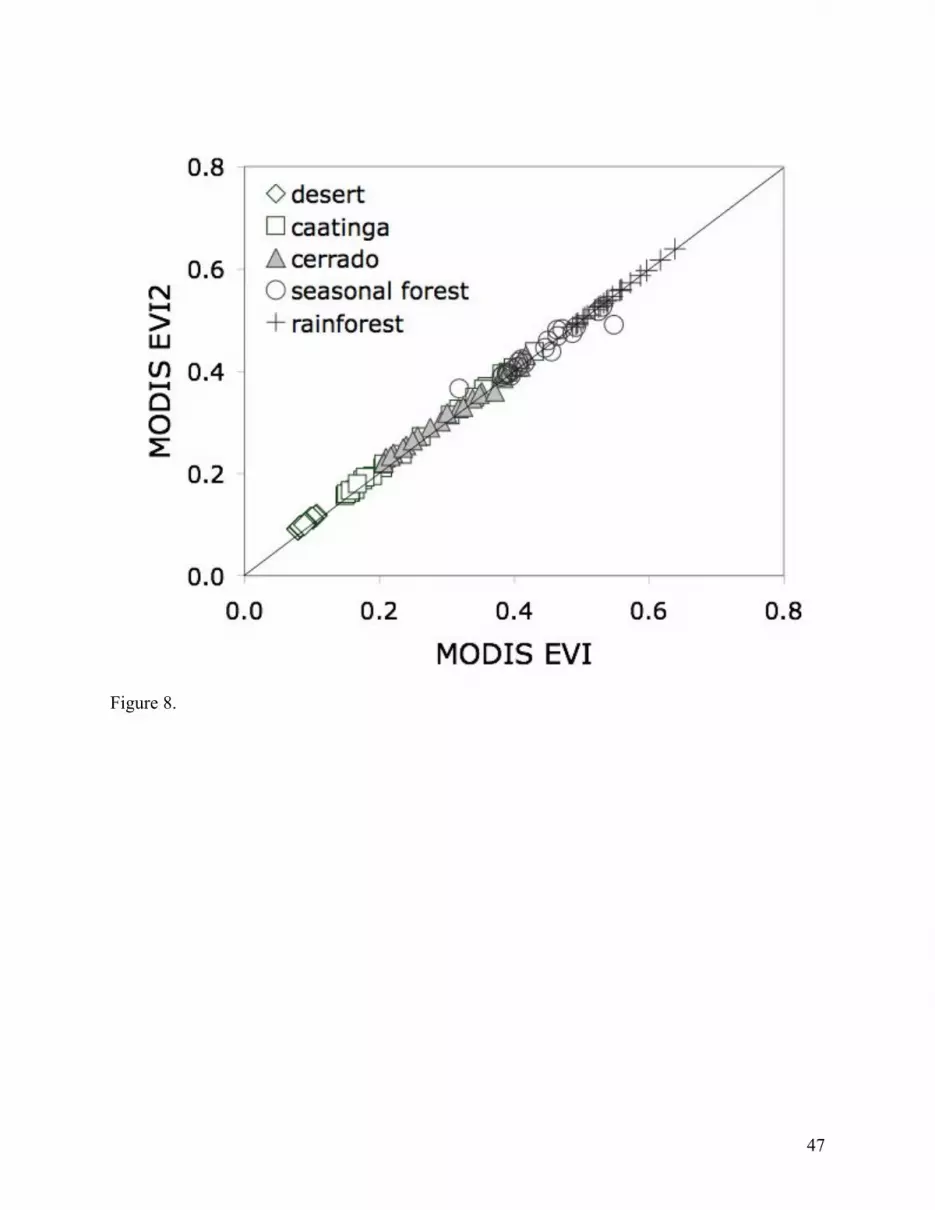
A backward compatibility of the EVI to the historical AVHRR record to complement the
NDVI is also feasible. The EVI uses a blue band to minimize residual atmospheric effects,
however, a 2-band ‘SAVI-like’ version can also be formulated when the ‘blue band’ is
unavailable, as follows [87];
EVI2 = 2.5 (ρNIR - ρred) / (1+ ρNIR + 2.4 ρred) (5)
Although the EVI2 is computed without a blue band, it remains functionally-equivalent to the
EVI, although slightly more prone to aerosol noise, which may become less significant with
Page 23
23
continuing advancements in atmosphere correction (Fig. 8). Currently, the EVI2 is used as a
backup equation in the MODIS EVI product when snow cover problems render the product
unstable. Yoshioka et al. [88] developed a “bottom-to-top” approach in translating the NDVI
from one sensor to another, whereby vegetation isoline equations originally developed to model
the behavior of red vs. NIR reflectances were applied to red vs. red and NIR vs. NIR reflectances
between two sensors. This theoretical approach provided a better mechanistic understanding and
predictive modeling of cross-sensor relationships for the NDVI and input reflectances as well as
other VIs, such as EVI.
7. Conclusions
Since the respective launches of the Terra and Aqua platforms, MODIS VI products have
provided highly calibrated and frequent global measurements of the land surface for monitoring
of vegetation dynamics, landscape phenology, and productivity. As outlined in this chapter, new
advancements in earth system science and in operational applications of satellite data have been
made with the MODIS VI products. In contrast to previous satellite observations with AVHRR-
NDVI, the MODIS VI products are generated at higher spatial resolution and with negligible
water vapor influences and lower cloud and aerosol contamination. Furthermore, a second
index, EVI, offers extended sensitivity into high biomass/ LAI canopies and has provided
stronger relationships with canopy biophysical processes, such as photosynthesis and
transpiration. The two VIs complement each other and offer a more complete characterization of
the entire range of surface biophysical/chemical information and processes taking place in
vegetated canopies. Although, the literature has thus far shown the strong utility of both MODIS
NDVI and EVI, further research and consensus would be valuable in resolving specific VI
Page 24
24
relationships with canopy properties (chlorophyll content, fPAR, LAI, Fg) and biophysical
processes (photosynthesis and transpiration). This will facilitate their inputs to biogeochemical,
hydrologic, and productivity models as well as allow on-demand biophysical products to be
derived from the VI data record.
Much of the success in the operational use of VIs resides in their simplicity and ready
fusion with data from other sensor systems and platforms. VIs are easily measured on the ground
and field-derived biophysical relationships can be scaled through finer-grained satellite data or
directly to MODIS resolutions. The MODIS VIs are an integral component in the continued
development of long term time series applications and climate data records and the proposed
AVHRR/MODIS/VIIRS satellite time series will provide a critical long-term VI data record for
Earth studies.
8 . R e f e r e n c e s
[1] B. J. Choudhury, "Relationships between vegetation indices, radiation absorption, and net
photosynthesis evaluated by a sensitivity analysis," Remote Sensing of Environment, vol.
22, pp. 209-233, 1987.
[2] C. J. Tucker, "Red and photographic infrared linear combinations for monitoring
vegetation," Remote Sensing of Environment, vol. 8, pp. 127-150, 1979.
[3] K. P. Gallo and J. C. Eidenshink, "Differences in visible and near-IR responses, and
derived vegetation indices, for the NOAA-9 and NOAA-10 AVHRRs: A case study,"
Photogrammetric Engineering and Remote Sensing, vol. 54, pp. 485-490, 1988.
Page 25
25
[4] A. R. Huete, "A soil-adjusted vegetation index (SAVI)," Remote Sensing of Environment,
vol. 25, pp. 295-309, 1988.
[5] N. Gobron, Pinty, B., Verstraete, M.M., & Widlowski, J.L., "Advanced vegetation
indices optimized for up-coming sensors: Design, performance, and applications," IEEE
Trans. Geosci. & Remote Sensing, vol. 38, pp. 2489-2505, 2000.
[6] C. J. Tucker, J. E. Pinzon, M. E. Brown, D. A. Slayback, E. W. Pak, R. Mahoney, E. F.
Vermote, and N. El Saleous, "An extended AVHRR 8-km NDVI dataset compatible with
MODIS and SPOT vegetation NDVI data," International Journal of Remote Sensing, vol.
26, pp. 4485-4498, 2005.
[7] R. B. Myneni, C. D. Keeling, C. J. Tucker, G. Asrar, and R. R. Nemani, "Increased plant
growth in the northern high latitudes from 1981 to 1991," Nature, vol. 386, pp. 698-702,
1997.
[8] Z. Jiang, A. R. Huete, J. Chen, Y. Chen, J. Li, G. Yan, and X. Zhang, "Analysis of NDVI
and scaled difference vegetation index retrievals of vegetation fraction," Remote Sensing
of Environment, vol. 101, pp. 366-378, 2006.
[9] A. Huete, K. Didan, T. Miura, E. P. Rodriguez, X. Gao, and L. G. Ferreira, "Overview of
the radiometric and biophysical performance of the MODIS vegetation indices," Remote
Sensing of Environment, vol. 83, pp. 195-213, 2002.
[10] Y. Kaufman and D. Tanré, "Atmospherically Resistant Vegetation Index (ARVI) for
EOS-MODIS," IEEE Transactions on Geoscience and Remote Sensing, vol. 30, pp. 261-
270, 1992.
Page 26
26
[11] A. Huete, "Soil influences in remotely-sensed vegetation canopy spectra," in Theory and
Applications of Optical Remote Sensing, G. Asrar, Ed. New York: John Wiley & Sons,
1989, pp. 107-141.
[12] H. Liu and A. Huete, "A feedback based modification of the NDVI to minimize canopy
background and atmospheric noise," IEEE Transactions on Geoscience and Remote
Sensing, vol. 33, pp. 457-465, 1995.
[13] T. Miura, Huete, A. R., van Leeuwen, W. J. D., Didan, K., "Vegetation detection through
smoke-filled AVIRIS images: An assessment using MODIS band passes," J. Geophys.
Research, vol. Vol. 103, pp. p.32,001-32,012., 1998.
[14] X. Xiao, B. Braswell, Q. Zhang, S. Boles, S. Frolking, and I. Moore, Berrien, "Sensitivity
of vegetation indices to atmospheric aerosols: continental-scale observations in Northern
Asia," Remote Sensing of Environment, vol. 84, pp. 385-392, 2003.
[15] X. Gao, A. R. Huete, W. Ni, and T. Miura, "Optical-biophysical relationships of
vegetation spectra without background contamination," Remote Sensing of Environment,
vol. 74, pp. 609-620, 2000.
[16] B. N. Holben, "Characteristics of maximum-value composite images from temporal
AVHRR data," International Journal of Remote Sensing, vol. 7, pp. 1417-1434, 1986.
[17] J. Cihlar, D. Manak, and N. Voisin, "AVHRR bidirectional reflectance effects and
compositing," Remote Sensing of Environment, vol. 48, pp. 77-88, 1994.
[18] S. O. Los, P. R. J. North, W. M. F. Grey, and M. J. Barnsley, "A method to convert
AVHRR Normalized Difference Vegetation Index time series to a standard viewing and
illumination geometry," Remote Sensing of Environment, vol. 99, pp. 400-411, 2005.
Page 27
27
[19] G. Gutman and A. Ignatov, "The derivation of the green vegetation fraction from
NOAA/AVHRR data for use in numerical weather prediction models," International
Journal of Remote Sensing, vol. 19, pp. 1533-1543, 1998.
[20] A. R. Huete, Liu, H., "An error and sensitivity analysis of the atmospheric- and soil-
correcting variants of the NDVI for MODIS-EOS," IEEE Transactions on Geoscience
and Remote Sensing, vol. 32, pp. 897-905, 1994.
[21] T. Miura, A. R. Huete, and H. Yoshioka, "Evaluation of sensor calibration uncertainties
on vegetation indices for MODIS," IEEE Transactions on Geoscience and Remote
Sensing, , vol. 38, pp. 1399-1409, 2000.
[22] X. Gao, Huete, A.R., and Didan, K., "Multisensor comparisons and validation of MODIS
vegetation indices at the semiarid Jornada Experimental Range," IEEE Transactions on
Geoscience and Remote Sensing, vol. 41, pp. 2368- 2381, 2003.
[23] A. Huete, Keita, F., Thomé, K., Privette, J., van Leeuwen, W.J.D., Justice, C., Morisette,
J., "A light aircraft radiometric package for MODLAND quick airborne looks
(MQUALS)," Earth Observer, vol. 11, pp. 22, 1999.
[24] R. Fensholt, I. Sandholt, S. Stisen, and C. Tucker, "Analysing NDVI for the African
continent using the geostationary meteosat second generation SEVIRI sensor," Remote
Sensing of Environment, vol. 101, pp. 212-229, 2006.
[25] E. Chuvieco, G. Ventura, M. P. Martin, and I. Gomez, "Assessment of multitemporal
compositing techniques of MODIS and AVHRR images for burned land mapping,"
Remote Sensing of Environment, vol. 94, pp. 450-462, 2005.
Page 28
28
[26] C. B. Schaaf, F. Gao, A. H. Strahler, W. Lucht, X. Li, T. Tsang, N. C. Strugnell, X.
Zhang, Y. Jin, and J.-P. Muller, "First operational BRDF, albedo nadir reflectance
products from MODIS," Remote Sensing of Environment, vol. 83, pp. 135-148, 2002.
[27] Y. J. Kaufman, L. A. Remer, D. Tanre, Rong-Rong Li, R. Kleidman, S. Mattoo, R. C.
Levy, T. F. Eck, B. N. Holben, C. Ichoku, J. V. Martins, and I. Koren, "A critical
examination of the residual cloud contamination and diurnal sampling effects on MODIS
estimates of aerosol over ocean," IEEE Transactions on Geoscience and Remote Sensing,
vol. 43, pp. 2886-2897, 2005.
[28] T. Miura, A. R. Huete, H. Yoshioka, and B. N. Holben, "An error and sensitivity analysis
of atmospheric resistant vegetation indices derived from dark target-based atmospheric
correction," Remote Sensing of Environment, vol. 78, pp. 284-298, 2001.
[29] W. B. Cohen, T. K. Maiersperger, Z. Yang, S. T. Gower, D. P. Turner, W. D. Ritts, M.
Berterretche, and S. W. Running, "Comparisons of land cover and LAI estimates derived
from ETM+ and MODIS for four sites in North America: a quality assessment of
2000/2001 provisional MODIS products," Remote Sensing of Environment, vol. 88, pp.
233-255, 2003.
[30] K. F. Huemmrich, "The GeoSail model: a simple addition to the SAIL model to describe
discontinuous canopy reflectance," Remote Sensing of Environment, vol. 75, pp. 423-431,
2001.
[31] X. Chen, L. Vierling, D. Deering, and A. Conley, "Monitoring boreal forest leaf area
index across a Siberian burn chronosequence: a MODIS validation study," International
Journal of Remote Sensing, vol. 26, pp. 5433 - 5451, 2005.
Page 29
29
[32] Q. Wang, S. Adiku, J. Tenhunen, and A. Granier, "On the relationship of NDVI with leaf
area index in a deciduous forest site," Remote Sensing of Environment, vol. 94, pp. 244-
255, 2005.
[33] R. Fensholt, "Earth observation of vegetation status in the Sahelian and Sudanian West
Africa: comparison of terra MODIS and NOAA AVHRR satellite data," International
Journal of Remote Sensing, vol. 25, pp. 1641-1659, 2004.
[34] R. M. Houborg and H. Soegaard, "Regional simulation of ecosystem CO2 and water
vapor exchange for agricultural land using NOAA AVHRR and Terra MODIS satellite
data. Application to Zealand, Denmark," Remote Sensing of Environment, vol. 93, pp.
150-167, 2004.
[35] J. L. Monteith and M. H. Unsworth, Principles of Environmental Physics, 2 ed. London:
Arnold, 1990.
[36] G. Asrar, M. Fuchs, E. T. Kanemasu, and S. L. Hatfield, "Estimating absorbed
photosynthetic radiation and leaf area index from spectral reflectance in wheat,"
Agronomy Journal, vol. 76, pp. 300-306, 1984.
[37] K.F. Huemmrich, J. L. Privette, M. Mukelabai, R. B. Myneni, Y. Knyazikhin,
"Time‐series validation of MODIS land biophysical products in a Kalahari woodland,
Africa", International Journal of Remote Sensing, vol. 26, pp. 4381 – 4398, 2005.
[38] S. N. Goward and K. F. Huemmrich, "Vegetation canopy PAR absorptance and the
normalized difference vegetation index: An assessment using the SAIL model," Remote
Sensing of Environment, vol. 39, pp. 119-140, 1992.
Page 30
30
[39] P. J. Sellers, "Canopy reflectance, photosynthesis, and transpiration, II. The role of
biophysics in the linearity of their interdependence," Remote Sensing of Environment,
vol. 21, pp. 143-183, 1987.
[40] X. Xiao, Q. Zhang, B. Braswell, S. Urbanski, S. Boles, S. Wofsy, I. Moore, Berrien, and
D. Ojima, "Modeling gross primary production of temperate deciduous broadleaf forest
using satellite images and climate data," Remote Sensing of Environment, vol. 91, pp.
256-270, 2004.
[41] Q. Zhang, X. Xiao, B. Braswell, E. Linder, F. Baret, and B. Moore Iii, "Estimating light
absorption by chlorophyll, leaf and canopy in a deciduous broadleaf forest using MODIS
data and a radiative transfer model," Remote Sensing of Environment, vol. 99, pp. 357-
371, 2005.
[42] X. M. Xiao, Q. Y. Zhang, D. Hollinger, J. Aber, and B. Moore, "Modeling gross primary
production of an evergreen needleleaf forest using modis and climate data," Ecological
Applications, vol. 15, pp. 954-969, 2005.
[43] A. F. Rahman, D. A. Sims, V. D. Cordova, B. Z. El-Masri, "Potential of MODIS EVI and
surface temperature for directly estimating per-pixel ecosystem C fluxes," Geophysical
Research Letters, vol. 32, L19404, doi:10.1029/2005GL024127, 2005.
[44] D. A. Sims, Rahman, A.F., Cordova, V.D., El-Masri, B.Z., Baldocchi, D.D., Flanagan,
L.B., Goldstein, A.H., Hollinger, D.Y., Misson, L., Monson, R.K., Oechel, W.C.,
Schmid, H.P., Wofsy, S.C., Xu, L., "On the use of MODIS EVI to assess gross primary
productivity of North American ecosystems," Journal of Geophysical Research, vol. 111,
G04015, doi:10.1029/2006JG000162, 2006.
Page 31
31
[45] Y. Cheng, J. A. Gamon, D. A. Fuentes, Z. Mao, D. A. Sims, H.-l. Qiu, H. Claudio, A.
Huete, and A. F. Rahman, "A multi-scale analysis of dynamic optical signals in a
Southern California chaparral ecosystem: A comparison of field, AVIRIS and MODIS
data," Remote Sensing of Environment, vol. 103, pp. 369-378, 2006.
[46] J. T. Morisette, J. L. Privette, and C. O. Justice, "A framework for the validation of
MODIS Land products," Remote Sensing of Environment, vol. 83, pp. 77-96, 2002.
[47] A. R. Huete, K. Didan, Y. E. Shimabukuro, P. Ratana, S. R. Saleska, L. R. Hutyra, W.
Yang, R. R. Nemani, R. Myneni, "Amazon rainforests green-up with sunlight in dry
season," Geophysical Research Letters, vol. 33, L06405, doi:10.1029/2005GL025583,
2006.
[48] F. Yang, K. Ichii, M. A. White, H. Hashimoto, A. R. Michaelis, P. Votava, A. X. Zhu, A.
Huete, S. W. Running, and R. R. Nemani, "Developing a continental-scale measure of
gross primary production by combining MODIS and AmeriFlux data through Support
Vector Machine approach," Remote Sensing of Environment, vol. 110, pp. 109-122, 2007.
[49] X. Xiao, Q. Zhang, S. Saleska, L. Hutyra, P. De Camargo, S. Wofsy, S. Frolking, S.
Boles, M. Keller, and B. Moore III, "Satellite-based modeling of gross primary
production in a seasonally moist tropical evergreen forest," Remote Sensing of
Environment, vol. 94, pp. 105-122, 2005.
[50] C. Potter, S. Klooster, A. Huete, and V. Genovese, "Terrestrial Carbon Sinks for the
United States Predicted from MODIS Satellite Data and Ecosystem Modeling," Earth
Interactions, vol. 11, pp. 1-21, 2007.
Page 32
32
[51] E. P. Glenn, A. R. Huete, P. L. Nagler, K. K. Hirschboeck, and P. Brown, "Integrating
Remote Sensing and Ground Methods to Estimate Evapotranspiration," Critical Reviews
in Plant Sciences, vol. 26, pp. 139-168, 2007.
[52] F. Yang, M. A. White, A. R. Michaelis, K. Ichii, H. Hashimoto, P. Votava, A. X. Zhu,
and R. R. Nemani, "Prediction of continental-scale evapotranspiration by combining
MODIS and AmeriFlux data through support vector machine," IEEE Transactions on
Geoscience and Remote Sensing, vol. 44, pp. 3452-3461, 2006.
[53] P. L. Nagler, R. L. Scott, C. Westenburg, J. R. Cleverly, E. P. Glenn, and A. R. Huete,
"Evapotranspiration on western U.S. rivers estimated using the Enhanced Vegetation
Index from MODIS and data from eddy covariance and Bowen ratio flux towers,"
Remote Sensing of Environment, vol. 97, pp. 337-353, 2005.
[54] P. L. Nagler, J. Cleverly, E. Glenn, D. Lampkin, A. Huete, and Z. Wan, "Predicting
riparian evapotranspiration from MODIS vegetation indices and meteorological data,"
Remote Sensing of Environment, vol. 94, pp. 17-35, 2005.
[55] P. L. Nagler, E. P. Glenn, H. Kim, W. Emmerich, R. L. Scott, T. E. Huxman, and A. R.
Huete, "Relationship between evapotranspiration and precipitation pulses in a semiarid
rangeland estimated by moisture flux towers and MODIS vegetation indices," Journal of
Arid Environments, vol. 70, pp. 443-462, 2007.
[56] C. B. Field, J. T. Randerson, and C. M. Malmstrom, "Global net primary production:
Combining ecology and remote sensing," Remote Sensing of Environment, vol. 51, pp.
74-88, 1995.
Page 33
33
[57] B. C. Reed, White, M., and Brown, J.F., "Remote Sensing Phenology," in Phenology: An
Integrative Environmental Science, vol. 39 Tasks for Vegetation Science, M. D.
Schwartz, Ed. Dordrecht, The Netherlands: Kluwer Academic Publishers, 2003, pp. 569.
[58] X. Xiao, S. Hagen, Q. Zhang, M. Keller, and B. Moore Iii, "Detecting leaf phenology of
seasonally moist tropical forests in South America with multi-temporal MODIS images,"
Remote Sensing of Environment, vol. 103, pp. 465-473, 2006.
[59] K. Ichii, H. Hashimoto, M. A. White, C. Potter, L. R. Hutyra, A. R. Huete, R. B. Myneni,
and R. R. Nemani, "Constraining rooting depths in tropical rainforests using satellite data
and ecosystem modeling for accurate simulation of gross primary production
seasonality," Global Change Biology, vol. 13, pp. 67-77, 2007.
[60] P. Ratana, Huete, A.R., Ferreira, L., "Analysis of cerrado physiognomies and conversion
in the MODIS seasonal-temporal domain," Earth Interactions, vol. 8, pp. 1-22, 2005.
[61] K. Kawamura, T. Akiyama, H. Yokota, M. Tsutsumi, T. Yasuda, O. Watanabe, G. Wang,
and S. Wang, "Monitoring of forage conditions with MODIS imagery in the Xilingol
steppe, Inner Mongolia," International Journal of Remote Sensing, vol. 26, pp. 1423 -
1436, 2005.
[62] Y. Zha, J. Gao, S. Ni, and N. Shen, "Temporal filtering of successive MODIS data in
monitoring a locust outbreak," International Journal of Remote Sensing, vol. 26, pp. 5665
- 5674, 2005.
[63] P. S. A. Beck, C. Atzberger, K. A. Hogda, B. Johansen, and A. K. Skidmore, "Improved
monitoring of vegetation dynamics at very high latitudes: A new method using MODIS
NDVI," Remote Sensing of Environment, vol. 100, pp. 321-334, 2006.
Page 34
34
[64] X. Xiao, S. Boles, S. Frolking, C. Li, J. Y. Babu, W. Salas, and B. Moore III, "Mapping
paddy rice agriculture in south and southeast Asia using multi-temporal MODIS images,"
Remote Sensing of Environment, vol. 100, pp. 95-113, 2006.
[65] X. Zhang, M. A. Friedl, C. B. Schaaf, A. H. Strahler, J. C. F. Hodges, F. Gao, B. C. Reed,
and A. Huete, "Monitoring vegetation phenology using MODIS," Remote Sensing of
Environment, vol. 84, pp. 471-475, 2003.
[66] T. Sakamoto, N. Van Nguyen, H. Ohno, N. Ishitsuka, and M. Yokozawa, "Spatio-
temporal distribution of rice phenology and cropping systems in the Mekong Delta with
special reference to the seasonal water flow of the Mekong and Bassac rivers," Remote
Sensing of Environment, vol. 100, pp. 1-16, 2006.
[67] T. Sakamoto, M. Yokozawa, H. Toritani, M. Shibayama, N. Ishitsuka, and H. Ohno, "A
crop phenology detection method using time-series MODIS data," Remote Sensing of
Environment, vol. 96, pp. 366-374, 2005.
[68] X. Zhang, M. A. Friedl, C. B. Schaaf, A. H. Strahler, A. Schneider "The footprint of
urban climates on vegetation phenology," Geophysical Research Letters, vol. 31,
L12209, doi:10.1029/2004GL020137, 2004.
[69] NASA Science Mission Directorate, http://science.hq.nasa.gov/ earth-sun/applications/
(last accessed 27 February 2008).
[70] USAID Famine Early Warning Systems, http://www.fews.net (last accessed 27 February
2008).
[71] USDA Foreign Agriculture Service, Crop Explorer,
http://www.pecad.fas.usda.gov/cropexplorer/ (last accessed 27 February 2008).
Page 35
35
[72] S. K. Seelan, S. Laguette, G. M. Casady, and G. A. Seielstad, "Remote sensing
applications for precision agriculture: A learning community approach," Remote Sensing
of Environment, vol. 88, pp. 157-169, 2003.
[73] Upper Midwest Aerospace Consortium, http://www.umac.org/content/umac/about.shtml
(last accessed 27 February 2008).
[74] W. J. D. van Leeuwen, B. J. Orr, S. E. Marsh, and S. M. Herrmann, "Multi-sensor NDVI
data continuity: Uncertainties and implications for vegetation monitoring applications,"
Remote Sensing of Environment, vol. 100, pp. 67-81, 2006.
[75] N. C. Ferreira, L. G. Ferreira, A. R. Huete, and M. E. Ferreira, "An operational
deforestation mapping system using MODIS data and spatial context analysis,"
International Journal of Remote Sensing, vol. 28, pp. 47 - 62, 2007.
[76] S. Jin and S. A. Sader, "MODIS time-series imagery for forest disturbance detection and
quantification of patch size effects," Remote Sensing of Environment, vol. 99, pp. 462-
470, 2005.
[77] USGS Invasive Species Forecasting System, http://isfs.gsfc.nasa.gov/ (last accessed 27
February 2008).
[78] J. L. Schnase, Stohlgren, T.J., Smith, J.A. , "The National Invasive Species Forecasting
System: A strategic NASA/USGS partnership to manage biological invasions," in Earth
Observing Magazine, vol. August, 2002, pp. 46-49.
[79] K. A. Franklin, K. Lyons, P. L. Nagler, D. Lampkin, E. P. Glenn, F. Molina-Freaner, T.
Markow, and A. R. Huete, "Buffelgrass (Pennisetum ciliare) land conversion and
productivity in the plains of Sonora, Mexico," Biological Conservation, vol. 127, pp. 62-
71, 2006.
Page 36
36
[80] NASA CASA Project, http://geo.arc.nasa.gov/sge/casa/cquestwebsite/index.html
(last accessed 27 February 2008).
[81] L. R. Beck, B. M. Lobitz, and B. L. Wood, "Remote Sensing and Human Health: New
Sensors and New Opportunities," Emerging Infectious Diseases, vol. 6, pp. 217-227,
2000.
[82] A. R. Huete, T. Miura, Y. Kim, K. Didan, J. Privette, "Assessments of multisensor
vegetation index dependencies with hyperspectral and tower flux data," in SPIE
Proceedings on Remote Sensing and Modeling of Ecosystems for Sustainability III., vol.
6298-45. San Diego, CA, 2006.
[83] T. Miura, A. Huete, and H. Yoshioka, "An empirical investigation of cross-sensor
relationships of NDVI and red/near-infrared reflectance using EO-1 Hyperion data,"
Remote Sensing of Environment, vol. 100, pp. 223-236, 2006.
[84] K. Gallo, L. Ji, B. Reed, J. Eidenshink, and J. Dwyer, "Multi-platform comparisons of
MODIS and AVHRR normalized difference vegetation index data," Remote Sensing of
Environment, vol. 99, pp. 221-231, 2005.
[85] K. Gallo, L. Ji, B. Reed, J. Dwyer, and J. Eidenshink, "Comparison of MODIS and
AVHRR 16-day normalized difference vegetation index composite data," Geophysical
Research Letters, vol. 31, pp. L07502, doi:10.1029/2003GL019385, 2004.
[86] M. E. Brown, J. E. Pinzon, K. Didan, J. T. Morisette, and C. J. Tucker, "Evaluation of the
consistency of long-term NDVI time series derived from AVHRR,SPOT-vegetation,
SeaWiFS, MODIS, and Landsat ETM+ sensors," IEEE Transactions on Geoscience and
Remote Sensing, vol. 44, pp. 1787-1793, 2006.
Page 37
37
[87] Z. Jiang, Huete, A.R., Didan, K., Miura, T., "Development of a 2-band enhanced
vegetation index without a blue band," Remote Sensing of Environment, (in press), 2008
[88] H. Yoshioka, Miura, T., and Huete, A.R., "An Isoline-based translation technique of
spectral vegetation index using EO-1 Hyperion data," IEEE Transactions of Geoscience
and Remote Sensing, vol. 41, pp. 1363-1372, 2003.
Page 38
38
Figure 1.
Level-2 Corrected Surface
Reflectance
Level 2 Gridded Corrected
Surface Reflectance
MOD9GQK = 250m Surface Reflectance
MOD09GHK = 500m Surface Reflectance
MOD09GST = 1km State Quality Assurance
MODMGGAD = 1km Viewing angles
MODPTQKM = 250m Pointer Data
MODPTHKM = 500m Pointer Data
- 6 inputs -
Level-3 Aggregated Surface
Reflectance
Level-3 1km/16 days VI
Product
Level 3 1km/Monthly VI
Product
Level 3 250m and 500m/16
days VI Product
Level-3 0.05o(CMG)/16 days
VI Product
Level-3 0.05o
(CMG)/Monthly VI Product
Spatial Averaging
QA- CV- MVC
Temporal Compositing
Temporal Averaging
MOD09 MOD09-L2G
MODPRAGG
MOD13A2
MOD13Q1/A1
MOD13C1
MOD13A3 MOD13C2
Page 41
41
Figure 3A,B,C.
Page 42
42
Figure 4A,B,C.
Page 44
44
Figure 5A,B,C.
Page 48
48
Table 1. Terra and Aqua MODIS VI product suite.
Terra MODIS VI Products Aqua MODIS VI Products
MOD13Q1: 16-day 250m MYD13Q1: 16-day 250m
MOD13A1: 16-day 500m MYD13A1: 16-day 500m
MOD13A2 16-day 1km VI MYD13A2 16-day 1km VI
MOD13A3 monthly 1km VI MYD13A3 monthly 1km VI
MOD13C1 16-day 0.05o VI MYD13C1 16-day 0.05
o VI
MOD13C2 monthly 0.05o VI MYD13C2 monthly 0.05
o VI
Page 49
49
Figure Captions
Figure 1. Overview of the Terra MODIS-VI product suite and input dependencies.
Figure 2. Representative MODIS VI seasonal profiles of major land cover types at 1 km
resolution (MOD12A2), depicting dynamic ranges and values.
Figure 3. Comparison of view angle distributions for pixels selected using MVC and CV-MVC
methods for Amazon Tile (H12V09)(A), and resulting overall QA of output pixels (B), and
for aerosol QA (C).
Figure 4. Comparison of MODIS 1 km VIs (MOD13A2) with 1 km NBAR generated VIs
(MOD43B4) for the Konza Prairie site, Kansas, U.S. over six years (A); and linear
regression of MOD13A2 with MOD43B4 VIs for Konza Prairie, Lucky Hills shrub site in
Arizona, and Harvard Forest in Massachusettes.
Figure 5. MODIS EVI (A) and NDVI (B) comparisons with 16-day averaged tower flux
measurements of gross primary productivity (GPP) for 5 years at Harvard Forest site (3x3
MOD13A2 pixels); and linear regression between MODIS VI and Tower GPP (C).
Figure 6. MODIS EVI- eddy covariance tower ET relationships at riparian (A) and upland
shrub (B) vegetation communities at the SMEX04 site in southeast Arizona., using
MOD13Q1. The strong evaporation component in the upland shrub site during rain events
results in significant departures from seasonal EVI values (tower flux data provided by Bill
Emmerich and Russell Scott, USDA-ARS Southwest Watershed Research Center, Tucson,
AZ).
Figure 7. Role of Terra- and Aqua- MODIS sensors within the long-term VI time series data
record.
Page 50
50
Figure 8. Regression of standard EVI product (MOD13A2) with the 2-band version of EVI2 for
various sites in South America.