Methane Hydrate Formation and Dissociation in Oil-in-WaterEmulsionHimangshu Kakati, Shranish Kar, Ajay Mandal,* and Sukumar Laik
Gas Hydrate Laboratory, Department of Petroleum Engineering, Indian School of Mines, Dhanbad 826004, India
ABSTRACT: The formation and dissociation of methane hydrates in oil-in-water emulsions have been studied. The phaseequilibrium of methane hydrate in the emulsion has been investigated, and enthalpy of dissociation of methane hydrates in theemulsion has been calculated using the Clausius−Clapeyron equation based on the measured phase equilibrium data. Thekinetics of hydrate formation has also been studied to observe the induction time of hydrate formation and hydrate formationrate. Further, the amount of gas consumed during hydrate formation has been calculated using the real gas equation.
1. INTRODUCTIONGas hydrates are naturally occurring non-stoichiometriccrystalline compounds composed of water and gas, where gasmolecules are trapped within the cavities formed by watermolecules with the help of hydrogen bonding.1 Gas hydratesform when water and hydrate-forming gas come in contact underhigh-pressure and low-temperature conditions.2 There are threeknown common hydrate structures (structures I, II, and H)principally depending upon themolecular size of the guestmolecule.1
In the hydrocarbon industry, emulsions can be encountered inalmost all phases of oil production, inside the reservoirs, wellbores, and well heads, transportation through pipelines, andduring crude storage and petroleum processing. Within thereservoir when crude oil remains associated with formationwater, emulsions are often formed with mixing and/or changes inthe pressure, temperature, and presence of asphaltene, resin, finesolid particle, etc.3 Again, when such emulsions are associatedwith lighter hydrocarbon gases, there is a greater possibility offorming hydrates under the conditions of reservoir pressure andtemperature. As such, water is invariably produced with crude oiland natural gas. In the flow lines under high pressure and enoughshear forces, crude oil flows with water. As a result, stable oil−wateremulsion may form. In this case, also under favorable temperatureand pressure, the associated natural gas may form hydrates. Theformation of hydrates in a subsea pipeline is a major concern formultiphase transportation. Low temperature and high pressure inoffshore pipelines provide a perfect environment for hydrateformation.1,4 Upon formation, hydrates may either flocculate andform a dispersion, which is transported with the fluid, oragglomerate and form a plug, leading to flow line blockage.5−7
Detailed knowledge of kinetics of hydrate formation, accumulation,and decomposition processes is a key factor during selection ofinhibitors and creation of new technologies for flow assurance toprevent hydrate problems.8 Furthermore, the formation of hydratesin drilling fluids, especially oil-based drilling fluids, and theirinhibition are the object of numerous investigations, which requirethe knowledge of hydrate formation and dissociation.9−11
Several researchers had studied the kinetics of hydrateformation and dissociation in the emulsion. Greaves et al.7
studied methane hydrate formation and dissociation in theemulsions at high water cuts. They observed that hydrateformation and dissociation from water-in-oil (W/O) emulsions
destabilized the emulsion, with the final emulsion formulationfavoring a water continuous state, following re-emulsification.Hence, following dissociation, the W/O emulsion formed amultiple O/W/O emulsion (60 vol % water) or inverted at evenhigher water cuts, forming an oil-in-water (O/W) emulsion (68vol % water). In contrast, hydrate formation and dissociationfrom O/W emulsions (>71 vol % water) stabilized the O/Wemulsion. Hoiland et al.5,6 had studied hydrates in the emulsionsto see whether the presence of hydrate particles can promote ordelay the inversion of a water−crude oil emulsion (i.e, O/W toW/O or vice versa). Sinquin et al.12 studied kinetic of hydrateformation in the presence of four different crude oils (onecondensate, one low asphaltenic content crude oil, one highasphaltenic content, and one paraffinic crude oil). They found thatthere was rapid and violent formation of hydrates for condensateand paraffinic crude oil. On the other hand, for asphaltenic crude(both high and low), hydrate formation is slow and smooth. Talatoriet al.8 studied the formation of mixed gas hydrates of methane,ethane, and propane in crude oil emulsions with different water cutsin a stirred constant volume high-pressure cell. Xiang et al.13 studiedhydrate formation and dissociation of natural gas in (diesel oil +water) emulsion systems for five water cuts: 5, 10, 15, 20, and25 vol %. They found that the dissociation rate and the amount ofdissociated gas increase with the increase in the water cut.Dalmazzone et al.14 studied the methane hydrate dissociationequilibrium in W/O emulsions using differential scanningcalorimetry (DSC) and found that hydrate formation in theemulsions is related to themagnitude of the subcooling. Irvin et al.15
studied the mechanism of hydrate formation in W/O micro-emulsions. Lachance et al.16 studied the effect of hydrate formation/dissociation on emulsion stability using DSC and visual techniques.They found that hydrate formation/dissociation is effective atdestabilizing emulsions. However, the asphaltene fraction of crudeoils resists hydrate-induced destabilization.In this paper, we have studied the formation and dissociation
of methane hydrates in the emulsions with different oil contents.The work is focused on how formation and dissociation
Received: March 27, 2014Revised: July 1, 2014Published: July 2, 2014
behaviors change with increasing the oil percentage in theemulsion. The kinetics of hydrate formation has also beenstudied to observe the induction time of hydrate formation,which is a very important parameter of hydrate formation. Thegas consumption and formation rate during hydrate formationhave also been studied.
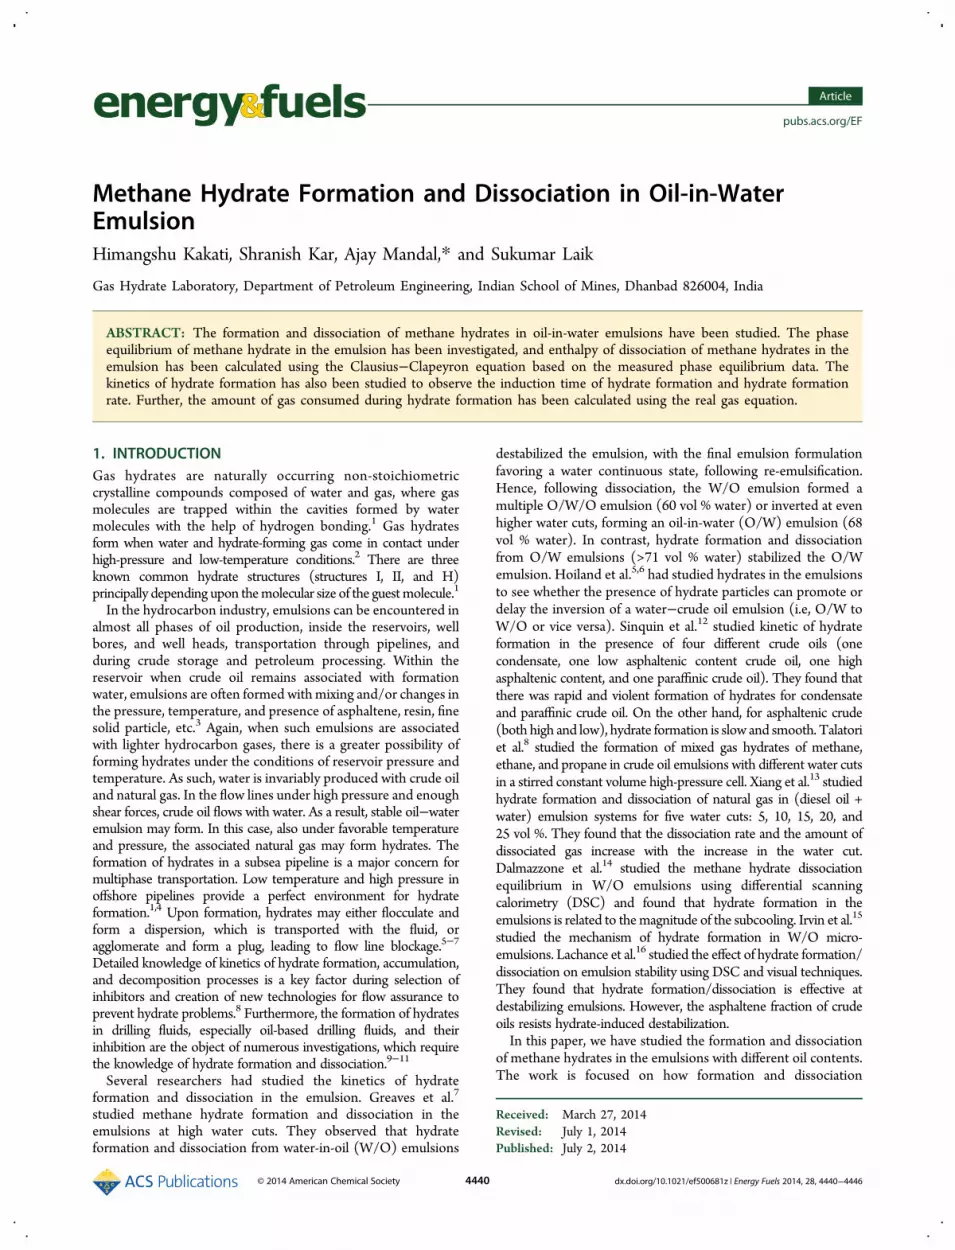
2. EXPERIMENTAL SECTION2.1. Apparatus.The schematic diagram of the gas hydrate autoclave
apparatus is shown in Figure 1. The high-pressure hydrate autoclaveprocured from Vinci Technology, France, was used to study gas hydrateformation and dissociation. The apparatus measures the induction time ofhydrate formation and pressure as a function of time during hydrateformation and takes video graphs during the experiments. The systemconsists of a constant volume hydrate cell with a capacity of 250 cm3 and apressure rating up to 20.68 MPa. The cell is a stainless-steel cylinder,where a stethoscopic camera, a thermocouple, and a pressure digital gaugeare fitted to the top of the cell. The cell temperature is controlled by athermostatic bath. The bath works with a thermostatic fluid (a mixtureof 85% water and 15% glycol) with an operating temperature rangefrom −10 to 60 °C. The bath size is about 225 × 370 × 429 mm. Thethermocouple measures the temperature inside the cell with an accuracy of0.1 °C. The cell pressure is monitored by a pressure transducer. A magneticstirrer with adjustable rotation speed (up to 1000 rpm) is used to agitate thetest fluid. The autoclave setup is also attached with a gas booster to build uphigh pressure inside the hydrate cell, and a vacuumpump is used to evacuateair in the cell before inserting gas.2.2. Materials. All of the experiments were performed with 99.99%
pure methane (collected from Chemtron Science Laboratory, NaviMumbai, India) and reverse osmosis water from Millipore water system(Millipore SA, Molshein, France). Crude oil used for preparation ofemulsion was collected from the Ahmedabad oil field (India). Thephysicochemical characteristics of crude oil are given in Table 1.
Saturates, aromatics, resins, and asphaltenes (SARA) distribution wasdetermined using liquid column chromatography through elution usingdifferent solvents of varying polarity. In the first stage, asphaltenes andinsoluble resins are separated by precipitation with n-hexane. Themixture is cooled at 30 °C, and precipitated asphaltenes are filtered out.The filtered sample (maltene fraction) is later split in a chromatographiccolumn to obtain saturated compounds, aromatics, and polar resins. Thesolid asphaltenes were washed with n-heptane before drying and thenweighed. The chromatographic separation of maltenes is carried out inan installation that comprises glass columns packed with silica gel. Thedifferent fractions are separated depending upon their affinity to thesolvent being used at each step of extraction. Trichloromethane is usedto recover resins; n-hexane is used for saturates; and hot toluene is usedto extract aromatics. The solvents used are extracted using a Soxhletapparatus, and the percentage of each fraction (weight percentage ofcrude oil) is calculated. The SARA analysis of the used crude oil isreported in Table 2.
2.3. Procedure. For preparation of synthetic O/W emulsion, crudeoil is used as the dispersed phase, distilled water is used as thecontinuous phase, and no surfactant is added to make the emulsionbecause natural surfactants, such as asphaltenes, waxes, resins,naphthenic acids, etc., are present in crude oil, which stabilizes theemulsion. A measured amount of crude oil and distilled water mixturewas taken in a flask and stirred at 2500 rpm for 5 h using an mechanicalstirrer (Remi RQ-20 Plus). Then, the emulsion was kept for settling in aseparating funnel to remove the undissolved crude oil. After theemulsion was separated from the separating funnel, its concentration inparts per million (ppm) was measured in an Infracal TOG/TPHanalyzer (Wilks) to know the actual oil content in the emulsion. Thehydrate formation may occur in the reservoir in the presence offormation water or in the pipeline during production and transportationof oil and gas in the presence of produced water. The concentration ofoil in the formation water or produced water varies widely, rangingbetween 100 and 1000 mg/L or still higher, depending upon thecomposition of crude oil.17,18 On the basis of the literature review, three
Figure 1. Schematic diagram of the gas hydrate setup.
Table 1. Physicochemical Characteristics of Crude Oil
number characteristic
1 density at 15.5 °C (kg/m3) 855.602 specific gravity at 15.5 °C 856.103 API gravity at 15.5 °C (°API) 35.774 viscosity at 30 °C (cP) 5255 acid number (mg of KOH/g) 0.0386 pour point (°C) 18
dx.doi.org/10.1021/ef500681z | Energy Fuels 2014, 28, 4440−44464441
different emulsions with oil concentrations of 870, 1880, and 3560 ppmare used in the present study.For the hydrate formation dissociation study, the autoclave cell was
filled with 120 cm3 of emulsion and immersed in a temperature-controlled bath. Before the methane gas was inserted, the air in the cellwas removed by a vacuum pump. The cell was then pressurized withmethane gas up to the desired pressure. The temperature of the cell atthe time of charging was 20 °C. After the gas was charged, the systemwas kept at that temperature for 1 h. The cell was then cooled stepwise(18, 16, 14 °C, etc.) in the programmable bath to attain the hydrateformation environment. The system was kept at each temperature for1 h to attain the equilibrium condition. Before hydrate formation, theO/Wemulsion is saturated withmethane by stirring with amagnetic stirrer.The hydrate formation was detected by a sudden drop in pressure. There isa small drop in pressure prior to the formation of the hydrate. This drop isdue to the dissolution of methane in the emulsion prior to the hydrateformation. After hydrate formation, the entire cell was heated at a rate of1 K/h. During the dissociation process, also, the same procedure has beenfollowed and the system was kept at each temperature for 1 h. When thetemperature was increased, the dissociation of hydrates was observed with asubstantial increase in the pressure. Hydrate dissociation was assumedcomplete when the heating curve joined the cooling curve.The particle size distribution (PSD) of oil in the emulsion was studied
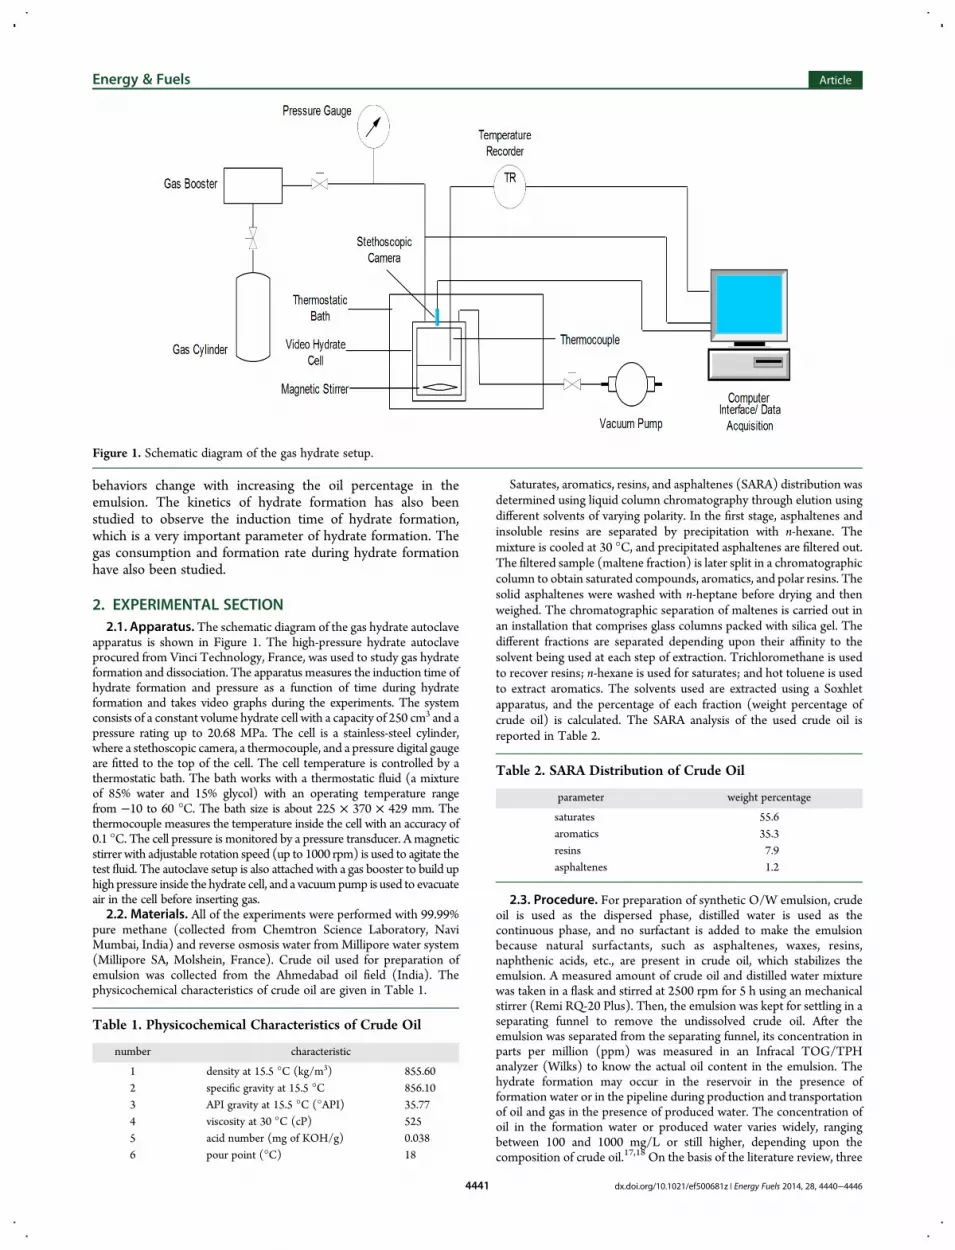
using Nano-S90 Zetasizer, version 6.34, of Malvern Instruments, Ltd.,which allows for the measurement of droplet diameters in the rangefrom 0.3 nm to 10.0 μm. Dynamic light scattering is used to measure theparticle size. This technique measures the diffusion of particles movingunder Brownian motion and converts this to size and a size distributionusing the Stokes−Einstein relationship. Non-invasive back scatter(NIBS) technology is incorporated to give the highest sensitivity,simultaneously with the highest dynamic size and concentration range.The PSD curves of three different emulsions are shown in Figure 2.
The sizes of the dispersed oil droplet in the emulsion significantlydepend upon the oil content under similar conditions. It may be seenthat the Z-average diameter of the dispersed oil droplet increases with anincrease in the oil content in the emulsions. Droplet size distribution inan emulsion determines, to a certain extent, the stability of the emulsion.The smaller the average sizes of the dispersed water droplets, the tighter theemulsion. Therefore, from Figure 2, it may be concluded that the emulsionswith a lower oil content are much more stable compared to the others.
3. RESULTS AND DISCUSSION3.1. Methane Hydrate Formation in the Emulsion.
Methane hydrates were formed in the autoclave cell from theemulsion prepared with 870, 1880, and 3560 ppm of oil in water.The initial pressure was around 17 MPa for all experiments.
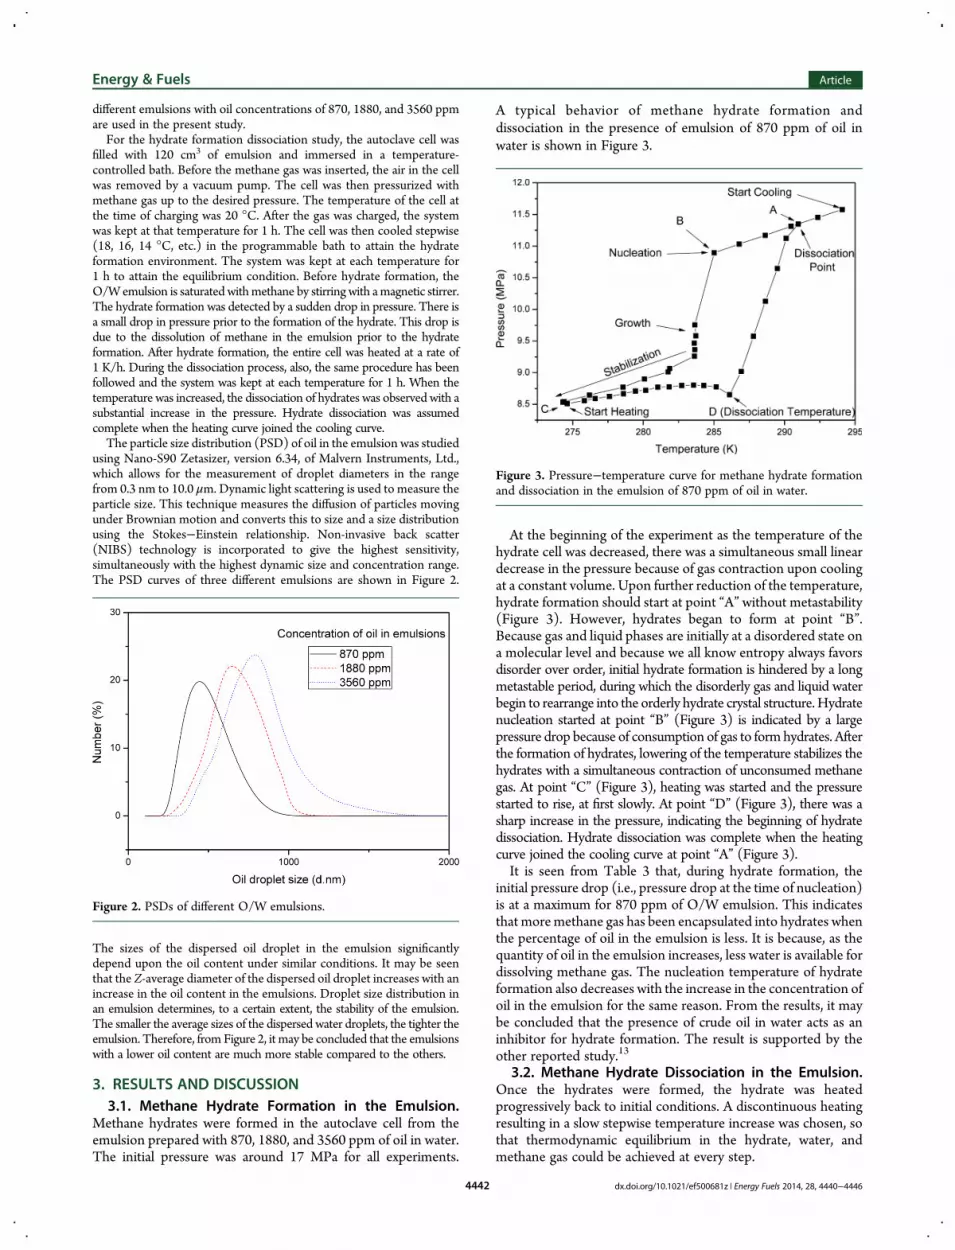
A typical behavior of methane hydrate formation anddissociation in the presence of emulsion of 870 ppm of oil inwater is shown in Figure 3.
At the beginning of the experiment as the temperature of thehydrate cell was decreased, there was a simultaneous small lineardecrease in the pressure because of gas contraction upon coolingat a constant volume. Upon further reduction of the temperature,hydrate formation should start at point “A” without metastability(Figure 3). However, hydrates began to form at point “B”.Because gas and liquid phases are initially at a disordered state ona molecular level and because we all know entropy always favorsdisorder over order, initial hydrate formation is hindered by a longmetastable period, during which the disorderly gas and liquid waterbegin to rearrange into the orderly hydrate crystal structure.Hydratenucleation started at point “B” (Figure 3) is indicated by a largepressure drop because of consumption of gas to formhydrates. Afterthe formation of hydrates, lowering of the temperature stabilizes thehydrates with a simultaneous contraction of unconsumed methanegas. At point “C” (Figure 3), heating was started and the pressurestarted to rise, at first slowly. At point “D” (Figure 3), there was asharp increase in the pressure, indicating the beginning of hydratedissociation. Hydrate dissociation was complete when the heatingcurve joined the cooling curve at point “A” (Figure 3).It is seen from Table 3 that, during hydrate formation, the
initial pressure drop (i.e., pressure drop at the time of nucleation)is at a maximum for 870 ppm of O/W emulsion. This indicatesthat moremethane gas has been encapsulated into hydrates whenthe percentage of oil in the emulsion is less. It is because, as thequantity of oil in the emulsion increases, less water is available fordissolving methane gas. The nucleation temperature of hydrateformation also decreases with the increase in the concentration ofoil in the emulsion for the same reason. From the results, it maybe concluded that the presence of crude oil in water acts as aninhibitor for hydrate formation. The result is supported by theother reported study.13
3.2. Methane Hydrate Dissociation in the Emulsion.Once the hydrates were formed, the hydrate was heatedprogressively back to initial conditions. A discontinuous heatingresulting in a slow stepwise temperature increase was chosen, sothat thermodynamic equilibrium in the hydrate, water, andmethane gas could be achieved at every step.
Figure 2. PSDs of different O/W emulsions.
Figure 3. Pressure−temperature curve for methane hydrate formationand dissociation in the emulsion of 870 ppm of oil in water.
Energy & Fuels Article
dx.doi.org/10.1021/ef500681z | Energy Fuels 2014, 28, 4440−44464442
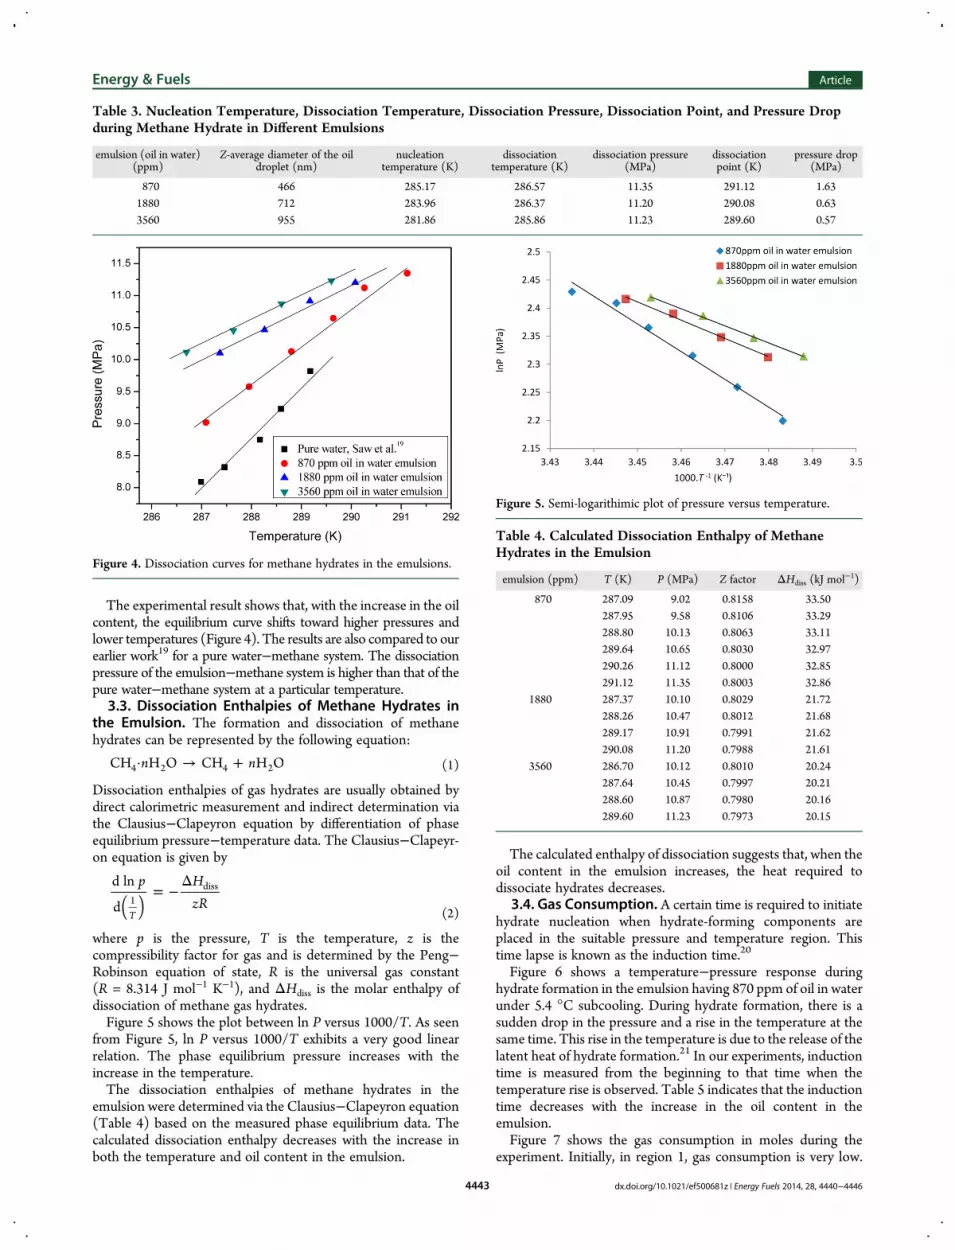
The experimental result shows that, with the increase in the oilcontent, the equilibrium curve shifts toward higher pressures andlower temperatures (Figure 4). The results are also compared to ourearlier work19 for a pure water−methane system. The dissociationpressure of the emulsion−methane system is higher than that of thepure water−methane system at a particular temperature.3.3. Dissociation Enthalpies of Methane Hydrates in
the Emulsion. The formation and dissociation of methanehydrates can be represented by the following equation:
· → +n nCH H O CH H O4 2 4 2 (1)
Dissociation enthalpies of gas hydrates are usually obtained bydirect calorimetric measurement and indirect determination viathe Clausius−Clapeyron equation by differentiation of phaseequilibrium pressure−temperature data. The Clausius−Clapeyr-on equation is given by
= −Δ
( )p H
zRd ln
dT1
diss
(2)
where p is the pressure, T is the temperature, z is thecompressibility factor for gas and is determined by the Peng−Robinson equation of state, R is the universal gas constant(R = 8.314 J mol−1 K−1), and ΔHdiss is the molar enthalpy ofdissociation of methane gas hydrates.Figure 5 shows the plot between ln P versus 1000/T. As seen
from Figure 5, ln P versus 1000/T exhibits a very good linearrelation. The phase equilibrium pressure increases with theincrease in the temperature.The dissociation enthalpies of methane hydrates in the
emulsion were determined via the Clausius−Clapeyron equation(Table 4) based on the measured phase equilibrium data. Thecalculated dissociation enthalpy decreases with the increase inboth the temperature and oil content in the emulsion.
The calculated enthalpy of dissociation suggests that, when theoil content in the emulsion increases, the heat required todissociate hydrates decreases.
3.4. Gas Consumption. A certain time is required to initiatehydrate nucleation when hydrate-forming components areplaced in the suitable pressure and temperature region. Thistime lapse is known as the induction time.20
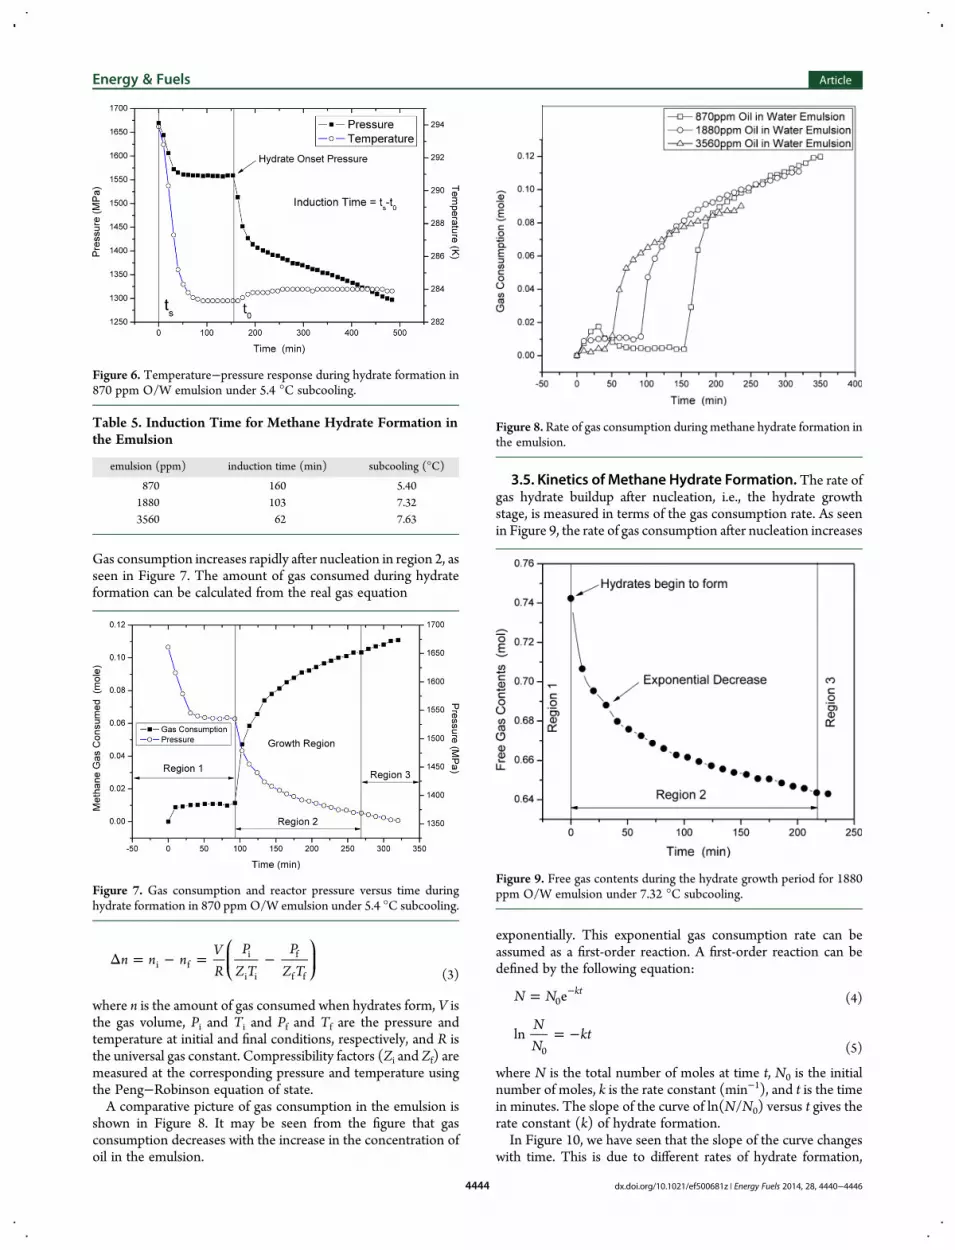
Figure 6 shows a temperature−pressure response duringhydrate formation in the emulsion having 870 ppm of oil in waterunder 5.4 °C subcooling. During hydrate formation, there is asudden drop in the pressure and a rise in the temperature at thesame time. This rise in the temperature is due to the release of thelatent heat of hydrate formation.21 In our experiments, inductiontime is measured from the beginning to that time when thetemperature rise is observed. Table 5 indicates that the inductiontime decreases with the increase in the oil content in theemulsion.Figure 7 shows the gas consumption in moles during the
experiment. Initially, in region 1, gas consumption is very low.
Table 3. Nucleation Temperature, Dissociation Temperature, Dissociation Pressure, Dissociation Point, and Pressure Dropduring Methane Hydrate in Different Emulsions
dx.doi.org/10.1021/ef500681z | Energy Fuels 2014, 28, 4440−44464443
Gas consumption increases rapidly after nucleation in region 2, asseen in Figure 7. The amount of gas consumed during hydrateformation can be calculated from the real gas equation
Δ = − = −⎛⎝⎜
⎞⎠⎟n n n
VR
PZ T
PZ Ti f
i
i i
f
f f (3)
where n is the amount of gas consumed when hydrates form, V isthe gas volume, Pi and Ti and Pf and Tf are the pressure andtemperature at initial and final conditions, respectively, and R isthe universal gas constant. Compressibility factors (Zi and Zf) aremeasured at the corresponding pressure and temperature usingthe Peng−Robinson equation of state.A comparative picture of gas consumption in the emulsion is
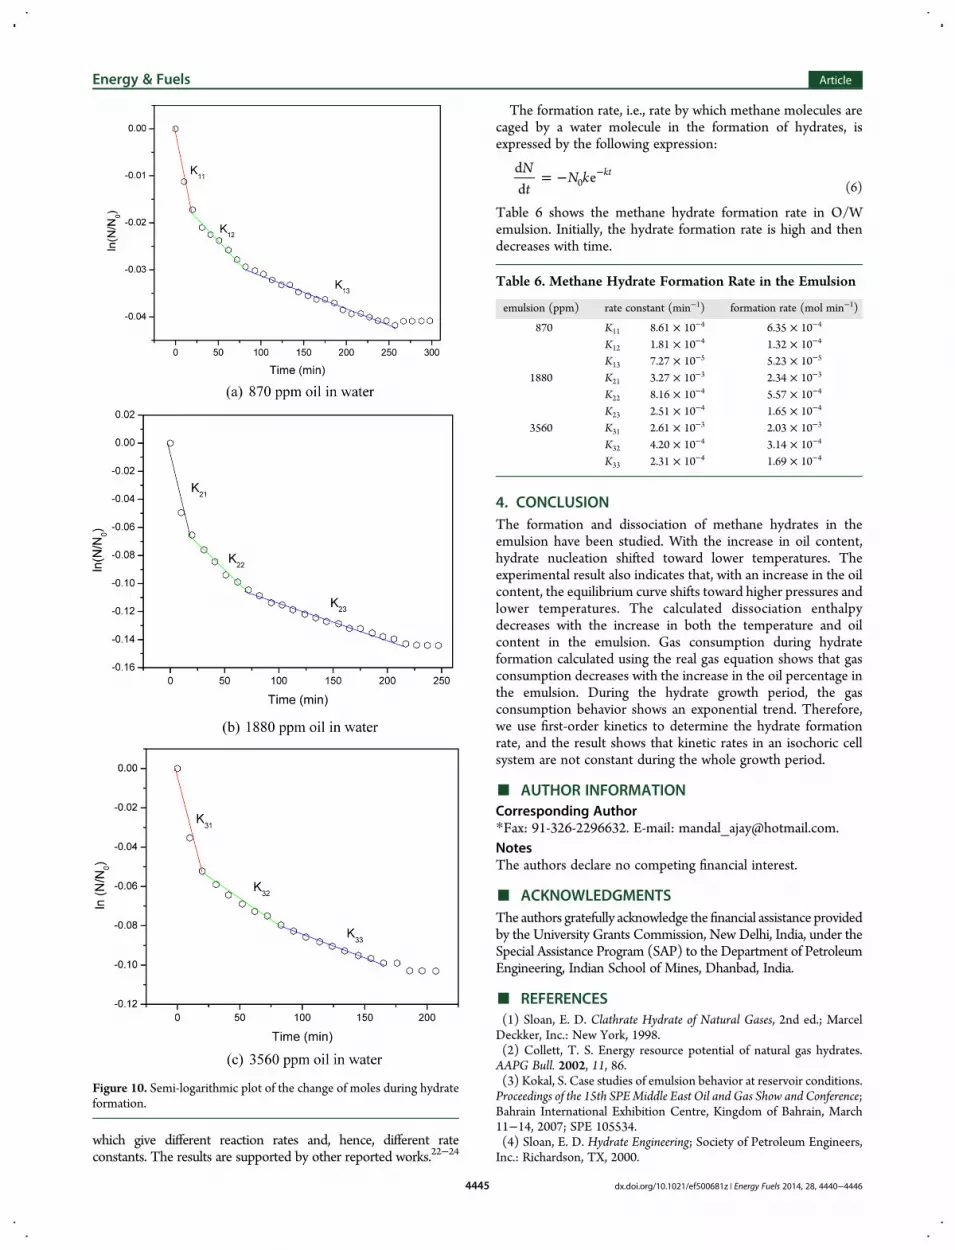
shown in Figure 8. It may be seen from the figure that gasconsumption decreases with the increase in the concentration ofoil in the emulsion.
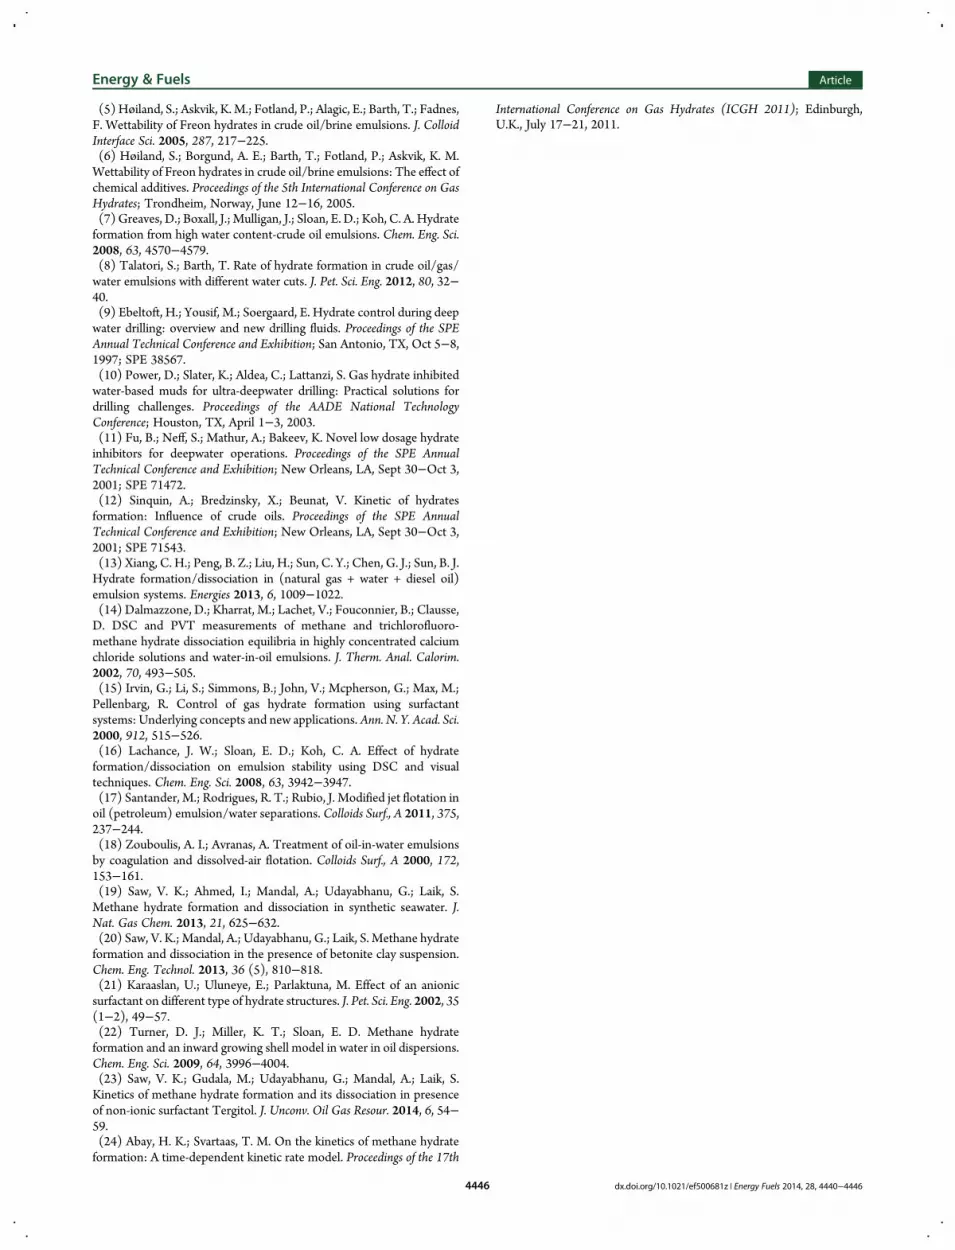
3.5. Kinetics of Methane Hydrate Formation. The rate ofgas hydrate buildup after nucleation, i.e., the hydrate growthstage, is measured in terms of the gas consumption rate. As seenin Figure 9, the rate of gas consumption after nucleation increases
exponentially. This exponential gas consumption rate can beassumed as a first-order reaction. A first-order reaction can bedefined by the following equation:
= −N N e kt0 (4)
= −NN
ktln0 (5)
where N is the total number of moles at time t, N0 is the initialnumber of moles, k is the rate constant (min−1), and t is the timein minutes. The slope of the curve of ln(N/N0) versus t gives therate constant (k) of hydrate formation.In Figure 10, we have seen that the slope of the curve changes
with time. This is due to different rates of hydrate formation,
Figure 8.Rate of gas consumption during methane hydrate formation inthe emulsion.
Figure 6. Temperature−pressure response during hydrate formation in870 ppm O/W emulsion under 5.4 °C subcooling.
Table 5. Induction Time for Methane Hydrate Formation inthe Emulsion
emulsion (ppm) induction time (min) subcooling (°C)
870 160 5.401880 103 7.323560 62 7.63
Figure 7. Gas consumption and reactor pressure versus time duringhydrate formation in 870 ppm O/W emulsion under 5.4 °C subcooling.
Figure 9. Free gas contents during the hydrate growth period for 1880ppm O/W emulsion under 7.32 °C subcooling.
Energy & Fuels Article
dx.doi.org/10.1021/ef500681z | Energy Fuels 2014, 28, 4440−44464444
which give different reaction rates and, hence, different rateconstants. The results are supported by other reported works.22−24
The formation rate, i.e., rate by which methane molecules arecaged by a water molecule in the formation of hydrates, isexpressed by the following expression:
= − −Nt
N kdd
e kt0 (6)
Table 6 shows the methane hydrate formation rate in O/Wemulsion. Initially, the hydrate formation rate is high and thendecreases with time.
4. CONCLUSIONThe formation and dissociation of methane hydrates in theemulsion have been studied. With the increase in oil content,hydrate nucleation shifted toward lower temperatures. Theexperimental result also indicates that, with an increase in the oilcontent, the equilibrium curve shifts toward higher pressures andlower temperatures. The calculated dissociation enthalpydecreases with the increase in both the temperature and oilcontent in the emulsion. Gas consumption during hydrateformation calculated using the real gas equation shows that gasconsumption decreases with the increase in the oil percentage inthe emulsion. During the hydrate growth period, the gasconsumption behavior shows an exponential trend. Therefore,we use first-order kinetics to determine the hydrate formationrate, and the result shows that kinetic rates in an isochoric cellsystem are not constant during the whole growth period.
■ ACKNOWLEDGMENTSThe authors gratefully acknowledge the financial assistance providedby the University Grants Commission, New Delhi, India, under theSpecial Assistance Program (SAP) to the Department of PetroleumEngineering, Indian School of Mines, Dhanbad, India.
■ REFERENCES(1) Sloan, E. D. Clathrate Hydrate of Natural Gases, 2nd ed.; MarcelDeckker, Inc.: New York, 1998.(2) Collett, T. S. Energy resource potential of natural gas hydrates.AAPG Bull. 2002, 11, 86.(3) Kokal, S. Case studies of emulsion behavior at reservoir conditions.Proceedings of the 15th SPEMiddle East Oil and Gas Show and Conference;Bahrain International Exhibition Centre, Kingdom of Bahrain, March11−14, 2007; SPE 105534.(4) Sloan, E. D. Hydrate Engineering; Society of Petroleum Engineers,Inc.: Richardson, TX, 2000.
Figure 10. Semi-logarithmic plot of the change of moles during hydrateformation.
Table 6. Methane Hydrate Formation Rate in the Emulsion
(5) Høiland, S.; Askvik, K.M.; Fotland, P.; Alagic, E.; Barth, T.; Fadnes,F. Wettability of Freon hydrates in crude oil/brine emulsions. J. ColloidInterface Sci. 2005, 287, 217−225.(6) Høiland, S.; Borgund, A. E.; Barth, T.; Fotland, P.; Askvik, K. M.Wettability of Freon hydrates in crude oil/brine emulsions: The effect ofchemical additives. Proceedings of the 5th International Conference on GasHydrates; Trondheim, Norway, June 12−16, 2005.(7) Greaves, D.; Boxall, J.; Mulligan, J.; Sloan, E. D.; Koh, C. A. Hydrateformation from high water content-crude oil emulsions. Chem. Eng. Sci.2008, 63, 4570−4579.(8) Talatori, S.; Barth, T. Rate of hydrate formation in crude oil/gas/water emulsions with different water cuts. J. Pet. Sci. Eng. 2012, 80, 32−40.(9) Ebeltoft, H.; Yousif, M.; Soergaard, E. Hydrate control during deepwater drilling: overview and new drilling fluids. Proceedings of the SPEAnnual Technical Conference and Exhibition; San Antonio, TX, Oct 5−8,1997; SPE 38567.(10) Power, D.; Slater, K.; Aldea, C.; Lattanzi, S. Gas hydrate inhibitedwater-based muds for ultra-deepwater drilling: Practical solutions fordrilling challenges. Proceedings of the AADE National TechnologyConference; Houston, TX, April 1−3, 2003.(11) Fu, B.; Neff, S.; Mathur, A.; Bakeev, K. Novel low dosage hydrateinhibitors for deepwater operations. Proceedings of the SPE AnnualTechnical Conference and Exhibition; New Orleans, LA, Sept 30−Oct 3,2001; SPE 71472.(12) Sinquin, A.; Bredzinsky, X.; Beunat, V. Kinetic of hydratesformation: Influence of crude oils. Proceedings of the SPE AnnualTechnical Conference and Exhibition; New Orleans, LA, Sept 30−Oct 3,2001; SPE 71543.(13) Xiang, C. H.; Peng, B. Z.; Liu, H.; Sun, C. Y.; Chen, G. J.; Sun, B. J.Hydrate formation/dissociation in (natural gas + water + diesel oil)emulsion systems. Energies 2013, 6, 1009−1022.(14) Dalmazzone, D.; Kharrat, M.; Lachet, V.; Fouconnier, B.; Clausse,D. DSC and PVT measurements of methane and trichlorofluoro-methane hydrate dissociation equilibria in highly concentrated calciumchloride solutions and water-in-oil emulsions. J. Therm. Anal. Calorim.2002, 70, 493−505.(15) Irvin, G.; Li, S.; Simmons, B.; John, V.; Mcpherson, G.; Max, M.;Pellenbarg, R. Control of gas hydrate formation using surfactantsystems: Underlying concepts and new applications. Ann. N. Y. Acad. Sci.2000, 912, 515−526.(16) Lachance, J. W.; Sloan, E. D.; Koh, C. A. Effect of hydrateformation/dissociation on emulsion stability using DSC and visualtechniques. Chem. Eng. Sci. 2008, 63, 3942−3947.(17) Santander, M.; Rodrigues, R. T.; Rubio, J. Modified jet flotation inoil (petroleum) emulsion/water separations. Colloids Surf., A 2011, 375,237−244.(18) Zouboulis, A. I.; Avranas, A. Treatment of oil-in-water emulsionsby coagulation and dissolved-air flotation. Colloids Surf., A 2000, 172,153−161.(19) Saw, V. K.; Ahmed, I.; Mandal, A.; Udayabhanu, G.; Laik, S.Methane hydrate formation and dissociation in synthetic seawater. J.Nat. Gas Chem. 2013, 21, 625−632.(20) Saw, V. K.; Mandal, A.; Udayabhanu, G.; Laik, S. Methane hydrateformation and dissociation in the presence of betonite clay suspension.Chem. Eng. Technol. 2013, 36 (5), 810−818.(21) Karaaslan, U.; Uluneye, E.; Parlaktuna, M. Effect of an anionicsurfactant on different type of hydrate structures. J. Pet. Sci. Eng. 2002, 35(1−2), 49−57.(22) Turner, D. J.; Miller, K. T.; Sloan, E. D. Methane hydrateformation and an inward growing shell model in water in oil dispersions.Chem. Eng. Sci. 2009, 64, 3996−4004.(23) Saw, V. K.; Gudala, M.; Udayabhanu, G.; Mandal, A.; Laik, S.Kinetics of methane hydrate formation and its dissociation in presenceof non-ionic surfactant Tergitol. J. Unconv. Oil Gas Resour. 2014, 6, 54−59.(24) Abay, H. K.; Svartaas, T. M. On the kinetics of methane hydrateformation: A time-dependent kinetic rate model. Proceedings of the 17th
International Conference on Gas Hydrates (ICGH 2011); Edinburgh,U.K., July 17−21, 2011.
Energy & Fuels Article
dx.doi.org/10.1021/ef500681z | Energy Fuels 2014, 28, 4440−44464446