241
;;LiJ, Or.li'IC.E .r,7in.n mt Copy ---
| Date post: | 09-Mar-2023 |
| Category: |
Documents |
| Upload: | khangminh22 |
| View: | 0 times |
| Download: | 0 times |
;;LiJ, Or.li'IC.E .r,7in.n mt Copy ---
1985 TRANSPORTATION RESEARCH BOARD EXECUTIVE COMMITTEE
OFFICERS Chairman: John A. Clements, President, Highway Users Federation
for Safety and Mobility, Washington, D.C. Vice Chairman: Lester A. Hoel, Hamilton Professor and Chairman,
Department of Civil Engineering, University of Virginia, Charlottesville
Executive Director: Thomas 8. Deen, Transportation Research Board
MEMBERS Ray A. Barnhart, Administrator, Federal Highway Administration,
U.S. Department of Transportation (ex officio) Joseph M. Clapp, President and Vice Chairman, Roadway
Services, Inc., Akron, Ohio (ex officio, Past Chairman, 1984) Lawrence D. Dahms, Executive Director, Metropolitan
Transportation Commission, Oakland, California (ex officio, Past Chairman, 1983)
Donald D. Engen, Vice Admiral, U.S. Navy (retired), Administrator, Federal Aviation Administration, U.S. Department of Transportation (ex officio)
Francis 8. Francois, Executive Director, American Association of State Highway and Transportation Officials, Washington, D.C. (ex officio)
Ralph L. ::itanley, Administrator, Urban Mass Transportation Administration, U.S. Department of Transportation (ex officio)
Diane Steed, Administrator, National Highway Traffic Safety Administration, U.S. Department of Transportation (ex officio)
George H. Way, Jr., Vice President, Research and Test Department, Association of American Railroads, Washington, D.C. (ex officio)
Alan A. Altshuler, Dean, Graduate School of Public Administration, New York University, New York
Duane Berentson, Secretary, Washington State Department of Transportation, Olympia
John R. Borchert, Regents Professor, Department of Geography, University of Minnesota, Minneapolis
Robert D. Bugher, Executive Director, American Public Works Association, Chicago, Illinois
Ernest E. Dean, Executive Director, Dallas-Fort Worth Airport, Texas
Mortimer L. Downey, Deputy Executive Director for Capital Programs, Metropolitan Transportation Authority, New York
Jack R. Gilstrap, Executive Vice President, American Public Transit Association, Washington, D.C.
Mark G. Goode, Engineer-Director, Texas State Department of Highways and Public Transportation, Austin
William K. Hellmann, Secretary, Maryland Department of Transportation, Baltimore
Lowell 8. Jackson, Secretary, Wisconsin Department of Transportation, Madison
John 8 . Kemp, Secretary, Kansas Department of Transportation, Topeka
Alan F. Kiepper, General Manager, Metropolitan Transit Authority, Houston, Texas
Harold C. King, Commissioner, Virginia Department of Highways. and Transportation, Richmond
Darrell V Manning, Director, Adjutant General, Idaho National Guard
James E. Martin, President and Chief Operating Officer, Illinois Central Gulf Railroad , Chicago
Fujio Matsuda, Executive Director, Research Corporation of the University of Hawaii, Honolulu
James K. Mitchell, Professor, Department of Civil Engineering, University of California, Berkeley
H. Carl Munson, Jr., Vice President for Strategic Planning, The Boeing Commercial Airplane Company, Seattle, Washington
Milton Pikarsky, Distinguished Professor of Civil Engineering, City College of New York, New York
Walter W. Simpson, Vice President-Engineering, Norfolk Southern Corporation, Norfolk, Virginia
Leo J. Trombatore, Director, California Department of Transportation, Sacramento
The Transportation Research Board is a unit of the National Research Council, which serves the National Academy of Sciences and the National Academy of Engineering. The Board's purpose is to stimulate research concerning the nature and performance of transportation systems, to disseminate the information produced l:)y the research, and to encourage the application of appropriate research findings. The Board's program is carried out by more than 270 committees, task forces, and panels composed of more than 3,300 administrators, engineers, social scientists, attorneys, educators, and others concerned with transportation; they serve without compensation. The program is supported by state transportation and highway departments, the modal administrations of the U.S. Department of Transportation, the Association of American Railroads, the National Highway Traffic Safety Administration, and other organizations and individuals interested in the development of transportation.
The National Research Council was established by the National Academy of Sciences in 1916 to associate the broad community of science and technology with the Academy's purposes of furthering knowledge and of advising the federal government. The Council operates in accordance with general policies determined by the Academy under the authority of its congressional charter of 1863, which established the Academy as a private, nonprofit, selfgoverning membership corporation: The Council is the principal operating agency of both the National Academy of Sciences and the National Academy of Engineering in the conduct of their services to the government, the public, and the scientific and engineering communities. It is administered jointly by both Academies and the Institute of Medicine. The National Academy of Sciences was established in 1863 by Act of Congress as a private, nonprofit, self-governing membership corporation for the furtherance of science and technology, required to advise the federal government upon request within its fields of competence. Under its corporate charter, the Academy established the National Academy of Engineering in 1964 and the Institute of Medicine in 1970.
State-of-the-Art Report 2
night Rail 1ransit: y-stem Design for
Cost-Effectiveness
Pap~rs presented at the Conference on Light Rail lransit
May 8-10, 1985, Pittsburgh, Pennsylvania
Conducted by the lransportation Research Board
TRANSPORTATION RESEARCH BOARD
National Research Council
Washington, D.C. 1985
State-of-the-Art Report 2 Price $15.00 Editor: Elizabeth W. Kaplan Compositor: Lucinda Reeder Layout: Theresa L. Johnson
mode 2 public transit
subject areas 11 administration 12 planning 13 forecasting 14 finance 15 socioeconomics 16 user needs 54 operations and traffic control 55 traffic flow, capacity, and measurements
Transportation Research Board publications are available by ordering directly from TRB. They may also be obtained on a regular basis through organizational or inclividual affiliation with TRB; affiliates or library subscribers are eligible for substantial discounts. For further information, write to the Transportation Research Board, National Research Council, 2101 Constitution Avenue, N.W., Washington, D.C. 20418.
Printed in the United States of America
Library of Congress Cataloging in Publication Data National Research Council. Transportation Research Board. National Conference on Light Rail Transit (1985 :
Pittsburgh, Pa.) Light rail transit.
(State-of-the-art report ; 2) 1. Street-railroads-Congresses. I. National
Research Council (U.S.). Transportation Research Board. II. Title. Ill. Series: State-of-the-art report (Washington, D.C.) ; 2 TF701.N27 1985 388.4'6 85-28499 ISBN 0-309-03917-7
Sponsorship of State-of-the-Art Report 2
GROUP I-TRANSPORTATION SYSTEMS PLANNING AND ADMINISTRATION William A. Bulley, H. W. Lochner, Inc., chairman
Urban Public Transportation Section John J. Fruin, PED Associates, chairman
Committee on Rail Transit Systems Richard Miller Stanger, Losa County Transportation Commission,
chairma11 John J. Bakker, Glen D. Bottoms, James A. Brown, Donald 0. Eisele, Alex E. Friedlander, Howard Goode, Daniel L. Jones, Jr., Ata M. Khan, Snehamay Khas11abis, Shinya Kikuchi, Robert J. La11dgraf, Thomas F. Larwill, Tom E. Parkinson, S. David Phraner, Peter J. Schmidt, Fred J. Silverman, Brian E. Su/li11a11. Edson L. Tennyson, Rush D. Touton, Jr., J. William Vigrass, Vukon R. Vuchic, Harold Wanaselja, Jimmy Yu
Program Committee for Fourth National Conference on Light Rail Transit Robert J. Landgraft, chairman Robert P. Sedlock, cochairman Jack W. Boorse, Glen D. Bottoms, Charles P. Elms, Thomas F. Lanvin, R . David Minister, Jeffrey G. Mora, John W. Schumann, Joseph S. Silicn, Harold 1va11aselja
Wm. Campbell Graeub, Transportation Research Board •toff
Preface
The emergence of light rail transit (LRT) as a costeffective component of the urban-suburban transportation environment has reinforced the need to examine current issues of design, construction, and operation of LRT systems in a variety of settings and in comparison with other alternatives. The framework of the 1985 LRT Conference was structured to report on innovative solutions and alternative strategies in a wide variety of site-specific situations.
Because the cost of constructing all varieties of fixed-guideway systems has increased in recent years, emphasis is being placed on justifying, constructing, and operating these systems in the most economical fashion. Because of its flexibility of design, operational characteristics, and physical placement, LRT has much potential to achieve cost-effectiveness. At
the 1985 LRT Conference issues that arise when LRT is compared with other modal alternatives were explored and discussed. Systems design, technology application, and implementation planning as they relate to the overall efficiency and effectiveness of LRT were also considered.
This State-of-the-Art Report contains most of the papers that were presented at the 1985 LRT Conference as well as some that were presented at the TRB 1985 Annual Meeting.
The Transportation Research Board and its Committee on Rail Transit Systems express their gratitude to the Program Committee, chaired by Robert J. Landgraf, whose work and dedication made this Conference possible.
Contents FOREWORD
Robert J. Landgraf . . . . . . . . . . . . . . . . . . . . . . . . . . . . . . . . . . . . . . . . . . . . . . . . . . . . . . . . . . . . vii
PART 1: OVERVIEW AND COST-EFFECTIVENESS ISSUES . . . . . . . . . . . . . . . . . . . . . . . . . . . . . 1 Current Light Rail Developments in North America
Brian E. Sullivan . . . . . . . . . . . . . . . . . . . . . . . . . . . . . . . . . . . . . . . . . . . . . . . . . . . . . . . . . . . . . . 3 Determining Cost-Effectiveness of Transit Systems
Paul N. Bay . . . . . . . . . . . . . . . . . . . . . . . . . . . . . . . . . . . . . . . . . . . . . . . . . . . . . . . . . . . . . . . . . 9 Light Rail: Prospects and Perspectives
Jeffrey M. Zupan . . . . . . . . . . . . . . . . . . . . . . . . . . . . . . . . . . . . . . . . . . . . . . . . . . . . . . . . . . . . . 13 Comparison of Light Rail Transit and Dual-Mode Bus System
Uwe Meyer . . . . . . . . . . . . . . . . . . . . . . . . . . . . . . . . . . . . . . . . . . . . . . . . . . . . . . . . . . . . . . . . . . 16 Light Rail Development in Los Angeles
Rick Richmond . . . . . . . . . . . . . . . . . . . . . . . . . . . . . . . . . . . . . . . . . . . . . . . . . . . . . . . . . . . . . . 23 Cost-Effective Application of LRT Systems Technology
J. W. Schumann, K. Addison, T. B. Furmaniak, T. Matoff, C. W. Otte, and W. P. Quintin, Jr ..... 26
PART 2: POLICY AND PLANNING CONSIDERATIONS . . . . . . . . . . . . . . . . . . . . . . . . . . . . . . . . . 35 Value Engineering Methods Applied to a Guideway Transit System Proposed for Orange County, California
Jagbir Sihota, Tom McGean, and Clark Henderson...... . . . . . . . . . . . . . . . . . . . . . . . . . . . . . . 37 Value of Light Rail Transit as a Major Capital Investment
E. L. Tennyson............................. .. . ... ............................ 46 Changes in Direction for LRT Planning in Edmonton
J. J. Bakker . . . . . . . . . . . . . . . . . . . . . . . . . . . . . . . . . . . . . . . . . . . . . . . . . . . . . . . . . . . . . . . . . 52 Self-Service Fare Collection Systems for LRT: State-of-the-Art Review
Roman Baur . . . . . . . . . . . . . . . . . . . . . . . . . . . . . . . . . . . . . . . . . . . . . . . . . . . . . . . . . . . . . . . . . 59 Getting the Most on a Modest Budget-Santa Clara County Transit District LRV Maintenance Facility
Kenneth F. Brencic and Wallace A. Dela Barre . . . . . . . . . . . . . . . . . . . . . . . . . . . . . . . . . . . . . . . 64 Development of a Rail Transit Plan and Implementation Strategy for Los Angeles County
Richard Stanger and Ben Darche . . . . . . . . . . . . . . . . . . . . . . . . . . . . . . . . . . . . . . . . . . . . . . . . . 76 Evaluation of Light Rail Transit for Austin, Texas
Alan Wulkan and Lyndon Henry . . . . . . . . . . . . . . . . . . . . . . . . . . . . . . . . . . . . . . . . . . . . . . . . . 82 Upgrading Conventional Streetcar Lines to Light Rail Transit: Case Study from Oslo, Norway
Thor Kaarsberg Haatveit . . . . . . . . . . . . . . . . . . . . . . . . . . . . . . . . . . . . . . . . . . . . . . . . . . . . . . . . 91 Application of Transit Operating Cost Models
Cynthia Ann Walker, Charles M. Trapani, Jr., Sheldon Fialkoff, and Gordon Schultz ...... ... 101 Smaller Scale Joint Development: San Diego Trolley
Helene B. Kornblatt . . . . . . . . . . . . . . . . . . . . . . . . . . . . . . . . . . . . . . . . . . . . . . . . . . . . . . . . . . . 108
PART 3: FACILITY DESIGN AND RAIL CAR TECHNOLOGY . . . . . . . . . . . . . . . . . . . . . . . . . . . . 111 Resuscitating an Old Trolley System
John A. Bailey and Christopher Zearfoss ........................................... 113 Realities of Constructing LRT in City Streets
Rick Thorpe . . . . . . . . . . . . . . . . . . . . . . . . . . . . . . . . . . . . . . . . . . . . . . . . . . . . . . . . . . . . . . . . . 121
vi
Development of Right-of-Way Design and Strategy Incorporating Public Input for the Banfield East Burnside Corridor
Fred Glick ............................... .. .... .. .......................... . Integration of Sacramento Light Rail Transit System into the Central City
James E. Roberts and Robert E. Kershaw ................................ .. ... . ... . Energy Loss Considerations in Traction Power Substation Design
Richard L. Hearth and Stoil D. Stoilov ............................................ . Key Interfaces in the Design of Traction Electrification Systems for Light Rail Transit
Willard D. Weiss and Jean-Luc Dupont .................... . ....... . .............. . . Design of Light Rail Transit Catenary Systems that Encourage Universal Contractor Participation
Herbert S. Zwilling and Michael T. Harrison .................................... .. .. . Economic Rating and Spacing of LRT Traction Substations
Stoil D. Stoilov ......................................... . .......... . ....... . . . Overview of Microprocessor-Based Controls in Transit and Concerns About Their Introduction
David J. Mitchell ............................................................ . Specifics of Light Rail Car Design Versus Rapid Car Design
Ian G. Hendry .............................................................. . Market for Light Rail Cars in the United States
William H. Frost ..................................................... .. ... .. . . Portland LRV
Dennis L. Porter and John S. Gustafson ..... ... ........................... . . ... .. . . Energy Cost Considerations in Light Rail Vehicle Size Specification
Steven E. Polzin ........................................... ....... ........... . Main Features of Cleveland's LRV
Marcello Pecorini and Giancarlo Cheirasco ................................. ........ .
PART 4: OPERATIONS ........................................... . .............. . Considerations for Effective Light Rail Street Operation
John D. Wilkins and Joseph F. Boscia ............. . ............................... . Design of Traffic Interface on the Banfield Light Rail Project
Gerald Fox .................................................. . .............. . Integrating LRT into Flexible Traffic Control Systems
Warren A. Tighe and Larry A. Patterson ...................... . .................... . LRT On-Street Operations: The Calgary Experience
J. R. Walshaw ..................................... ... .. . ............... .. ... . Improving Light Rail Transit Performance in Street Operations: Toronto Case Study
R. M. Topp ......................................... . ... ..... ......... . ..... . Preferential Control Warrants of Light Rail Transit Movements
A. Essam Radwan and Kuo-Ping Hwang ........................................... .
130 .
135 -140
145
151
159
164
171
174
177
183
189
193
195
203
213
221
227
234
Foreword Robert J. Landgraf Greater Cleveland Regional Transit Authority Cleveland, Ohio
In the last 10 years the Transportation Research Board has conducted four conferences on light rail transit (LRT), The first conference, held in Philadelphia in 1975, had as its objective the reintroduction of LRT to a wide spectrum of decision and opinion makers from government, industry, and academia. In 1977 a second LRT conference was held in Boston to address the need for a more detailed focus on planning and technology, These first two conferences were sponsored by the Urban Mass Transportation Administration with assistance from the American Public Transit Association. Attendance at both conferences exceeded expectations, pointing to an even greater interest in light rail transit than had been anticipated by the conference planners. Several years later the need was recognized for a third conference to emphasize topics that had not been adequately developed at the earlier meetings, The result was the 1982 conference, sponsored by the Urban Mass Transportation Administration, on planning, design, and implementation, which took place in San Diego.
Since the 1982 conference on light rail transit, several more LRT projects have been coming on line, especially in the West. Portland's long-considered Burnside Corridor line is well along in construction, and the Sacramento and Santa Clara systems are under way. In San Diego the first "new" light rail line in many years will soon be joined by a short branch intended eventually to reach much farther. Common to all of these projects is the attempt to maximize network length while minimizing cost per mile: all four new West Coast systems use downtown street running for distribution, single-track operation was used for a time in San Diego and will be a feature of two other new systems.
Planning for new rail transit networks in Sunbelt cities is focusing on LRT as a cheaper and fasterto-construct alternative to more expensive, fully grade-separated rapid transit, The use of the term "light rail• appears to make the cost of a project politically more acceptable, although the investment required per mile may be high as is the case with Buffalo's new line, which is perhaps unique in combining a downtown surface center mall with subway in the entire outer portion to allow for existing street width and other conditions. There is great need to keep project costs from becoming as high as those for rapid transit, This goal is sometimes politically painful to achieve as demonstrated in the planning for the Los Angeles-Long Beach line when restoration in economical rights-of-way abandoned not long ago ~as vigorously opposed by adjacent interests.
Effective use of capital in the design of light
rail rights-of-way, track, stations, signal systems, vehicles, and maintenance facilities is a pressing needi wider understanding of this need is vital if light rail is to be seriously considered as a mass transit mode. The anticipated decreased availability of federal capital funds underscores the need to achieve greater results with state and local tax dollars. The TRB Committee on Light Rail Transit decided that there was need for another LRT conference and that it should be structured around the theme of cost-effectiveness.
Pittsburgh was chosen as the site for the 1985 conference because of several developments in light rail taking place in that city. The second LRT subway constructed in the postwar era was about to open. The main trunk line of the South Hills light rail system is being reconstructed to high standards, employing a mix of private right-of-way, tunnel, and street running i yet for comparison much of the old system built in modest style remains. The newest, sophisticated light rail vehicles and reconstructed PCC cars are being used together in a bilevel operation.
A lasting contribution made by each of the three earlier conferences on light rail transit was publication of the proceedings in Transportation Research Board Special Reports 161, 182, and 195. These reports rank among the most definitive works on the subject of LRT and remain in high demand. It is hoped that the following collection of papers will take its place beside the three earlier works as a permanent reference. Many of the papers published from the 1975, 1977, and 1982 conferences on LRT deal with topics and approaches related to the theme at hand, and the serious inquirer into economical design for light rail is encouraged to refer to those publications for amplification of what is covered here.
This volume contains many papers that were solicited by the TRB Committee on Light Rail Transit to address specific topics from a particular perspective. Other papers were received in response to a general call for papers on the fairly narrow conference theme. The result is a well-structured coverage of the cost-effectiveness aspects of LRT design, including systems, construction, operation, and vehicles.
The papers are arranged in four groups that, in general, correspond to the sessions of the conference. Part 1 includes an overview and discussions of cost-effectiveness issues. Part 2 covers policy and planning considerations. Facility design and rail car technology are combined in Part 3. Part 4 concludes with papers on operations.
vii
Part 1 Overview and
Cost-Effectiveness Issues
Current Light Rail Developments in North America Brian E. Sullivan Alberta Department of Economic Development Edmonton, Alberta, Canada
The term "light rail transit" (LRT) means different things to different people. Unlike the various monorails and "people movers,• LRT is not a proprietary mode with a clearly spelled out design patent. Hence, the range of meanings. This paper provides a "snapshot• of the current status of light rail projects in North America. It is purposefully broad in its approach and includes systems with the most sophisticated technological advances. At the same time, it acknowledges that LRT's historical roots lie in the rural tramways and light railways of 19th-century Britain and other European countries as well as urban streetcar networks on both sides of the Atlantic. These systems were characterized by simpler infrastructure than that found with conventional railways. Rolling stock was capable of easy operation in or alongside city streets and, when on its own right-of-way, could cope with sharp curves and gradients and lightweight structures. The notion that the "light" in light rail transit refers to infrastructure is the definitional principle used in this paper. It is this element, and the corresponding wide variety of options available to the designers, that offers North American cities the promise of cost-effective rail transit.
WHY LIGHT RAIL?
The North American economy has been going through an extended period of structural change as the natural resources sector has increased in stature, as new technologies have overtaken the old in manufacturing, and as the professional or • information" services sector (e.g., finance, marketing, research, media, head offices) has expanded rapidly.
The growth in professional services is significant because (a) these activities tend to cluster and (b) there is a strong desire for an attractive environment. These two elements can be viewed as providing an impetus for new investment in downtown areas, which generally offer the best clustering possibilities in an urban area and which usually possess an abundance of interesting architecture and natural features laid out in a fashion amenable to walking.
These are all conditions well suited to LRT. Increased clustering poses a demand for higher capacity transport, and service quality is important to those working in the information sector. LRT can be designed to fit gently into a downtown setting without taking much land or throwing up barriers. Indeed, it can become a feature of landscape design in its own right, setting a special tone for a city.
Not all growing downtown areas will elect to in-
vest in light rail and not all places that install LRT will have a rapidly growing information sector, but the three areas in which light rail can deliver so well (low-cost capacity, service quality, environmental appeal) are assuming an increased importance in any decision to invest as well as in subsequent design activities. Decision makers react not only to the benefits that can be provided by a transport facility or service but also to cost. Here LRT can perform especially well because design standards can vary from the simplest to the most elaborate, depending on the traffic to be handled, preferences of the designers, and capital and operating cost trade-offs. Furthermore, as techniques are relearned in this once-forgotten mode and as technology is transferred from elsewhere, the opportunities for cost reduction improve.
Physical characteristics of a mode provide the fundamental definition of how well it should perform in a given situation, but institutional factors will mask or enhance the results. Aside from such considerations as the operating efficiency of the proposed carrier, there are more subtle human factors at work:
• Confusion about how to treat infrastructure costs has caused more than one study to assume that buses have no infrastructure cost but to fully charge an LRT alternative for its track;
• A transit authority that operates solely buses will find itself with a built-in lobby among its operating and maintenance professionals to remain with that mode; and
• Engineers who are used to designing freeways may tend to propose LRT lines with an extensive amount of structures and "high" geometric standards whether the specifics of the application make such approaches essential or not (why incur the expense of articulated cars capable of operating on steep grades and on sharp curves if the infrastructure is designed with a maximum gradient of 2 percent and with 1,000-ft curves?).
New approaches to financing systems are appearing as well as technological advances. An increasingly popular technique is to obtain a contribution from the private sector for a section of line or a specific facility. Dallas had a piece of right-of-way offered by business people for an LRT network. Edmonton has had a developer contribute to the cost of extending its Northeast line from Belvedere to Clareview. Orlando, Florida (which ultimately changed from LRT to guided rubber-tire technology), has received private money to build its first section of line.
3
:
4
CURRENT DEVELOPMENTS IN LIGHT RAIL
This section deals with present-day developments in urban LRT systems in the United States and Canada. Information was obtained from a survey of 46 transit properties and planning authorities conducted in early 1985, supplemented as appropriate from other sources. The population surveyed was compiled from a list provided by the American Public Transit Association (APTA) of organizations involved in LRT. The data are generally effective March 31, 1985, and describe new lines, extensions, and renovations to lines or cars (rebuilding or replacement). Information is also provided on the status of the activity: planning, design and construction, and recently inaugurated service. Only additions to, or improvements of, systems are included: data on preexisting situations are not discussed.
At the time of the survey, some jurisdiction s were in the midst of preliminary studies comparing light rail with other possible public transport improvements. Examples include Austin, Texas: Oklahoma City, Oklahoma; and Contra Cos ta County, California. Others have proceeded beyond this initial stage and information about them is given in the tables. These jurisdictions are doing detailed planning; have proceeded to design and construction; or have recently opened a new line, an extension, or a renovated line.
Western United States
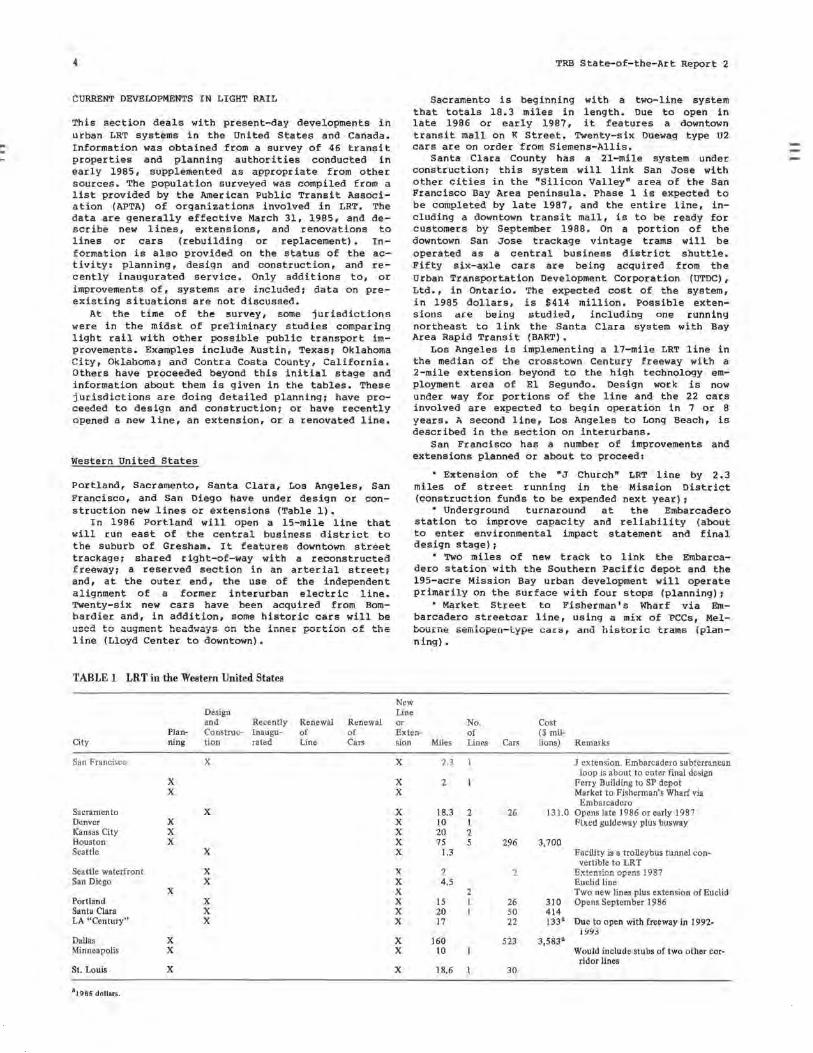
Portland, Sacramento, Santa Clara, Los Angeles, San Francisco, and San Diego have under design or construction new lines or extensions (Table 1).
In 1986 Portland will open a 15-mile line that will run east of the central business district to the suburb of Gresham. It features downtown street trackage 1 shared right-of-way with a reconstructed freeway; a reserved section in an arterial street: and, at the outer end, the use of the independent alignment of a former interurban electric line. TWenty-six new cars have been acquired from Bombardier and, in addition, some historic cars will be
line (Lloyd Center to downtown).
TABLE 1 LRT in the Western United States
City
San Francisco
Sacramento Denver Kansas City Houston Seattle
Seattle waterfront San Diego
Portland Santa Clara LA "Century"
Dallas Minneapolis
St. Louis
al 985 dollars.
Plan-ning
X X
X X X
X
X X
X
Design and Recently Construe- lnaugu-tion rated
X
X
X
X X
X X X
Renewal Renewal of of Line Cars
TRB State-of-the-Art Report 2
Sacramento is beginning with a two-line system that totals 18.3 miles in length. Due to open in late 1986 or early 1987, it features a downtown transit mall on K Street. 'l'Wenty-six Duewag type U2 cars are on order from Siemens-Allis.
Santa Clara County has a 21-mile system under construction: this system will link San Jose with other cities in the "Silicon Valley• area of the San Francisco Bay Area peninsula. Phase 1 is expected to be completed by late 1987, and the entire line, including a downtown transit mall, is to be ready for customers by Septembe•r 1988. On a portion of the downtown San Jose trackage vintage trams will be operated as a central business district shuttle. Fifty six-axle cars are being acquired from the Urban Transportation Development Corporation (UTDC), Ltd. , in Ontario. The expected cost of the system, in 1985 dollars, is $414 million. Possible extensions c1re being studied, including one running northeast to link the Santa Clara system with Bay Area Rapid Transit (BART).
Los Angeles is implementing a 17-mile LRT line in the median of the cross town Cen t ury freeway with a 2-mile extension beyond to the high technology employment area of El Segundo. Design work is now under way for portions of the line and the 22 cars involved are expected to begin operation in 7 or 8 years. A second line, Los Angeles to Long Beach, is described in the section on interurbans.
San Francisco has a number of improvements and extensions planned or about to proceed:
• Extension of the "J Church" LRT line by 2. 3 miles of street running in the Mission District (construction funds to be expended next year) 1
• Underground turnaround at the Embarcadero station to improve capacity and reliability (about to enter environmental impact statement and final design stage) 1
• TWo miles of new track to link the Embarcadero station with the Southern Pacific depot and the 195-acre Mission Bay urban development will operate primarily on the surface with four stops (planning) 1
• Market Street to Fisherman's Wharf via Embarcadero streetcar line, using a mix of PCCs, Mel-LIVU.Lll~ semiopeu-type cac s , and historic trams (plan-ning).
New Line or No. Cost Exten- of ($ mil-sion Miles Lines Cars lions) Remarks
X 2.3 J extension. Embarcadero subterranean loop is about to enter final design
X 2 Ferry Building to SP depot X Market to Fisherman's Wharf via
Embarcadero X 18.3 2 26 131.0 Opens late 1986 or early 1987 X IO I Fix~<! gul<l~way plus busway X 20 2 X 75 5 296 3,700 X 1.3 Facility is a trolleybus tunnel con-
vertible to LRT X 2 2 'PvtPnc.1-inn n.p"'"" 1 OR"7
X 4.5 Euclid line X 2 Two new lines plus extension of Euclid X 15 I 26 3 10 Opens September 1986 X 20 I 50 414 X 17 22 133" Due to open with freeway in 1992-
1~~3 X 160 523 3,583" X 10 Would include stubs of two other cor-
ridor lines X 18.6 30
Light Rail Developments in North 1'.merica
San Diego is enjoying the success of its first line, opened in 1981, south to San Ysidro and the Mexican border. It is currently building to Euclid, the first 4.5-mile stage of its eastern line. Street running and railway rights-of-way figure in this route that will ultimately extend to El Cajon. Planning work has identified two other corridors.
Seattle has completed analysis work for a trolleybus subway that can be converted at a later time to LRT. It also has plans to extend its present waterfront streetcar line to increase riding potential, reaching the Space Needle to the north and the King Dome and the Amtrak station to the south.
Denver, Kansas City, St. Louis, Houston, Dallas, and Minneapolis are all actively planning LRT. Denver, Houston, and Dallas have geographically comprehensive plans that include a mixture of LRT and busways.
Denver has produced a plan providing for an extensive network of busways plus a single, close-in "guideway transit" line.
Houston has evaluated a number of busway and LRT combinations. Public comment thus far has favored an option with a central light rail loop plus key radial lines that total 75 miles. Bus infrastructure would also be built.
Dallas envisions completion of a 160-mile network of LRT by the year 2010 at a capital cost of $3,583 million (1982 dollars). An eventual fleet of 523 is thought to be needed. In concert with the light rail program will be a restructuring of the bus system along timed-transfer focal point principles. The resulting metropolitan cobweb of routes will have 21 major transfer nodes.
Kansas City, St. Louis, and Minneapolis (with St. Paul) are focusing on specific corridors and have both urban development and traffic issues in mind. Both Kansas City and St. Louis plan to make use of redundant railway facilities. Rapid downtown growth has been a factor prompting consideration of LRT in two of the three cities, and a desire for same has fueled interest in the third.
The Minneapolis-st. Paul Regional Transit Board has identified three significant travel corridors for LRT and has selected the University Avenue alignment as its priority for action. This was the region's major transit spine in the days of streetcars because it links the downtowns of the two principal cities. The line would be 10 miles long, in-
TABLE 2 LRT in the Eastern United States
Design and Recently Renewal Renewal
Plan- Construe- Inaugu- of of City ning lion rated Line Cars
Columbus X Buffalo X Cleveland X X X
New Jersey X (Hudson River across from Manhattan)
Newark X X X Philadelphia X X
Pittsburgh X X X
Boston X X
Detroit X
New York X
New Line or
5
eluding two short sections of other corridors out of downtown Minneapolis, which would have throughworked services to St. Paul.
Kansas City has recently begun an alignment study for two LRT corridors each 10 miles long and parallel to each other. One is located within a proposed freeway and the other employs, in part, a right-ofway from the days of the Country Club Plaza car line.
st. Louis has identified for early action an 18.6-mile line that would link the Lambert-St. Louis International Airport, the McDonnell-Douglas Corporation, the University of Missouri, the Washington University Medical Center, downtown St. Louis, and (across the Mississippi River) East st. Louis.
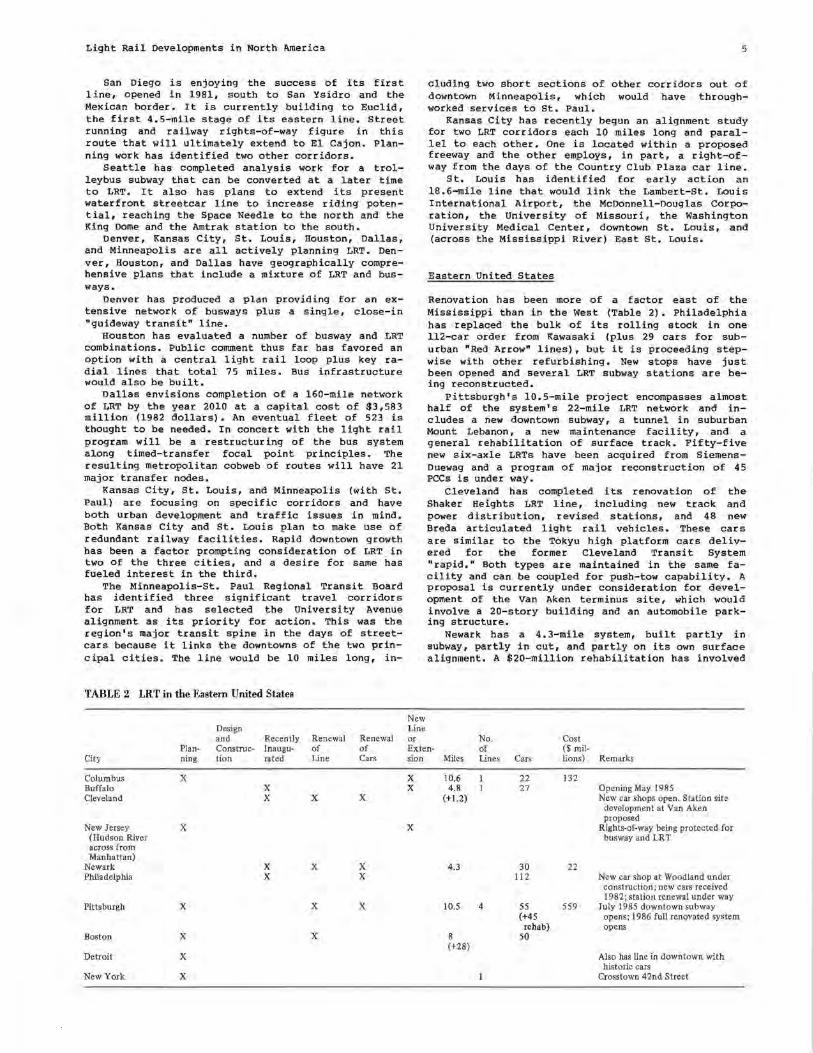
Eastern United States
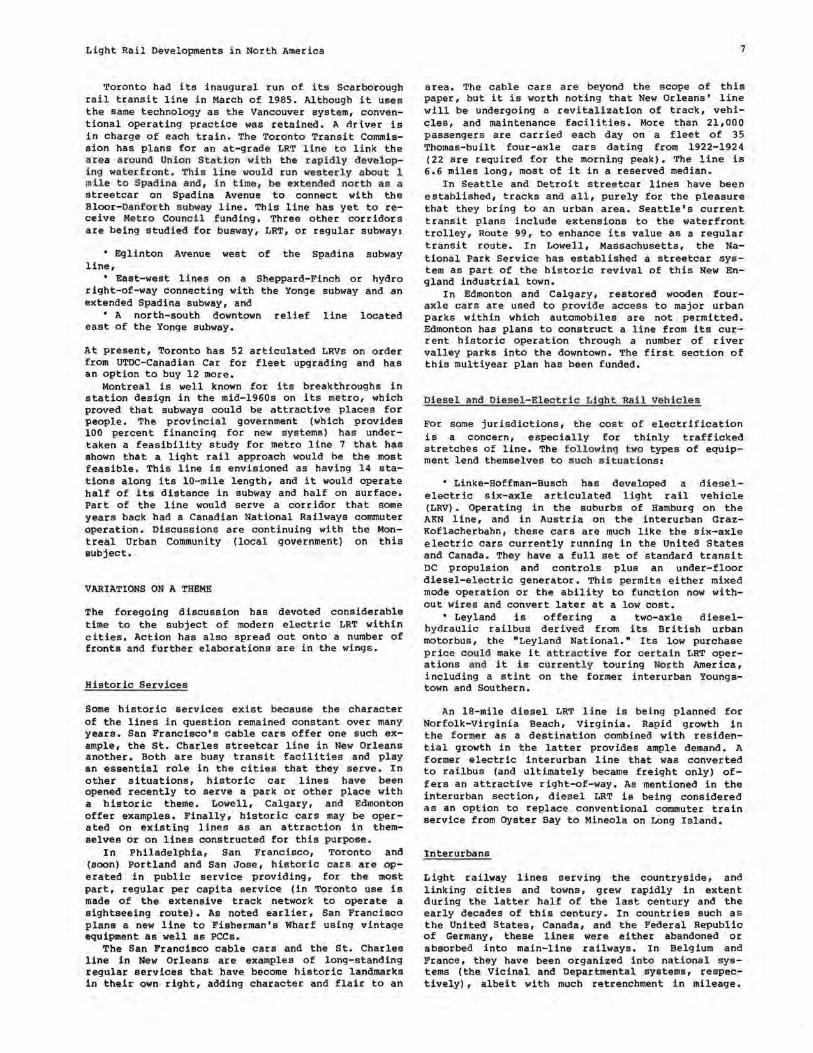
Renovation has been more of a factor east of the Mississippi than in the West (Table 2). Philadelphia has replaced the bulk of its rolling stock in one 112-car order from Kawasaki (plus 29 cars for suburban "Red Arrow" lines), but it is proceeding stepwise with other refurbishing. New stops have just been opened and several LRT subway stations are being reconstructed.
Pittsburgh's 10.5-mile project encompasses almost half of the system's 22-mile LRT network and includes a new downtown subway, a tunnel in suburban Mount Lebanon, a new maintenance facility, and a general rehabilitation of surface track. Fifty-five new six-axle LRTs have been acquired from SiemensDuewag and a program of major reconstruction of 45 PCCs is under way.
Cleveland has completed its renovation of the Shaker Heights LRT line, including new track and power distribution, revised stations, and 48 new Breda articulated light rail vehicles. These cars are similar to the Tokyu high platform cars delivered for the former Cleveland Transit System "rapid." Both types are maintained in the same facility and can be coupled for push-tow capability. A proposal is currently under consideration for development of the Van Aken terminus site, which would involve a 20-story building and an automobile parking structure.
Newark has a 4. 3-mile system, built partly in subway, partly in cut, and partly on its own surface alignment. A $20-million rehabilitation has involved
No. Cost Exten- of ($ mil-sion Miles Lines Cars lions) Remarks
X 10.6 22 132 X 4.8 27 Opening May 1985
(+1.2) New car shops open. Station site development at Van Aken proposed
X Rights-of-way being protected for busway and LR T
4.3 30 22 112 New car shop at Woodland under
construction; new cars received 1982; station renewal under way
10.5 4 55 559 July 1985 downtown subway (+45 opens; 1986 full renovated system
rehab) opens 8 50 (+28)
Also has line in downtown with historic cars
Crosstown 4 2nd Street
.. ..
6
station refurbishing, reconstruction of the track structure, and overhead current distribution. The fleet of 24 PCCs has been put into mint condition, and ceramic tile murals in the stations have been restored. The downtown terminus and maintenance facility is beneath the restored Penn Station, an intercity rail and bus facility.
LRT activity in New Jersey is not limited to Newark. On the western shore of the Hudson River opposite Manhattan there is considerable developer interest in urban rejuvenation. This in turn is prompting consideration of LRT and busways with the associated protection of rights-of-way.
In New York City a proposal for a surface car line on 42nd street is receiving considerable public discussion because of its value both as a quality transport service and as a stimulus to renewal of this historically significant street. The Hudson River terminus of such a line is viewed as a poooible docking area for a proposed ferry to New Jersey.
In Boston 50 new light rail vehicles, with chopper DC controls by Westinghouse, are on order from Kinki-Sharyo. A number of extensions to existing LRT lines plus one long interurban route are planned as shown in the following table.
Route Lechmere-Medford Dudley Square-Downtown Boston Green line extension to Watertown
Length (miles) 3.5 2.2 2.3
None of the mileage is currently under construction. The question of finance is still being pursued.
Buffalo provides the one eastern example of a new-from-the-ground-up offering. Opening this year, it operates in subway through residential areas and in the suburbs. In the central business district it operates on a transit mall using 27 four-axle LRVs manufactured by Tokyu Car in concert with Westinghouse. An interesting feature is the use of the former Lackawanna railway station as the new LRT --J-~------ ~---IUG.1.11\..CIJQll"-'IC' ua.o.11,i;; •
In Columbus a 10.6-mile line in the city and county North Corridor is under study. The expected capital cost would be $159 million for an alignment between two major railroads and a downtown transit mall.
TABLE 3 LRT in Canada
Design and Recently Renewal Renewal
Plan- Construe- Inaugu- of of City rung tion rated Line Can
Calgary X X
Edmonton X
Vancouver X
Toronto Scarborough X Waterfront X
(and Spadina) X
Montreal X
TRB State-of-the-Art Report 2
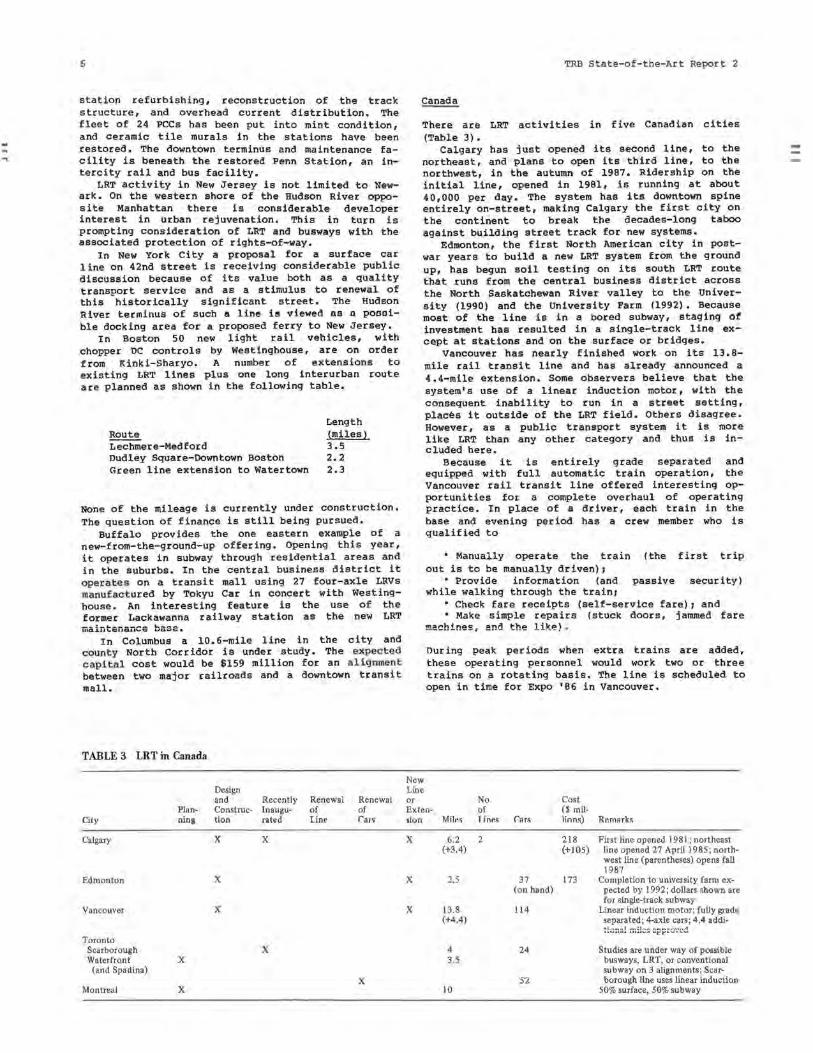
There are LRT activities in five Canadian cities (Table 3) •
Calgary has just opened its second line, to the northeast, and plans to open its third line, to the northwest, in the autumn of 1987. Ridership on the initial line, opened in 1981, is running at about 40,000 per day. The system has its downtown spine entirely on-street, making Calgary the first city on the continent to break the decades-long taboo against building street track for new systems.
Edmonton, the first North American city in postwar years to build a new LRT system from the ground up, has begun soil testing on its south LRT route that runs from the central business district across the North Saskatchewan River valley to the University (1990) and the University Farm (1992). Because most of the line is in a bored subway, staging ot investment has resulted in a single-track line except at stations and on the surface or bridges.
Vancouver has nearly finished work on its 13.8-mile rail transit line and has already announced a 4 .4-mile extension. Some observers believe that the system's use of a linear induction motor, with the consequent inability to run in a street setting, places it outside of the LRT field. Others disagree. However, as a public transport system it is more like LRT than any other category and thus is included here.
Because it is entirely grade separated and equipped with full automatic train operation, the Vancouver rail transit line offered interesting opportunities for a complete overhaul of operating practice. In place of a driver, each train in the base and evening period has a crew member who is qualified to
• Manually operate the train (the first trip out is to be manually driven),
• Provide information (and passive security) while walking through the traini
• Check fare receipts (self-service fare) 1 and • Make simple repairs (stuck doors, jammed fare
m~~hino~i ~nn ~ho 1;k~\ .
During peak periods when extra trains are added, these operating personnel would work two or three trains on a rotating basis. The line is scheduled to open in time for Expo '86 in Vancouver.
New Line or No. Cost Exten- of ($ mil-don Miles T.ines f:ars Jinns) Remarks
X 6.2 2 218 First line opened 1981; northeast (+3.4) (+105) line opened 27 April 1985; north-
west line (parentheses) opens fall 1987
X 2.5 37 173 Completion to university farm ex-(on hand) pected by 1992; dollars shown are
for single-track subway X 13.8 114 Linear induction motor; fully grade
(+4.4) separated; 4-axle cars ; 4.4 addi-,._;--~1 -..:1~., ,. .......... "u".:I \. .. VJ.U,U, UUJ.'-'"' ... ,t't'J.U,._.M.
4 24 Studies are under way of possible 3.S busways, LRT, or conventional
subway on 3 alignments; Scar-52 borough line uses linear induction
10 50% surface, 50% subway
Light Rail Developments in North America
Toronto had its inaugural run of its Scarborough rail transit line in March of 1985. Although it uses the same technology as the Vancouver system, conventional operating practice was retained. A driver is in charge of each train. The Toronto Transit Commission has plans for an at-grade LRT line to link the area around Un ion Station with the rapidly developi ng waterfron t . Th i s l ine would run west erly about 1 mi1e t o Spad i na a nd, i n time, be extended no r t h as a streetcar on Spadina Avenue to connect with the Bloor-Danf or th subway line. This line has yet to receive Metro Counc il funding. Three other corridors are being studied for busway, LRT, or regular subway:
• Eglinton Avenue west of the Spadina subway line,
• East-west lines on a Sheppard-Finch or hydro right-of-way connecting with the Yonge subway and an extended Spadina subway, and
• A north-south downtown relief line located east of the Yonge subway.
At present, Toronto has 52 articulated LRVs on order from UTDC-Canadian Car for fleet upgrading and has an option to buy 12 more.
Montreal is well known for its breakthroughs in station design in the mid-1960s on its metro, which proved that subways could be attractive places for people. The provincial government (which provides 100 percent financing for new systems) has undertaken a feasibility study for metro line 7 that has shown that a light rail approach would be the most feasible. This line is envisioned as having 14 stations along its 10-mile length, and it would operate half of its distance in subway and half on surface. Part of the line would serve a corridor that some years back had a Canadian National Railways commuter operation. Discussions are continuing with the Montreal Urban Community (local government) on this subject.
VARIATIONS ON A THEME
The foregoing discussion has devoted considerable time to the subject of modern electric LRT within cities. Action has also spread out onto a number of fronts and further elaborations are in the wings.
Historic Services
Some historic services exist because the character of the lines in question remained constant over many years. San Francisco's cable cars offer one such example, the St. Charles streetcar line in New Orleans another. Both are busy transit facilities and play an essential role in the cities that they serve. In other situations, historic car lines have been opened recently to serve a park or other place with a historic theme. Lowell, Calgary, and Edmonton offer examples. Finally, historic cars may be operated on existing lines as an attraction in themselves or on lines constructed for this purpose.
In Philadelphia, San Francisco, Toronto and (soon) Portland and San Jose, historic cars are operated in public service providing, for the most part, regular per capita service (in Toronto use is made of the extensive track network to operate a sightseeing route). As noted earlier, San Francisco plans a new line to Fisherman's Wharf using vintage equipment as well as PCCs.
The San Francisco cable cars and the St. Charles line in New Orleans are examples of long-standing regular services that have become historic landmarks in their own right, adding character and flair to an
7
area. The cable cars are beyond the scope of this paper, but it is worth noting that New Orleans' line will be undergoing a revitalization of track, vehicles, and maintenance facilities, More than 21,000 passengers are carried each day on a fleet of 35 Thomas-built four-axle cars dating from 1922-1924 (22 are required for the morning peak). The line is 6.6 miles long, most of it in a reserved median.
In Seattle and Detroit streetcar lines have been established, tracks and all, purely for the pleasure that they bring to an urban area. Seattle's current transit plans include extensions to the waterfront trolley, Route 99, to enhance its value as a regular transit route. In Lowell, Massachusetts, the National Park Service has established a streetcar system as part of the historic revival of this New England industrial town.
In Edmonton and Calgary, restored wooden fouraxle cars are used to provide access to major urban parks within which automobiles are not permitted. Edmonton has plans to construct a line from its current historic operation through a number of river valley parks into the downtown. The first section of this multiyear plan has been funded.
Di ese l and Diese l-Electr i c Light Rail Veh i c les
For some jurisdictions, the cost of electrification is a concern, especially for thinly trafficked stretches of line. The following two types of equipment lend themselves to such si tuations:
• Linke-Hoffman-Busch has developed a dieselelectric six-axle articulated light rail vehicle (LRV) • Operating in the suburbs of Hamburg on the AKN line, and in Austria on the interurban GrazKoflacherbahn, these cars are much like the six-axle electric cars currently running in the United States and Canada. They have a full set of standard transit DC propulsion and controls plus an under-floor diesel-electric generator. This permits either mixed mode operation or the ability to function now without wires and convert later at a low cost.
• Leyland is offering a two-axle dieselhydraulic railbus derived from its British urban motor bus, the nLeyland National. n Its low purchase price could make it attract i ve for certa i n LRT operations and it is currently touring North America, including a stint on the former interurban Youngstown and Southern.
An 18-mile diesel LRT line is being planned for Norfolk-Virginia Beach, Virginia. Rapid growth in the former as a destination combined with residential growth in the latter provides ample demand. A former electric interurban line that was converted to railbus (and ultimately became freight only) offers an attractive right-of-way. As mentioned in the interurban section, diesel LRT is being considered as an option to replace conventional commuter train service from Oyster Bay to Mineola on Long Island,
Interurbans
Light railway lines serving the countryside, and linking cities and towns, grew rapidly in extent during the latter half of the last century and the early decades of this century. In countries such as the United States, Canada, and the Federal Republic of Germany, these lines were either abandoned or absorbed into main-line railways. In Belgium and France, they have been organized into national systems (the Vicinal and Departmental systems, respectively), albeit with much retrenchment in mileage.
8
In countries such as Switzerland and Japan, many have been continuously upgraded and modernized and function today as high-quality, regional electric railways (the Bern-Solothurn and the Kinki-Nippon are examples).
In the United States, there are three such operations and plans to establish new services, some on corridors once served by interurbans and some as replacements for traditional commuter railways:
• The Chicago, South Shore and South Bend extends 90 miles between its named end points. East of Gary, Indiana, it is a low-frequency rural line, popular with middle class families in spite of a more frequent intercity bus service on freeways. As it approaches the commuter shed of Chicago, it takes on the character of a busy commuter line, although it still possesses a mixed-traffic street alignment through Michigan City. Delivery has been complete<'! on an order of 44 cars, to replace prewar equipment.
• Also operating out of Chicago is the 5-mile inner portion of the former Chicago, North Shore and Milwaukee. Linking some northern suburbs of Chicago with that city's rapid transit system, the "Skokie Swift" uses 12 high platform cars, 4 of them articulated. A program is currently under way to replace these with married pairs, rebuilt from existing urban cars.
• A re-equipping program has also recently been completed on Philadelphia's suburban division ("Red Arrow Lines") of the Southeastern Pennsylvania Transit Authority. Twenty-nine double-ended cars provided by Kawasaki were supplied to the Media and Sharon Hill lines in 1981-1982. The high geometric standard Norristown line continues to use its 1934 "Bullet• high-speed cars.
• California's last interurban to carry passengers ended its service between Long Beach and Los Angeles in 1961. Current plans of the Los Angeles County Transportation Commission include reinauguration of this route using the original Pacific Electric right-of-way where available, as well as a new alignment in subway under Flower Street, to access the Los Angeles city center. Twenty-one miles in length, this line will require 32 six-axle cars to begin service, planned for 1989. The $595 million (1985 dollars) cost is being paid for from Proposition A funds, and the project is in the final design phase.
• The Massachusetts Bay Transportation Authority has plans for a 28-mile LRT line from the Boston South Station to Scituate. This route would serve the general territory of the Old Colony Line. Considerations to be dealt with before proceeding include the status of this interurban light rail line vis-a-vis traditional commuter rail.
• A study conducted by the Long Island Rail Road has recommended the replacement of dieselhauled commuter trains with LRT on its 14.5-mile Oyster Bay-Mineola line. This is viewed as less expensive than continuing with the traditional railroad service: it also has the potential or increasing ridership to more than the present 5,700 per day. Also being studied is a connection of the Oyster Bay and West Hempstead branches using a light
TRB State-of-the-Art Report 2
rail line that would operate through downtown Hempstead. Diesel LRT is thought to be a less costly technology for this line. Implementation by 1989 would be coordinated with New York State DOT's Mineola grade crossing elimination project, which would save $10 million. Successful operation is dependent on transfer of the service from a commuter railroad institution to one that functions under transit operating rules.
• In the San Francisco Bay Area the Metropolitan Transportation Commission is undertaking a study of options for the upgrading of the 45-mile San Francisco-San Jose commuter rail line. One of the three options is the conversion of the line to an interurban LRT type of service.
In Canada all of the one-time interurban lines have been abandoned or are used only for freight. An interesting breakthrouqh, however, is the program of Ontario's GO Transit to build altogether new interurban lines where none existed before. Known as "GOALRT, • the network as planned will consist of four sections as shown in the following table.
Section Pickering-Oshawa Oakville-Hamilton Central Lakeshore (Oak-ville-downtown TorontoPickering)
Northern section (Oakville-Toronto-International Airport-Scarborough-Pickering)
Total
Length in km (miles)
25 (15.6) 34 (21.3)
68 (42.5)
100 (62.5) 227 (141.9)
The total cost of the first two sections is $690 million and includes planning work on other sect ions. Maximum loads of 15,000 passengers per peakhour direction are foreseen for the planning horizon year of 2021 on the Lakeshore section, and 17,000 passengers per peak-hour direction are forecast by GO Transit for the northern section. Trains are to be composed of eight-axle married pairs, capable of sustained running at 120 kmihr (75 mphj, on steerable trucks. Line voltage is to be 25,000 volts AC, with 600 volts DC at the traction motor.
CONCLUSION
In the past decade light rail transit has grown rapidly as a mode of urban transport, both in terms of planning interest and in the number of jurisdictions making investments.
LRT, with its range of design standards, is ideally positioned with respect to the public transportation needs of communities in the economy of the future. Its mix of service quality, cost, and environmental and design opportunity make it suitable for a wide variety of applications between the automobile on one hand and "heavy• rapid transit on the other.
Determining Cost-Effectiveness of Transit Systems PaulN.Bay Metropolitan Transit Authority Houston, Texas
Cost-effectiveness is, by definition, a term with two components: "cost" and "effectiveness.• Each component has both broad and narrow definitional possibilities. Further, the word "effectiveness" implies a goal or set of goals against which effectiveness is measured. To determine effectiveness, the intent, the effects to be achieved, must first be stated. Because transit goals are typically stated in broad terms, transit "effectiveness" is also likely to be broadly defined. Obviously, definitions are required if sense is to be made of the subject.
Presented in this paper is a .i:ange of possible definitions, with a brief discussion of the problems of measurement of each. There follow some simplified definitions and measurements that might be used in attacking the problem of deciding when light rail transit might be considered a cost-effective alternative.
COST
In considering the definition of "cost," and deciding what should and should not be included, each of the following categories is a possible candidate.
Initial Capital Cost
• Engineering , • Right-of-way, • Construction, • Vehicles, • Equipment, and • Facilities.
Replacement, Renovation, and Upgrading Costs over an Extended Period of Time
• Vehicle replacement, • Grade separations, • Signals and train • Station additions • Engineering and
associated with them.
control improvements, or improvements, and construction costs that are
Operating Costs over an Extended Period of Time
These costs include such indirect costs as administration, overhead, taxes, and insurance.
Financing Costs
• Debt service on bonds or short-term borrowing, • Bond counsel and other financing fees, • Impact of restrictions resulting from bond
protective covenants, and, possibly, • Lost interest on investments or "opportunity
costs.n
System Cost Versus Marginal Costs
These are any or all of the previously mentioned costs applied systemwide and include all local feeder bus service, park-and-ride lots, and so forth versus the incremental cost of a given line, segment, or system portion over and above some lesser portion.
Total cost Versus Local Cost
This is based on revenue sources: the portion of the total cost that is being paid by the implementing agency (local funds) or the amount being paid by the principal funding agency (federal funds).
Community cost
This is total transportation system costs for all modes paid by public and private sources. This could be capital costs only or could include operating costs as well. This could provide a theoretically rigorous way of testing the thesis that transit expenditures could reduce highway and private automobile expenditures by taking the top off the peak travel periods.
Some have suggested that the community cost category might include other costs of any given transportation system mix, including construction impacts, levels of congestion, air quality, ambient noise levels, urban design and visual obtrusiveness, accident rates or other measures of safety, property values, job accessibility, economic development, freedom of mobility, social unity or division, neighborhood integrity and other "equality of life" factors, some of which are quite subjective and nonquantifiable.
This preliminary and not at all exhaustive list of possibilities addresses only the "cost" component of the term, "cost-effectiveness," but it does begin to illustrate the difficulties inherent in attempting to answer the seemingly simple question: "How much will this system cost?" Not only is the definition
9
"' ..
10
of cost an important and complex matter, but the measurement of cost is difficult even when a definition has been agreed on. Even if all costs are measured in dollars, a decision has to be made about how to treat the time value of money, taking into consideration both inflation and interest rates. Years ago, Grant and Ireson (1) published the classic college textbook on engineering economy, but, once out of school, most engineers and planners have honored it only in the breach. Its principles have not been rigorously applied in either the highway engineering or the transit planning field. As a result, time value of money is usually not considered properly or consistently.
EFFECTIVENESS
To decide if a transit system is effective, it must be asked: "Effective in doing what?" There follow some of the categories that have been traditionally held as transit goals plus some that have not been considered as goals but perhaps should be.
Ridership Goals
• 'l'otal system ridership? • Ridership on a particular route, guideway, or
segment? • Incremental ridership gains over some other
option? • Peak-hour ridership goals, daily riders, or
annual riders per capita?
Corridor Capacity Increase
This is the ability to handle growth or reduce congestion, or both, in a given corridor or set of corridors.
Reduce Travel Time
Travel time reductions can be considered systemwide or in a particular corridor or set of corridors.
Increasing Connectivity or Accessibility by Transit
This could be for all trips, work trips, or some o t her set of trip purposes .
Reduci ng ~nvi ronment a Impacts
Such impacts can be compared with those of a "highway improvements only" alternative, a "do nothing• alternative, or any other alternativ~.
Economic Development or Redevelopment
This could be anything from downtown revital.1zat1on to the ambitious goal of shaping or reshaping a region or a portion of a region to make it more generally sellable through tourism, new jobs, new kinds of industry, and so forth.
Solving Political Problems
These goals can range from reallocating or redistributing wealth, providing for greater social
TRB State-of-the-Art Report 2
equity, equalizing services, and dealing with tax inequities, to building monuments or helping powerful interests.
Reducing Total Transportation Costs
This goal would be to reduce the total cost to the community of providing a certain level of mobility or accessibility for all or most citizens. As in the •cost• side of the equation, this goal could be limited to reduced capital expenditures by the public for the combination of highway and transit facilities or it could be broadened to include both public operating and private transportation costs--automobile amortization, insurance, fuel, and maintenance.
GOAL SETTING
The conclusion inevitably reached from the preceding is that it is literally impossible to prove when a transit system is cost-effective unless the set of goals to be achieved has been defined in as precise and quantitative a way as possible and estimates have been made of the cost of achieving those goals under each of several different transit-transoortation scenarios.
The major problem with this is that goals have not been well defined. Goals, as defined, have tended to be general and nonspecific (i.e., "improve environmental quality,• "reduce congestion,• •enhance urban mobility,• and "develop downtown"). Alternatively, goals have been defined in a manner that defeats the purpose and thereby loses credibility and public understanding. The primary example of this is an emphasis on line ridership as the only publicly stated goal. Ridership is important--probably the single most important goal that is both easily measurable and central to other goals. However, if systemwide goals are not understood, kneej erk reactions to early ridership figures can be highly misleading.
C.ALCULATING COSTS
Not only have goals not been defined well, but results of calculations of costs in the transit costeffectiveness analyses done nationwide have been wildly at variance with one another. Clearly, there is no agreement among even knowledgeable academics, consultants, and partitioners about what items should be included in the answer to the question: "How much did that transit system cost?"
Most agree that initial line capital costs should be included but differ on whether and how to include line operating costs, local bus feeder service costs, financing costs, or total transit system costs. The time value of money is also treated differently, as was mentioned previously.
DEFINITION ANO EVALUATION OF ALTERNATIVES
The problems of goal setting and cost determination are difficult, but what really leads to never-never land is the task of defining and costing alternatives to any actual or proposed transit system that are capable of achieving the same set of goals.
If alternatives are defined and costed, theoretically it can be determined whether the transit system under consideration achieves the goals at less cost or at greater cost than do the alternatives. Without comparing a specific transit system to such alterna·- · tives, only the goals the system under consideration
Determining Cost-Effectiveness
achieves and at what cost can be stated. Whether or not that cost is "cost-effective• is a value judgment determined by what any individual or group is willing to pay for achieving those goals.
The difficulty comes in addressing "what if's": "What if we had built a busway instead of a light rail line?" "What if we do nothing but stick with the status quo?" "What if we just widen the freeway?" Deciding "what if" means guessing the effects that ensue when only one variable is changed in a highly complex mix of hundreds of dependent and interdependent variables that make up an urban social and physical setting. This was nowhere hetter illustrated than in the fierce--and ultimately futile--arguments that raged among the planners, economists, engineers, and political scientists hired to do the Bay Area Rapid Transit (BART) impact study over the problem of defining the so-called "No-BART Alternative.• If BART had not been built, would a new bridge across San Francisco Bay have been built instead? Would AC Transit's bus system have been further expanded? Would the San Francisco and East Bay freeways have been wider? Would there have been fewer high-rise office buildings in downtown San Francisco? would more or fewer people be living in the suburbs? And what would have been the costs and impacts of any or all of those other things? To this day, some wellknown academics at the University of California, Berkeley, who were involved in those debates per i odically renew their luster (or notoriety) by delivering themselves of pontifical opinions about BART. These opinions gain them attention but have no more relevance to the real world than do medieval monks' arguments about the number of angels that can be accommodated on the head of a pin.
WHAT THEN?
It could be concluded from the foregoing that a cost-effectiveness determination is hopeless and that the effort should be given up, but that would not be the author's intention or viewpoint. There is hope, in spite of the difficulties, that analysis can help overall understanding and improve decision making. Common sense and consistency, more than rigorous and theoretically pure conclusions, are needed. A better job can be done than has been done in the past. Two seemingly contradictory recommendations follow.
Broaden t he Analys i s Base
In this author's judgment, much of the previous work in evaluating transit systems has been off the mark because it has been too limited in terms of both costs considered and effects produced. Transit alone has been examined, not the total transportation system of which it is a part. (Some would go even further and look at all the land use, environmental, social, physical, and economic systems with which the transportation system interacts, but that raises too many of the difficulties described in the BART impact studies.)
There are real-world definable trade-offs between transit costs and highway costs for both public entities and private individuals. These have not traditionally been viewed in terms of systemwide transportation. However, to do justice to this subject, a long-term view must be taken--probably 25 years as a minimum--and more research is needed. A fascinating research project that should be undert aken would be to chart the total public and private e xpenditur es for transportation since the end of World War II in a range of metropolitan areas--some
11
of which have chosen higher transit expenditures and some of which have put all their eggs in the highway basket. Toronto, Washington, San Francisco-Oakland, and Atlanta might be chosen for one category, and Houston, Los Angeles, Denver, and Seattle or Dallas might be chosen for the second category.
Such a research project would consider all expenditures, including construction, maintenance, upgrading, and repair, for freeways, arterial streets, and bridges, and the transportation equipment and facilities and manpower used by state highway departments, local governments, and private developers. It would i nclude all transit costs in a similar way: bus purchase and replacement, garages, rail lines, operating and maintenance costs--the works. Then it would use fare-box revenue, gasoline sales data, vehicle registration figures, insurance industry records, and "Hertz-type" automobile operating cost data to calculate private transportation costs, taking care to avoid double counting. Some judgments would have to be made about including such things as commercial parking lot construction and local residential streets, but the decisions would probably be less important than consistency among all the cities.
Then, when the cost side of the ledger for all these metropolitan areas has been examined, "effectiveness" or goal attributes could be looked at: congestion levels, trave l times, mobility l evels , job choices withi n 30-min travel time, and so for th . Although such as analysis might still beg the question of which type of city is "best,• it would clearly show the total transportation costs and the results over an extended period of time. It would not be surprising to find that the cities that spent highe r l evels of money on transit actually spent l ess in tot al on all transportation and achieved comparable levels of personal mobility.
Narrow t he Analysi s Base
In the absence of long-term research information as just proposed, decisions still have to be made. To do this, a narrowing of the analysis is necessary, and this is forgivable if consistency is maintained from location to location. The cost-effectiveness criteria proposed by UMTA in the new alternatives analysis requirements are a good starting point for such a short-hand approach. Some transit planners will dispute this judgment, and, of course, improvements are possible, as suggested next.
The UMTA criteria focus, first, on segment capital costs and marginal operating costs and, second, on marginal ridership increases. Those are measurable, and t hey fit the reasonableness test of t he average pers on . They ar e understandable. As s uch, they c onstitute a good start in a s implif ied approac h to making judgments about cost-effectiveness.
The area that is left out of the UMTA analysis is the marginal cost impact of the transit investment on total transportation syst em costs. Such an analysis is possible in a simpl ified form as well as in a long-term and comprehensive form. For example, if construction of a light rail line will eliminate the need to add two freeway lanes in each direction in the same corridor to handle projected peak-hour demands, and if it can reasonably be shown that the cost of building those added lanes is a certain amount, that amount should be included in the UMTA alternatives analysis--not just transit alternatives versus other transit alternatives.
If the UMTA cost-effectiveness criteria were used and the marg inal cost impact on highway improvement requirements were added to those er i ter ia, the results might be closer to the mark.
:
12
SUMMARY AND CONCLUSIONS
An examination of the literature makes it clear why there are so many arguments about transit's cost-effectiveness. Lack of clarity and consistency in definitions, measurements, and methodology has characterized the whole field for 20 years. The author recommends three things to reduce the present ambiguities:
1. Transit cannot be examined in isolation, but only as part of the total transportation system for any community--costs and effects must be broadened to include the highway and automobile part of the system. However, this broadening should not try to also include social, environmental, and economic costs and effects in a rigorous way. Such factors can be examined in a subjective, judgmental manner, but that should be separate from the quantitative analysis of the transportation system.
TRB State-of-the-Art Report 2
2. To do a better job of understanding the total costs and effects of alternative transportation systems, some broader, long-term research is badly needed.
3. In the shorter term, the UMTA cost-effectiveness criteria represent a good start toward greater consistency although they lack the broad base that research might provide. However, the UMTA cost-effectiveness criteria should be modified to permit inclusion of related marginal highway cost impacts in a manner consistent with the treatment of marginal transit cost impacts.
REFERENCE
1. E.L. Grant and w. Ireson. Principles of Engineering Economy, 5th ed. Ronald Press Company, New York, 1970.
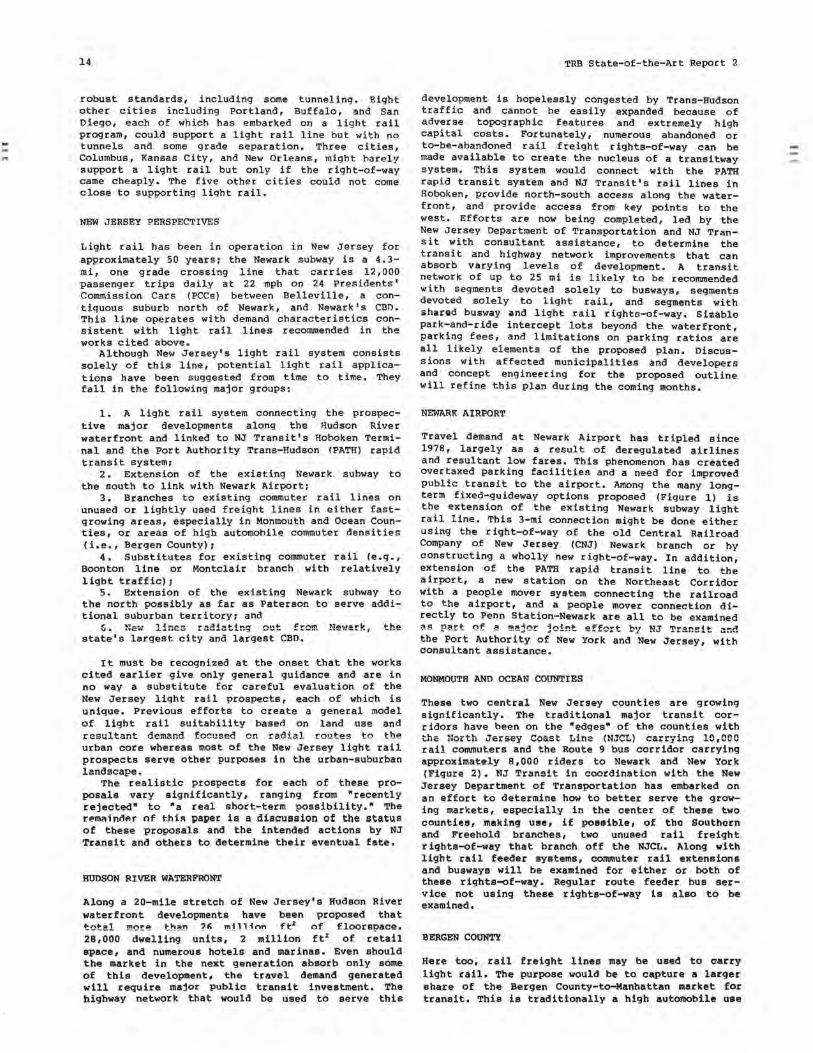
Light Rail: Prospects and Perspectives Jeffrey M. Zupan Department of Planning, New Jersey Transit Corporation Newark, New Jersey
In the 1970s this author, while employed by Regional Plan Association (RPA), a New York region-based planning and research not-for-profit organization, participated in two large studies that sought to define the lane use conditions consistent with a variety of puhlic transit modes. In Public Transportation and Land Use Policy (_!) transit cost and demand estimates were determined for hypothesized residential and nonresidential densities and development patterns. The result was a generalized topography of "where transit works." Modes examined included taxi, dial-a-bus, local bus, express bus, light rail, automated guideway transit, rapid transit, and commuter rail. Following this effort, in Urban Rail in America (2) a more specific effort to define appropriate demand thresholds for light rail, rapid transit, and downtown people movers was undertaken. These thresholds, based on service frequency, operating savings, capital investment levels, and energy and land savings, were applied to the major urban regions in American to establish a generalized level of national investment for fixed-guideway transit.
The findings of these two works as they relate to light rail are reviewed briefing because such material is readily available elsewhere. The primary focus of this paper is on observations about light rail from the perspective of a planner who is currently responsible for helping to shape the future transit system of the fourth largest transit system in the nation, NJ Transit.
FINDINGS OF RPA STUDIES
In Public Transportation and Land Use Policy (..!) the focus on light rail was largely on an examination of land use characteristics that could generate a level of demand, measured in daily passenger-miles or passengers, to support light rail transit as a linehaul mode in a residential corridor leading to a major central business district (CBD). In terms of operating costs per passenger, which are lower than those for local bus service, a niche for light rail was found in CBDs larger than 20 million ft 2
, However, on a capital cost basis, measured as capital investment per daily passenger-mile, a light rail line required a CBD of more than 35 million ft2
unless the light rail right-of-way could be built cheaply (i.e., largely at grade). With a downtown of this size considerable investment in right-of-way, including some tunneling, to keep the line free from vehicle traffic interference, could be justified. Light rail was shown to be a reasonable option in
corridors with residential densities averaging 9 dwellings per acre over an area of 25 mi 2 or larger. A full discussion appears elsewhere (_!,pp,155-162, 187-188). It is of interest here, and for subsequent discussion, to note that the niche for express bus service was shown to be roughly the same as for light rail, with park-and-ride bus services possible for CBDs in the 20 million ft 2 range, but that "walk-on" express bus was shown to require CBDs of 50 million ft 2 or more.
In Urban Rail in America (2) trip demand-based criteria were developed for the-three fixed-guideway modes examined. Each of these criteria was calculated with a common measure, annual place-miles of service per line-mile (apmplm) where a place-mile was defined as one place occupying 6 ft 2 in a transit vehicle multiplied by l mi of vehicle movement.
The five criteria were
1. nemand sufficient to warrant at least a 7 1/2 min peak-period service headway consistent with the maximum such headway provided hy existing fixedguideway systems; this translates into a demand threshold of 5 million apmplm required for light rail;
2, Demand sufficient to create labor savings compared to bus service where light rail is assumed to average 20 mph and 8 trains an hour and buses are assumed to average 12 mph; this translates to 4 million apmplm required for light rail;
3. Demand sufficient to create life-cycle energy savings compared to mode used by travelers before they diverted to light rail; this measure varies widely from 7 million to 35 million apmplm with the lowest number in effect if no tunneling is required and the highest if the entire line is in tunnel;
4. Demand sufficient to save land compared to that consumed by automobile and bus use; this translates to 6 million apmplm if the automobile access was by arterial roadway and 16 million apmplm if by freeway; and
5. Demand sufficient to warrant capital investment per passenger-mile consistent with the median value of current fixed-guideway investments; this translates to 5, 9, or 16 million apmplm assuming all at-grade construction, 1/3 in cut and fill, or 1/5 in tunnel, respectively,
When these criteria were arrayed against the estimated major corridor demand in 24 u.s. cities not fully committed to rapid transit systems, it was shown that Seattle, Detroit, Honolulu, Houston, Dallas, St. Louis, Pittsburgh, and Milwaukee could each support at least one light rail line of quite
13
14
robust standards, including some tunneling. Eight other cities including Portland, Buffalo, and San Diego, each of which has embarked on a light rail program, could support a light rail line but with no tunnels and some grade separation. Three cities, Columbus, Kansas City, and New Orleans, might barely support a light rail but only if the right-of-way came cheaply. The five other cities could not come close to supporting light rail.
NEW JERSEY PERSPECTIVES
Light rail has been in operation in New Jersey for approximately 50 yearsi the Newark subway is a 4.3-mi, one grade crossing line that carries 12,000 passenger trips daily at 22 mph on 24 Presidents' Commission Cars (PCCs) between Belleville, a contiguous suburb north of Newark, and Newark's CBD. This line operates with demand characteristics consistent with light rail lines recommended in the works cited above.
Although New Jersey's light rail system consists solely of this line, potential light rail applications have been suggested from time to time. They fall in the following major groups:
1. A light rail system connecting the prospective major developments along the Hudson River waterfront and linked to NJ Transit's Hoboken Terminal and the Port Authority Trans-Hudson (PATH) rapid transit system;
2. Extension of the existing Newark subway to the south to link with Newark Airport;
3. Branches to existing commuter rail lines on unused or lightly used freight lines in either fastgrowing areas, especially in Monmouth and Ocean Counties, or areas of high automobile commuter densities (i.e., Bergen County);
4. Substitutes for existing commuter rail (e.g., Boonton line or Montclair branch with relatively light traffic);
5. Extension of the existing Newark subway to the north possibly as far as Paterson to serve additional suburban territory; and
" U•
state's largest city and largest CBD. the
It must be recognized at the onset that the works cited earlier give only general guidance and are in no way a substitute for careful evaluation of the New Jersey light rail prospects, each of which is unique. Previous efforts to create a general model of light rail suitability based on land use and r~sultant demand focused en r ad ial routes to the urban core whereas most of the New Jersey light rail prospects serve other purposes in the urban-suburban landscape .
The realistic prospects for each of these proposals vary significantly, ranging from wrecently rejectedw to wa real short-term possibility.w The remaindAr nf ~hiR paper is a discussion of the status of these proposals and the intended actions by NJ Transit and others to determine their eventual fate,
HUDSON RIVER WATERFRONT
Along a 20-mile stretch of New Jersey's Hudson River waterfront developments have been proposed that t~t~l m~~~ th~n 26 millinn ft2 of floorsoace. 28,000 dwelling units, 2 million ft 2 of r~tail space, and numerous hotels and marinas. Even should the market in the next generation absorb only some of this development, the travel demand generated will require major public transit investment. The highway network that would be used to serve this
TRB State-of-the-Art Report 2
development is hopelessly congested by Trans-Hudson traffic and cannot be easily expanded because of adverse topographic features and extremely high capital costs. Fortunately, numerous abandoned or to-be-abandoned rail freight rights-of-way can be made available to create the nucleus of a transitway system. This system would connect with the PATH rapid transit system and NJ Transit's rail lines in Hoboken, provide north-south access along the waterfront, and provide access from key points to the west, Efforts are now being completed, led by the New Jersey Department of Transportation and NJ Transit with consultant assistance, to determine the transit and highway network improvements that can absorb varying levels of development. A transit network of up to 25 mi is likely to be recommended with segments devoted solely to bu sways, segments devoted solely to light rail, and segments with 5hared busway and light rail rights-of-way. Sizable park-and-ride intercept lots beyond the waterfront, parking fees, and limitations on parking ratios are all likely elements of the proposed plan. Discussions with affected municipalities and developers and concept engineering for the proposed outline will refine this plan during the coming months.
NEWARK AIRPORT
Travel demand at Newark Airport has tripled since 1978, largely as a result of deregulated airlines and resultant low fares, This phenomenon has created overtaxed parking facilities and a need for improved public transit to the airport, Among the many longterm fixed-guideway options proposed (Figure 1) is the extension of the existing Newark subway light rail line. This 3-mi connection might be done either using the right-of-way of the old Central Railroad Company of New Jersey (CNJ) Newark branch or by constructing a wholly new right-of-way. In addition, extension of the PATH rapid transit line to the airport, a new station on the Northeast Corridor with a people mover system connecting the railroad to the airport, and a people mover connection directly to Penn Station-Newark are all to be examined as part of a major joint effort by NJ T~anei t ::.nd the Port Authority of New York and New Jersey, with consultant assistance.
MONMOUTH AND OCEAN COUNTIES
These two central New Jersey counties are growing significantly, The traditional major transit corridors have been on the wedgesw of the counties with the ?~orth Jersey Coast Linc (NJCL) carrying 10,000 rail commuters and the Route 9 bus corridor carrying approximately 8,000 riders to Newark and New York {Figure 2), NJ Transit in coordination with the New Jersey Department of Transportation has embarked on an effort to determine how to better serve the growing markets, especially in the center of these two countiee, making uee, if po1111ible, of tho Southern and Freehold branches, two unused rail freight rights-of-way that branch off the NJCL, Along with light rail feeder systems, commuter rail extensions and busways will be examined for either or both of these rights-of-way. Regular route feeder bus service not using these rights-of-way is also to be examined.
BERGEN COUNTY
Here too, rail freight lines may be used to carry light rail, The purpose would be to capture a larger share of the Bergen County-to-Manhattan market for transit, This i11 traditionally a high automobile use
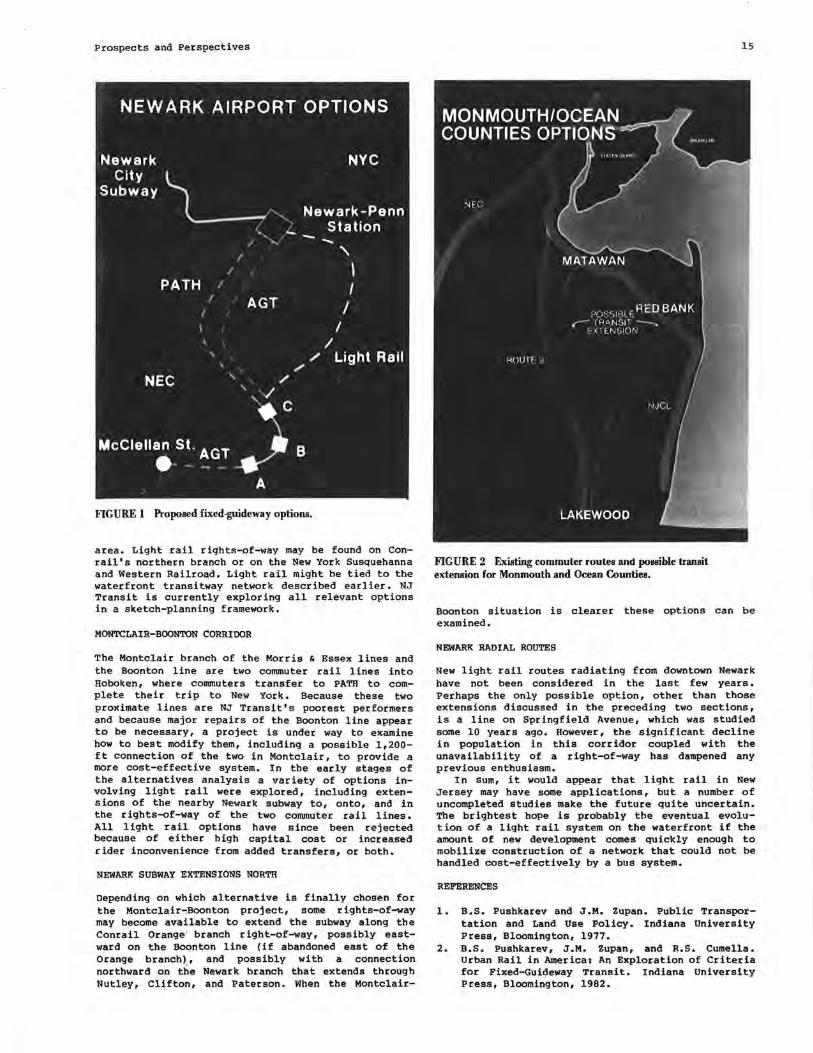
Prospects and Perspectives
NEWARK AIRPORT OPTIONS
Newark
City L Subway r~
/ '-,
NYC
Newark-Penn Station ~:..., "'- .._
/ ·,./ ..... I '\
PATH 1 I
I
AGT
/ I
\ I
I
' '
/ Light Rail .,, /
' / NEC '
' .c McClell._S~. ~GT _..) B
A
F1GURE 1 Proposed fixed-guideway options.
area. Light rail rights-of-way may be found on Conrail's northern branch or on the New York Susquehanna and Western Railroad. Light rail might be tied to the waterfront transitway network described earlier. NJ Transit is currently exploring all relevant options in a sketch-planning framework.
MONTCLAIR-BOONTON CORRIDOR
The Montclair branch of the Morris & Essex lines and the Boonton line are two commuter rail lines into Hoboken, where commuters transfer to PATH to complete their trip to New York. Because these two proximate lines are NJ Transit's poorest performers and because major repairs of the Boonton line appear to be necessary, a project is under way to examine how to best modify them, including a possible 1,200-ft connection of the two in Montclair, to provide a more cost-effective system. In the early stages of the alternatives analysis a variety of options involving light rail were explored, including extensions of the nearby Newark subway to, onto, and in the rights-of-way of the two commuter rail lines. All light rail options have since been rejected because of either high capital cost or increased rider inconvenience from added transfers, or both.
NEWARK SUBWAY EXTENSIONS NORTH
Depending on which alternative is finally chosen for the Montclair~Boonton project, some rights-of-way may become available to extend the subway along the Conrail Orange branch right-of-way, possibly eastward on the Boonton line (if abandoned east of the Orange branch), and possibly with a connection northward on the Newark branch that extends through Nutley, Clifton, and Paterson. When the Montclair-
F1GURE 2 Existing commuter routes and pol!l!:ible transit extension for Monmouth and Ocean C.Ounties.
15
Boonton situation is clearer these options can be examined.
NEWARK RADIAL ROUTES
New light rail routes radiating from downtown Newark have not been considered in the last few years. Perhaps the only possible option, other than those extensions discussed in the preceding two sections, is a line on Springfield Avenue, which was studied some 10 years ago. However, the significant decline in population in this corridor coupled with the unavailability of a right-of-way has dampened any previous enthusiasm.
In sum, it would appear that light rail in New Jersey may have some applications, but a number of uncompleted studies make the future quite uncertain. The brightest hope is probably the eventual evolution of a light rail system on the waterfront if the amount of new development comes quickly enough to mobilize construction of a network that could not be handled cost-effectively by a bus system.
REFERENCES
1. B.S. Pushkarev and J.M. Zupan. Public Transportation and Land Use Policy. Indiana University Press, Bloomington, 1977.
2. B.S. Pushkarev, J.M. Zupan, and R.S. Cumella. Urban Rail in America: An Exploration of Criteria for Fixed-Guideway Transit. Indiana University Press, Bloomington, 1982.
Comparison of Light Rail Transit and Dual-Mode Bus System UweMeyer Ministry for Research and Technology Bonn, Federal Republic of Germany
Before two transport systems, light rail rapid transit and dual-mode bus, are discussed one or two general remarks concerning the current situation of the public passenger transport sector in the Federal Republic of Germany are in order.
The public passenger transport sector has enjoyed a much smaller share of the considerable increase in public mobility that has been evident during the past few decades than has private transportation. Reductions in demand for public passenger transport in the less well-serviced areas have been balanced by substantial increases in passenger numbers, especially in large towns and conurbations that, with the aid of large investment programs, have expanded or modernized their public transport services and now enjoy the benefits of high-capacity transit systems. The high rate of increase in passenger numbers is a reflection of the attractive public passenger services offered. However, despite this, a considerable amount of effort must be put into improving the economic position of the transport companies in the future. Existing transport systems must be improved ann new t~chnolc,gies developed and deployed.
For this reason, within the scope of a transit research program, the Federal Ministry for Research and Technology has been sponsoring the further development of rail rapid transit, light rail systems, and bus transit systems together with the development of automated-guideway transit, dual-mode bus, and command and control systems for public transport operations for more than 12 years.
STARTING POINT
Federal Republic of Germany
In the Federal Republic of Germany there are only follr classical subway (U-Bahn) ,,;ysti>ms in operation, the origins of which go back to the beginning of this century. They are the U-Bahn systems in Berlin, Hamburg, Munich, and Nuernberg.
Most of the rail car companies in the Federal Republic of Germany today operate streetcar or light rail systems. There are altogether about 30 such companies. Of these, approximately 20 operate solely light rail systems or are in the process of changing from streetcar to light rail operation.
Development in the rail car sector in the Federal Republic is, therefore, clearly characterized by a move away from the older streetcar systems (systems that share road space with private transport and do
16
not run on separated tracks) toward the more modern light rail systems (systems that not only share road space with private transport, like the streetcar, but can also be operated on separated tracks both below and above ground with level boarding platforms) • Such systems can be developed into U-Bahn systems step by step (i.e., are compatible with superordinate systems).
In the foreseeable future, only extensions of existing streetcar and light rail systems will be realized in the Federal Republic. New systems are not planned. There are, however, a number of trans port companies, which, because of the pattern of their transport demand, would require a mixture of bus and light rail operation. The problems that arise here are the relatively high costs and the resulting split transit system.
In this case the track-guided bus system offers a real alternative. At certain bottlenecks (e.g., in the city center where public transport operates more efficiently underground) the track-guided bus can be deployed. The existing bus system remains as an integrated ~yst@ffi and need not he 'rr::ane.fnrmo;I ~ nt-1"'\ D
"split" system with additional transfer requirements, as would be the case if an additional rail car system were introduced.
Worldwide
There are currently around 320 cities worldwide with rail car systems in the public passenger transport sector ( 5 percent U-Bahn systems, 11 percent combined U-Bahn and streetcar systems, and 84 percent streetcar and light rail systems).
In addition to the light rail activities in France, Japan, China, Australia, and the USSR, and the slightly more restrained activities in Great Britain and Belgium, the considerable level of activity in the United States and Canada must be mentioned here.
On the North American continent light rail is becoming more and more important: for example, the establishment of L1gn~ ra1L systems in Edmonton, Calgary, and San Diego1 the reconstruction and extension of existing systems, Pittsburgh, for instance: and the construction of systems in Portland, Sacramento, Buffalo, San Jose, and Vancouver. A whole series of further plans is under discussion.
There is one essential difference between the planning and realization of light rail systems in these cities and in the situation cited at the be-
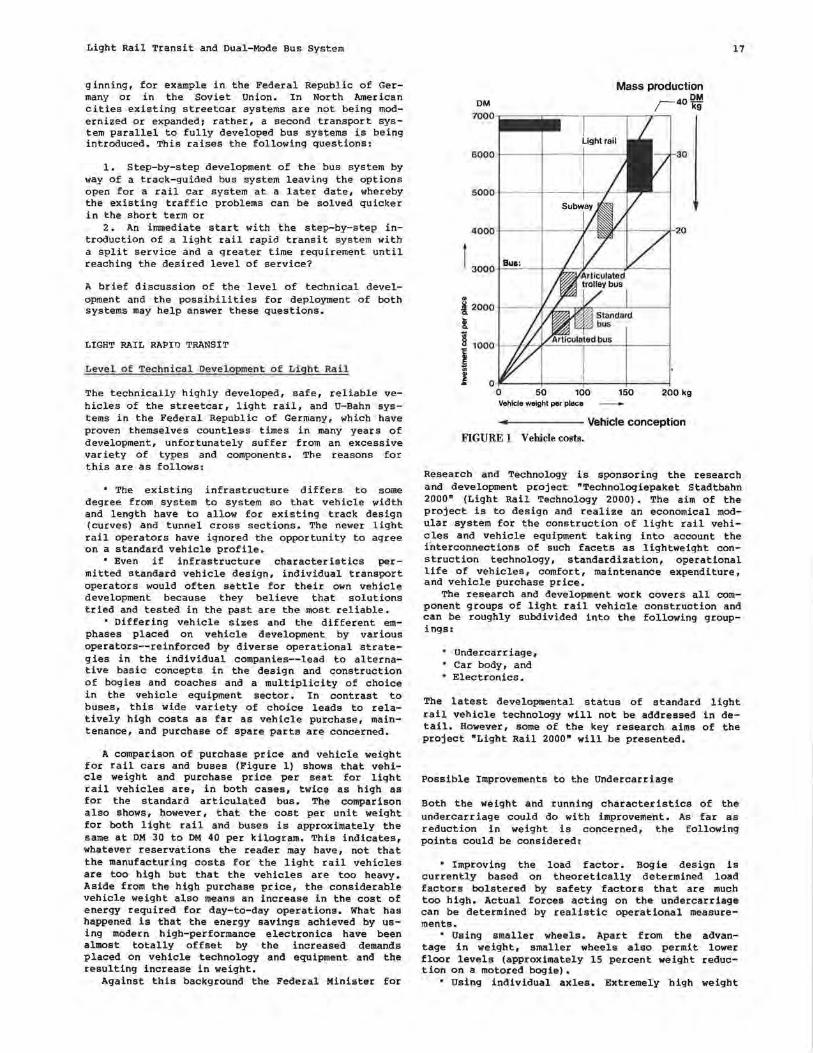
Light Rail Transit and Dual-Mode Bus System
ginning, for example in the Federal Republic of Germany or in the Soviet Union. In North American cities existing streetcar systems are not being modernized or expandedi rather, a second transport system parallel to fully developed bus systems is being introduced. This raises the following questions:
1. Step-by-step development of the bus system by way of a track-guided bus system leaving the options open for a rail car system at a later date, whereby the existing traffic problems can be solved quicker in the short term or
2. An immediate start with the step-by-step introduction of a light rail rapid transit system with a split service and a greater time requirement until reaching the desired level of service?
A brief discussion of the level of technical development and the possibilities for deployment of both systems may help answer these questions.
LIGHT RAIL RAPID TRANSIT
Level of Technical Development of Light Rail
The technically highly developed, safe, reliable vehicles of the streetcar, light rail, and U-Bahn systems in the Federal Republic of Germany, which have proven themselves countless times in many years of development, unfortunately suffer from an excessive variety of types and components. The reasons for this are as follows:
• The existing infrastructure differs to some degree from system to system so that vehicle width and length have to allow for existing track design (curves) and tunnel cross sections. The newer light rail operators have ignored the opportunity to agree on a standard vehicle profile.
• Even if infrastructure characteristics permitted standard vehicle design, individual transport operators would often settle for their own vehicle development because they believe that solutions tried and tested in the past are the most reliable.
• Differing vehicle sizes and the different emphases placed on vehicle development by various operators--reinforced by diverse operational strategies in the individual companies--lead to alternative basic concepts in the design and construction of bogies and coaches and a multiplicity of choice in the vehicle equipment sector. In contrast to buses, this wide variety of choice leads to relatively high costs as far as vehicle purchase, maintenance, and purchase of spare parts are concerned.
A comparison of purchase price and vehicle weight for rail cars and buses (Figure 1) shows that vehicle weight and purchase price per seat for light rail vehicles are, in both cases, twice as high as for the standard articulated bus. The comparison also shows, however, that the cost per unit weight for both light rail and buses is approximately the same at DM 30 to DM 40 per kilogram. This indicates, whatever reservations the reader may have, not that the manufacturing costs for the light rail vehicles are too high but that the vehicles are too heavy. Aside from the high purchase price, the considerable vehicle weight also means an increase in the cost of energy required for day-to-day operations. What has happened is that the energy savings achieved by using modern high-performance electronics have been almost totally offset by the increased demands placed on vehicle technology and equipment and the resulting increase in weight.
Against this background the Federal Minister for
DM 7000
6000 ·
5000
4000
Mass production DM
140kg
t 3000· Bus:
i 2000 ··1- -~"f-i'---::-~,,,--- --1.---g_
§ 1000 l- -/~1----.~..::...::c:..:...:.::i--'---"-C::..:....:'--f------j
) O.JE'.----------1-----1------1
0 50 100 150 200 kg Vehlcle weight per place
------- Vehicle conception
FIGURE 1 Vehicle costs.
17
Research and Technology is sponsoring the research and development project nTechnologiepaket Stadtbahn 2000n (Light Rail Technology 2000) • The aim of the project is to design and realize an economical modular system for the construction of light rail vehicles and vehicle equipment taking into account the interconnections of such facets as lightweight construction technology, standardization, operational life of vehicles, comfort, maintenance expenditure, and vehicle purchase price.
The research and development work covers all component groups of light rail vehicle construction and can be roughly subdivided into the following groupings:
• Undercarriage, • Car body, and • Electronics.
The latest developmental status of standard light rail vehicle technology will not be addressed in detail. However, some of the key research aims of the project nLight Rail 2000n will be presented.
Possible Improvements to the Undercarriage
Both the weight and running characteristics of the undercarriage could do with improvement. As far as reduction in weight is concerned, the following points could be considered:
• Improving the load factor. Bogie design is currently based on theoretically determined load factors bolstered by safety factors that are much too high. Actual forces acting on the undercarriage can be determined by realistic operational measurements.
• Using smaller wheels. Apart from the advantage in weight, smaller wheels also permit lower floor levels (approximately 15 percent weight reduction on a motored bogie).
• Using individual axles. Extremely high weight
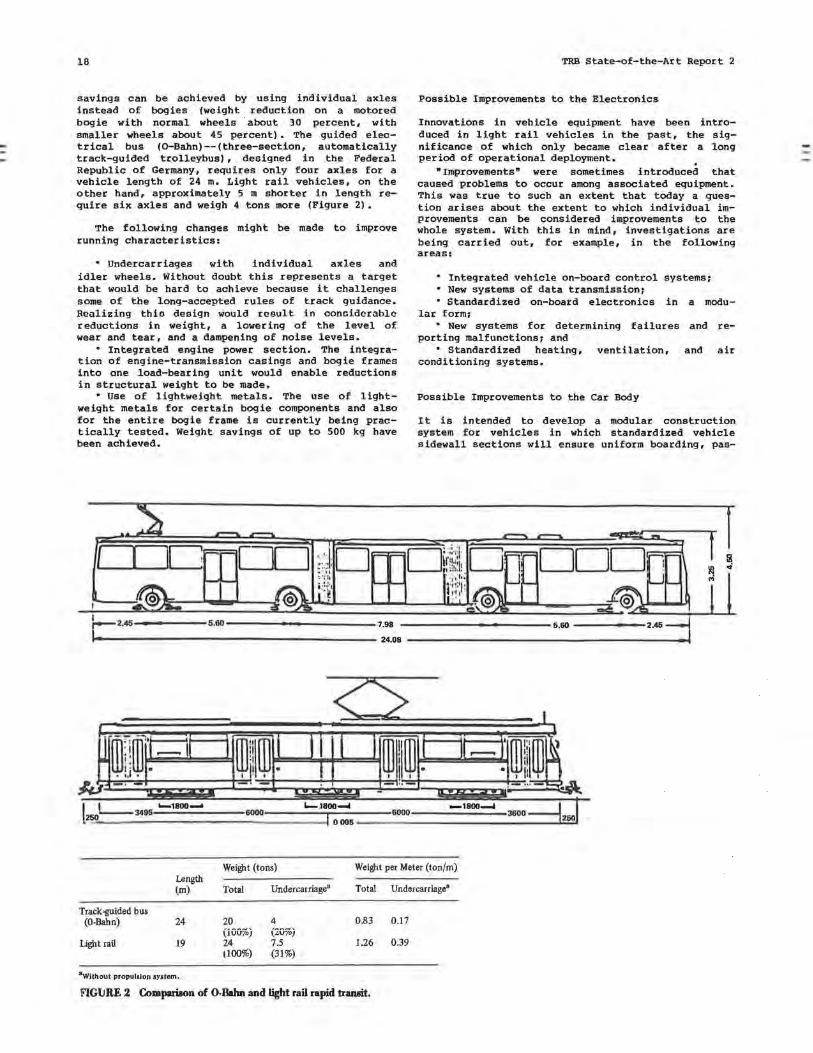
18
savings can be achieved by using individual axles instead of bogies (weight reduction on a motored bogie with normal wheels about 30 percent, with smaller wheels about 45 percent) • The guided electrical bus (O-Bahn)--(three-section, automatically track-guided trolleybus), designed in the Federal Republic of Germany, requires only four axles for a vehicle length of 24 m. Light rail vehicles, on the other hand, approximately 5 m shorter in length require six axles and weigh 4 tons more (Figure 2).
The following changes might be made to improve running characteristics:
• Undercarriages with individual axles and idler wheels. Without doubt this represents a target that would be hard to achieve because it challenges some of the long-accepted rules of track guidance. Realizing thio design would result in ooncidcrablc reductions in weight, a lowering of the level of wear and tear, and a dampening of noise levels.
• Integrated engine power section. The integration of engine-transmission casings and bogie frames into one load-bearing unit would enable reductions in structural weight to be made.
• Use of lightweight metals. The use of lightweight metals for certain bogie components and also for the entire bogie frame is currently being practically tested. Weight savings of up to 500 kg have been achieved.
TRB State-of-the-Art Report 2
Possible Improvements to the Electronics
Innovations in vehicle equipment have been introduced in light rail vehicles in the past, the significance of which only became clear after a long period of operational deployment. .
•improvements• were sometimes introduced that caused problems to occur among associated equipment. This was true to such an extent that today a question arises about the extent to which individual improvements can be considered improvements to the whole system. With this in mind, investigations are being carried out, for example, in the following areas:
• Integrated vehicle on-board control systems: • New systems of data transmission: • Standardized on-board electronics in a modu
lar form: • New systems for determining failures and re
porting malfunctions: and • Standardized heating, ventilation, and air
conditioning systems.
Possible Improvements to the Car Body
It is intended to develop a modular construction system for vehicles in which standardized vehicle sidewall sections will ensure uniform boarding, pas-
f
Weight (tons) Weight per Meter (ton/m) Length (m) Total Undercarriage• Total Undercarriage•
Track-guided bus 0.83 0.17 (0-Bahn) 24 20 4
(ivu%) (20%) Llght rail 19 24 7.5 1.26 0.39
1100%} (31%)
3 WUhout propulsion system.
FIGURE 2 f.omparison of 0-Bahn and light rail rapid transit.
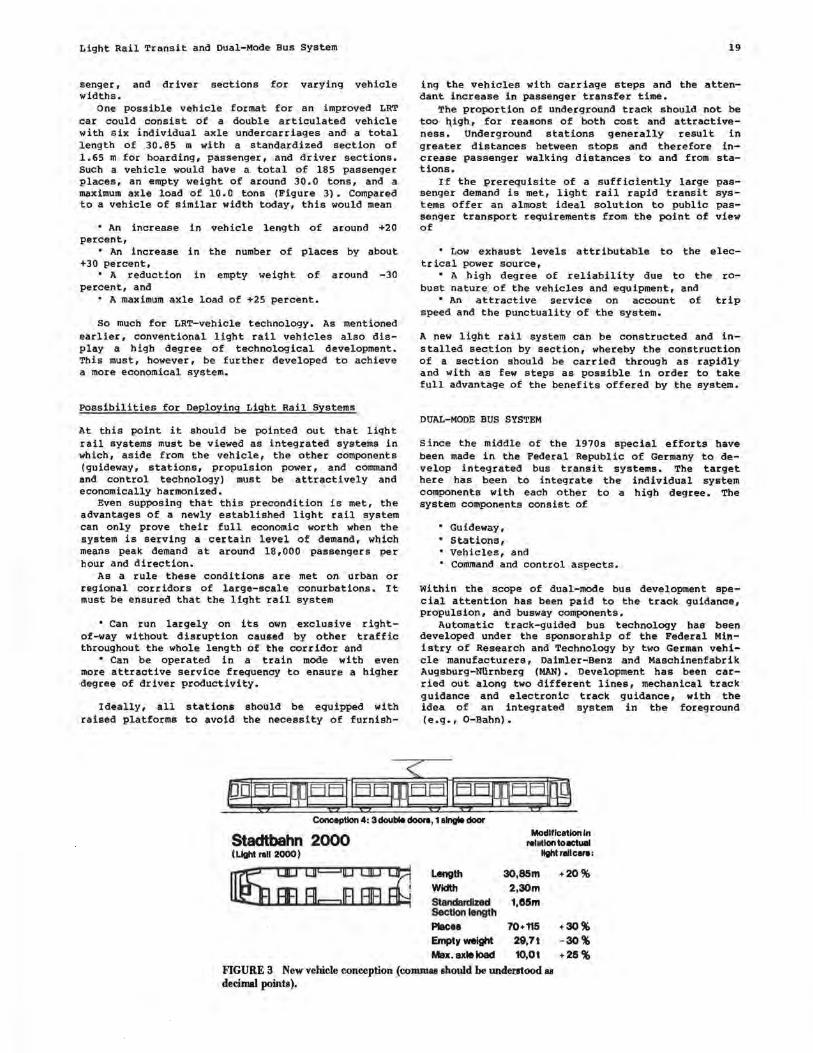
Light Rail Transit and Dual-Mode Bus System
senger, and driver sections for varying vehicle widths.
One possible vehicle format for an improved LRT car could consist of a double articulated vehicle with six individual axle undercarriages and a total length of 30. 85 m with a standardized section of 1.65 m for boarding, passenger, and driver sections. Such a vehicle would have a total of 185 passenger places, an empty weight of around 30.0 tons, and a maximum axle load of 10.0 tons (Figure 3). Compared to a vehicle of similar width today, this would mean
• An increase in vehicle length of around +20 percent,
• An increase in the number of places by about +30 percent,
• A reduction in empty weight of around -30 percent, and
• A maximum axle load of +25 percent.
So much for LRT-vehicle technology. As mentioned earlier, conventional light rail vehicles also display a high degree of technological development. This must, however, be further developed to achieve a more economical system.
Possibilities for Deploying Light Rail Systems
At this point it should be pointed out that light rail systems must be viewed as integrated systems in which, aside from the vehicle, the other components (guideway, stations, propulsion power, and command and control technology) must be attractively and economically harmonized.
Even supposing that this precondition is met, the advantages of a newly established light rail system can only prove their full economic worth when the system is serving a certain level of demand, which means peak demand at around 18,000 passengers per hour and direction.
As a rule these conditions are met on urban or regional corridors of large-scale conurbations. It must be ensured that the light rail system
• Can run largely on its own exclusive rightof-way without disruption caus.ed by other traffic throughout the whole length of the corridor and
• Can be operated in a train mode with even more attractive service frequency to ensure a higher degree of driver productivity.
Ideally, all stations should be equipped with raised platforms to avoid the necessity of furnish-
19
ing the vehicles with carriage steps and the attendant increase in passenger transfer time.
The proportion of underground track should not be too t\igh, for reasons of both cost and attractiveness. Underground stations generally result in greater distances between stops and therefore increase passenger walking distances to and from stations.
If the prerequisite of a sufficiently large passenger demand is met, light rail rapid transit systems offer an almost ideal solution to public passenger transport requirements from the point of view of
• Low exhaust levels attributable to the electrical power source,
• A high degree of reliability due to the robust nature of the vehicles and equipment, and
• An attractive service on account of trip speed and the punctuality of the system.
A new light rail system can be constructed and installed section by section, whereby the construction of a section should be carried through as rapidly and with as few steps as possible in order to take full advantage of the benefits offered by the system.
DUAL-MODE BUS SYSTEM
since the middle of the 1970s special efforts have been made in the Federal Republic of Germany to develop integrated bus transit systems. The target here has been to integrate the individual system components with each other to a high degree. The system components consist of
• Guideway, • Stations, • Vehicles, and • Command and control aspects.
Within the scope of dual-mode bus development special attention has been paid to the track guidance, propulsion, and busway components.
Automatic track-guided bus technology has been developed under the sponsorship of the Federal Mir1-i stry of Research and Technology by two German vehicle manufacturers, Daimler-Benz and Maschinenfabrik Augsburg-Nlirnberg (MAN) • Development has been carried out along two different lines, mechanical track guidance and electronic track guidance, with the idea of an integrated system in the foreground (e.g., 0-Bahn).
Conception 4: 3 double doora, 1 alngle door
Stadtbahn 2000 ( Light 1'1111 2000)
Length
Width Standardized Section length
Places Empty weight
Max. axle load
Modification In rallllon to actual
llghtrallc_,
30,85m 2,30m 1,85m
70+115 29,7t 10,0t
+20%
+30% -30% +25%
FIGURE 3 New vehicle conception (comma& should be understood u decimal points).
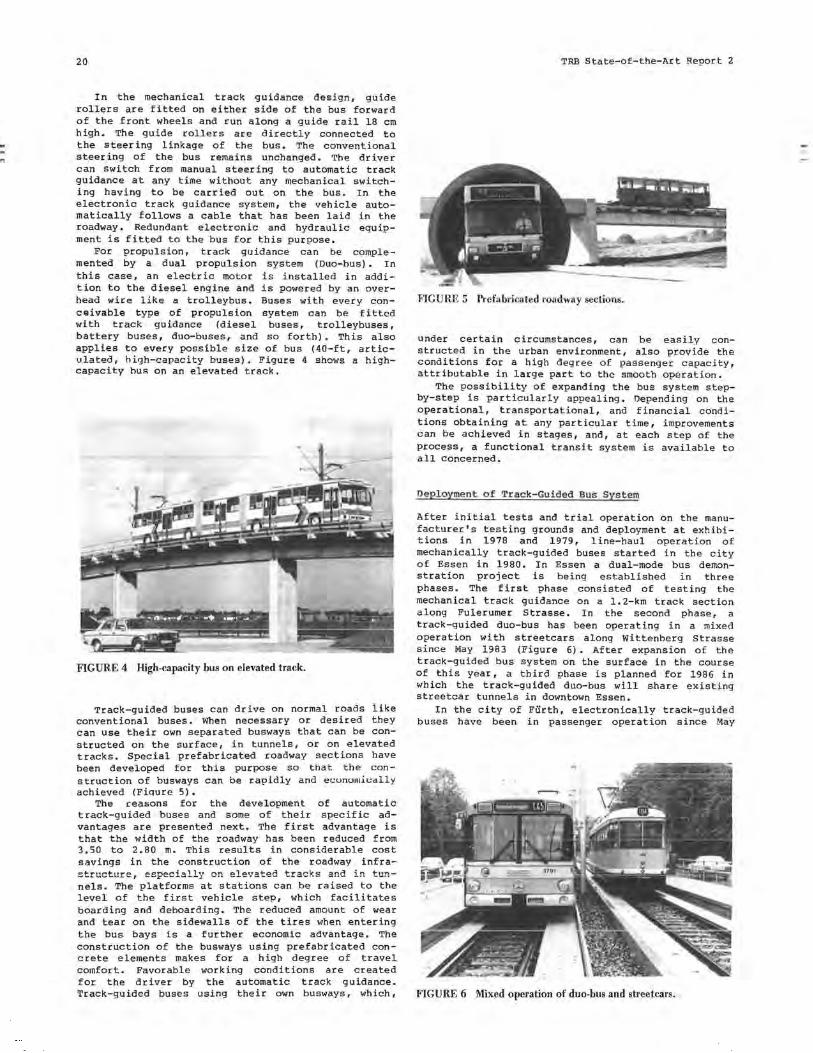
•
20
In the mechanical track guidance design, guide rollers are fitted on either side of the bus forward of the front wheels and run along a guide rail 18 cm high. The guide rollers are directly connected to the steering linkage of the bus. The conventional steering of the bus remains unchanged. The driver can switch from manual steering to automatic track guidance at any time without any mechanical switching having to be carried out on the bus. In the electronic track guidance system, the vehicle automatically follows a cable that has been laid in the roadway. Redundant electronic and hydraulic equipment is fitted to the bus for this purpose.
For propulsion, track guidance can be complemented by a dual propulsion system (Duo-bus). In this case, an electric motor is installed in addition to the diesel engine and is powered by an overhead wire like a trolleybus. Buses with every conC9ivable type of propulsion system oan be fitted with track guidance (diesel buses, trolleybuses, battery buses, duo-buses, and so forth). This also applies to every possible size of bus (40-ft, articulatedi high-capacity buses). Figure 4 shows a highcapacity hus on an elevated track.
FIGURE 4 High-capacity bus on elevated track.
Track-guided buses can drive on normal roads like conventional buses. When necessary or desired they can use their own separated busways that can be constructed on the surface, in tunnels, or on elevated tracks. Special prefabricated roadway sections have been developed for this purpose so that the construction of busways can be rapidly and ec.:unumi<.:'1lly achieved (Fiqure 5).
The reasons for the development of automatic track-guided buses and some of their specific advantages are presented next. The first advantage is that the width of the roadway has been reduced from 3.50 to 2.80 m. This results in considerable cost savings in the construction of the roadway infrastructure, OC'!p.o.,..; ... 11y n.n ol.o.n ... .+-.o.A .......... ,..ire ::::r.nA in .+-nn
nels. The platforms at stations can be raised to the level of the first vehicle step, which facilitates boarding and deboarding. The reduced amount of wear and tear on the sidewalls of the tires when entering the bus bays is a further economic advantage. The construction of the busways using prefabricated concrete elements makes for a high degree of travel comfort. Favorable working conditions are created for the driver by the automatic track guidance. Track-guided buses using their own busways, which,
TRB State-of-the-Art Report 2
F1GURE 5 Prefabricated roadway sections.
under certain circumstances, can structed in the urban environment,
be easily conalso provide the
conditions for a high degree of passenger capacity, attributable in large part to the smooth operation.
The possibility of expanding the bus system stepby-step is particularly appealing. Depending on the operational, transportational, and financial conditions obtaining at any particular time, improvements can be achieved in stages, and, at each step of the process, a functional transit system is available to all concerned.
Deploymen t of Track-Guided Bus System
After initial tests and trial operation on the manufacturer's testing grounds and deployment at exhibitions in 1978 and 1979, line-haul operation of mechanically track-guided buses started in the city of Essen in 1980. In Essen a dual-mode bus demonstration project is being established in three phases. The first phase consisted of testing the mechanical track guidance on a 1. 2-km track section along Fulerumer Strasse. In the second phase, a track-guided duo-bus has been operating in a mixed operation with streetcars along Wittenberg Strasse since May 1983 \.l!'igure b) • After expansion of the track-guided bus system on the surface in the course of this year, a third phase is planned for 1986 in which the track-guided duo-bus will share existing streetcar tunnels in downtown Essen.
In the city of Furth, electronically track-guided buses have been in passenger operation since May
FIGURE 6 Mixed operation of duo-bus and streetcars.
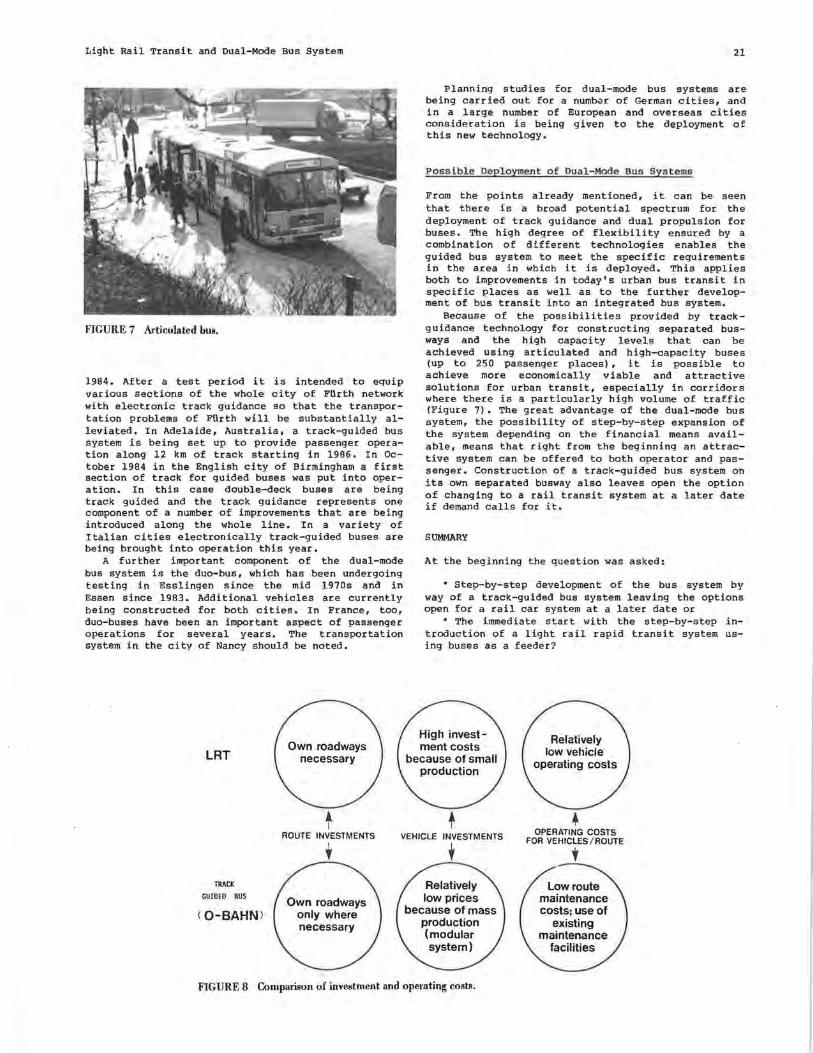
Light Rail Transit and Dual-Mode Bus System
FIGURE 7 Articulated bus.
1984. After a test period it is intended to equip various sections of the whole city of FUrth network with electronic track guidance so that the transportation problems of FUrth will be substantially alleviated. In Adelaide, Australia, a track-guided bus system is being set up to provide passenger operation along 12 km of track starting in 1986. In October 1984 in the English city of Birmingham a first section of track for guided buses was put into operation. In this case double-deck buses are being track guided and the track guidance represents one component of a number of improvements that are being introduced along the whole line. In a variety of Italian cities electronically track-guided buses are being brought into operation this year.
A further important component of the dual-mode bus system is the duo-bus, which has been undergoing testing in Esslingen since the mid 1970s and in Essen since 1983. Additional vehicles are currently being constructed for both cities. In France, too, duo-buses have been an important aspect of passenger operations for several years. The transportation system in the city of Nancy should be noted.
LRT Own roadways
necessary
+
21
Planning studies for dual-mode bus systems are being carried out for a numb~r of German cities, and in a large number of European and overseas cities consideration is being given to the deployment of this new technology.
Possible Deployment o f Dual-Mod e Bus Sy stems
From the points already mentioned, it can be seen that there is a broad potential spectrum for the deployment of track guidance and dual propulsion for buses. The high degree of flexibility ensured by a combination of different technologies enables the guided bus system to meet the specific requirements in the area in which it is deployed. This applies both to improvements in today's urban bus transit in specific places as well as to the further development of bus transit into an integrated bus system.
Because of the possibilities provided by trackguidance technology for constructing separated busways and the high capacity levels that can be achieved using articulated and high-capacity buses (up to 250 passenger places) , it is possible to achieve more economically viable and attractive solutions for urban transit, especially in corridors where there is a particularly high volume of traffic (Figure 7). The great advantage of the dual-mode bus system, the possibility of step-by-step expansion of the system depending on the financial means available, means that right from the beginning an attractive system can be offered to both operator and passenger. Construction of a track-guided bus system on its own separated busway also leaves open the option of changing to a rail transit system at a later date if demand calls for it.
SUMMARY
At the beginning the question was asked:
• Step-by-step development of the bus system b y way of a track-guided bus system leaving the options open for a rail car system at a later date or
• The immediate start with the step-by-step introduction of a light rail rapid transit system using buses as a feeder?
High invest -ment costs
because of small production
Relatively low vehicle
operating costs
• ROUTE INVESTMENTS VEHICLE INVESTMENTS OPERATING COSTS FOR VEHICLES / ROUTE
TRACK
GUIDED BUS
< 0-BAHNl
' Own roadways
only where necessary
' Relatively low prices
because of mass production (modular system)
FIGURE 8 Comparison of investment and operating costs.
' Low route maintenance costs; use of
existing maintenance
facilities
22
The introduction of light rail systems in the Federal Republic of Germany cannot be compared with conditions on the North American continent. Where there are existing streetcar systems, as there are in Germany, the only possibility is a step-by-step change to a light rail system. Where pure bus systems already exist, as is the case in North American cities, both possibilities, LRT or guided bus, can be considered. Which possibility is chosen must be decided on a case-by-case basis.
Of decisive importance is the total traffic volume on the route under consideration. Given the capacity of bus and light rail rapid transit systems, there are three conditions that may be used as guides in decision making:
• Condition A: Total traffic volume at peak up to 9,000 passengers per hour and direction. Clear decision in favor of buses and track-guided buses.
• Condition B: Total traffic volume at peak of between 9,000 and 18,000 passengers per hour and direction. Both systems are possible. This is a transitional zone between guided bus and light rail systems. Guided buses should be preferred because of their cost advantages: (a) low investment costs, (b) short time required for construction, (c) ability to use completed sections of the system at once, (d) ability to integrate a guided bus system into an existing bus operation, and (e) low cost of operation.
• Condition C: Total traffic volume at peak more than 18,000 passengers per hour and direction.
TRB State-of-the-Art Report 2
Decision in favor of light rail rapid transit will be made because larger units can be formed.
If the total traffic volume is going to increase slowly, the existing bus system in Condition B should be developed into a dual-mode bus system leaving open the option for later development to a light rail system.
In the case of a rapid increase in total traffic volume, each case must be carefully examined to determine whether an immediate change of a route to a fully fledged light rail system might not be more economical.
With regard to the investment costs a bus system is more profitable than a light rail rapid transit system (Figure 8): route investments are only necessary on route sections where separate roadways are considered to be requisite and prices for vehicles are relatively low because of mass production in a modular system.
The decisions depend on a whole range of different criteria. It should, however, be pointed out that a high level of transport performance can be achieved with guided buses.
As a result of the extreme flexibility of the dual-mode bus system (freedom of choice for duo-bus, track-guided bus, or dual-mode bus), this system is an excellent, highly advanced transitional system for urban transit today. The possibility of a later change to light rail can always be kept in mind.
Light Rail Development in Los Angeles Rick Richmond Los Angeles County Transportation Commission Los Angeles, California
The generic comparison of transit modes, absent site-specific considerations, is too abstract to be meaningful. The consideration and comparison of rapid transit modes is necessarily and appropriately directed by a myriad of real-world factors always unique to the specific case at hand. They include various geographic and demographic realities, "colors of money,• amount of funding available, and political opportunities and constraints, to name just a few. Although these considerations are frustrating to •purists,• they are nonetheless facts of life and have tremendous weight in any decision about what can and should be implemented. They also tend to blur the cost and benefit distinctions among transit modes.
Experience in Los Angeles provides many examples. There are a number of transit funding sources available, each with limitations on types of eligible projects, amounts available, and procedural requirements. This applies to local, state, and federal funding and requires a mixing and matching of transit modes to available funding sources if the objective is to accomplish as many overall improvements as possible. In some cases transit planning is influenced by the existence of available rights-of-way, be they railroad, freeway, or other relatively available routes. There are always political factors that provide strong impetus--positive or negative. Some proposals are strong technically but weak, or even opposed, politically, and vice versa. Some transit planning is driven by public mandate as is the case in Los Angeles with the development of a countywide locally funded rail transit system.
This paper is not a generic comparison of modes, presented instead is a review of experience in Los Angeles with three specific proposed rail corridors that range in status from the conceptual to the •ready to build.• It is believed that they are illustrative of the trade-offs and realities inherent in rapid tnansit planning.
LOS ANGELES COUNTY RAIL SYSTEM PLAN
In 1980 Los Angeles County voters approved a local 1/2 percent sales tax for various transit purposes, including the construction of a countywide rail transit system (Figure 1). The 13 corridors in the 150-mi ultimate system are in varying states of definition and refinement. A system plan has been developed. It was driven by differing intensities of transit need, limited resources, and a desire for expeditious system development. It envisions a mixed light and heavy rail system that also includes the
use of current and proposed busways. At this point it has been established that about 100 mi of the ultimate 150-mi system could be built as light rail. Experience with three of the light rail corridors, specifically the San Fernando Valley, Century Freeway, and Los Angeles-Long Beach corridors, is described.
SAN FERNANDO VALLEY CORRIDOR
The San Fernando Valley corridor, which runs 16 miles east-west across the valley, is still conceptual at this point. The planning on it to date has looked at the trade-offs of light rail and heavy rail using various alignments. It was found, as part of an overall system evaluation, that light rail (i.e., a less than fully grade-separated service) would pick up about two-thirds the ridership at onethird the cost compared to heavy rail. Specifically, the best-performing light rail alternative was projected to attract 53,000 daily trips at an approximate cost of $175 million (current dollars), whereas the best heavy rail alternative showed ridership of 87,000 a day at a cost of approximately $560 million.
The opportunity for light rail in the valley is largely due to the existence of an available railroad right-of-way, the use of which for transit appears at this point to be acceptable to the community. It is assumed that there will be need for some grade separation of the light rail line at major arterials, and still more may be necessary, but the light rail concept is, nevertheless, viewed as having great advantages in terms of cost-effect iveness. This particular evaluation comes about as close to anything to a •generic comparison.• This is no doubt the result of the analysis being only conceptual at this point.
CENTURY FREEWAY CORRIDORS
Preliminary engineering has begun on a light rail route in the median of the 17-mi Century Freeway that is now in construction using Federal-Aid Interstate funds. Here the evaluation centered around the best use of a fully grade-separated transit rightof-way that would be made available as part of the freeway construction. Should it be built for bus use or rail? Interestingly, either alternative also included the provision of preferential lanes for carpools, at least during peak periods. The tradeoff was building rail now, versus bus now, versus bus now and rail later through conversion. In this
23
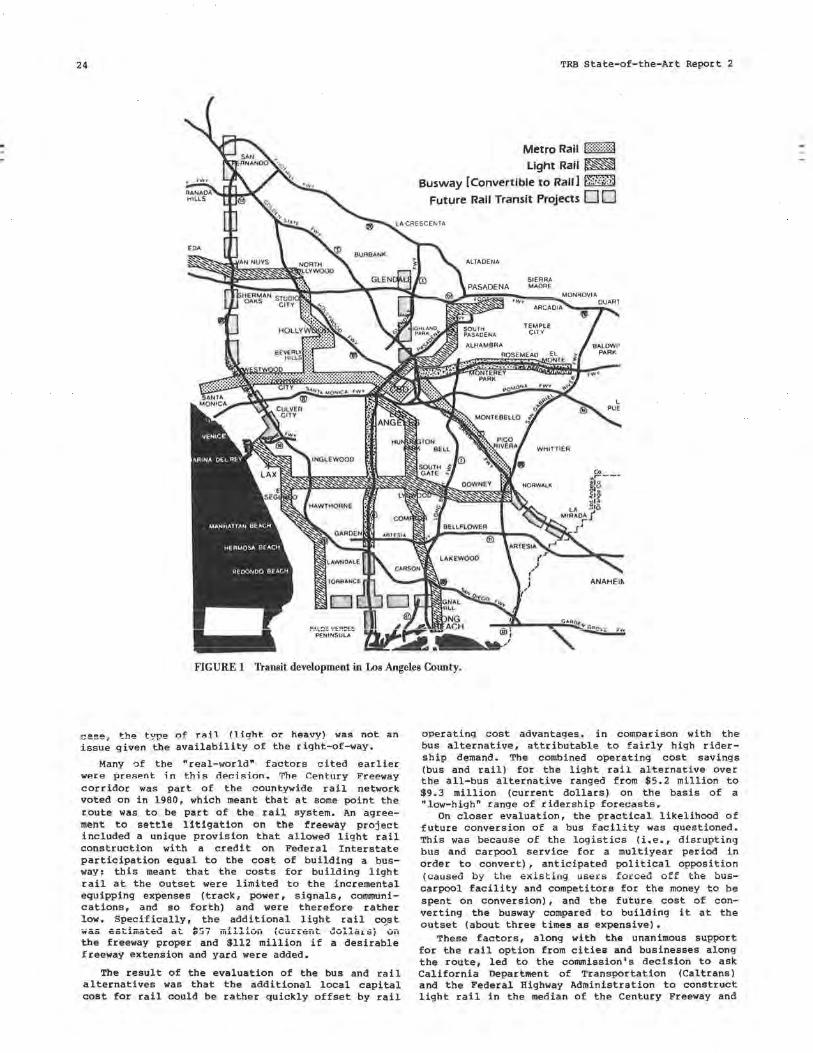
24
PENINSULA
TRB State-of-the-Art Report 2
Metro Rail J:::::;:::::::;:;J
Light Rail~
Busway [Convertlble to Rr1H] fW;:r;m Future Rail Transit Projects DD
SIERRA MADRE
FIGURE 1 Transit development in Los Angeles County.
~,><,o_ t-ho hm" nf r"il (light. or heavy) was not an issu~ given th~ ~;ailability of the right-of-way.
Many -:,f the "real-world" factors cited earlier were present. in this decision. 'i'he Century Freeway corridor was part of the countywide rail network voted on in 1980, which meant that at some point the route was to be part of the rail system. An agreement to settle litigation on the treeway project included a unique provision that allowed light rail construction with a credit on Federal Interstate participation equal to the cost of building a busway; this meant that the costs for building light rail at the outset were limited to the incremental equipping expenses (track, power, signals, communications, and so forth) and were therefore rather low. Specifically, the additional light rail c~st was -cstiiiiatoed at $57 rnillic,1, \curLc:1,t d.vlla1.~j ur, the freeway proper and $112 million if a desirable freeway extension and yard were added.
The result of the evaluation of the bus and rail alternatives was that the additional local capital cost for rail could be rather quickly offset by rail
operating cost advantages. in comparison with the bus alte~native, attrib~table to fairly high ridership demand. The combined operating cost savings (bus and rail) for the light rail alternative over the all-bus alternative ranged from $5. 2 million to $9.3 million (current dollars) on the basis of a "low-high" range of ridership forecasts.
On closer evaluation, the practical likelihood of future conversion of a bus facility was questioned. This was because of the logistics (i.e., disrupting bus and carpool service for a multiyear period in order to convert), anticipated political opposition (caused by the existifig users forcea off the buscarpool facility and competitors for the money to be spent on conversion), and the future cost of converting the busway compared to building it at the outset (about three times as expensive).
These factors, along with the unanimous support for the rail option from cities and businesses along the route, led to the commission's decision to ask California Depart111ent of Transportation (Caltrans) and the Federal Highway Administration to construct light rail in the median of the Century Freeway and
Light Rail Development in Los Angeles
to conunit themselves to the incremental costs associated with it.
LOS ANGELES-LONG BEACH CORRIDOR
The Los Angeles-Long Beach light rail project is the most advanced light rail project in the county and therefore has taught the people involved the most about the strengths and frailties of light rail.
The line runs 23 mi from downtown Los Angeles to downtown Long Beach largely along an existing railroad right-of-way that was the last line of the old Pacific Electric interurban system abandoned in 1961. As with other candidate light rail projects, its genesis comes from the availability of right-ofway, the opportunity for relatively quick and relatively low-cost construction, and the availability of local funds for its construction.
In general, experience with this project has been that sometimes things just cannot be as simple as people would like them to be. The preliminary assessment of the project in 1982 identified a "bare bones," single-track line with no grade separations that was projected to carry about 21,000 daily riders at a capital cost of $194 million (1982 dollars). In going through the refinem~nt of the project, which was recently completed, it was found that some design features of the project simply had to be changed for the line to be functional. The "hand"-calculated ridership forecasts from 1982 grew to more than 50,000 when produced by the adopted travel forecasti.ng model. The resulting service frequency require-
ents rendered a single-track operation too unrelidble and the proposed crossing of three active freight lines serving the ports of Los Angeles and Long Beach infeasible. Constructing and operating a light rail line alongside an active freight line proved more complicated, and therefore expensive,
25
than anticipated. Further, the development of the ultimate countywide system, mentioned earlier, places more demand on this route as a trunk line for the system. In short, the realities of the project have required that it be substantially upgraded. This has brought about an increase in its cost but, on the positive side, an increase in the quality of service it will provide and in the contribution it can make to the overall transportation system.
SUMMARY
In generical, light rail transit has unquestionable attributes. Unfortunately, the opportunities to achieve all of them are rare. There is a basic dilemma, it seems, that is faced in trying to develop a light rail project. Such a project enjoys a wonderful image of simplicity, affordability, unobtrusiveness, and nostalgia. At the same time, it is expected to provide all the quality of service benefits of its counterpart the expensive, disruptive, and inflexible heavy rail line. Finding a balanced way out of this dilemma is the challenge that faces anyone trying to apply this mode.
No matter what is proposed to provide public transit improvements, the grass will always look greener for another alternative. Heavy rail lines are criticized for being too expensive--"do it with light rail or buses." Light rail lines are dismissed as "Toonerville Trolleys• until such time as they are made heavy rail look-alikes. All rail projects are boondoggles--•you should do it with buses"--as if there were something fundamentally different about providing exclusive bus right-of-way as opposed to rail.
Through all of this, keeping cost-effectiveness as the major factor in decision making is very difficult indeed.
Cost-Effective Application of LRT Systems Technology J. W. Schumann LTK Engineering Service Sacramento, California
K. Addison Electrak, Inc. Hyattsville, Maryland
T. B. Furmaniak Massachusetts Bay Transportation Authority Boston, Massachusetts
T. Matoff Tri-Met Portland, Oregon
C. W. Otte Foster Engineering, Inc. San Francisco. California
W. P. Quintin. Jr. Electrical Engineer San Francisco, California
The purpose of any transit mode is to provide sufficient speed, comfort, and capacity to attract and serve its ridership. These factors form an equation that must be in equilibrium with the total cost of the mode. For light rail transit (LRT), total costeffectiveness is bounded by bus service at the lower end and rapid ("heavy") rail service at the upper end of LRT's range of applicability. Subsystem technology must be applied to fit the requirement of total system cost-effectiveness, or the rational equilibrium can be lost.
Applications of technology, for each major subsystem, that may be considered to satisfy the objective equilibrium are discussed and illustrated.
careful consideration of these factors is necessary because much of LRT's attraction lies in its potential economy compared to rapid rail and automated guideway systems. To take full advantage of Lft'l''s cost saving opportunities, system developers today should specify so-called "service-proven, off-the-shelf" hardware to
• Ene!.!re .:.u::.; 1 :.in; 1 ; +-y end pr ice ,..nmnAt-; +-inn
during bidding, • Avoid engineering and development costs as
sociated with experimental designs, and • Minimize the break-in delays, retrofits, and
coses ofcen encountered with unproven new equipment.
These are important considerations for rail transit proponents, those in the agencies building and operating LRT as well as those in the supply and
26
construction industries fabricating equipment and fixed facilities. Most second-tier cities in the 0.5 to 1.5 million population range simply cannot afford the higher cost technologies, and most do not really need them. If the limited funds available for rail construction are to be used most effectively, indeed, if a viable market for suppliers is to remain, it is crucial that system designers avoid the unnecessary solutions of some recent projects the costs of which appear likely to upset the economic equation justifying LRT.
The key question for LRT system planners and designers in any given set of circumstances is, "How much is enough to accommodate initial system demand and to allow for ready future expansion?" LRT operations in different urban settings differ from one another as well as from rapid rail or automated 9uideway11 in 1111v11ral r1111pact11: 1111rvic11 freqt1ency, speed, use of single-track running, and right-of-way type. What are the impacts of location, level of service, and budget on system requirements and designs? How can LRT systems avoid gold-plating and give effective service with low operating and maintenance costs, yet remain buildable within today's tight capital budgets?
Fortunately, LRT subsystem design applications tnat can serve as stanaaras to acnieve these goals have been evolving. At the same time, technology improvements that can improve performance per unit of total cost continue to be made. When proven, these may be considered. Some sample applications
Cost-Effective Application
and their advantages are discussed hereafter, as are other possible applications and progress.
LRT RIGHTS-OF-WAY
Buses (and streetcars) running in mixed traffic on local streets are hard pressed to attain average speeds of more than 16 km/hr (10 mph) whereas rapid rail trains operating on fully grade-separated rights-of-way (ROW) typically average 32 km/hr (20 mph) or better. LRT system speeds generally should be between 16 and 40 km/hr (10 and 25 mph).
LRT ROWs largely determine system performance: greater separation of the ROW from conflicts with other traffic leads to higher schedule speed and reliability for any given combination of alignment, station spacing, and vehicle performance. In general, improved performance diverts patronage to transit. This balance is quite explicit and confronts the designer with an important choice in making the trade-off between speed and cost for a given carrying capacity, which must match that portion of projected demand for the transit service that can be expected to be diverted from automobiles because of the greater speed of transit.
The distinguishing feature of LRT is its capability to operate on all three of the basic ROW types: exclusive, semiexclusive, and mixed traffic. Some systems, such as San Francisco's Muni Metro, employ a full variety of ROW types that take advantage of and respond to the geographic and community characteristics of each line segment.
TRACK AND ROADBED
Whereas type of ROW has a primary influence on system speed, installation and maintenance of the trackway is a major factor in total system cost. The use of rail does not automatically invoke main-line railroad standards. LRT track is, in fact, a guideway to accommodate considerably different axle loads and speeds. By tailoring design to real LRT needs instead of irrelevant freight railroad standards designers can conserve on the costs of building and maintaining LRT trackage.
A wide selection of track materials is available for LRT, including rail, ties, special trackwork, and other track materials (tie plates and pads, joint bars, spikes and clips, rail anchors, and so forth). A substantial amount of development over the years now presents the system designer with several decisions having to do with types of materials, their design, and their application in different ROWs.
Track Structure and ROW Type
On exclusive ROW, an "open" track structure generally is used, with the assembled components (rails, ties, fastenings) exposed and held in place by a bed of ballast, usually crushed stone. In shared ROW, the track structure is embedded in the street paving material. Examples of both track structure types may be found on semiexclusive ROWs1 the choice is dependent on local factors such as ROW width, drainage needs, and whether the LRT ROW must be capable of being used by others (e.g., emergency vehicles). If only the needs of LRT are considered, an •open" track structure is preferable wherever feasible because exclusive LRT ROW use is thus ensured.
11 Significant Decision : car ,Whee l Pro fi l e
LRT and streetcar systems operating or under construction in North America generally use either of
27
two long-established car wheel cross-sectional profiles: street railway or railroad. The profiles specify tread width, tread taper, and flange depth. Street railway wheels have narrower treads, no tread taper, and shallower flanges compared to railroad wheels.
Street railway wheels allow the designer to use a broader range of special trackwork designs, particularly turnouts (track switches) of the "flange bearing" type through which cars are carried on their flange edges instead of their wheel treads. Such designs provide more positive guidance around sharp curves, some as tight as 12-m (40-ft) in radius, found on older street railways.
Because modern light rail vehicle (LRV) designs typically require curve radii of 25 m (82.5 ft) or more, the wheel guidance issue is less critical. This has allowed new systems to use the standard railroad wheel flange profile. The advantages of doing so are operational and economic. Flange bearing frogs and shallow flange points necessarily restrict speed to avoid derailments. Further, street railway-type special work must be fabricated to special order for each installation. However, this hardware, with its grooved flangeways, sometimes is preferred for trackage in streets because it results in fewer holes and slots than does standard railroad special work.
Use of railroad-type track lets designers tap a broader market from which standard materials may be purchased "off-the-shelf" from several suppliers. This enhances competitive bidding prospects. Railroad standard special work also allows higher operating speeds to be achieved than can be achieved with comparable street railway hardware.
Good Drainage is Key
As with any type of engineered civil structure, good drainage is the key to successful design. Grading must be such that water always flows away from the track structure. Underdrains and side drains must be employed wherever required because adequate drainage is by far the most important consideration in achieving a cost-effective track structure. when sufficient drainage channels are not provided, or are not kept clear, silt and other debris foul the roadbed. This causes the roadbed to fail to support the track structure, which then loses its line and surface smoothness, contributing to increased maintenance costs and poor ride quality, which in turn drives down patronage and fares.
Subgrades and Ballas t
Subgrades must be properly prepared. Then the designer must decide if subballast is to be used and, of so, the depth of section. Soil type and condition, amount of rainfall, freezing and thawing cycles, and design loads are some of the factors that must be considered.
In Sacramento, relative subgrade compaction of 95 percent for a depth of 6 in. and a width sufficient to accommodate the ballast was specified. Because the area has no ground frost, low average annual rainfall [46 cm (18 in.) per year concentrated in four winter months] , and relatively light vehicle axle loads (about 9 metric tons or 10 short tons), no subballast was deemed necessary.
As an added measure of protection foi the track structure, Sacramento did specify use of filter fabric. A 227-g (8-oz) blanket 4.3 m (14 ft) wide is being placed under the entire 29.40-km (18.3-mi) main line as well as under all yard and passing tracks.
28
Double and triple thicknesses were specified where extra protection was deemed necessary. This relatively inexpensive material helps distribute vehicle loads over a greater cross-sectional area of the subgrade, provides added drainage, and prohibits small solid particles ("fines") from contaminating the ballast.
Ballast functions to support and anchor the track structure and to drain moisture from it. Crushed stone is the most common ballast material. Ballast must be hard and angular to enhance its anchoring function, and it must be of proper size. Ballast that is too large will not properly anchor the track; overly fine ballast will become too easily clogged with silt, resulting in poor drainage, damage to the track structure, and resulting extra maintenance costs.
Ballast grades specified for Sacramento are typical: No. 4 for open track (3.8 to 1.9 cm or 1.50 to O. 75 in. in diameter), and No. 5 for trackage in paved streets (2.5 to 1.0 cm or 1.00 to 0.40 in. in diameter). Because of their tendency to deteriorate more rapidly into fines that inhibit drainage, crushed slag and limestone were not permitted.
Crossties
Selection of the crossties that support the rails presents the LRT system designer with another set of choices. Since the dawn of railways, wood has been the most common material for ties, but wood's position has been challenged by concrete ties during the last two decades.
On the West Coast, Douglas fir ties cost about one-third as much initially as concrete. The region's generally mild climate makes possible tie lives of 30 to 40 years. Some wood ties on California railroads are in good condition after more than 50 years of service. Where moisture levels are higher, concrete is better able to compete.
Tie size also must be decided. Typical ties are 2. 4 to 2. 7 m ( 8 to 9 ft) long and have cross sections of 15 x 20 or 18 x 23 cm (6 x 8 or 7 x 9 in.). It was determined that for the light LRT axle loads in Sacramento a tie 2.4 m (8 ft) long and 15 x 20 cm (8 x 9 in.) in cross section would be adequate. It is noted that this size Douglas fir tie competes directly with the stud (5 x 10 cm or 2 x 4 in.) used in house construction. Availability and price therefore are tied to the strength of the housing industry.
Additional design decisions related to wood ties are the type of treatment to be applied to control insect attack and whether the ties should be predrilled for spiking.
Rails are the most expe1,_ e component of the track system. For LRT, rails as light as 33 to 37 kg per linear meter (80 to 90 lb per linear yard) are structurally adequate. Consideration must be given to other factors, however. Because most LRT systems use overhead wires to distributa tr~ction power, th~ running rails must act as the negative ground return portion of the circuit. As a result, stray currents become of major concern to all utilities that may have metal pipes near the system. To reduce these concerns as much as possible, a rail section should be used that provides the least electrical resistance within the limits of economic realities; and the number of rail joints should be minimized.
Further considerations are rail availability and compatibility with special trackwork. The 115-lb
TRB State-of-the-Art Report 2
"RE" section possesses these desirable features. At present, fewer than five mills produce rails in the United States. Many other countries produce goodquality rail; but federal "Buy America" regulations make it difficult for foreign suppliers to bid successfully on federally funded projects.
All curves of 90-m (300-ft) radius or less should be protected with a guardrail on the inside rail, against which the backside of an LRV's inside wheels can rub when traversing the curve. This protects the outside running rail and wheels from excessive wear. For in-street running, designers must choose between regular "tee" rail and girder rail, which provides a metal flangeway as part of the rail: in effect, an integral guardrail. Although it provides a cleaner design for in-street track, no girder rail is produced regularly in the United States. One U.S. mill will roll girder rail on special order. LRT system developers must evaluat:P. whether the associated delays and extra costs are compatible with their project schedules and budgets or whether their designs can be accommodated to "tee" rail. An offsetting cost factor favoring girder rail is that it reduces the crumbling of adjacent pavement.
Rail metallurgy is another design issue. A Brinnell hardness of 269 is adequate for most LRT systems. Because most LRT properties now use continuous welded rail (CWR), it is desirable to have rail rolled and delivered in lengths as long as possible.
A particularly troublesome design issue for LRT systems is the use of existing highway bridges. Many older structures will be incapable of supporting the added live load of LRVs plus track and ballast. If CWR is used, a problem is created in that most highway bridges have joints 60 to 90 m (200 to 300 ft) apart. These joints are designed for substantial movement. Considerable forces result from changes in structure length, whereas the rail length does not change because it is continuous and heavily anchored. A fastener that can withstand these forces must be employed or expensive rail joints must be used. The designer will be required to conduct a thorough study to determine the most economical method to employ in any particular situation.
For the truly economy minded, installation of used rail may be considered. Thete is an abundanc~ of good, used 115 RE rail around the United States. Tie Plates are another item that can be purchased used for about one-fourth the price of new. In Sacramento new rail is being installed on used pl ates .
Special Trackwork
Special trackwork is the single most difficult track item to procure. In Sacramento, following modern design ideas, it was decided to minimize joints. This design criterion applied to turnouts as well as ordinary track. Specifications were written that require that switch points and frogs be designed to ar.r.ommodate welding, Because each supplier uses its own welding design, it was necessary to analyze each one during the bidding process to determine product comparability. For new systems, at least 6 months' lead time should be allowed between notice to proceed and first delivery. More timi; will be needed for in-pavement and other unique design turnouts. To the extent possible, the types of turnouts used should be standardized to obtain shorter delivery times and more competitive bids.
Summary--Track and Roadbed
The desirability of track and roadbed designs that can be built and maintained economically has been
Cost-Effective Application
stressed. Good drainage is crucial. Track materials that are readily available can reduce initial costs through more competitive bidding and ongoing upkeep because replacement components will be easier to locate and cheaper to purchase. There are some ROW conditions, particularly in streets and malls, under which unique, special-design trackwork may be unavoidable. However, its use should be limited to achieve overall economy in track and roadbed.
TRACTION POWER
High voltage, obtained at commercial frequency from an electric utility, is transformed and rectified to low voltage at trackside substations. This current is distributed to train pantographs through overhead wires. This interface must be designed to provide continuous sliding contact at any speed and under any climatic conditions.
Voltage
New LRT systems in North America are standardizing on either 600 or 750 volts, direct current (DC). Higher voltages allow the power transmission distance to be increased, thus enabling the use of fewer substations with smaller conductors. However, greater distances between power supply points increase the probability of more trains in any section, thus requiring substations with a higher power rating. Under such conditions, the benefit of reduced conductor size and increased spacing of substations may not be fully realized.
Substations
The alternating current commercial distribution voltage (e.g., 12 kV) from a public power utility is transformed to lower voltage and rectified to direct current in substations placed at intervals along the LRT line.
Some designers of new LRT systems prefer to use an increased number of smaller, more closely spaced substations to improve reliability through redundancy and to lower the costs of substation construction. The cost issue involves a trade-off between substations and the size of the overhead distribution conductors for the proposed LRT service. This tradeoff usually is analyzed by specially developed computer programs that consider:
• Physical and performance data of the proposed LRVs1
• Track data including speed limits, geographical characteristics, and station stops,
• Train frequency, dwell times, and method of operation,
• Availability and reliability of public utility power supply circuits, and
• Availability of sites for substations.
As examples of the range of possibilities, the new LRT systems in San Diego and Sacramento use 600- and 750-volt (respectively), 1000-kW substations spaced at intervals of between 1 and 2 miles. This is sufficient to support trains of four medium-performance cars running on headways no shorter than 10 min. The reconstructed Shaker Heights LRT lines in Cleveland use two 3000-kW and two 1500-kW substations--just four in all--to supply 10.6 mi of route serving more frequent, though shorter, trains of high-performance cars.
In all cases a properly designed system allows
29
one or more substations to be out of service yet still permits operation of adequate service during the time required to perform repairs or maintenance. To achieve this capability, it is important to obtain primary power for adjacent substations from separate public utility circuits.
Substations of the size mentioned can be obtained either as modules preassembled in a factory and shipped to sites (such modules require minimal installation) or conventionally built with the heavy equipment installed and connected on site.
Two basic types of overhead wire power distribution systems typically are used for LRT systems: trolley wire and catenary. The former provides a single contact wire over each running track and is used in aesthetically sensitive areas such as downtown locations. It is generally supported electrically by parallel feeders that on modern systems generally are laid underground in conduits and connected to the contact wire approximately every 120 to 150 m (400 to 500 ft).
catenary systems employ a configuration of one or more messenger wires from which a horizontal contact wire is suspended by means of flexible droppers.
The choice of system often is influenced more by politic al or aesthetic considerations than by technical design parameters. However, the designer must consider the increased cost of underground ductwork and more closely spaced supporting poles for trolley wire versus demands for unobtrusive aerial wires.
Overhead Contact wire Hardware
In the free world fewer than 10 firms manufacture the hardware specially designed to support, insulate, and register the wires above the track. These manufacturers have developed and improved their own range of hardware since the early 1900s. It is therefore sensible for the designer to prepare drawings and specifications in a way that permits these manufacturers to respond with time-proven hardware. The designer who wishes to start from first principles, or with only reference to a catalogue, is courting disaster and extra expense. An experienced designer who has intimate knowledge of the hardware ranges can make all the difference between an almost maintenance-free and a troublesome system.
supporting Systems
The trolley wire or catenary is supported by steel, spun concrete, or wood poles with cross span wires, portals, headspans, or cantilever arms supporting the power distribution wires.
The choice of pole type often is influenced by aesthetic requirements along the route. Steel poles, either tubular or "H" section, are slim and less obtrusive but require concrete foundations to distribute the imposed forces to the ground. Concrete or wooden poles can be directly "planted" and the ground backfilled. These are more tolerant of abuse by maintenance personnel because there is no dramatic change of stress at the top of the foundation.
Cross span wires typically are used with trolley wire construction in downtown areas where overhead "clutter• is to be kept to a minimum.
Cantilever arms are used when poles can be located adjacent to the track. On double-track lines, transit authorities often favor poles located between tracks (the so-called "boulevard" arrangement) with cantilever arms mounted back-to-back on a single pole. This choice of arrangements should be thoroughly investigated because there are a number of advantages and disadvantages to be considered in comparison
30
with poles located on the outside of the tracks of a double-track line:
• Fewer poles 1 • Larger diameter poles to absorb greater
zontal wind and radial loads on the wiresi • Shutdown of both tracks if derailed
destroys pole or polesi and
hori-
train
• Greater distance between tracks to acco11DTI0-date center poles, which may increase costs for ROW by more than the amount saved on poles.
A headspan is similar in design to a cross span, except that a supporting cross track messenger is used. Headspan construction is employed in multitrack situations or where obstructions require poles to be situated some distance from the tracks. Alternatives to headspans are portals or bents, often used on main-line railroan eler.trifir.at.ionA. '!'he nAe of rigid structures to support the equipment does simplify the wiring, provide a degree of mechanical independence, and from an aesthetic viewpoint generally allow the use of shorter poles than headspans. However, the structures must be painted from time to time, which requires a power shutdown. When headspans or portals are used in like situations the overall cost of the two is similar.
Fixed or Constant-Tensioned Conductors
The size of poles and hardware is directly proportional to the tension of the wires. The tensions, in turn, are determined by the dynamic interface of the LRV pantograph and the catenary configuration to provide optimum current collection under all climatic conditions.
The tension of fixed equipment, which has the wires connected directly to the terminating poles, varies with ambient air temperature and heating due to conductor currents. In winter the tension can be twice that required for ideal current collection by the pantograph. In summer, particularly with a heavily used system, the wires can sag to such an extent that they may come into contact with the vehicles. To allow for these extreme conditions, designers of fixed tension systems must provide larger poles, foundations, and hardware to withstand the high tensions caused by extremely low temperatures. This, of course, increases costs.
To avoid these higher costs, many modern systems are using constant-tensioned equipment, generally referred to as "balance weight" equipment. The individual lengths of contact wires and messengers in this Cle sign are limited to approximately l. 6 to 2. O km (1.00 to 1.25 mi), and the wires are anchored at midpoint to stop movement along the track. They are allowed to expand or contract, according to the temperature, to or from each end, where the tension is maintained by means of a set of weights and pulleys. This has the advantage of limiting the tension to the required design conditions that permit optimal current collection. However, the reduced lengths of wires require overlaps at the changeover points between succeeding lengths of equipment, and these require extra poles~
The designer, therefore, must review local annual temperature variations and, ideally, use a purposewritten computer program to simulate the dynamic system under various temperature conditions before choosing 5 ~iixed tent:1iuu· Ur ·uc::1lcan(;e wt:?iyht~ ti}'ti
tem. In the extreme temperatures of Edmonton, Canada, balance weight equipment was found to be essential. In the warm climates of Florida or Southern California, less expensive fixed-tension equipment might be adequate, depending on forecast vehicle speeds.
TRB State-of-the-Art Report 2
Aesthetics
Power distribution system aesthetics is most discussed community concerns during of an LRT project. Designs must both system needs and minimize the amount electrification hardware.
one of the development accommodate of visible
The "overhead clutter" issue is of most concern to communities where LRT alignments use exiting streets. New LRT systems in North America have responded to their communities and their project budgets by using trolley wire in streets and catenary construction on private ROW. Wires can be tastefully integrated into the environment. They certainly can be less obtrusive than the power lines that follow nearly every main street in the United States.
A significant issue is the number, height, and size of poles. Longei: spacing between poles can be achieved with r.abanary, up to 60 m (200 ft), than with trolley wire, 30 to 37 m (100 to 120 ft). The new equipment being installed in San Diego's Commercial Street has been designed to provide an extremely low-profile catenary that is expected to be a l most as unobtrusive as the trolley equipment previously installed in C Street and 12th Avenue.
In street ROWs the impact of trolley wire's closer pole spacing may be reduced by using the same poles for other functions such as street lighting. Obviously, the additional loads from the overhead equipment will necessitate larger diameter poles than would be needed for just lighting, but the slight increase in overall size does not have significant visual impact.
The desired goal is for the distribution system elements, taken together, to intrude as little as possible on the environment and for capital costs to be kept under control.
Summary--Traction Power
New North American LRT systems are standardizing on 600 or 750 V DC for which substation equipment is readily available. Overhead distribution systems must be tailored to the needs of each project, and this involves choices that must integrate consideration of LRT operational needs, climatic conditions, and environmental aesthetics. Careful design of these systems will result in the least obtrusive distribution system possible that will use equipment proven by years in service and control future maintenance problems and costs.
Signaling provides block and switch protection and supervision in areas of high-speed operation, block supervision where required for street operation, protection at hazardous grade crossings, and supervised coordination in proximate vehicle traffic schemes to the extent these runetions really are required for system performance and safety.
Types of LRT Siqnal Systems
Six typical LRT signaling designs and their respective effectiveness may be identified:
• !-!c e,I,...,..,., ,1.,.,. --~ ................. s::,
_,, _______ ~ .. -- ---~---" ............ ""'.t"~&. .... _ .._...,.,. t"'""'.._.,_...,.._u,._.
fixed-guideway vehicle in free-wheeled community (i.e., a streetcar) with no resultant service speed improvement over a bus operationi
• No signaling except preferential at cross traffic--uses signal preemption devices such as
Cost-Effective Application
overhead wire contactors, wheel detectors, induction couples, or other nonvital devices to improve speed by virtual elimination of intersection delays;
'Supervision of track switch facing points (tongue)--uses power on/off switches, time sequencers, induction couples, or other nonvital devices to improve speed by elimination of stops to throw switches; allows trains to keep moving;
• Block supervision (single track in low-speed operation)--similar to preemptive devices; allows an opposing LRV to advance without incurring schedule delay (system speed is improved) if possible to do so;
• Block and switch protection--uses basic railroad signaling technology to provide safe operation by assuring clear line within safe stopping distance; allows relatively high maximum operating speeds such as are generally achieved on those portions of the system on semiexclusive or exclusive ROW; and
• Grade crossing protection--basic railroad signaling technology; gates and flashers provide an actual clear path for LRV movement; eliminates slowdowns to determine if grade crossings are clear; generally recognized as the least hazardous type of crossing protection; allows improved system operating speed.
Signal Technology Application
The designer is obliged to consider the signaling technology available for system operating performance for the least total cost. Within the scope of LRT applications , a well-established catalogue of developed and used (i.e., proven) technology is available:
• Preemptive controls for traffic coordination, street block control, and like supervisory functions include contact wire-pantograph or wire-trolly shoe switches, or short track circuits.
• Switch control, a form of localized train identification, includes power "on" sections, local speed monitors over the measured length of track circuits, and frequency selectable induction between fixed and mobile induction coils.
• Track circuit train detection, which automatically causes vital relay logic to provide block signaling. The same basic technique effects switch control and locking for high-speed operation. Track circuits are the conventional means of controlling gates in all high-speed operations with protected grade crossings (as distinguished from preemptive crossing signaling).
• Other technologies, such as cab signals, classification yards, automatic train operation, and the like, which generally are not suitable to or required for LRT operation.
Thus signaling design must consider not only what technology is available but also the rational assemblage of equipment for a particular application. Signal systems are characterized by custom development or specification for each transit-operating entity to provide a level of safety that will enable that operation to attain an enhanced commercial speed.
If the development is insufficient, no advantage over unsignaled operation is achieved: and train speeds remain similar to those of streetcars of an earlier era. If signal development is excessive, the extra marginal advantage cannot be used--a condition known as "oversignalization.• Both conditions result in added system inefficiencies and unnecessary total costs.
31
Sacramento--A case in Point
The design of Sacramento's new LRT system illustrates the use of various signaling techniques to provide the type and degree of protect ion most appropriate to each segment of the line. In general, the system consists of two radial routes joined for through running in the central business district (CBD). Although through operations are expected to be the rule, patronage projections indicate unbalanced traffic so that in peak service some midline switching will be required. The track plan provides a basic, single-track main line with long sections of double track (about 40 percent of the route length) to enable meets at speed.
The basic operating challenge is to achieve a competitive commercial speed. The CBD streets and inner radials require priority traffic coordination to "keep moving.• The outer portions of the radial legs require the best performance of which the trains are capable. Overall, signaling is being installed to accommodate the two types of 'operation indicated by the previously stated requirements:
• Street speed running--self-supervised block indicators and traffic signal and lane coordination devices with LRT prioritization at most intersections. Spring-operated track switches will be controlled by the track layout and the system modus operandi.
• High-speed running--block signaling and endof-double-track automatic interlocking will be provided. Gate and flasher protection will be installed at all outer area road crossings as well as at blind or hazardous inner area street crossings.
The entire system is to be self-supervised and relies on radio telephone reports for exceptions to expedite remedial actions. Basic system discipline will depend on the LRV operators, a concept compatible with small operations. In Sacramento's case, no more than eight trains will be on the line at any given time.
Other Signaling Applications and Progres s
Several other signaling techniques may soon become available to offer further opportunities for LRT cost savings while providing suitable levels of protection and control. Some of these are
• Block protection by check-in and check-out using simplified track equipment to indicate occupancy of a track block. Such an arrangement avoids the need to "cut" the track into track circuits and to deal with the electrical coordination necessitated by superposition of track circuits on the traction power negative feed. Thus the check-in/check-out scheme enhances the use of continuous welded rail, eliminates the specialized bonding for negative traction power distribution, and removes the possibility of power-induced interference in the signaling controls. It also is compatible with systems operating on relatively long headways as well as those in which there is a need for train detection in long sections of paved trackage. Currently, the system is under development and is to be demonstrated on the San Diego trolley.
• Where LRT headways and the number of trains operating make simple, two-way radio communication cumbersome, improved self-supervision may be obtained using automatic radio data transmission based on "seeing" passive wayside transponders. These allow automatic monitoring of vehicles on a central die-
:
32
play. Several examples of equipment for this type of monitoring are operating on bus systems.
• In addition to vehicle location monitoring, safe, high-speed, narrow-band inductive transmissions may be used to control track switches from LRVmounted route request equipment. This is a system used on some European LRT systems and exemplifies the proven, available equipment for this kind of control.
• If an LRT system track plan consists entirely of double-track lines, protection is limited virtually to following movement control based on least allowable close-up headwayi grade crossing protection; and, in some cases, track switch control. This indicates a simple block signaling scheme on exclusive ROW portions of the system and possibly no block signaling elsewhere (i.e., operating "on sight" as would a bus in traffic). The further implication of this concept is that full interlocking ohould not be required for portions of the line operating at street speed nor at terminals in the CBD.
• Automatic train control (ATC) is thought necessary by some for high-speed, close headway operations. The California Public Utilities Commission (PUC) requires ATC where LRV speeds may exceed 55 mph. For overall LRT economy, ridership attractiveness, and safety, the advantages of ATC may be debatable. However, ATC may be required for other than "small" operations that typify some new LRT systems now being built or proposed (i.e., systems with high speeds or close headways, or both).
S ummary--Si gnal s
LRT system designers are challenged to find the correct level of signaling for each segment of an LRT line, The different needs for signals indicated by the wide variances in LRT ROW types and operating conditions, coupled with the broad catalogue of proven, available signal equipment, should encourage designers to seek the technical solution that will both respond to conditions and conserve total costs.
FARE COLLECTION
Fares traditionally have been collected on board transit vehicles by operators or fare collectors, or in stations using turnstiles and barriers to separate passengers who have paid from those who have not. The former requires an employee on each vehicle. The latter requires servicing and repairing the fare collection equipment and, most often, involves staff in stations to collect fares or assist riders, These costs, if not carefully controlled, may approach the value of fares collected and thus prevent fares from contributing significantly to meeting overall operating and maintenance costs.
Self-Service, Proof-of-Payment Fare Collection
Modern LRT design and operating practice offer a solution to overcome this problem: self-service, proof~of~payrnent (SSPOP) fars collection. With SSPOP, passengers buy tickets from vending machines at stations, and these tickets (or season passes or bus transfers) are subject to random inspection by roving staff. In San Diego a fairly high rate of inspection (about 25 percent of a.L.L r1aersj and sciff fines have held evasion to 1 percent or less since the system opened in 1981. SSPOP is not an honor system. Riders caught without tickets are punished. Several benefits accrue from SSPOP. Multicar trains need only one operator. This can yield substantial savings
TRB State-of-the-Art Report 2
in operating labor, a factor that was significant in justifying the LRT now under construction in Sacramento. Stations need not be staffed, which is another source of operating savings. Finally, station construction is simplified. As a practical matter, it is virtually impossible to build a secure "fare paid" area into an at-grade, low-platform station.
Fare vendors should be connected via dedicated telephone lines, or other simply accessible channels, to audible alarms in the dispatcher's office to inform staff when break-ins are being attempted. These alarms allow the dispatcher to identify the machine affected so that security personnel can be sent promptly to the scene.
Sta t i on Mon i toring
A dispatcher can monitor unstaffed station platforms using remote television. A full closed-circuit setup will allow "real-time" monitoring and can provide a photographic record of incidents suitable for court use. For substantially less cost a slow scan TV setup will provide dispatchers with some station monitoring capability but will not yield high enough quality for court exhibits. The principal factor that differentiates the cost of the two types of video monitoring is that the real-time system requires broad band communication (i.e., a circuit over coaxial cable) • The slow scan system uses a voice band channel (i.e., one that is provided by telephone line). The slowing down of the intelligence rate is physically necessary for the use of voice band transmission. There also is some room for argument about the effectiveness of an individual's capability to monitor a real-time video screen: it appears to have a mesmerizing effect that is counter to the broad band capability.
Experience with slow scan in San Diego has indicated to Sacramento's designers that it probably has greater utility for prevention (patrons and others see the cameras mounted at the stations) than for providing staff with usable information. As a result station monitoring in Sacramento will consist of train operators and fare inspectors passing by and observing, fare inspectors alighting to change trains, roving security patrols, local police patrols, audible alarms on the fare vendors, and emergency lines to the dispatcher and police on the pay telephones. It is believed that this will suffice in that particular socioeconomic environment. In specifying monitoring programs for other new LRT systems, designers must consider local conditions.
Summary--Fare Collection
Buses and multiple-unit train operations with onboard fare collection are labor intensive per unit passenger. SSPOP fare collection and passengeroperated doors practically reduce the rider-toemployee ratio to a level that is economically feasible for LRT. However, security problems (a subjective issue) are not alleviated by a reduction in staff. Nonetheless, security problems (or con-cepta) should not generate requirements that offset the advantages presented by SSPOP and passenger-controlled doors.
CONCLUSION
A transit agency that wishes to introduce an LRT system with balanced total costs (capital and operating costs versus LRT performance) and aesthetic
Cost-Effective Application
acceptability must make a number of significant decisions in determining the final type of system configurations to be used. These issues are addressed during the feasibility and conceptual engineering stages.
The application of technology for the key LRT fixed systems has been swnmarized. Factors that affect the cost-effective design and specification of track and roadbed, traction power, signals, and fare collection have been stressed. Each is an important element of the overall LRT system, and each ca~ be designed to enhance system economics by controlling capital and operating costs.
33
An attempt has also been made to show that these total costs must be balanced against LRT system performance for a given induced ridership. For LRT, the balance is bounded on both the lower and the upper ends of its spectrum. An excursion either way removes the LRT right-to-be.
In today's difficult financial environment for rail transit systems, designers are encouraged to seek out and apply balanced cost solutions such as those described in this paper. Only by planning and building cost-effective systems will most American cities be able to afford the benefits of modern rail transit service.
Part2 Policy and Planning
Considerations
Value Engineering Methods Applied to a Guideway Transit System Proposed for Orange County, California Jagbir Sihota Raymond Kaiser Engineers Fountain Valley, California
TomMcGean Consultant in Transportation Annandale, Virginia
Clark Henderson Clark Henderson Associates San Francisco, California
The Orange County Transit District (OCTD), in conjunction with other agencies and consultants, has been studying several long-range transit development strategies including the implementation of a guideway transit system. Conceptual engineering for the guideway alternative, completed in 1982, produced a set of conceptual designs that have initial cost estimates in the range of $900 million to $1.2 billion. Late in 1982 the board of directors and staff of OCTD decided to apply value engineering (VE) methods in an effort to reduce the costs of the guideway alternative but preserve essential performance characteristics including speed, safety, and dependability. Some of the results of the application of value engineering techniques to the proposed OCTD guideway transit system are documented here. This value engineering work produced estimated savings of $150 million, and the cost of conducting the VE studies was approximately $100,000.
The rejection of Proposition A by the Orange County electorate on June 5, 1984, has left the funding for this system somewhat uncertain. However, at a meeting on August 6, 1984, the board voted to retain the option for a north-south guideway transit line as part of its transit development strategy. As a result the work covered by this paper remains alive in Orange County.
VALUE ENGINEERING
Value engineering may be defined as a creative, organized approach the objective of which is to optimize the cost or performance, or both, of a facility or system. A systematic approach is employed to eliminate or modify anything that adds cost without contributing to functional performance. VE employs technical, operational, and economic analysis methods and produces recommendations to management.
Value engineers break the subject under study into functions in order to identify the major pur-
poses of or uses for a system. Traditional value engineering techniques attempt to determine the "worth" of each function by determining the lowest possible cost for performing the basic function in the most elementary manner feasible. To do this at the conceptual stage of a transit system would tend to repeat the alternatives analysis phase by comparing the proposed concept against a "baseline bus• or "do nothing" alternative. The mechanism for such a comparison, the federal alternatives analysis and environmental impact statement, is already in place. These procedures require consideration of broad social goals including land use planning, pollution, urban growth, and historical considerations. It would be impractical to force such an analysis into the more limited format of a value engineering study and would needlessly duplicate existing analyses that have been designed for this specific purpose.
As a result there does not appear to be a role for value engineering during the alternatives analysis itself. However, when this step has been completed, it has been common to move directly into preliminary engineering. At this time the conceptual design that emerged from the alternatives analysis may be prematurely frozen without any systematic attempt being made to optimize its value.
It is at this point that the Orange County VE program was initiated to recommend changes in the conceptual design to save money while preserving all basic functions. The methodological approach adopted was to determine where the majority of the money was being spent and identify alternatives and less expensive solutions that would still meet the functional requirements. To this end, the functional requirements were expressed quantitatively in major areas related to service and operations, reliability, safety, environmental impacts, passenger comfort, and civil or route constraints. These requirements were developed from available sources of information and confirmed in discussions with OCTD staff. Proposed VE options were reviewed against each of these functional requirements by the VE team. If the team could foresee any significant
37
•
38
impact of the proposed option on a functional requirement, that area was identified and assigned to one or more team members for analysis.
An important question to be considered is when VE will have the greatest potential payoff. Experience shows that savings potential drops off more rapidly the later VE is applied during planning, design, and construction. This is because of two factors: First, the cost reduction potential decreases as the design becomes frozen. Second, the cost of making a change increases as the project progresses and it becomes necessary to make expensive design modifications. For these reasons it is valuable to institute VE immediately after the conceptual design phase as was done in Orange County. Typically, approximately 20 percent of the elements of a system will represent 80 percent of the actual costs. A nominal level of VE effort directed at these high-cost areas during the early stages of planning and design can achieve significant savings.
The key to the VE approach is a systematic technical and economic review by a team of qualified professionals who did not participate in the design phase. This team tries to come up with suggestions for reducing costs without adversely affecting performance, reliability, and safety. Important as it is to have the necessary skills on the VE team, its proper functioning requires that the team be limited to between three and eight members with a typical team consisting of three to five members. Fewer than three members would not be sufficient to provide creative interaction and a group perspective, and a team of more than eight members will become unwieldy and begin to develop factions. Especially during the early stages when VE is applied at the systems level, it is necessary that some team members be multidisciplinary or systems engineers so that the necessary expertise can be obtained within a group of this size. In this VE project for OCTD, the team included personnel with special knowledge of evaluation techniques and transit system design, operations, and costs.
ORANGE COUNTY VALUE ENGINEERING STUDY
The first step in any VE study is to designate the system for study. For the Orange County VE review, the route to be studied consisted of two lines (Figure 1). The north-south line ran from north of Disneyland south to Irvine with a split at MacArthur Boulevard. This line was completely elevated. The east-west line ran trom Buena Park; to Santa Ana where it met the north-south 1 ine. The east-west line was completely at grade. At the time of the study, plans called for operation of six-axle, light rail vehicles with an automatic signaling system on both lines (..!.) •
The OCTD VE study followed the five phases tradiLionally employed: the information gathering phase, the creative or idea-generating phase, the assessment and evaluation phase, the proposal phase, and the implementation phase. The first step was to g;;,ther information (both technical and economic) on the baseline or core system. From this information it was determined where the major expenditures were and what areas would be potentially fruitful for further investigation. A meeting of the VE group was then convened to review thil:::li mctte.L ial auU ~u cum~ uf, with ideas about how to save money. A list of these ideas and the screening process is presented later. The most significant of these ideas was a suggestion to single track the north-south line. Single tracking means the operation of both directions of traffic on a single track. Sidings are located periodi-
TRB State-of-the-Art Report 2
cally to enable the two directions of traffic to pass one another. The suggestion for single tracking was then subjected to a through economic and functional assessment. This assessment included a lifecycle cost analysis, an operations analysis, and an environmental impact analysis.
The next step (the proposal phase) included documenting the effort and briefing the OCTD board members on the recommended single-tracking alternative. This briefing, given at a board meeting on November 21, 1983, resulted in a unanimous vote by the board to adopt single tracking. Because of the results of the Proposition A vote, the implementation phase has been delayed.
system cost Analysis
To determine where money was being spent on the baseline system, both capital and life-cycle cost breakdowns were prepared. A life-cycle cost analysis for transit systems involves a considerable clerical burden. Consequently, a computerized model was developed with the aid of Multiplan spreadsheet software and an IBM PC computer.
Table 1 gives a summary of the capital costs for the north-south and the east-west lines. Starting at the left, the first column of Table 1 identifies the initial cost elements of the entire system grouped by major categories including contingencies and professional services. The next two columns contain units and unit costs for certain items likely to be affected by alternative designs. The next six columns record quantity and cost data for the east-west baseline, the north-south baseline, and the entire baseline system. Costs are totaled by subsystems, cost categories, and for the entire system. Note that the total initial cost of the baseline system is $918. 54 million. Cost estimates were developed from Principles o ·f Engineering Economy (~).
The column headed "Adjusted Baseline Cost" records the costs of system elements plus contingencies and professional service. The contingency factor is i~ percent except for venicie and rigncsof-way, and the professional services factor is 17 percent for all elements except right-of-way. The total adjusted baseline cost recorded is $918.54 million.
The next column expresses the adjusted cost of each element, subsystem, and category as a percentage of the total initial cost of the baseline system. Note, for example, that guideway and structure
whereas vehicles and spare parts account for only 6.58 percent of the total initial cost.
The key conclusion drawn from this table was that the north-south line cost three times as much as the east-west line, even though it was only a third longer. If any significant savings were to be found, it was clearly necessary to closely examine the north-south line.
Figure 2 shows the capital cost breakdown for the north-south line. The key observation is that nearly 60 percent of the cost is attributable to guideway and structures. The reason that the north-south line is so expensive is that it is elevated whereas the east-west line runs at grade. When track work and third-rail costs are added, two-thirds of the total ~nRt. iR ;::iit.t.rihnt.;ahlP. t.n thP g11ifipw;::iiy r1nn ;:u;u:~~i,:1t~n
elements. It was evident that only modest savings would be
possible on vehicles, stations, or controls. A 50 percent reduction in vehicle costs would only reduce the cost of the north-south line by a few percent. Cutting the costs of the stations in half would also
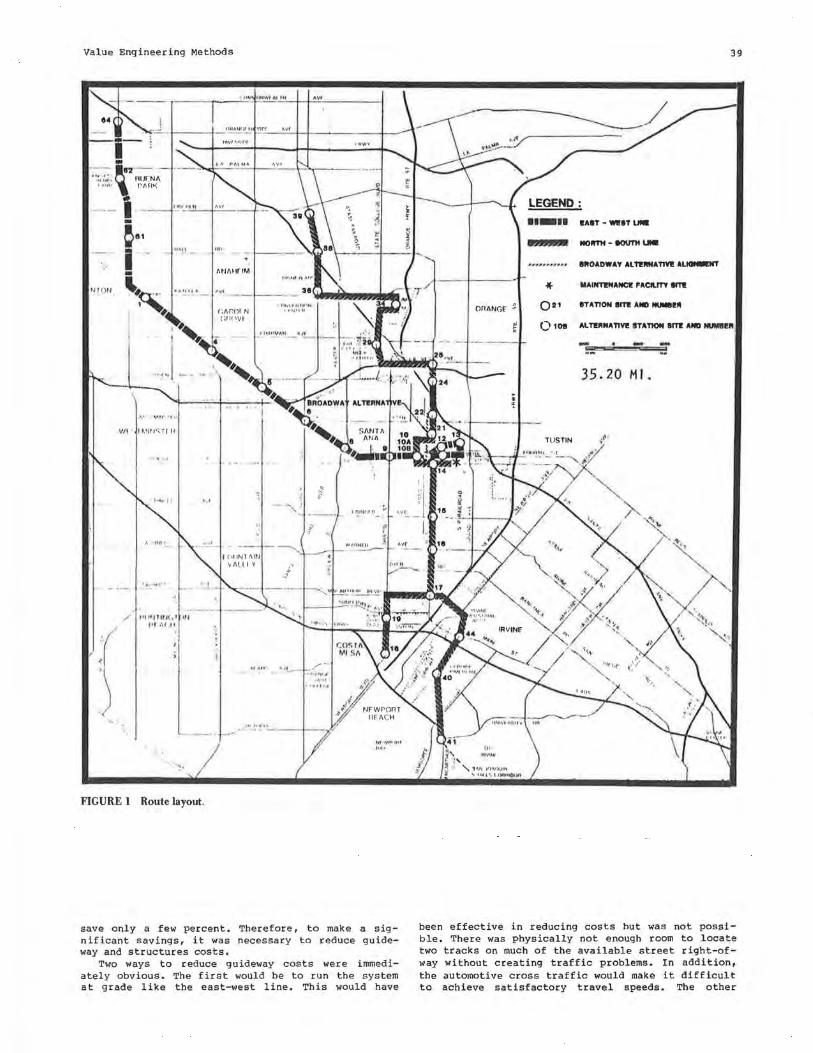
Value Engineering Methods
• ' "'"'' P/\Ht< -~ ' RIJr N.;-- ---
~~" ,..!.'ll~t::..• - -1-'cc'.c.' -
!•1 i
U,\ j j
""" '~~ ....... I ~ .~,~
'"'~ , ;
Vlt 1 Mlf-J~ Tr P
... , ....
.•.
'
(;l\nnr ~J c;ruw•
. OH.i\NGf .,,
C
rn1tff,rn t, 15 ~ ~
~-1---.J
f ~ ')
l!AIT • Wl!IT UNI
- NOlfflt • 90\rTII UNI!
lltlOADWAT AL Tl!IINATITI! AL..-iff
* MAINn!IANCI! FACll.m IITI!
Q21 STATION 11"1! AND ...-ell
39
0 1DII ALTl!IINATIYI! STATION BITI! AND IMlllll!II
35.20 Ml
"'"""' ! I\Vf ;jl 18 {
-~-·1•• -
/ 1'11,,1111(.1 i, J ,, , /\IJf
/ FIGURE I Route layout .
-~
save only a few percent. Therefore, to make a significant savings, it was necessary to reduce guideway and structures costs.
Two ways to reduce guideway costs were immediately obvious. The first would be to run the system at grade like the east-west line. This would have
<.,
been effective in reducing costs but was not possible. There was physically not enough room to locate two tracks on much of the available street right-ofway without creating traffic problems. In addition, the automotive cross traffic would make it difficult to achieve satisfactory travel speeds. The other
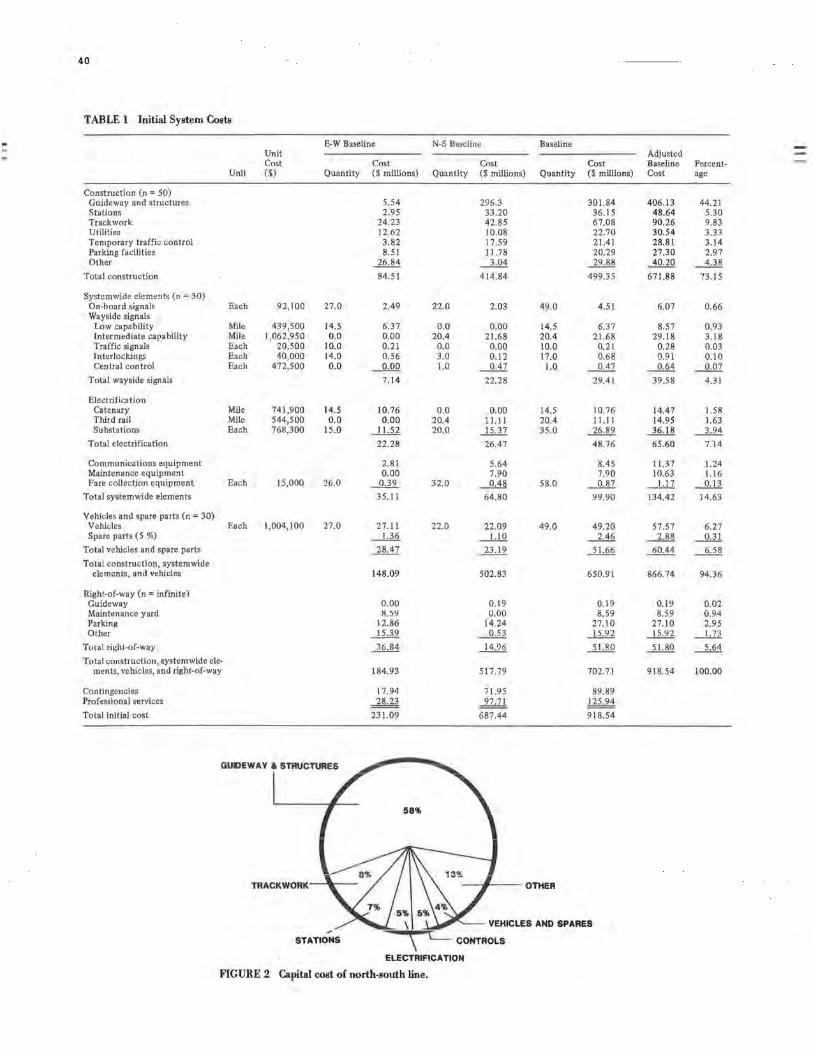
,.,
40
TABLE I Initial Syetem Coete
E-W Baseline N-S Baseline Unit Cost Cost
Unit ($) Quantity ($ millions) Quantity
Construction (n = 50) Guideway and structures 5.54 Stations 2.95 Trackwork 24.23 Utilities 12.62 Temporary traffic control 3.82 Parking facilities 8.51 Other 26.84
Total construction 84.51
Systemwide elements (n = 30) On-board signals Each 92,100 27.0 2.49 22. 0 Wayside signals
Low capability Mile 439,500 14.5 6.37 0.0 Intermediate capability Mile 1,062,950 0.0 0.00 20.4 Traffic signals Each 20,500 10.0 0.21 0.0 Inter lockings Each 40,000 14.0 0.56 3.0 Central control Each 472,500 0.0 0.00 1.0
Total wayside signals 7. 14
Electrification Catenary Mile 741,900 14.5 10.76 0.0 Third rail Mile 544,500 0.0 0.00 20.4 Substations Each 768,300 15.0 -1.1.dl 20.0
Total electrification 22.28
Communications equipment 2.81 Maintenance equipment 0.00 Fare collection equipment Each 15,000 26.0 __Q,12_ 32.0
Total systemwide elements 35.11
Vehicles and spare parts (n = 30) Vehicles Each 1,004,100 27.0 27.11 22.0 Spare parts (5 %) ---1.,1,§,
Total vehicles and spare parts 28.47
Total construction, systemwide elements, and vehicles 148.09
Right-of-way (n = infinite) Guideway 0.00 Maintenance yard 8.5~ Parking 12.86 Other 15.39
Total right-of-way 36.84
Total construction, system wide ele-men ts, vehicles, and right-of-way 184.93
Contingencies Professional services
Total initial cost
17.94 28.23
231.09
GUl>EWA Y & STRUCTURES
ELECTRIFICATION
F1GURE 2 Capital coet of north-eouth line.
Cost ($ millions)
296.3 33.20 42.85 10.08 17.59 11.78
---1,Qi 414.84
2.03
0.00 21.68
0.00 0.12
_Ml
22.28
0.00 11.11 15.37
26.47
5.64 7.90 ~
64.80
22.09 -1J..Q.
23.19
502.83
0.19 0.00
14.24 ___Qj]_
14.96
517.79
71.95 97.71
687.44
Baseline Adjusted
Cost Baseline Percent-Quantity ($ millions) Cost age
301.84 406. 13 44.21 36.15 48 .64 5.30 67.08 90.26 9.83 22.70 30.54 3.33 21.41 28.81 3.14 20.29 27.30 2.97 29.88 40.20 ~
499.35 67 1.88 73.15
49.0 4.5 1 6.07 0.66
14.5 6.37 8.57 0.93 20.4 21.68 29.18 3.18 10.0 0.21 0.28 0.03 17.0 0.68 0.91 0.10
1.0 0.47 0.64 .......Q,Q1
29.41 39.58 4.31
14.5 10.76 14.47 1.58 20.4 11.11 14.95 1.63 35.0 26.89 36.18 --1.,,2i
48.76 65 .60 7.'14
8.45 11.37 1.24 7.90 10.63 1.16
58.0 _fill -1J1. __,,Q,,ll
99.90 134.42 14.63
49.0 49.20 57.57 6.27 ---1Af -1M _Q,11.
51.66 60.44 ~
650.9 1 866.74 94.36
0.19 0.19 0.02 8.59 8.59 0.94
27.10 27.10 2.95 15.92 15.92 ---1.ll 51.80 51.80 5.64
702.71 918.54 100.00
89.89 125.94
918.54
OTHER
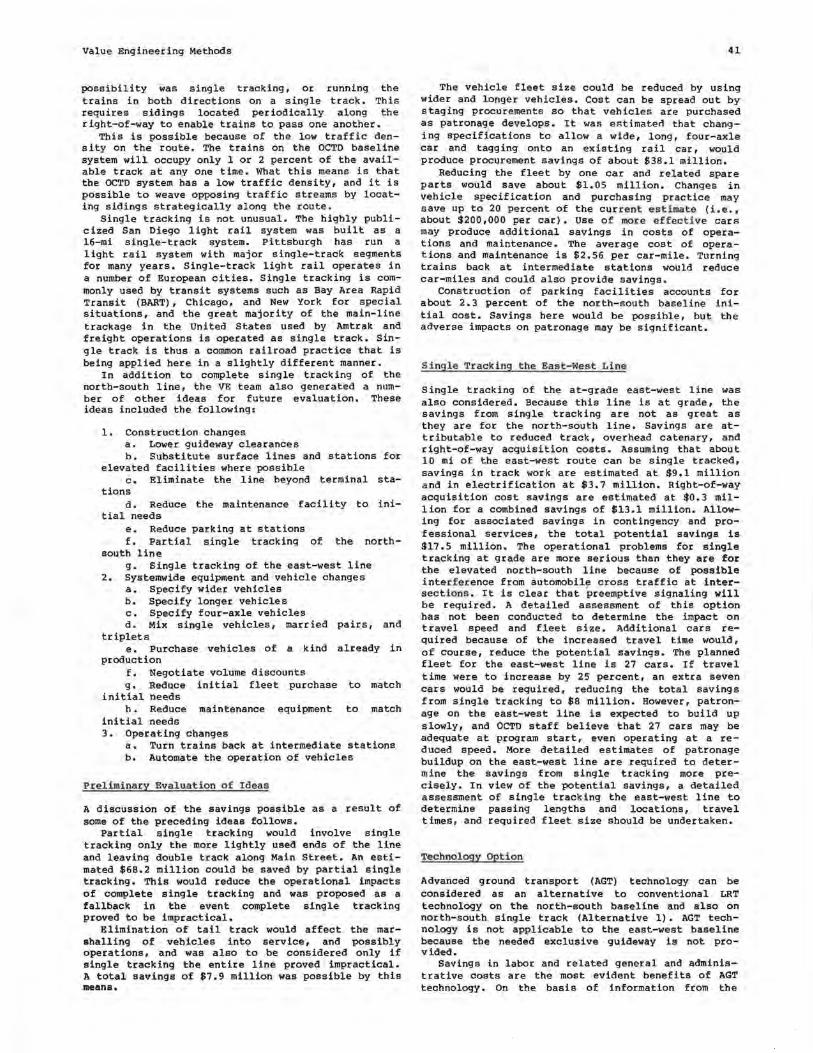
Value Engineering Methods
possibility was single tracking, or running the trains in both directions on a single track, This requires sidings located periodically along the right-of-way to enable trains to pass one another.
This is possible because of the low traffic density on the route, The trains on the OCTD baseline system will occupy only 1 or 2 percent of the available track at any one time. What this means is that the OCTD system has a low traffic density, and it is possible to weave opposing traffic streams by locating sidings strategically along the route.
Single tracking is not unusual, The highly publicized San Diego light rail system was built as a 16-mi single-track system. Pittsburgh has run a light rail system with major single-track segments for many years. Single-track light rail operates in a number of European cities. Single tracking is commonly used by transit systems such as Bay Area Rapid Transit (BART), Chicago, and New York for special situations, and the great majority of the main-line trackage in the United States used by Amtrak and freight operations is operated as single track , Single track is thus a common railroad practice that is being applied here in a slightly different manner.
In addition to complete single tracking of the north-south line, the VE team also generated a number of other ideas for future evaluation. These ideas included the following:
1, Construction changes a. Lower guideway clearances b. Substitute surface lines and stations for
elevated facilities where possible c, Eliminate the line beyond terminal sta
tions d, Reduce the maintenance facility to ini
tial needs e. Reduce parking at stations f, Partial single tracking of the north
south line g, Single tracking of the east-west line
2, Systemwide equipment and vehicle changes a. Specify wider vehicles b, Specify longer vehicles c. Specify four-axle vehicles d. Mix single vehicles, married pairs, and
triplets e, Purchase vehicles of a kind already in
production f, Negotiate volume discounts g, Reduce initial fleet purchase to match
initial needs h, Reduce maintenance equipment to match
initial needs 3. Operating changes
a, Turn trains back at intermediate stations b, Automate the operation of vehicles
Preliminary Eval uation o f Ideas
A discussion of the savings possible as a result of some of the preceding ideas follows.
Partial single tracking would involve single tracking only the more lightly used ends of the line and leaving double track along Main Street, An estimated $68,2 million could be saved by partial single tracking, This would reduce the operational impacts of complete single tracking and was proposed as a fallback in the event complete single tracking proved to be impractical,
Elimination of tail track would affect the marshalling of vehicles into service, and possibly operations, and was also to be considered only if single tracking the entire line proved impractical. A total savings of $7,9 million was possible by this means.
41
The vehicle fleet size could be reduced by using wider and longer vehicles. Cost can be spread out by staging procurements so that vehicles are purchased as patronage develops. It was eRtimat.ed that changing specifications to allow a wide, long, four-axle car and tagging onto an existing rail car, would produce procurement savings of about $38.1 million.
Reducing the fleet by one car and related spare parts would save about $1.05 million. Changes in vehicle specification and purchasing practice may save up to 20 percent of the curre nt estimate (i.e., about $200,000 per car). use of more effective cars may produce additional savings in costs of operations and maintenance. The average cost of operations and maintenance is $2.56 per car-mile, Turning trains back at intermediate stations would reduce car-miles and could also provide savings.
Construction of parking facilities accounts for about 2, 3 percent of the north-south baseline initial cost. Savings here would be possible, but the adverse impacts on patronage may be significant,
single Tracki ng t he East-West Line
Single tracking of the at-grade east-west line was also considered, Because this line is at grade, the savings from single tracking are not as great as they are for the north-south line, Savings are attributable to reduced track, overhead catenary, and right-of-way acquisition costs , Assuming that about 10 mi of the east-west route can be single tracked, savings in track work are estimated at $9, l million and in electrification at $3,7 million. Right-of-way acquisition cost savings are estimated at $0.3 million for a combined savings of $13.1 million, Allowing for associated savings in contingency and professional services, the total potential savings is $17,5 million. The operational problems for single tracking at grade are more serious than they are for the elevated north-south line because of possible interference from automobile cross traffic at intersections . It is clear that preemptive signaling will be required. A detailed assessment of this option has not been conducted to determine the impact on travel speed and fleet size. Additional cars required because of the increased travel time would, of course, reduce the potential savings, The planned fleet for the east-west line is 27 cars, If travel time were to increase by 25 percent, an extra seven cars would be required, reducing the total savings from single tracking to $8 million. However, patronage on the east-west line is expected to build up slowly, and OCTD staff believe that 27 cars may be adequate at program start, even operating at a reduced speed. More detailed estimates of patronage buildup on the east-west line are required to determine the savings from single tracking more precisely, In view of the potential savings, a detailed assessment of single tracking the east-west line to determine passing lengths and locations, travel times, and required fleet size should be undertaken,
Technology Option
Advanced ground transport (AGT) technology can be considered as an alternative to conventional LRT technology on the north-south baseline and also on north-south single track (Alternative 1), AGT technology is not applicable to the east-west baseline because the needed exclusive guideway is not provided.
Savings in labor and related general and administrative costs are the most evident benefits of AGT technology. On the basis of information from the
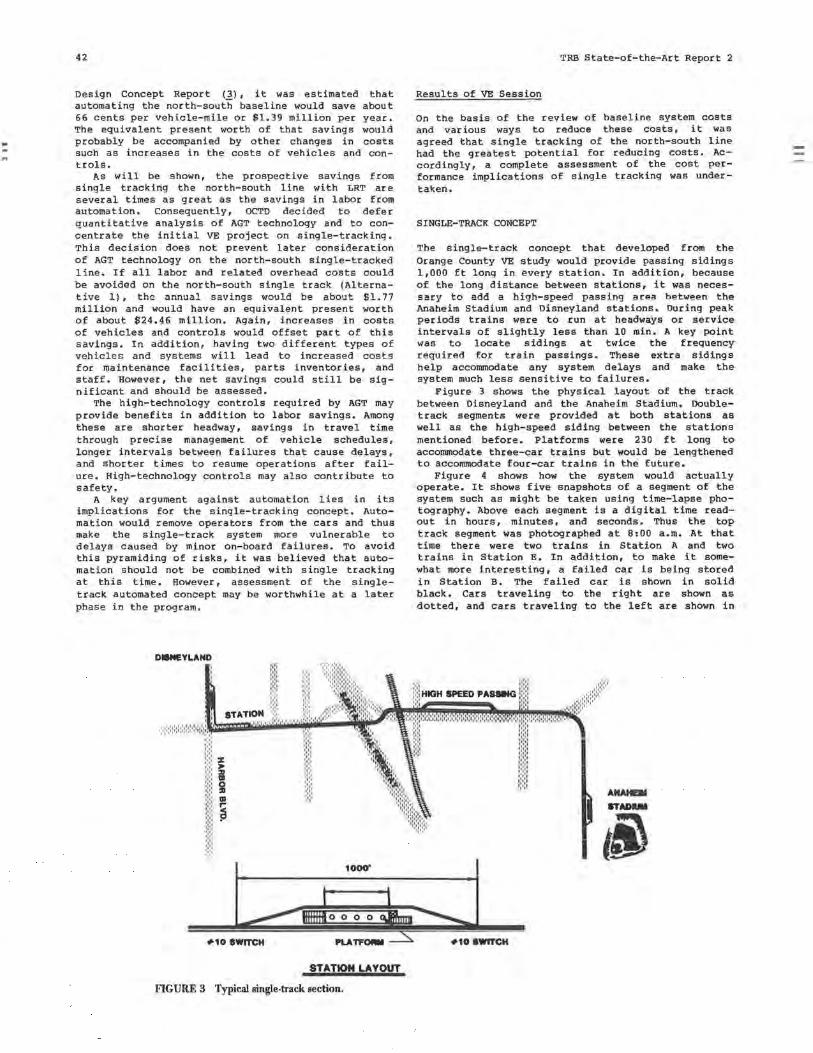
..
42
Design Concept Report (3), it was estimated that automating the north-south baseline would save about 66 cents per vehicle-mile or $1.39 million per year. The equivalent present worth of that savings would probably be accompanied by other changes in costs such as increases in the costs of vehicles and controls.
As will be shown, the prospective savings from single tracking the north-south line with LRT are several times as great as the savings in labor from automation. Consequently, OCTD decided to defer quantitative analysis of AGT technology and to concentrate the initial VE project on single-tracking. This decision does not prevent later consideration of AGT technology on the north-south single-tracked line. If all labor and related overhead costs could be avoided on the north-south single track (Alternative 1), the annual savings would be about $1. 77 million and would have an equivalent present worth of about $24.46 million. Again, increases in costs of vehicles and controls would offset part of this savings. In addition, having two different types of vehicles and systems will lead to increased costs for maintenance facilities, parts inventories, and staff. However, the net savings could still be significant and should be assessed.
The high-technology controls required by AGT may provide benefits in addition to labor savings. Among these are shorter headway, savings in travel time through precise management of vehicle schedules, longer intervals between failures that cause delays, and shorter times to resume operations after failure. High-technology controls may also contribute to safety.
A key argument against automation lies in its implications for the single-tracking concept. Automation would remove operators from the cars and thus make the single-track system more vulnerable to delays caused by minor on-board failures. To avoid this pyramiding of risks, it was believed that automation should not be combined with single tracking at this time. However, assessment of the singletrack automated concept may be worthwhile at a later phase in the program .
DISNEYLAND
TRB State-of-the-Art Report 2
Results of VE Session
on the basis of the review of baseline system costs and various ways to reduce these costs, it was agreed that single tracking of the north-south line had the greatest potential for reducing costs. Accordingly, a complete assessment of the cost performance implications of single tracking was undertaken.
SINGLE-TRACK CONCEPT
The single-track concept that developed from the Orange County VE study would provide passing sidings 1,000 ft long in every station. In addition, because of the long distance between stations, it was necessary to add a high-speed passing area between the Anaheim Stadium and Disneyland stations. During peak periods trains were to run at headways or service intervals of slightly less than 10 min. A key point was to locate sidings at twice the frequency required for train passings. These extra sidings help accommodate any system delays and make the system much less sensitive to failures.
Figure 3 shows the physical layout of the track between Disneyland and the Anaheim Stadium. Doubletrack segments were provided at both stations as well as the high-speed siding between the stations mentioned before. Platforms were 230 ft long to accommodate three-car trains but would be lengthened to accommodate four-car trains in the future.
Figure 4 shows how the system would actually operate. It shows five snapshots of a segment of the system such as might be taken using time-lapse photography. Above each segment is a digital time readout in hours, minutes, and seconds. Thus the top track segment was photographed at 8:00 a.m. At that time there were two trains in Station A and two trains in Station E. In addition, to make it somewhat more interesting, a failed car is being stored in Station B. The failed car is shown in solid black. Cars traveling to the right are shown as dotted, and cars traveling to the left are shown in
.,.,o awrrcH PLATl'ORII :::::s .,.,o SWITCH
STATION LAYOUT
F1GURE 3 Typical single-track section.
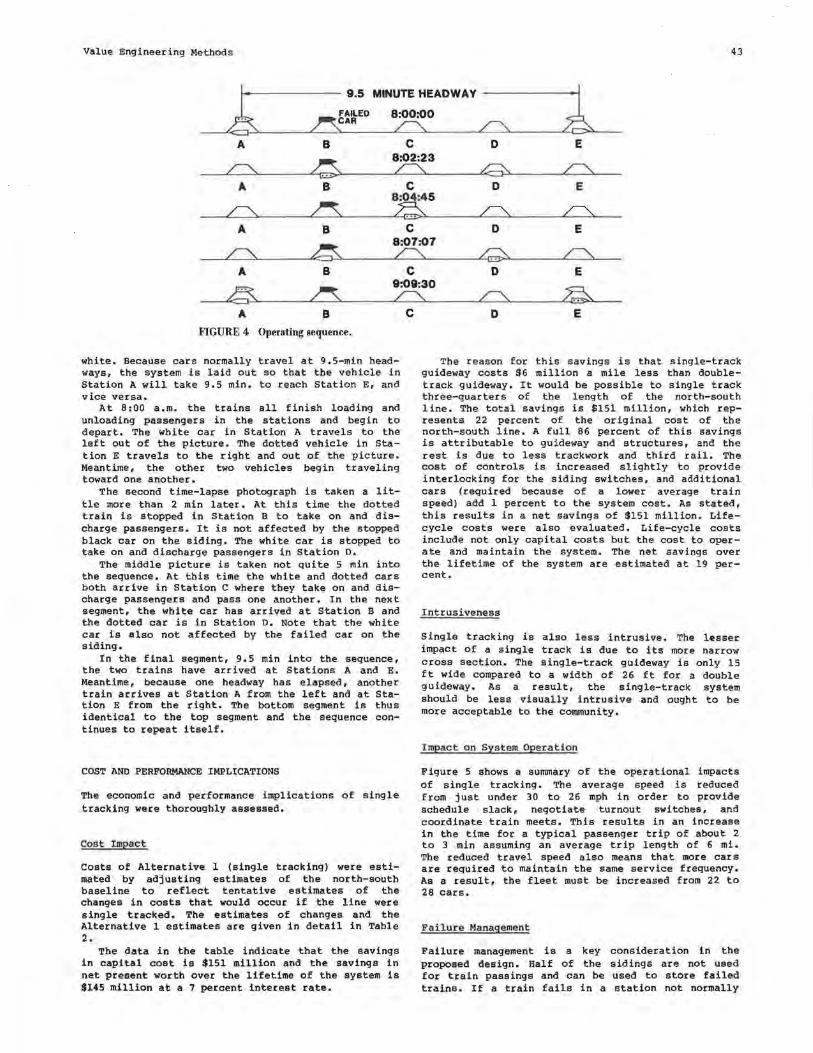
Value Engineering Methods 43
~ 9.5 MINUTE HEADWA V L FAILED
~CAR 8:00:00 ,/'-.. r"'-.
A B C D E
~ 8:02:23
C>. ,/'-.. .-9 ~
A B C D E 8:04:45
r\, ~ ~ ~ ~
A B C D E
~ 8:07:07
r\, /',. .G ,/'-..
A B C D E
~ ~ 9:09:30
~ ~ /',.
A B
FIGURE4 Operating sequence.
white. Because cars normally travel at 9.5-min headways, the system is laid out so that the vehicle in Station A will take 9.5 min. to reach Station E, and vice versa.
At 8:00 a.m. the trains all finish loading and unloading passengers in the stations and begin to depart. The white car in Station A travels to the left out of the picture. The dotted vehicle in Station E travels to the right and out of the picture. Meantime, the other two vehicles begin traveling toward one another.
The second time-lapse photograph is taken a little more than 2 min later. At this time the dotted train is stopped in Station B to take on and discharge passengers. It is not affected by the stopped black car on the siding. The white car is stopped to take on and discharge passengers in Station o.
The middle picture is taken not quite 5 min into the sequence. At this time the white and dotted cars both arrive in Station C where they take on and discharge passengers and pass one another. In the next segment, the white car has arrived at Station Band the dotted car is in Station o. Note that the white car is also not affected by the failed car on the siding.
In the final segment, 9.5 min into the sequence, the two trains have arrived at Stations A and E. Meantime, because one headway has elapsed, another train arrives at Station A from the left and at Station E from the right. The bottom segment is thus identical to the top segment and the sequence continues to repeat itself.
COST AND PERFORMANCE IMPLICATIONS
The economic and performance implications of single tracking were thoroughly assessed.
Cost Impact
Costs of Alternative 1 (single tracking) were estimated by adjusting estimates of the north-south baseline to reflect tentative estimates of the changes in costs that would occur if the line were single tracked. The estimates of changes and the Alternative 1 estimates are given in detail in Table 2.
The data in the table indicate that the savings in capital cost is $151 million and the savings in net present worth over the lifetime of the system is $145 million at a 7 percent interest rate.
C D E
The reason for this savings is that single-track guideway costs $6 million a mile less than doubletrack guideway, It would be possible to single track three-quarters of the length of the north-south line. The total savings is $151 million, which represents 22 percent of the original cost of the north-south line. A full 86 percent of this savings is attributable to guideway and structures, and the rest is due to less trackwork and third rail. The cost of controls is increased slightly to provide interlocking for the siding switches, and additional cars (required because of a lower average train speed) add 1 percent to the system cost. As stated, this results in a net savings of $151 million. Lifecycle costs were also evaluated. Life-cycle costs include not only capital costs but the cost to operate and maintain the system. The net savings over the lifetime of the system are estimated at 19 percent.
Intrusiveness
Single tracking is also less intrusive. The lesser impact of a single track is due to its more narrow cross section. The single-track guideway is only 15 ft wide compared to a width of 26 ft for a double guideway, As a result, the single-track system should be less visually intrusive and ought to be more acceptable to the community.
Impact on Sys.tern Operation
Figure 5 shows a summary of the operational impacts of single tracking. The average speed is reduced from just under 30 to 26 mph in order to provide schedule slack, negotiate turnout switches, and coordinate train meets. This results in an increase in the time for a typical passenger trip of about 2 to 3 min assuming an average trip length of 6 mi, The reduced travel speed also means that more cars are required to maintain the same service frequency. As a result, the fleet must be increased from 22 to 28 cars.
Failure Management
Failure management is a key consideration in the proposed design. Half of the sidings are not used for train passings and can be used to store failed trains. If a train fails in a station not normally
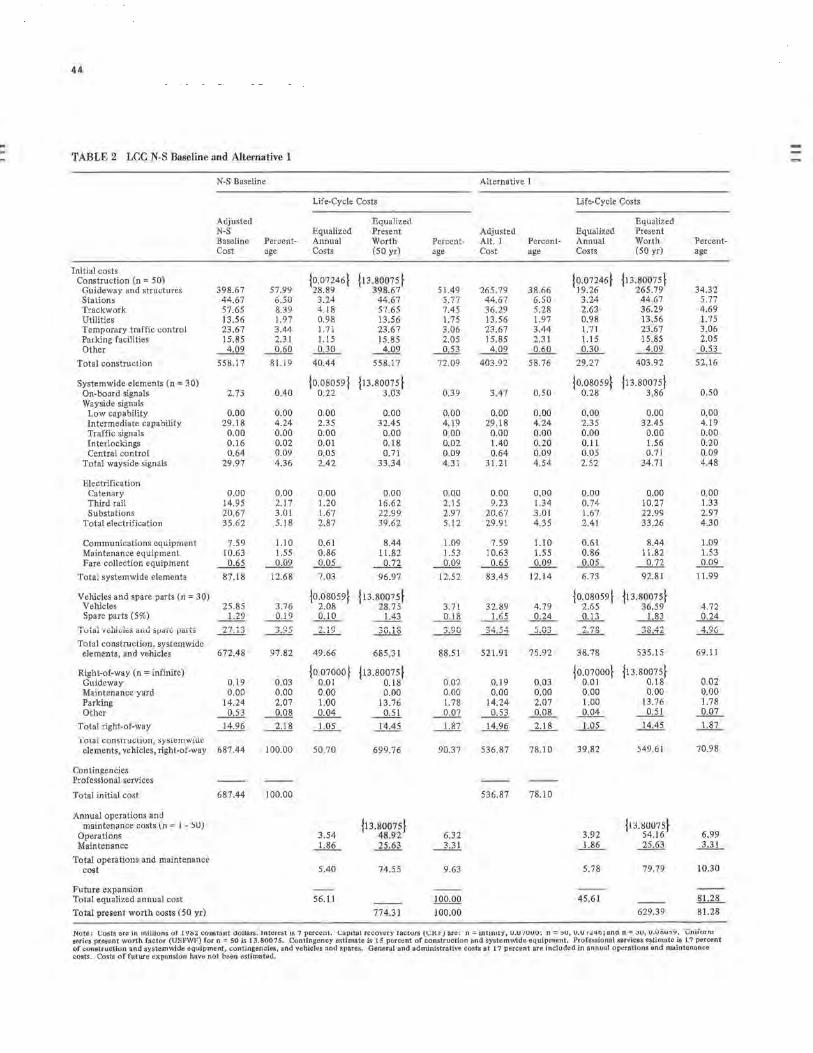
44
TABLE 2 LCC N-S Baseline and Alternative 1
N-S Baseline Alternative 1
Life-Cycle Costs Life-Cycle Costs
Adjusted Equalized Equalized N-S Equalized Present Adjusted Equalized Present Baseline Percent- Annual Worth Percent- Alt. 1 Percent- Annual Worth Percent-Cost age Costs (50 yr) age Cost age Costs (50 yr) age
Initial costs jo.07246f jB.80075 f jo.07246f j13.80075} Construction (n; 50)
Guideway and structures 398.67 57.99 28.89 398.67 51.49 265. 79 38.66 19.26 265 . 79 34.32 Staiions 44.67 6.50 3.24 44.67 5.77 44.67 6.50 :J . .l.<t 44.67 J, / I
Trackwork 57.65 8.39 4.18 57.65 7.45 36.29 5.28 2.63 36.29 4.69 Utilities 13.56 1.97 0.98 13.56 1.75 13.56 1.97 0.98 13.56 1.75 Temporary traffic control 23.67 3.44 1.71 23.67 3.06 23.67 3.44 1. 71 23.67 3.06 Parking facilities 15.85 2.31 1.15 15.85 2.05 15.85 2.31 1.15 15.85 2.05 Other ~ ___Q,§Q __Q]Q_ 4.09 __Q,,il ~ _M.Q._ __Q]Q_ ~ .Jill_
Total construction 558.17 81.19 40.44 558.17 72.09 403.92 58.76 29.27 403.92 52.16
Systemwide elements (n; 30) {0.08059 f j13.80075 f jo.08059} jB.80075} On-board signals 2.73 0.40 0.22 3.03 0.39 3.47 0.50 0.28 3.86 0.50 Wayside signals
Low capability 0.00 0.00 0.00 0.00 0.00 0.00 0.00 0.00 0.00 0.00 Intermediate capability 29.18 4.24 2.35 32.45 4.19 29.18 4.24 2.35 32.45 4.19 Traffic signals 0.00 0.00 0.00 0.00 0.00 0.00 0.00 0.00 0.00 0.00 Inter lockings 0.16 0.02 0.01 0.18 0.02 1.40 0.20 0.11 1.56 0.20 Central control 0.64 0.09 0,05 0.71 0.09 0.64 0.09 0.05 0.71 0.09
Total wayside signals 29.97 4.36 2.42 33.34 4.31 31.21 4.54 2.52 34.71 4.48
Electrification Catenary 0.00 0.00 0.00 0.00 o.oo 0.00 0.00 0.00 0.00 0.00 Third rail 14.95 2.17 1.20 16.62 2.15 9.23 1.34 0.74 10.27 1.33 Substations 20.67 3.01 1.67 22.99 2.97 20.67 3.01 1.67 22.99 2.97
Total electrification 35.62 5.18 2.87 39.62 5.12 29.91 4.35 2.41 33.26 4.30
Communications equipment 7.59 1.10 0.61 8.44 1.09 7.59 1.10 0.61 8.44 1.09 Maintenance equipment 10.63 1.55 0.86 11.82 1.53 10.63 1.55 0.86 11.82 1.53 Fare collection equipment ~ ___Q,_Q2_ ....Q,,Qi_ __QB ........M2. ~ ....Q,Q2_ ....Q,,Qi_ __QB ....Q.Q2_
Total systemwide elements 87.18 12.68 7.03 96.97 12.52 83.45 12.14 6.73 92.81 11.99
Vehicles and spare parts (n; 30) jo.o8059f J 13.80075} Jo.08059} {13.80075} Vehicles 25.85 3.76 2.08 28. 75 3.71 32.89 4.79 2.65 36.59 4.72 Spare parts (5%) ~ __Ql2_ ....QJ.Q_ ~ ___Q,1,§_ ---1.:.§.i ....Q.11.._ ....QJ1_ ~ ....Q,1i_
,,.,_.,__, ___ ,_!_1 ____ _:I ___ •• ____ ,.._
30.i8 3.90 ,., n ,..., 'n,
lUUU VCJlll,JC.:, <11LU .:)!-)i1H:; !)dll.'.> ~ ~ ~ 2.'.!.d.'.! ~ .....!:.:..!... .......:l.2.:.: ....::!:.:.Z1L.
Total construction. systemwide elements, and vehicles 672.48 97.82 49.66 685.31 88.51 521.91 75.92 38.78 535.15 69.11
Right-of-way (n; infinite) {0.010001 jl3.80075} Jomooo} jB.80075} Guideway 0.19 0.03 0.01 0.18 0.02 0.19 0.03 0.01 0.18 0.02 Maintenance yard 0.00 0.00 0.00 0.00 0.00 0.00 0.00 0.00 0.00 0.00 Parking 14.24 2.07 1.00 13.76 1.78 14.24 2.07 1.00 13.76 1.78 Other __Q,,il ~ 0.04 _QJl __Q.Q1 ~ _Q,_QjL__ ...Q.Qi_ _QJl ....Q,,Q1_
Total right-of-way 14.96 ---1.1.§. --1.Q.L 14.45 ----1..§1 14.96 ..1.1.L --1.Q.L 14.45 ...Ll1... Tomi consuucdon, sysLemwiUe
elements, vehicles, right-of-way 687.44 100.00 50.70 699.76 90.37 536.87 78.10 39.82 549.61 70.98
Contin~encies Professional services
Total initial cost 687.44 100.00 536.87 78.10
Annual operations and j13.8007S} jB.80075} maintenance costs (n; l - ~U)
Operations 3.54 48.9"2 6.32 3.92 54.16 6.99 Maintenance ~ 25.63 ___li!_ --1&L 25.63 ..1...1L
Total operations and maintenance cost 5.40 74.55 9.63 5.78 79.79 10.30
Future expansion Total equalized annual cost 56.11 100.00 45.61 81.28
Total present worth costs (50 yr) 774 . .31 100,00 629.39 81.28
.Note: Costs are 1n millions ot l lJH2 constant ctollars. Jnterest 1s 7 percent. capital recovery !actors tCK.1' J are: n = mtmlty, u.u ,uuu; n = ~u, u.u /".l'+b; ana n = .:tu, u.u Ou:, .;. . U mform series present worth factor (USPWF) for n = 50 is 13.80075. Contingency estimate is 15 percent of construction and systemwide equipment. Professional services estimate is 17 percent of construction and systemwide equipment, contingencies, and vehicles and spares, General and administrative costs at 17 percent are included in annual operations and maintenance costs. Costs of future expansion have not been estimated.
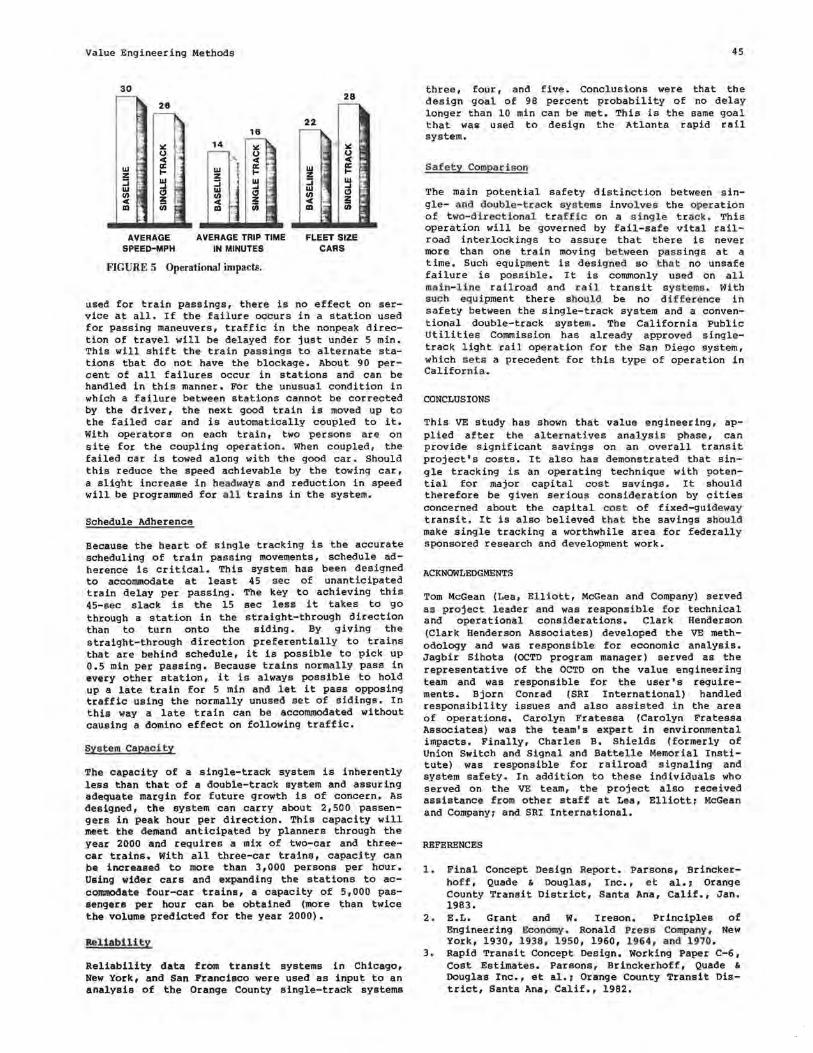
Value Engineering Methods
30 28
22 18 -
~ 14 Iii: Iii:
u 0 < ~ <
w I a: w a: z ... 3!i ...
w ::::i
J w ..I w
..I ..I w ..I Cl w Cl Cl Ill Ill ~ 3!i < 3!i < 1
3!i Ill m (/) m 1/)
AVERAGE AVERAGE TRIP TIME FLEET SIZE SPEED-MPH IN MINUTES CARS
FIGURE 5 Operational impacts.
used for train passings, there is no effect on service at all. If the failure occurs in a station used for passing maneuvers, traffic in the nonpeak direction of travel will be delayed for just under 5 min. This will shift the train passings to alternate stations that do not have the blockage. About 90 percent of all failures occur in stations and can be handled in this manner. For the unusual condition in which a failure between stations cannot be corrected by the driver, the next good train is moved up to the failed car and is automatically coupled to it. With operators on each train, two persons are on site for the coupling operation. When coupled, the failed car is towed along with the good car. Should this reduce the speed achievable by the towing car, a slight increase in headways and reduction in speed will be programmed for all trains in the system.
Schedule Adherence
Because the heart of single tracking is the accurate scheduling of train passing movements, schedule adherence is critical. This system has been designed to accommodate at least 45 sec of unanticipated train delay per passing. The key to achieving this 45-sec slack is the 15 sec less it takes to go through a station in the straight-through direction than to turn onto the siding. By giving the straight-through direction preferentially to trains that are behind schedule, it is possible to pick up 0.5 min per passing. Because trains normally pass in every other station, it is always possible to hold up a late train for 5 min and let it pass opposing traffic using the normally unused set of sidings. In this way a late train can be accommodated without causing a domino effect on following traffic.
System Capacity
The capacity of a single-track system is inherently less than that of a double-track system and assuring adequate margin for future growth is of concern. As designed, the system can carry about 2,500 passengers in peak hour per direction. This capacity will meet the demand anticipated by planners through the year 2000 and requires a mix of two-car and threecar trains. With all three-car trains, capacity can be increased to more than 3,000 persons per hour. Using wider cars and expanding the stations to accommodate four-car trains, a capacity of 5,000 passengers per hour can be obtained (more than twice the volume predicted for the year 2000).
Relia bility
Reliability data from transit systems in Chicago, New York, and San Francisco were used as input to an analysis of the Orange County single-track systems
45
three, four, and five. Conclusions were that the design goal of 98 percent probability of no delay longer than 10 min can be met. This is the same goal that was used to design the Atlanta rapid rail system.
Safety Comparison
The main potential safety distinction between single- and double-track s ystems involves the operation of t wo-dir ect iona l traffic on a sing le track, This operation will be governed by fail-safe vital railroad interlockings to assure that there is never more than one train moving between pass ings at a time. Such equipment is desig ned so that no unsafe failure is possible. It is commonly used on all main- li ne railroad and rail transit systems. With suc h equ i pment there s hould be no d ifference in safety between the single-track system and a conventional double-track system. The California Public Utilities Commission has already approved singletrack light rail operation for the San Diego system, which se t s a precedent for this type of operation in California .
CONCLUSIONS
This VE study has shown that value engineering, applied after the alternatives analysis phase, can provide significant savings on an overall transit project's costs. It also has demonstrated that single tracking is an operating technique with potential for major capital cost savings. It should therefore be given serious consideration by cities concerned about the capital cost of fixed-guideway transit. It is also believed that the savings should make single tracking a worthwhile area for federally sponsored research and development work.
ACKNOWLEDGMENTS
Tom McGean (Lea, Elliott, McGean and Company) served as project leader and was responsible for technical and operational considerations. Clark Henderson (Clark Henderson Associates) developed the VE methodology and was responsible for economic analysis. Jagbir Sihota (OCTD program manager) served as the representative of the OCTD on the value engineering team and was responsible for the user's requirements. Bjorn Conrad (SRI International) handled responsibility issues and also assisted in the area of operations. Carolyn Fratessa (Carolyn Fratessa Associates) was the team's expert in environmental impacts, Finally, Charles B. Shields (formerly of Union Switch and Signal and Battelle Memorial Institute) was responsible for railroad signaling and system safety. In addition to these individuals who served on the VE team, the project also received assistance from other staff at Lea, Elliotti McGean and Company7 and SRI International.
REFERENCES
1. Final Concept Design Report. Parsons, Brinckerhoff, Quade & Douglas, Inc., et al.7 Orange County Transit District, Santa Ana, Calif., Jan. 1983,
2. E.L. Grant and w. Ireson. Principles of Engineering Economy. Ronald Press Company, New York, 1930, 1938, 1 950, 1960, 1964, and 1970.
3. Rapid Transit Concept Design. Working Paper C-6, Cost Estimates. Parsons, Brinckerhoff, Quade & Douglas Inc., et al.: Orange County Transit District, Santa Ana, Calif., 1982.
Value of Light Rail lransit as a Major Capital Investment E. L. Tennyson Vienna, Virginia
Most current urban public mass transit projects are funded primarily with federal aid furnished by the Congress through the Urban Mass Transportation Administration of the U.S. Department of Transportation, A local contribution of 25 percent or more is required to qualify under the law.
The success of most existinq light rail systems in retaining patronage (.)J and the success of new systems in generating it (2) have multiplied applications for funding new light rail systems. At the same time, traffic congestion, air pollution problems, and ever-higher costs of moving people by bus have brought similar demands for extensive, expensive subway and aerial transit systems in addition to plans for the light rail type (3). There are applications and pending applications - for $19 billion for such projects. Clearly, there is no way that Congress can fund so many projects simultaneously unless it revises its budget priorities away from anything currently contemplated.
To avoid holding good, valid, and necessary projects too long, while they wait their turn behind previously filed applications for less urgent or too expensive projects, the Urban Mass Transportation Administration has expanded its past policy statements to include a new (May 1984) policy statement on new major urban capital investment policies (i).
There is much logic behind the new policy. It seeks to prefer projects that produce the greatest benefits per dollar invested. Such a policy is both sound and rational. The input criteria are also well chosen. The new incremental capital investment, the .-.aM ;-,..,-aman~:11, npor:i,~;n,, ~("\~~~- ana the Ur\)11~ nf travel time saved are all to be evaluated to determine the net annual economic benefit, if any, that will result from implementation of a proposed project.
The dollar figure thus determined is then to be divided by the incremental gain (if any) in passen')Prs r.nrriPn t.n dP.termine the net annual cost per passenger. This is neither as logical as it may first appear nor as equitable as was intended.
The numerator is a function of the size (or length) of the project. A longer line or route, other things being equal, will have higher capital and operating costs than will a shorter project. The denominator, however, bears little relationship to the length of the line or route. As the gravity
with the square of the distance traveled. With the denominator determined by the net increase in passengers, there is a real mathematical possibility that the rating index, or net cost per added pas-
46
senger, could rocket toward infinity despite the possibility that the project might both be the least costly way to move riders in the corridor under analysis and have low per unit construction costs.
A short downtown people-mover to scurry people a round on their lunch hour will almost always rate higher than typical line-haul facilities simply because there are fewer miles to pay for. A line-haul facility may be absolutely necessary to bring people to the central business district for work trips or shopping at reasonable operating costs, in reasonable time, and without undue congestion. However, the UMTA rating system, as first devised, will seldom recognize that fact as long as any short downtown people-movers are in the competition for funds.
It is at this point that light rail projects, of one particular type, can gain high ratings from the proposed rating criteria. In Buffalo, Calgary, San Diego, San Jose, and Sacramento (and perhaps Portland), the light rail projects not only serve, or will serve, the longer haul or trunk radial movements but will also serve as downtown circulators (people-movers) with short-trip fares and closely spaced stations r iqht on the street to attract the sh6rt, more discretionary trips. This considerably increases the number of passengers to be carried without adding much to the cost of operation or construction. The same seat can be sold twice on the same trip. To the extent that the rating criteria force designers to accommodate short downtown trips on the trunk facility, this may be a good and valuable incentive to lower the cost per passenger, but it makes no more sense to equate a short downtown trip to a longer suburban trip than it would for Greyhound or Trailways (or Amtrak) to have a flat fare for any length of trip, such as the Post Office does with first class mail within the United States. Clearly and obviously, passenger-miles, not passengers, must be the denominator in this equation for rating projects if equity is to prevail.
An example may help illustrate this principle. On the basis of recent experience in several cities, a light rail line (without subway) 7 mi long may cost $150 million to design and construct. Based on UMTA's published examples (5) this may well be equivalent to $9 million per year. Annual operating costs may be $2 million less than continued surface bus service over the same route because of the larger, faster vehicles with greater labor productivity. It is possible that 3 million additional passengers per year might be attracted. Travel time savings could approximate 1 million passenger-hours worth $4 million per year (~,p.39). The cost-effectiveness index
Light Rail Transit as a Major Capital Investment
would then be $9 million, less $2 million operating savings, less $4 million in time savings, divided by 3 million additional passengers. The result is $1. A $1 rating places it extremely high on UMTA's list of examples. It implies that the imaginary light rail project will not have as much net cost as do most other projects.
If a downtown people-mover is proposed for the same city, or a competing city, it may typically be a 2-mi loop that will cost two and one-half times as much per mile as the longer light rail line, or $100 million in the aggregate. Annual operating costs may be $2 million per year, but few savings will result because most line-haul bus (or light rail) lines must continue to operate full schedules connecting suburban areas with downtown. The time savings may aggregate 250,000 hr, enjoyed by 3 million annual passengers, 2 million of whom are new riders making short discretionary trips that were previously made on foot or not made in the central business district (CBD). The cost-effectiveness index would be $6 million, plus $2 million added operating cost, less $1 million time saving, divided by 3 million annual passengers. The result is $2.33. Although this is not as favorable as the typical light rail example given previously, it is far more favorable than several of the initial project ratings announced by UMTA (_~).
If passenger-miles were used instead of passengers to reflect work actually performed, the results would be quite different. Instead of the hypothetical 3 million passengers, the light rail example would add 12 million passenger-miles, again using typical data. The cost-effectiveness index would drop to $0.25.
The typical people-mover, a 2-mi loop, would probably average 1 mi per passenger, so the costeffectiveness index would remain at $2.33. The relative rating of the two projects would change by a factor of 4, $0.25 versus $2.33 instead of $1 versus $2.33. In many, perhaps most, cases, this would make a great difference in the relative ranking of the projects seeking assistance.
Although the quantitative values assigned to the two cases just described are hypothetical, they are quite close to the real-time experience in Calgary, Detroit, Edmonton, and Shaker Heights.
CAPITAL INVESTMENT
The most important value in the numerator of the cost-effectiveness equation is the net capital investment in the preferred alternative compared with the next best alternative. Light rail, when judiciously applied, may have several attributes that could qualify it for a favorable comparison on the basis of net investment.
Compared with other types of fixed guideway, the construction of an electric railroad, by itself, is not particularly capital intensive. In 1982-1983 the Deseret Western Railroad was built over a distance of 35 mi between Colorado and Utah for $70 million excluding nonrail aspects of the project. The first cost of $2 million per track-mile included grading rough terrain, all aspects of track construction for heavy loads, and electrification. Neither stations nor signals were provided (7).
It is most unlikely that"°any other form of exclusive right-of-way for transit could be built for much less, less future salvage value, if equal life span is required. The new Houston busways are estimated to cost nearly $7 million per mile and will not have stations or signalling. The Martin Luther King, Jr., busway in Pittsburgh cost $120 million for 7 mi but included nondowntown stations and a
47
railroad relocation that cost approximately $14 million. Conversely, without the railroad, there would have been no available right-of-way. The point is that when busways cost from $7 million to $15 million per mile, a light rail project has the possibility of being less capital intensive for the same alignment and carrying capacity.
If a light rail project relies heavily on subway, the investment will be much higher, but light rail can reduce the amount of subway required as was done in Buffalo where the selection of light rail permitted the elimination of subway in the downtown area and thus reduced cost without the sacrifice of travel time savings or operating efficiency.
Application of the UMTA cost-effectiveness index could result in a negative net cost for a light rail project because rail rapid transit or a busway could be more capital intensive and less economical to operate. It appears that the UMTA criteria might well favor well-designed light rail projects where capital investment is the most significant element in the choice.
Where the baseline alternative to light rail is existing bus service with no right-of-way investment, but constrained by traffic congestion, the operating and travel time savings made possible by a preferred light rail right-of-way can go a long way toward amortizing the required investment.
OPERATING COSTS
In UMTA's Third Annual Section 15 Report on National Urban Mass Transportation Statistics, it was a light rail operation that was recorded with the lowest cost per passenger-mile (8¢) of any transit operation in the United States (_!!,Table 3.19.4,p.3-252), including small, nonunion bus operations in which the manager might also drive a peak-hour bus.
Light rail can offer the potential for the lowest operating cost per passenger, per passenger-mile, and per capita for a given volume of travel in a properly selected corridor of travel. Light rail may never offer the lowest cost per vehicle-hour or per vehicle so it becomes critical that light rail installations be limited to routes on which the vehicles will be well utilized by passengers. Token services for civic purposes, but lacking in sufficient ridership, will seldom be viable light rail applications.
Light rail costs per vehicle-hour may well average 20 percent higher than similar bus costs because of track and signal maintenance costs. Busways may also experience these costs, but, as yet, no bus statistics are known to include them. In Pittsburgh busway maintenance is, to some degree, performed by light rail employees without differentiation in terms of where the work was done. Even so, with bus costs in major cities averaging $45 per hour undei favorable circumstances (~), it is unlikely that light rail costs will ever be less than $54 per car-hour for four-axle cars. With articulated cars, as with articulated buses, the costs will be higher. With 50 percent more trucks and axles, and 100 percent more body sections, it is likely and often the case that articulated light rail vehicles will cost $81 per hour to operate and maintain (10).
The UMTA criteria do not look to cost per vehicle-hour, and, quite rightly, they should not. It is the work output of the vehicle that will determine how many vehicles are needed and how much total operating cost will be incurred.
Light rail cars are often 25 percent larger than are either single or articulated buses. Where clearances permit, they may be much larger. Size is best measured by square feet of passenger-carrying space.
48
The Buffalo car is more than over 50 percent larger (11,12,p.54). As a result the number of passengers c'irried per hour can be much higher than it is for bus vehicles. Speed is equally important in this consideration when local service is provided, but, on the basis of size alone, a nonarticulated light rail car is likely to produce more than 90 passengers per hour with the typical route length and loading standards. A standard 40-ft bus, loaded to the same relative ~tandard, will produce 70 passengers per vehicle-hour. The cost per passenger, then, is 59.3¢ on light rail and 64.3¢ by bus. If the base fare is 75¢, with a 15 percent discount for weekly or monthly passes, transfers, and 50 percent off for off-peak senior citizens, the light rail vehicle offers the possibility of an operating profit of 4. 4¢' per passenger whereas a bus under the same circumstances would lose 0.6¢. This figure is not as hypothetical as might be assumed. It is quite realistic. A corridor worthy of light rail service will usually enjoy above average bus ridership. The average bus 1 ine may not cover half of its cost from fares, but buses on good routes can do much better than average.
Operating speed also affects economic results. The use of reserved or off-street rights-of-way for transit vehicles permits higher schedule speeds. With 18 mph typical of improved, yet modest, schedule speed, the cost per vehicle-mile, based on $54 per hour for light rail, will be $3.00. Bus cost on the street, in traffic, will be $3. 75 per bus-mile at the usual average of 12 mph. (If the bus is put on off-street right-of-way, its cost does not decline as does that of light rail because a new cost is encountered: maintenance of right-of-way that is already part of light rail's cost base.) It is mileage, not hours, that passengers wish to buy. They want to get from here to there in miles. They do not wish to amass hours of travel time. It is not unusual for light rail transit to far exceed 18 mph, given ideal rights-of-way, such as in Buffalo or in Shaker Heights where schedule speeds of more than 20 mph are achieved. The San Diego Trolley, with center city street operation and outlying private right-ofway, u.""'h:~v.::. ... 21 mph with great reliability .. The Pittsburgh East Bu sway Route EBA averages 17 mph schedule speed under similar conditions (13). In each case recovery time is included. ~
The purpose of any transit service is to move people over distances as quickly and safely as possible within reasonable cost. The unit of work output is the passenger-mile. Using the previous example concerning the cost per passenger, disregarding
distance included, the cost per passenger-mile of typical light rail transit operation is 10¢ ($54 per hour+ 18 mph x 12 mi per round trip+ 91 passengers + 4 mi/passenger).
Again using typical bus data the bus cost on local streets will be 16¢ per passenger-mile. Here, in the real world, the street bu~ re~uires 60 pPrcent more cost per passenger-mile (or per passenger). With the bus on exclusive right-of-way, that cost will fall to some degree, but the heavy cost of obtaining and maintaining the right-of-way must be introduced.
Where light rail must use urban streets to reach downtown because no feasible right-of-way is available, it will not enjoy the low cost of 10¢ per pas-
rather than at the curb, with safety islands for passenger loading, the speed will fall to 12 or 13 mph. In the very heart of the CBD it will fall to 9 mph (!!). The cost per vehicle-mile will rise to $4.32 and the resulting cost per passenger-mile will rise to 14. 9¢, 50 percent higher than on the pre-
TRB State-of-the-Art Report 2
ferred right-of-way. It is nevertheless still below the 16¢ per passenger-mile cost of the city bus, by 1.1¢ per passenger-mile and 4.4¢ per passenger.
It must be remembered that these examples will not hold true if the vehicles are not loaded to the standard conditions. Under light vehicle loads, light rail will not demonstrate cost-effectiveness. Total line volume is not an issue. It is almost irrelevant, as long as sufficient volume exists to fill the vehicles. The key is individual car or vehicle loadings. It is the cost per passenger-mile and the time saving that justify light rail investment, not gross volume.
It appears, under proper circumstances, that UMTA' s criteria for cost effectiveness will favor light rail transit in likely applications insofar as operating costs are concerned.
TIME SAVINGS
The third element in the numerator of UMTA' s costeffectiveness index is the value of time saved. Most studies and actual experience find that time saving is an essential element of both patronage attract ion and cost containment. Many authorities believe that time saving is the most important element in attracting transit riders.
To be employed in a cost-effectiveness index, the time saved must have a realistic dollar value. Many regional transportation studies have found that travel decisions are based on 6¢ per minute (1984) for the average traveler. Other studies have found that travelers value time saved at $4 per hour for work trips and $3 for nonwork trips. With transit catering to work trips for 80 percent of all transit trips, and other trips for but 20 percent, the average value for transit is $3.80 per person-hour, or 6.3¢ per minute saved (_§_,p.39:..!!).
Although exclusive or even reserved rights-of-way may be capital intensive, obtaining time savings that attract passengers is valuable because it has the effect of reducing congestion and pollution while increasing transit revenues and reducing opera ting e:,,,:pense.. 'flho~o pnc:d .. ~ 1'0. ";:111 llA~ - if prege,nt; can more than compensate for the capital investment.
Increasing transit speed from 12 mph on the street to 18 mph on a typical light rail alignment, including reserved-lane operation, private right-of-way, and perhaps some railroad alignment, has as a corollary that the average passenger will be saving 6. 7 min on the typical 4-mi urban trip. Where urban congestion reduces street bus speed to 4 or 5 mph in the heart of the CBD. the saving will be much qreater with light rail, but late at night the saving may be much less. There are few passengers late at night, however.
Although there may be no typical light rail operation, it is not unusual for a light rail route to carry 20,000 passengers per weekday, or 6 million ppr year. r.algary sP.rves more, but San Diego serves fewer. With 6 million passengers saving 6.7 min each at 6.3¢ per minute, the annual saving to be included in the numerator of the cost-effectiveness index is $2,532,600. This value of time saved may well exceed any reasonable value of operating cost saved and thus become a significant factor in the formula determining the cost-effectiveness index. This has an unfortunate aspect because time savings do not produce cash to amortize the investment or to offset operating cost. Time savings must be included, however, as long as highway studies use the same time savings to justify billions of dollars in new highway projects, some of which might be more economical and useful if developed as urban transit projects. Quite frequently, light rail projects do save tran-
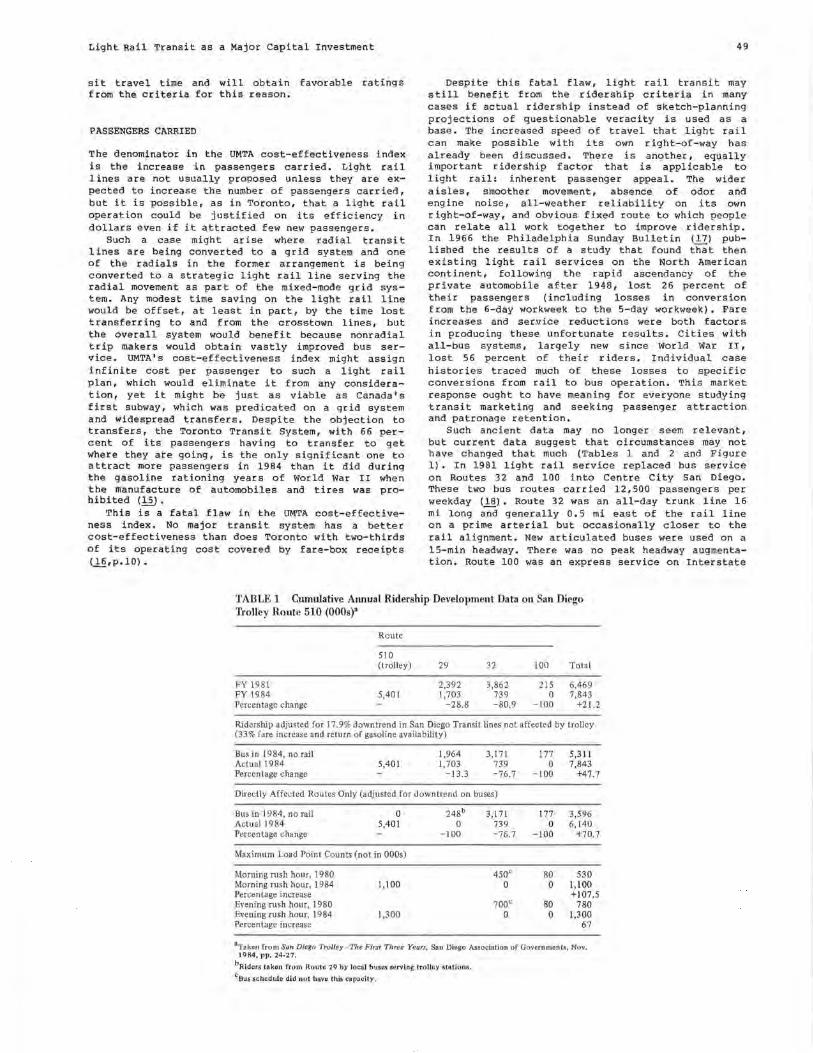
Light Rail Transit as a Major Capital Investment
sit travel time and will obtain favorable ratings from the criteria for this reason.
PASSENGERS CARRIED
The denominator in the UMTA cost-effectiveness index is the increase in passengers carried. Light rail 1 ines are not usually proposed unless they are expected to increase the number of passengers carried, but it is possible, as in Toronto, that a light rail operation could be justified on its efficiency in dollars even if it attracted few new passengers.
Such a case might arise where radial transit lines are being converted to a grid system and one of the radials in the former arrangement is being converted to a strategic light rail line serving the radial movement as part of the mixed-mode grid system. Any modest time saving on the light rail line would be offset, at least in part, by the time lost transferring to and from the crosstown lines, but the overall system would benefit because nonradial trip makers would obtain vastly improved bus service. UMTA' s cost-effectiveness index might assign infinite cost per passenger to such a light rail plan, which would eliminate it from any consideration, yet it might be just as viable as Canada's first subway, which was predicated on a grid system and widespread transfers. Despite the objection to transfers, the Toronto Transit System, with 66 perc ent of its passengers having to transfer to get where they are going, is the only significant one to attract more passengers in 1984 than it did during the gasoline rationing years of world War II when the manufacture of automobiles and tires was prohibited (£).
This is a fatal flaw in the UMTA cost-effectiveness index. No major transit system has a better cost-effectiveness than does Toronto with two-thirds of its operating cost covered by fare-box receipts (.l§,p.10).
49
Despite this fatal flaw, light rail trans it may still benefit from the ridership criteria in many cases if actual ridership instead of sketch-planning projections of questionable veracity is used as a base. The increased speed of travel that light rail can make possible with its own right-of-way has already been discussed, There is another, equally important ridership factor that is applicable to light rail: inherent passenger appeal. The wider aisles, smoother movement, absence of odor and engine noise, all-wea ther reliability on its own right-of-way, and obvious fixed route to which people can relate all work together to improve ridership. In 1966 the Philadelphia Sunday Bulletin (17) published the results of a study that found that then existing light rail services on the North American continent, following the rapid ascendancy of the private automobile after 1948, lost 26 percent of their passengers (including losses in conversion from the 6-day workweek to the 5-day workweek). Fare increases and service reductions were both factors in producing these unfortunate results. Cities with all-bus systems, largely new since World War II, lost 56 percent of their riders. Individual case histories traced much of these losses to specific conversions from rail to bus operation. This market response ought to have meaning for everyone studying transit marketing and seeking passenger attraction and patronage retention.
Such ancient data may no longer seem relevant, but current data suggest that circumstances may not have changed that much (Tables 1 and 2 and Figure 1). In 1981 light rail service replaced bus service on Routes 32 and 100 into Centre City San Diego. These two bus routes carried 12,500 passengers per weekday (18). Route 32 was an all-day trunk line 16 mi long and generally 0.5 mi east of the rail line on a prime arterial but occasionally closer to the rail alignment. New articulated buses were used on a 15-min headway. There was no peak headway augmentation. Route 100 was an express service on Interstate
TABLE 1 Cumulative Annual Ridership Development Data on San Diego Trolley Route 510 (OOOs )"
Route
510 (trolley) 29 32 JOO Total
FY 1981 2,392 3,862 215 6,469 FY!984 5,401 1,703 739 0 7,843 Percentage change -28.8 -80.9 -100 +21.2
Ridership adjusted for 17 .9% downtrend in San Diego Transit lines not affected by trolley (33% fare increase and return of gasoline availability)
Bus in l 984, no rail 1,964 3,171 177 5,3 11 Actual 1984 5,401 1,703 739 0 7,843 Percentage change -13.3 -76.7 -100 +47 .7
Directly Affected Routes Only (adjusted for downtrend on buses)
Bus in 1984, no rail 0 248b 3,171 177 3,596 Actual 1984 5,401 0 739 0 6,140 Percentage change -100 -76.7 - 100 +70.7
Maximum Load Point Counts (not in OOOs)
Morning rush hour, 1980 450° 80 530 Morning rush hour, 1984 l ,100 0 0 1,100 Percentage increase +107.5 Evening rush hour, 1980 700c 80 780 Evening rush hour, 1984 1,300 0 0 1,300 Percentage increase 67
aTaken from San Diego Trolley-The First Three Years, San Diego Association of Governments, Nov. !9 84, pp. 24-27.
bRidcrs taken from Route 29 by local buses serving trolley stations.
cBus schedule did not have this capacity.
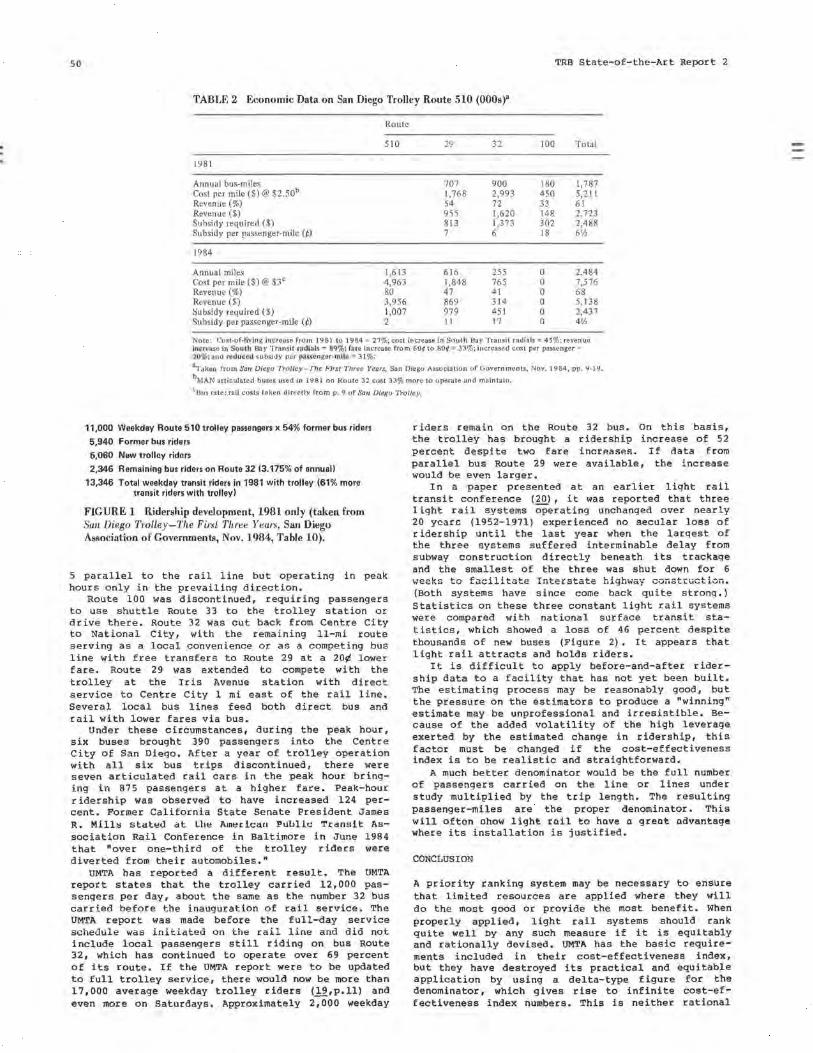
:
50 TRB State-of-the-Art Report 2
TABLE 2 Economic Data on San Diego Trolley Route 510 (OOOs)"
Route
510 29 32 100 Total
1981
Annual bus-miles 707 900 180 1,787 Cost per mile($)@ $2.50b 1,768 2,993 450 5,211 Revenue(%) 54 72 33 61 Revenue($) 955 1,620 148 2,723 Subsidy required($) 813 1,373 302 2,488 Subsidy per passenger-mile({) 7 6 18 6Y,
1984
Annual miles 1,613 616 255 0 2,484 Cost per mile($)@ $3c 4,963 1,848 765 0 7,576 Revenue(%) 80 47 41 0 68 Revenue($) 3,956 869 314 0 5,138 Subsidy required($) 1,007 979 451 0 2,437 Subsidy per passenger-mile ({) 2 11 17 0 4Y,
Note: Cost-of-Jiving increase from 1981 to 1984 = 21%; cost increase in South Bay Transit radials; 45%; revenue lnc.n:ase in South Bay Transit rndl11ls = 89%~ ftue increase from 60¢ to 80¢ = 33%; increased cosl per passenger= ~0%:and rl.idt1c11d subsidy per p:1 senger-m.lla ~ 31%; 8Taken from San Diego Trolley-T11e First Three Years, San Diego Association of Governments, Nov. 1984, pp. 9-19.
bMAN articulated buses used in 1981 on Route 32 cost 33% more to operate and maintain.
cBus rate; rail costs taken directJy from p. 9 of San Diego Trolley.
11,000 Weekday Route 510 trolley passengers x 54% former bus riders 5,940 Former bus riders 6,060 New trolley riders 2,346 Remaining bus riders on Route 32 (3.175% of annual)
13,346 Total weekday transit riders in 1981 with trolley (61% more transit riders with trolley)
FIGURE 1 Ridership development, 1981 only (taken from San Diego T,olley--The Firsl T/11·ee Years, San Diego Association of Governments, Nov. 1984, Table 10).
5 parallel to the rail line but operating in peak hours only in the prevailing direction.
Route 100 was discontinued, requiring passengers to use shuttle Route 33 to the trolley station or drive there. Route 32 was cut back from Centre City to National City, with the remaining 11-mi route serving as a local convenience or as a competing bus line with free transfers to Route 29 at a 20¢ lower fare. Route 29 was extended to compete with the trolley at the Iris Avenue station with direct service to Centre City 1 mi east of the rail line. Several local bus lines feed both direct bus and rail with lower fares via bus.
Under these circumstances, during the peak hour, six buses brought 390 passengers into the Centre City of San Diego. After a year of trolley operation with all six bus trips discontinued, there were seven articulated rail cars in the peak hour bringing in 875 passengers at a higher fare. Peak-hour ridership was observed to have increased 124 percent. Former California State Senate President James R. Mlll>,i Slctlt!cl at Lhe Amt!dcctn Public Transit Association Rail Conference in Baltimore in June 1984 that "over one-third of the trolley riders were diverted from their automobiles.•
UMTA has reported a different result. The UMTA report states that the trolley carried 12,000 passengers per day, about the same as the number 32 bus carried before the inauguration of rail service , The UMTA report was made before the full-day service schedule was initiated Ori the rail line and did not include local passengers still riding on bus Route 32, which has continued to operate over 69 percent of its route. If the UMTA report were to be updated to full trolley service, there would now be more than 17,000 average weekday trolley riders (19,p.ll} and even more on Saturdays. Approximately 2,000 weekday
riders remain on the Route 32 bus. On this basis, the trolley has brought a ridership increase of 52 percent despite two fare increases. If ilata from parallel bus Route 29 were available, the increase would be even larger.
In a paper presented at an earlier light rail transit conference (20), it was reported that three light rail systems operating unchanged over nearly 20 ycaro (1952-1971) experienced no secular loss of ridership until the last year when the largest of the three systems suffered interminable delay from subway construction directly beneath its trackage and the smallest of the three was shut down for 6 weeks to facilitate Interstate highway construction. (Both systems have since come back quite strong.) Statistics on these three constant light rail systems were compared with national surface transit statistics, which showed a loss of 46 percent despite thousands of new buses (Figure 2). It appears that light rail attracts and holds riders.
It is difficult to apply before-and-after ridership data to a facility that has not yet been built. The estimating process may be reasonably good, but the pressure on the estimators to produce a "winning" estimate may be unprofessional and irresistible. Because of the added volatility of the high leverage exerted by the estimated change in ridership, this factor must be changed if the cost-effectiveness index is to be realistic and straightforward.
A much better denominator would be the full number of passengers carried on the line or lines under study multiplied by the trip length. The resulting passenger-miles are the proper denominator. This will often ohow light rail to have a great advantage where its installation is justified.
CONCLUSION
A priority ranking system may be necessary to ensure that limited resources are applied where they will do the most good or provide the most benefit. When properly applied, light rail systems should rank quite well by any such measure if it is equitably and rationally devised. UMTA has the basic requirements included in their cost-effectiveness index, but they have destroyed its practical and equitable application by using a delta-type figure for the denominator, which gives rise to infinite cost-effectiveness index numbers. This is neither rational
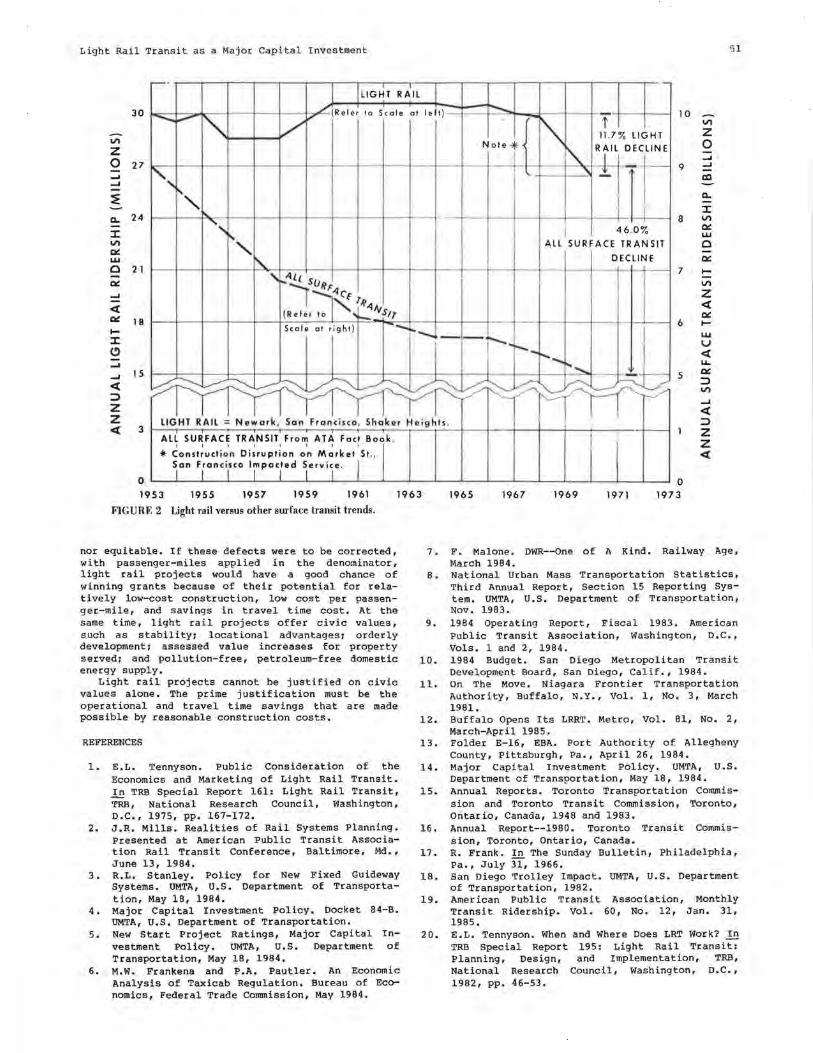
Light Rail Transit as a Major Capital Investment 51
~ - ..---r---.----,,---~--.---.---.----r,--., - --,--~--r-- -.----,.....---,---r---.---~ -LIGHT RAIL
VI
z 0 .... ....
30 10 --........- i"'- /' /(Refer to Scale at left) --- ~ {-~ T .,._-+--r I '\ 11.7% LIGHT
i.-~1---1--- 1--- t---1---+--+--+---+--+--+---+-- -+N-o_t_e -1*,_ " Rf' L D ~~ ~ 9 --~ dI VI
z 0 .... ....
ll.
::c VI 0:: w C 0:: ....
24
21
--t--+------t-t--+-l -µ ;;.- 8
ALL SURFACE TRANSIT
DECLINE 7
ll.
::c VI 0:: w C 0::
to
VI
18 Scale at right) --, ..........
6
z < 0:: to-
w u
.... .... < t... 0:: ::> VI ....
< ::> z z < 3
LIGHT RAIL = Newark , Son froncisco , Shaker He ig hts . < ::> z z <
0
ALL SURFACE TRANSIT From ATA Fact Book . I I f I I I I I * Constructio n Disruption on Market St.,
Son Francisco Impacted Service.
1953 1955 1957 1959 1961 1963 1965 1967 1969 1971 0
1973
FIGURE 2 Light rail versus other surface transit trends.
nor equitable. If these defects were to be corrected, with passenger-miles applied in the denominator, light rail projects would have a good chance of winning grants because of their potential for relatively low-cost construction, low cost per passenger-mile, and savings in travel time cost. At the same time, light rail projects offer civic values, such as stability: locational advantages: orderly development: assessed value increases for property served: and pollution-free, petroleum-free domestic energy supply.
Light rail projects cannot be justified on c1v1c values alone. The prime justification must be the operational and travel time savings that are made possible by reasonable construction costs.
REFERENCES
1. E.L. Tennyson. Public Consideration of the Economics and Marketing of Light Rail Transit. .!.!! TRB Special Report 161: Light Rail Transit, TRB, National Research Council, Washington, D.C., 1975, pp. 167-172.
2. J.R. Mills. Realities of Rail Systems Planning. Presented at American Public Transit Association Rail Transit Conference, Baltimore, Md., June 13, 1984.
3. R.L. Stanley. Policy for New Fixed Guideway Systems. UMTA, U.S. Department of Transportation, May 18, 1984.
4. Major Capital Investment Policy. Docket 84-B. UMTA, u.s. Department of Transportation.
5. New Start Project Ratings, Major Capital Investment Policy. UMTA, u.s. Department of Transportation, May 18, 1984.
6. M.W. Frankena and P.A. Pautler. An Economic Analysis of Taxicab Regulation. Bureau of Economics, Federal Trade Cormnission, May 1984.
7. F. Malone. DWR--One of A Kind. Railway Age, March 1984 .
8. National Urban Mass Transportation Statistics, Third Annual Report, Section 15 Reporting System. UMTA, u.s. Department of Transportation, Nov. 1983.
9. 1984 Operating Report, Fiscal 1983. American Public Transit Association, Washington, D.C., Vols. 1 and 2, 1984.
10. 1984 Budget. San Diego Metropolitan Transit Development Board, San Diego, Calif., 1984.
11. on The Move. Niagara Frontier Transportation Authority, Buffalo, N.Y., Vol. 1, No. 3, March 1981.
12. Buffalo Opens Its LRRT. Metro, Vol. 81, No. 2, March-April 1985.
13. Folder E-16, EBA. Port Authority of Allegheny County, Pittsburgh, Pa., April 26, 1984.
14. Major Capital Investment Policy. UMTA, U.S. Department of Transportation, May 18, 1984.
15. Annual Reports. Toronto Transportation Commission and Toronto Transit Commission, Toronto, Ontario, Canada, 1948 and 1983.
16. Annual Report--1980. Toronto Transit Commission, Toronto, Ontario, Canada.
17. R. Frank. In The Sunday Bulletin, Philadelphia, Pa., July 31, 1966.
18. San Diego Trolley Impact. UMTA, u.s. Department of Transportation, 1982.
19. American Public Transit Association, Monthly Transit Ridership. Vol. 60, No. 12, Jan. 31, 1985.
20. E.L. Tennyson. When and Where Does LRT Work?.!!! TRB Special Report 195: Light Rail Transit: Planning, Design, and Implementation, TRB, National Research Council, Washington, D.C., 1982, pp. 46-53.
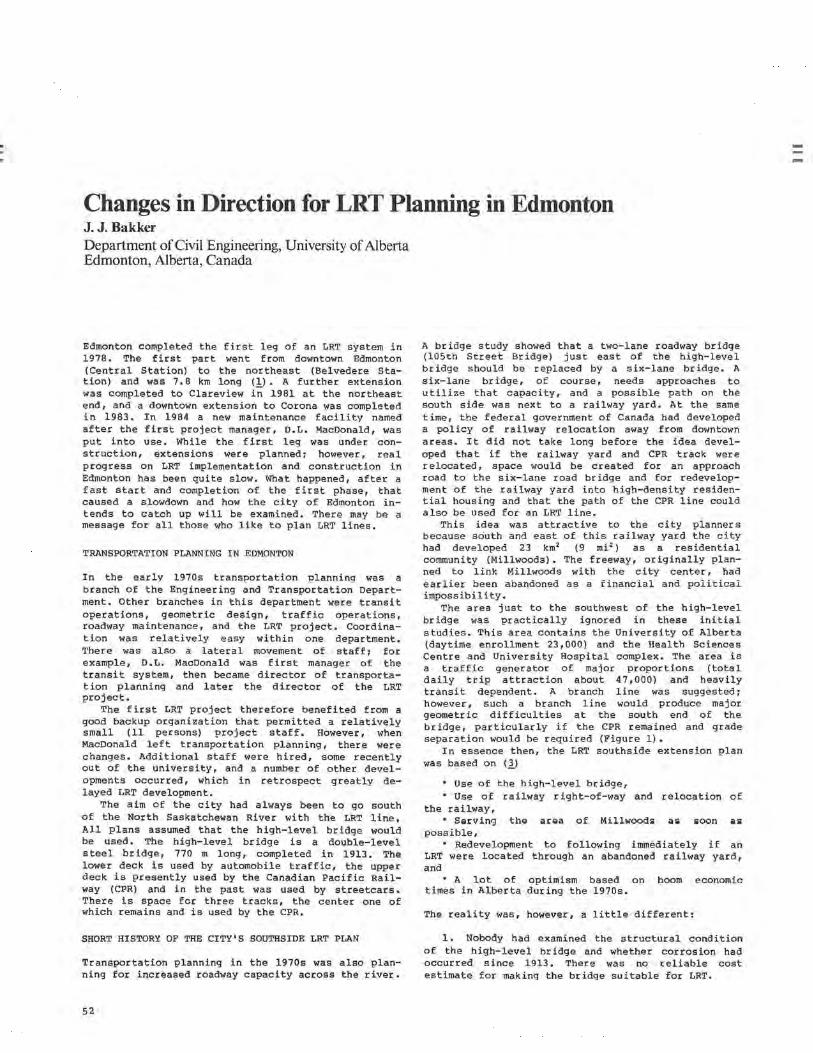
Changes in Direction for LRT Planning in Edmonton J.J. Bakker Department of Civil Engineering, University of Alberta Edmonton, Alberta, Canada
Edmonton completed the first leg of an LRT system in 1978. The first part went from downtown Edmonton (Central Station) to the northeast (Belvedere Station) and was 7. 8 km long (!.) • A further extension was completed to Clareview in 1981 at the northeast end, and a downtown extension to Corona was completed in 1983. In 1984 a new maintenance facility named after the first project manager, D.L. MacDonald, was put into use. While the first leg was under construction, extensions were planned; however, real progress on LRT implementation and construction in Edmonton has been quite slow. What happened, after a fast start and completion of the first phase, that caused a slowdown and how the city of Edmonton intends to catch up will be examined. There may be a message for all those who like to plan LRT lines.
TRANSPORTATION PLANNING IN EDMONTON
In the early 1970s transportation planning was a branch of the Engineering and Transportation Department. Other branches in this department were transit operations, geometric design, traffic operations, roadway maintenance, and the LRT project. Coordination was relatively easy within one department. There was also a lateral movement of staff; for example, D.L. MacDonald was first manager of the transit system, then became director of transportation planning and later the director of the LRT project.
The first LRT project therefore benefited from a good backup organization that permitted a relatively small (11 persons) project staff. However, when MacDonald left transportation planning, there were changes. Additional staff were hired, some recently out of the university, and a number of other developments occurred, which in retrospect greatly delayed LRT development.
The aim of the city had always been to go south of the North Saskatchewan River with the LRT line, All plans assumed that the high-level bridge would be used. The high-level bridge is a double-level steel bridge, 770 m long, completed in 1913. The lower deck is used by automobile traffic, the upper deck is presently used by the Canadian Pacific Railway {CPR) and in the past was used by streetcars. There is space for three tracks, the center one of which remains and is used by the CPR.
SHORT HISTORY OF THE CITY'S SOUTHSIDE LRT PLAN
Transportation planning in the 1970s was also planning for increased roadway capacity across the river.
52
A bridge study showed that a two-lane roadway bridge (105th Street Bridge; just east of the nign-1-evel bridge should be replaced by a six-lane bridge. A six-lane bridge, of course, needs approaches to utilize that capacity, and a possible path on the south side was next to a railway yard. At the same time, the federal government of Canada had developed a policy of railway relocation away from downtown areas. It did not take long before the idea developed that if the railway yard and CPR track were relocated, space would be created for an approach road to the six-lane road bridge and for redevelopment of the railway yard into high-density residential housing and that the path of the CPR line could also be used for an LRT line.
This idea was attractive to the city planners because south and east of this railway yard the city had developed 23 km 2 (9 mi 2 ) as a residential community (Millwoods). The freeway, originally planned to link Millwoods with the city center, had earlier been abandoned as a financial and political impossibility.
The area just to the southwest of the high-level bridge was practically ignored in these initial studies. This area contains the University of Alberta (daytime enrollment 23,000) and the Health Sciences Centre and University Hospital complex. The area is a traffic generator of major proportions (total daily trip attraction about 47,000) and heavily transit dependent. A branch line was suggested; however, such a branch line would produce major geometric difficulties at the south end of the bridge, particularly if the CPR remained and grade separation would be required (Figure 1).
In essence then, the LRT southside extension plan was based on (.1)
• Use of the high- l evel bridge, • Use of railway right-of-way and relocation of
the railway, • S9rving thQ ar9a of Millwood& a& &oon a&
possible, • Redevelopment to following immediately if an
LRT were located through an abandoned railway yard, and
• A lot of optimism based on boom economic times in Alberta during the 1970s.
The reality was, however, a little different:
1. Nobody had examined the structural condition of the high-level bridge and whether corrosion had occurred since 1913. There was no reliable cost estimate for making the bridge suitable for LRT.
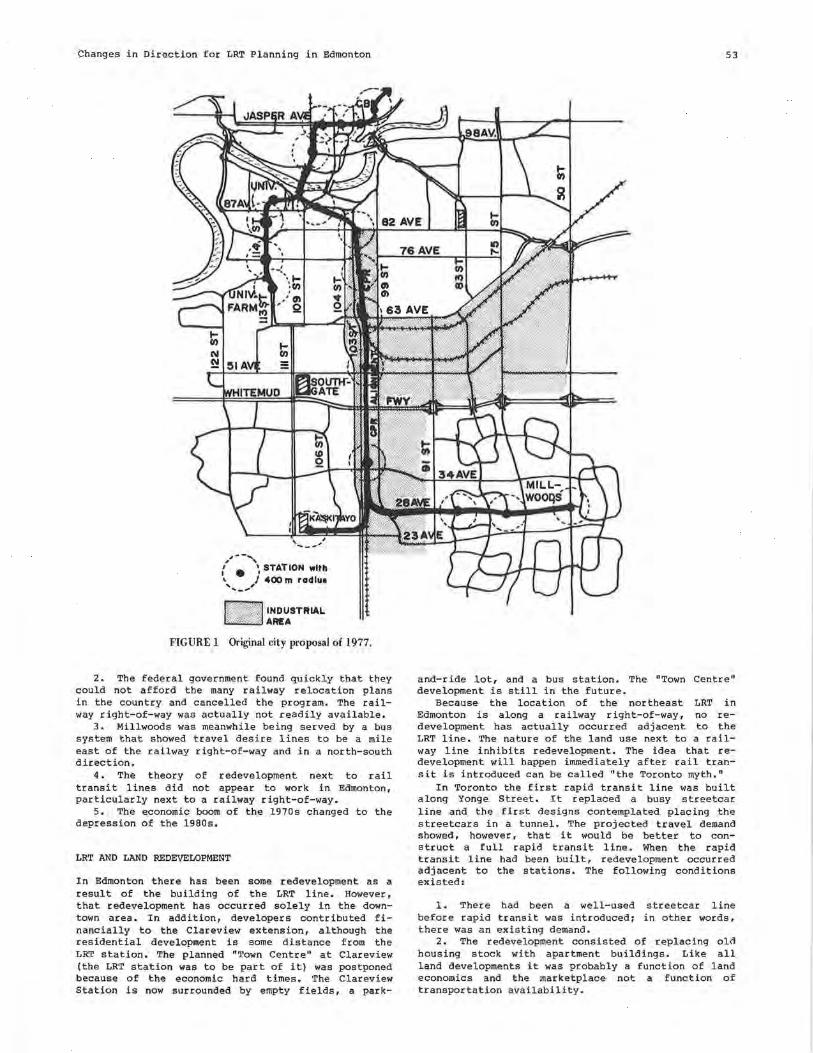
Changes in Direction for LRT Planning in Edmonton
,,- -"' { • ~ STATION with \ / 400 m radlu, ~-~
INDUSTRIAL AREA
FIGURE 1 Original city proposal of 1977.
2. The federal government found quickly that they could not afford the many railway relocation plans in the country and cancelled the program. The railway right-of-way was actually not readily available.
3. Millwoods was meanwhile being served by a bus system that showed travel desire lines to be a mile east of the railway right-of-way and in a north-south direction.
4. The theory of redevelopment next to rail transit lines did not appear to work in Edmonton, particularly next to a railway right-of-way.
5. The economic boom of the 1970s changed to the depression of the 1980s.
LRT AND LAND REDEVELOPMENT
In Edmonton there has been some redevelopment as a result of the building of the LRT line. However, that redevelopment has occurred solely in the downtown area. In addition, developers contributed financially to the Clareview extension, although the residential development is some distance from the LRT station. The planned "Town Centre" at Clareview (the LRT station was to be part of it) was postponed because of the economic hard times. The Clareview Station is now surrounded by empty fields, a park-
53
and-ride lot, and a bus station. The "Town Centre" development is still in the future.
Because the location of the northeast LRT in Edmonton is along a railway right-of-way, no redevelopment has actually occurred adjacent to the LRT line. The nature of the land use next to a railway line inhibits redevelopment. The idea that redevelopment will happen immediately after rail transit is introduced can be called "the Toronto myth."
In Toronto the first rapid transit line was built along Yonge Street. It replaced a busy streetcar line and the first designs contemplated placing the streetcars in a tunnel. The projected travel demand showed, however, that it would be better to construct a full rapid transit line. When the rapid transit line had been built, redevelopment occurred adjacent to the stations. The following conditions existed:
1. There had been a well-used streetcar line before rapid transit was introduced; in other words, there was an existing demand.
2. The redevelopment consisted of replacing old housing stock with apartment buildings. Like all land developments it was probably a function of land economics and the marketplace not a function of transportation availability.
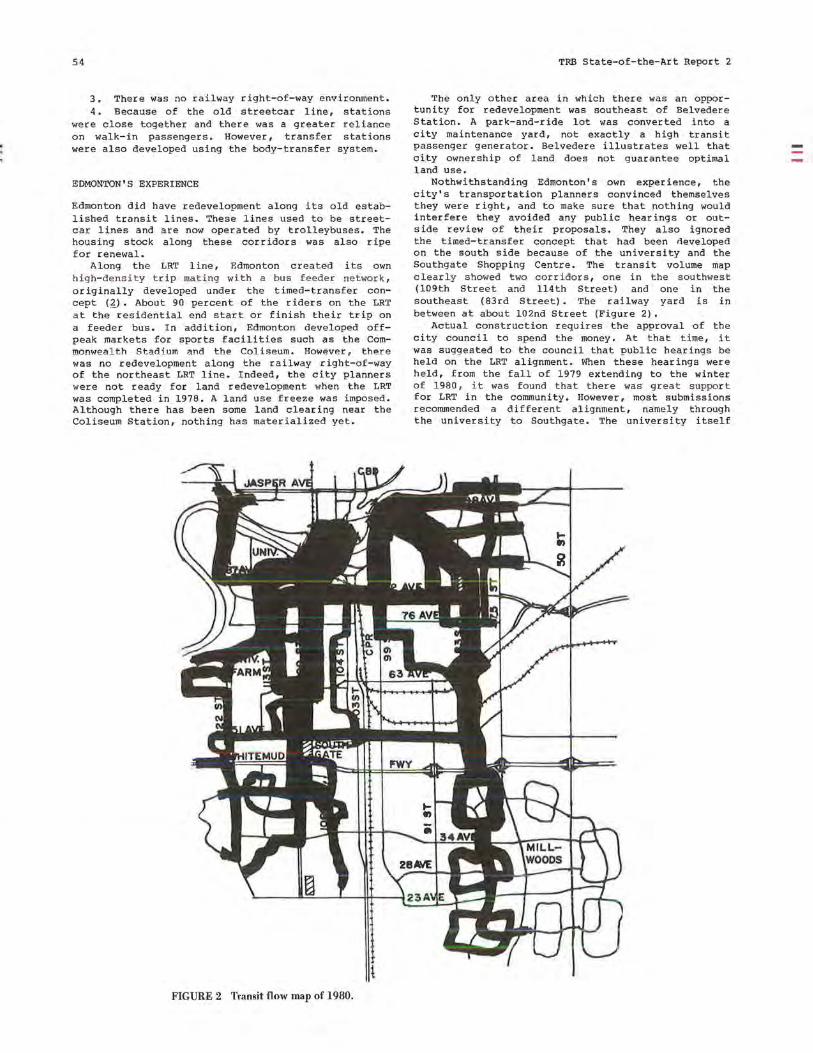
54
3. There was no railway right-of-way environment. 4. Because of the old streetcar line, stations
were close together and there was a greater reliance on walk-in passengers. However, transfer stations were also developed using the body-transfer system.
EDMONTON'S EXPERIENCE
Edmonton did have redevelopment along its old established transit lines. These lines used to be streetcar lines and are now operated by trolleybuses. The housing stock along these corridors was also ripe for renewal.
Along the LRT line, Edmonton created its own high- density trip mating with a bus feeder network , originally developed under the timed-transfer concept (~). About 90 percent of the riders on the LRT at the residential end start or finish their trip on a feeder bus. In addition, Edmonton developed offpeak markets for sports facilities such as the Commonwea l th Stadium and the Col i seum. However , ther e was no redevelopment along the railway right-of-way of the northeast LRT line. Indeed, the city planners were not ready for land redevelopment when the LRT was completed in 1978. A land use freeze was imposed. Although there has been some land clearing near the Coliseum Station, nothing has materialized yet.
FIGURE 2 Transit flow map of 1980.
TRB State-of-the-Art Report 2
The only other area in which there was an opportunity for redevelopment was southeast of Belvedere Station. A park-and-ride lot was converted into a city maintenance yard, not exactly a high transit passenger generator. Belvedere illustrates well that city ownership of land does not guarantee optimal land use.
Nothwithstanding Edmonton's own experience, the city's transportation planners convinced themselves they were right, and to make sure that nothing would interfere they avoided any public hearings or outside review of their proposals. They also ignored the timed-transfer concept that had been aeveloped on the south side because of the university and the Southgate Shopping Centre. The transit volume map clear l y showed two corridors , one in the southwest (109th Street and 114th Street) and one in the southeast (83rd Street). The railway yard is in between at about 102nd Street (Figure 2).
Actual construction requires the approval of the city council to spend the money. At t hat time, it was suggested to the council that public hearings be held on the LRT alignment. When these hearings were held, from the fall of 1979 extending to the winter of 1980, it was found that the r e was great suppor t for LRT in the community. However, most submissions recommended a different alignment, namely through the university to Southgate. The university itself
Changes in Direction for LRT Planning in Edmonton
welcomed LRT but not on a surface alignment. The university was willing to give an easement for the alignment underground, but would only sell the right-of-way for a surface location.
In February 1980 the city council approved an extension to the LRT starting at Central Station under Jasper Avenue to the Government Centre. Because of outside input, particularly by the downtown businessmen, an additional station was added at 104th Street (now called The Bay). The transportation planning staff opposed this station because of the high costs. The station was added to make the LRT more accessible in the downtown area, particularly from the streets perpendicular to Jasper Avenue.
OUTSIDE STUDY REVIEW
In their report to the council, the staff rebutted the arguments brought forward. An election in 1980 brought new faces to the council and in the fall of 1981 the council decided to appoint a review panel of outside experts. This review team consisted of Vukan Vuchic from the University of Pennsylvania; D.F. Howard, Director of Engineering and Project Director of the Tyne and wear Transport Metro; and
,,,- ',\ STATION
~ • ,' 400 m radlue ,_.,.., - RECOMMENDED LINE
••••• EAST-WEST ALIGN IN MILLWOODS
55
Herbert Feltz, Director of Planning of the Hannover Transit System, Ustra. This review study team presented its findings on April 6, 1982 (j). The study team recommended a line via the Government Centre past the university to Southgate and from there two branches, one further south and one to Millwoods (Figure 3).
This proposed line would be able to attract and serve more passengers, which greatly outweighed the "possible" redevelopment potential of the CPR corridor. Travel time from Millwoods would be up to 4 min longer compared to the original city plan.
The study team's report was different in a number of other aspects from the submissions made in the public hearings of 1979-1980. Meanwhile it had been determined that the structural condition of the high-level bridge was not as good as had first been assumed. Also, with joint use, there would be severe operating restrictions on the bridge (30 km/hr) and liability problems in case of an accident. The recommendation was to investigate a more direct alignment between the Government Centre and the university. This alignment would mean a tunnel alignment under 110th Street north of the river, a separate LRT bridge west of the present high-level bridge, and a tunnel under the university, surfacing as soon as possible to continue with road rights-of-
FIGURE 3 Alternative recommended by the review team.
56
way to Southgate. When completed, a 70 km/hr speed would be possible on this line. The universitySouthgate alignment was also recommended because it would be useful all day and not serve only as a peakhour commuter service. In Millwoods the line was given a north-south (instead of an east-west) alignment that is more in keeping with travel desire 1 ines. It also allowed for the possibility in the far future of building a second southeast line via approximately 83rd Street. The report also used more up- to-date population and employment statistics tha t also favored a ~outhwest alignment.
REACTION OF THE ADMINISTRATION
Instead of going full speed ahead, the city administration tried to delay decisions. Thi& meant that more LRVs were bought and that a new modern LRV maintenance facility was authorized and built (so that the LRVs could be housed) • The system now has 37 cars whereas it only need s 21 cars fo r peak-hour service. Capital funds were simply diverted to equipment away from construction.
Construction was limited to the downtown extension under Jasper Avenue as far as 108th Street (Corona Station). Because of suspected problems with the high-level bridge structure, it was considered advisable not to proceed beyond Corona Station. The option therefore remained open of using the CPR right-of-way and the high-level bridge or a tunnel alignment under 110th Street with a separate LRT bridge.
lt requireC, political actiun fu1 the ,;uuthwe,;L 1 ine to be approved. A number of interesting i terns came to light at this time. The city had been negotiating with the CPR about the high-level bridge. The CPR was willing to sell the bridge for $16 mill ion with the right-of-way from 82nd Avenue to the north side. The bridge, however, would have to remain accessible to the CPR ~ That requirement alone meant an extremely expensive LRT-CPR grade separation at the south end of the bridge. It was further determined that the bridge was in need of some "retro-maintenance" totaling about $6 million and it would cost another $14 million to make the bridge suitable for LRT. The CPR also wanted to change the maintenance agreement from 63.2 percent CPR and 36.8 percent city to 25 percent CPR and 75 percent city. Obtaining and using a 1913 bridge was not exactly a bargain. The new 110th Street tunnel alignment alternative that requires only a new LRT bridge was therefore approved by the council. The CPR then offered the bridge for $1. 00 with the new ma intenance agreementi but their offer was turned down.
ANOTHER ADMINISTRATION REVIEW REPORT
In May 1983 the Transportation Management Department prepared another report for the city council. In this report more up-to-date transportation data (the 1981 census) were used. Table l gives the estimated peak-hour travel to be expected in the various corridors (~_).
The 1993 modified figures assume a 10 percent increase in modal spl i t of transit work trips to the central business district (CBD) and to the University of Alberta. On the basis of present (1983) and anticipated future morning peak-hour work trips, the southwest line has greater potential than does the southeast alignment. The northwest and west would have to come later.
From the point of view of demand, it was clear where to build the next LRT line. The next problem was financing.
TRB State-of-the-Art Report 2
TABLE 1 Morning Peak-Hour Transit Trips
Based on Improved Based on Existing Mode Transit Access Split
!993 Incremental City sector 1983 1988 1993 Modified Increase
Northeast 3,450 4,550 5,400 6,200 +800 East 2,200 2,350 2,700 3,150 +450 Southeast 3,050 3,850 4,550 5,300 +750 Southwest 4,250 5,150 6,300 7,300 +1,000 West 2,750 3,000 3,450 4,000 +550 Northwest 3,600 4,000 4,600 5,350 +750
LRT FINANCES IN EDMONTON
The first leg of Edmonton's LRT to the northeast had a cost of $65 million, of which $45 million was paid by the government of Alberta. The remaining $20 million wa s first borrowed, but i n the debt reduction program of 1979 this debt was forgiven. The subsequent program (1979-1985) gave the city $25 million per year for transit capital, which the city chose to spend on LRT extensions, equipment, and a maintenance facility. In 1984 only $1 million was left with which detailed design was commenced for the southwest alignment. In November 1984 the Province of Alberta announced a new transportation assistance program for 3 years (1985-1988) . It consists of the following features.
A basic capital program is established for arterial and collector roads, tran&it, research ana development, and transportation system management. The province contributes $70.00 per capita, a 75 percent provincial contribution to be matched by a 25 percent city contribution. This means that for the next 3 years there is an assistance of $39 million per year from the province to be matched by the city with $13 million per year :; It t.t ill Jnean an average expenditure of $20 million per year for LRT for the next 3 years.
Although the city is free to allocate the money as it sees fit between modes, it does need the approval of the province for the chosen allocation.
PRESENT STATUS
The political decision has now been made to go southwest using an underground alignment under 110th Street, a separate but lower level bridge (365 m long) across the North Saskatchewan River, and underground under the university. This political decision became easier when there was a change of mayor in October 1983. Also in the last few years t he re has been a tightening up within the city administration, with the result that the planners associated with the CPR right-of-way alignment are no longer with the city,
Another important reason for the decision to proceed with the southwest alignment was that each section completed would immediately become revenue producing and would also produce savings in the form of fewer city buses required (Table 2). The CPR alignment alternative would have had to be completed all the way to Millwoods before it started producing revenue or savings (1).
r.onsul tants have now started with the detailed design, a design that will extend as far as the University Farm (Figure 4). The design will allow for further extensions to Southgate or beyond. The possibility also exists of branching at the University Health Sciences Centre to go west to west Edmonton Mall, a large shopping center that has been
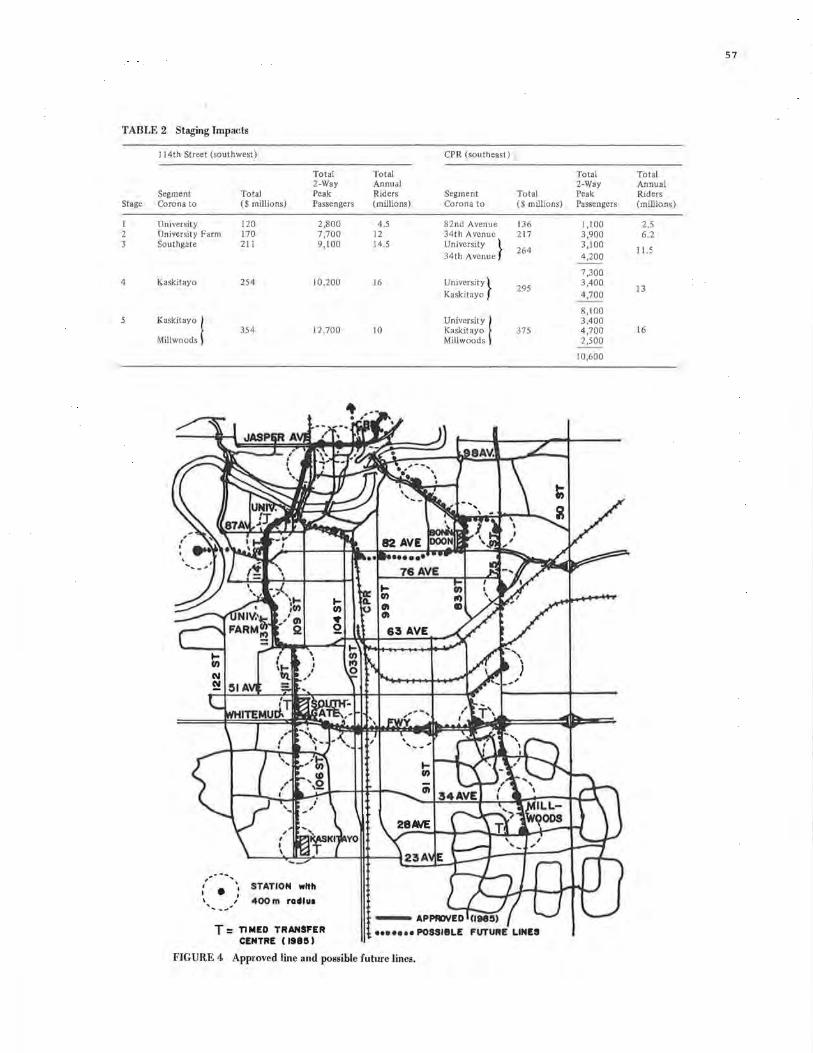
TABLE 2 Staging Impacts
Stage
l 2 3
4
5
I 14th Street (southwest)
Total 2-Way
Segment Total Peak Corona to ($ millions) Passengers
University 120 2,800 University Farm 170 7,700 Southgate 211 9,100
Kaskitayo 254 10,200
Kaskitayo ! 354 12,700
Millwoods
,,· -.... , ', STATION with I • ' '-~-,-' 400m racUu1
T = TIMED TRANSFER CENTRE ( 1985 )
CPR (southeast)
Total Annual Riders Segment Total (millions) Corona to ($ millions)
4.5 82nd Avenue 136 12 34th Avenue 217 14,5 University }
264 34th Avenue
16 University } 295
Kaskitayo
University ! 10 Kaskitayo 375
Millwoods
en u • • POSSIILE FUTURE LINES
FIGURE 4 Approved line and possible future lines.
57
Total Total 2-Way Annual Peak Riders Passengers (millions)
1,100 2.5 3,900 6.2 3,100
11.5 4,200
7,300 3,400
13 4,700
8,100 3,400 4,700 16 2,500
10,600
58
developed in the last 5 years. Even the option for an east-west line from Bonnie Doon to West Edmonton Mall will be possible. At the University Farm a major bus-LRT transfer station will be built. It is intended to open this line section by section so that the equipment that is already available can be used. The equipment now owned is sufficient for service to the University Farm. Financing is assured for the next 3 years and there is every reason to expect that it will continue beyond that period.
The task facing the city is to obtain the maximum value for dollars spent. The design therefore will have to be frugal. Studies are under way to determine whether a single-track tunnel on either side of the river with a double-track bridge would provide earlier service to the university. The policy ini
tially is going to be to lengthen trains rather than to increase the frequency of service, until the maximum length of five-car trains has been reached. This method will permit a 7-8 min headway with single-track tunnels. In any case it is expected that the Univers i ty Station will be in use by 1989 or 1990. The station design will make use of the now-adopted proof-of-payment fare system, which can greatly simplify design and reduce costs, especially with underground stations. The underground stations so far have a track level of about 15 m below the surface. The Government Centre and the University Stations will be 25 m below the surface. These stations will have no mezzanine floor and will be tubetype stations.
Beyond University Avenue the line will become a surface line located on the east side of 114th Street with crossings at grade. Then the south side of Edmonton will have a true light rail transit line.
CONCLUSIONS
The experience in Edmonton has been extremely frustrating. It clearly shows the constant need to have
TRB State-of-the-Art Report 2
plans reviewed by knowledgeable outsiders. Further, it is necessary to be sure that all transportation planners understand that transportation should serve existing travel demand first. Land redevelopment may or may not occur depending on the market, but existing facilities like government, universities, hospitals, and other major trip attractors are likely to remain. It is safer and faster to plan for known certainties than for remotely possible eventualities. In the design phase, staging becomes important so that each completed segment gives benefits on an incremental basis.
REFERENCES
1, D.L. MacDonald and J.J. Bakker. Edmonton's Northeast Light Rail Rapid Transit Line, In TRB Special Report 182: Light Rail Transit: Planning and Technology, TRB, National Research Council, Washington, D.C., 1978, pp. 23-27.
2. ."l" •. 1'. 'R!';llkk.or. T.4gh+- 'R::d 1 l"J'lr::1nc::d+- ::1nrl 'Rile:! Integra-tion in Edmonton. In Transportation Research Record 719, TRB, National Research Council, Washington, D.C., 1979, pp. 45-47.
3. Rapid Transit Extension Study. City of Edmonton, Alberta, Canada, Transportation Plan Part II, Section C, Vol. 1, 1977.
4. H. Feltz, D.F. Howard, and V.R. Vuchic. South Edmonton Light Rapid Transit Review. Executive Summary. Edmonton, Alberta, Canada, 1982.
5. South Side L.R.T. Review Study Report. Transportation Management, City of Edmonton, Alberta, Canada, May 1983.
Self-Service Fare Collection Systems for LRT: State-of-the-Art Review Roman Baur Zurich Transit Authority Zurich, Switzerland
Self-service fare collection (SSFC) began in Europe. Until the 1960s fare collection for transit had been monitored by special personnel that accompanied the trains and buses. Vehicles built after World War II usually had a seat for these conductors, and the passengers usually boarded the vehicles through the back door, passed the conductor, and left the car through the front or the center door. Regional buses usually use driver monitoring as is done in the United States. Labor shortage was the reason European transit authorities using conductors were forced in the 1960s to find a system of fare collection that permitted the same speed of operation but engaged significantly fewer personnel. The way SSFC grew in the transit system of the city of Zurich, Switzerland, is interesting because Zurich was one of the first cities to introduce elements of SSFC. SSFC was invented "step by step."
To begin with, trailers of the streetcars became available for passholders only and the conductors in the trailers were discontinued on those vehicles with automatic doors. From time to time inspectors checked whether all passengers using the trailer were holding a valid proof of payment, and a surcharge fare was collected from passengers without a valid pass. The system worked fairly well i the main problems were in the off-peak hours. Because relatively few passengers use passes during off-peak hours, the motorcoaches were overloaded and the trailers were half empty. To improve the situation, validators for prepaid tickets were installed at major stops so passengers using this mode of fare were able to use the first "metallic conductors." These validators printed station of boarding, time, and date. Therefore, no conductor had to handle these tickets and passengers using prepaid tickets could also board the trailers. Discontinuing the conductors on all trailers with automatic doors allowed a reduction in the number of conductors on the 2,500-employee system by more than 100. The next step of implementation was full self-service on the bus system. This step required the installation of automatic ticket dispensers at every stop as well as the installation of passenger-activated doors and the removal of the conductor's seat in all buses.
After a period of observation the last step was started--full self-service on the streetcars. Line after line, the conductor was also discontinued on the motorcoach and the necessary modifications made to the vehicles. The stations were also equipped with ticket dispensers. As the validators for pre-
paid tickets were built into these machines, the initially installed free-standing validators could be discontinued. Since 1974 the whole urban system has been operated under full SSFC conditions.
Many smaller steps have been taken since then. They primarily involved improvements on the vending machines, safety concepts for vehicle doors, fare inspection procedures, and cooperation with the courts. The installation of a data-processed radio communication system improved reports about defective vendomats as well as cooperation between drivers and road supervisors when problems with passengers occurred. Zurich transit is fully satisfied with SSFC and would employ more than 900 conductors if the old system were still in use. SSFC-related personnel number about 150.
Similar SSFC systems are in use throughout Europe and other parts of the world including Canada and the United States.
FARE COLLECTION SYSTEM OPTIONS FOR LIGHT RAIL TRANSIT
Essentially all existing fare collection systems can be used for the operation of a light rail system. The basic system options are
1. Full driver monitoring and vending of cash fares without proof of payment for all passengers. A satisfactory method of zone monitoring does not exist. This system is generally used on buses throughout the United States.
2. Full driver monitoring as in Option 1 but using proof of payment for all passengers. Zone moni toeing becomes possible. This system is used throughout Europe on regional and suburban bus lines.
3. Self-service. Several terms are used for self-service in the United States: self-service fare collection (SSFC), self-service/proof of payment (SSPP), and self-service/barrier free (SS~F). These terms do not distinguish different alternatives of self-service because self-service is always barrier free and always uses proof of payment for all passengers. Therefore, the three terms mean the same thing and the term "SSFC" will be used in this paper. SSFC always works with random inspection of proof of payment, which means that only a few percent of the passengers are inspected, but a surcharge fare has to be paid by those passengers not carrying proper proof of payment.
59
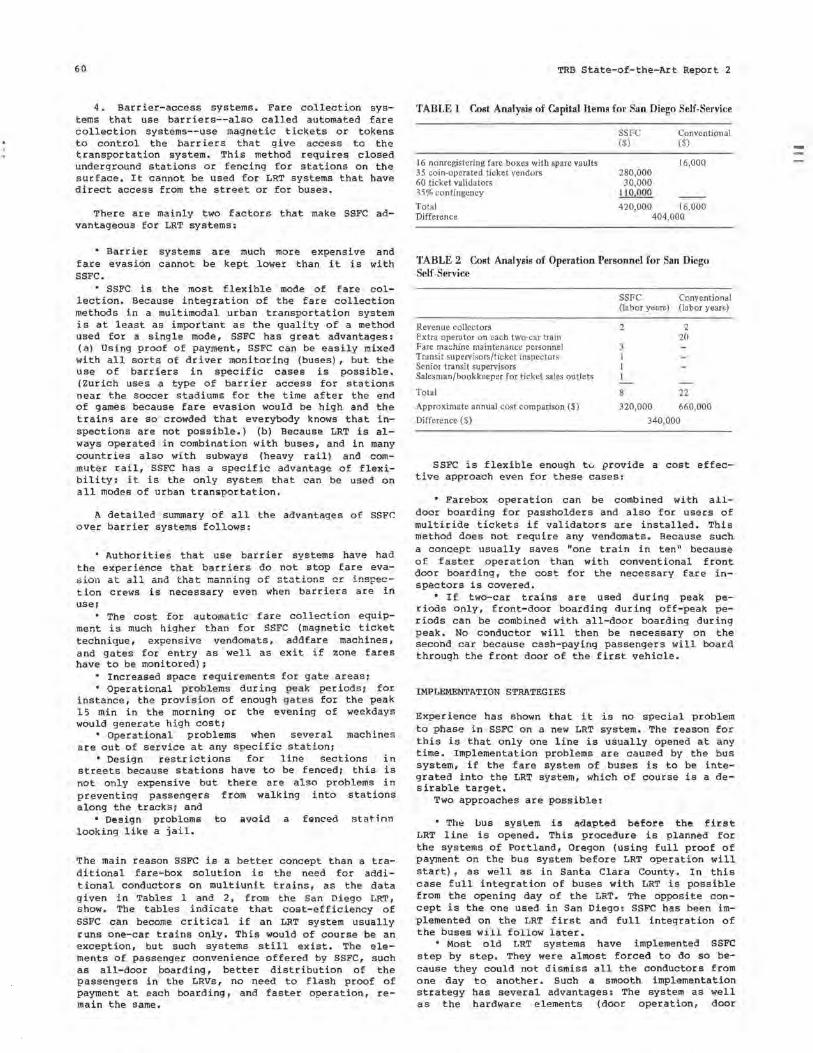
60
4. Barrier-access systems. Fare collection systems that use barriers--also called automated fare collection systems--use magnetic tickets or tokens to control the barriers that give access to the transportation system. This method requires closed underground stations or fencing for stations on the surface. It cannot be used for LRT systems that have direct access from the street or for buses.
There are mainly two factors that make SSFC advantageous for LRT systems:
• Barrier systems are much more expensive and fare evasion cannot be kept lower than it is with SSFC.
• SSFC is the most flexible mode of fare collection. Because integration of the fare collection methods in a multimodal urban transportation system is at least as important as the quality of a method used for a single mode, SSFC has great advantages: ( a ) Us i ng proof of payment , SSFC can be easily mixed with all sorts of driver monitoring (buses), but the use of barriers in specific cases is possible. (Zurich uses a type of barrier access for stations near the soccer stadiums for the time after the end of games because fare evasion would be high and the trainB are so crowded that everybody knows that inspections are not possible.) (b) Because LRT is always operated in combination with buses, and in many countries also with subways (heavy rail) and commuter rail, SSFC has a specific advantage of flexibility: it is the only system that can be used on all modes of urban tranaportation,
A detailed summary of all the advantages of SSFC over barrier systems follows:
• Authorities that use barrier systems have had the experience that barriers do not stop fare evasion at all and that manning of stat ions er inspection crews is necessary even when barriers are in use1
• The cost for automatic fare collection equipment is much higher than for SSFC (magnetic ticket technique, expensive vendomats, addfare machines, and gates for entry as well as exit if zone fares have to be monitored) i
• Increased space requirements for gate areas; • Operational p robl ems during peak periods; for
instance, the provis i on of enough gates for the peak 15 min in the morning or the evening of weekdays would generate high cost;
• Operational problems when several machines are out of service at any specific station;
• Design restrictions for line sections in streets because stations have to be fencedi this is not only expensive but there are als o p rob l ems in preventing passengers from walking into stations along the tracks; and
• Design probloms to avoid a fenced station looking like a jail.
The main reason SSFC is a better concept than a traditional fare-box solution is the need for additional conductors on multiunit trains, as the data g i ven in Tables 1 and 2 , from the San Diego LRT, show. The tables indicate that cost-efficiency of SSFC can become critical if an LRT system usually runs one-car trains only. This would of course be an exception, but such systems still exist. The elements of passenger convenience offered by SSFC, such as all-door boarding, better distribution of the passengers in the LRVs, no need to flash proof of payment at each boarding, and faster operation, remain the same.
TRB State-of-the-Art Report 2
TABLE 1 Cost Analysis of Capital Items for San Diego Self-Service
16 nonregistering fare boxes with spare vaults 35 coin-operated ticket vendors 60 ticket validators 35% contingency
Total Difference
SSFC Conventional ($) ($)
280,000 30,000
110,000
16,000
420,000 16,000 404,000
TABLE 2 Cost Analysis of Operation Personnel for San Diego Self-Service
Revenue collectors Extra operator on each two-car train Fare machine maintenance personnel Transit supervisors/ticket inspectors Senior transit supervisors Salesman/bookkeeper for ticket sales outlets
Total
Approximate annual cost comparison($)
Difference($)
SSFC Conventional (labor yearn) (labor yearn)
2
3 1 I 1
8
320,000
2 20
22
660,000
340,000
SSFC is flexible enough t.:.. provide a cost effective approach even for these cases:
• Farebox operation can be combined with alldoor boarding for passholders and also for users of multiride tickets if validators are installed. This method does not require any vendomats. Because such a concept usually saves "one train in ten" because of faster operation than with conventional front door boarding, the cost for the necessary fare inspectors is covered.
• If two-car trains are used during peak periods only, front-door boarding during off-peak periods can be combined with all-door boarding during peak. No conductor will then be necessary on the second car because cash-paying passengers will board through the front door of the first vehicle.
IMPLEMENTATION STRATEGIES
Experience has shown that it is no special problem to phase in SSFC on a new LRT system. The reason for this is that only one line is usually opened at any time. Implementation problems are caused by the bus system, if the fare system of buses is to be integrated into the LRT system, which of course is a desirable target.
Two approaches are possible:
• Th,;, L>us syslem is 11d11pted before the first LRT line is opened. This procedure is planned f or the systems of Portland, Oregon (using full proof of payment on the bus system before LRT operation will start) , as well as in Santa Clar a County. In this case full integration of buses with LRT is possible from the opening day of the LRT. The opposite concept is the one used in San Diego: SSFC has been implemented on the LRT first and full integration of the buses wi ll f oll ow l ater.
• Most old LRT systems have implemented SSFC step by step. They were almost forced to do so because they could not dismiss all the conductors from one day to another. Such a smooth implementation strategy has several advantages: The system as well as the hardware elements (door operation, door
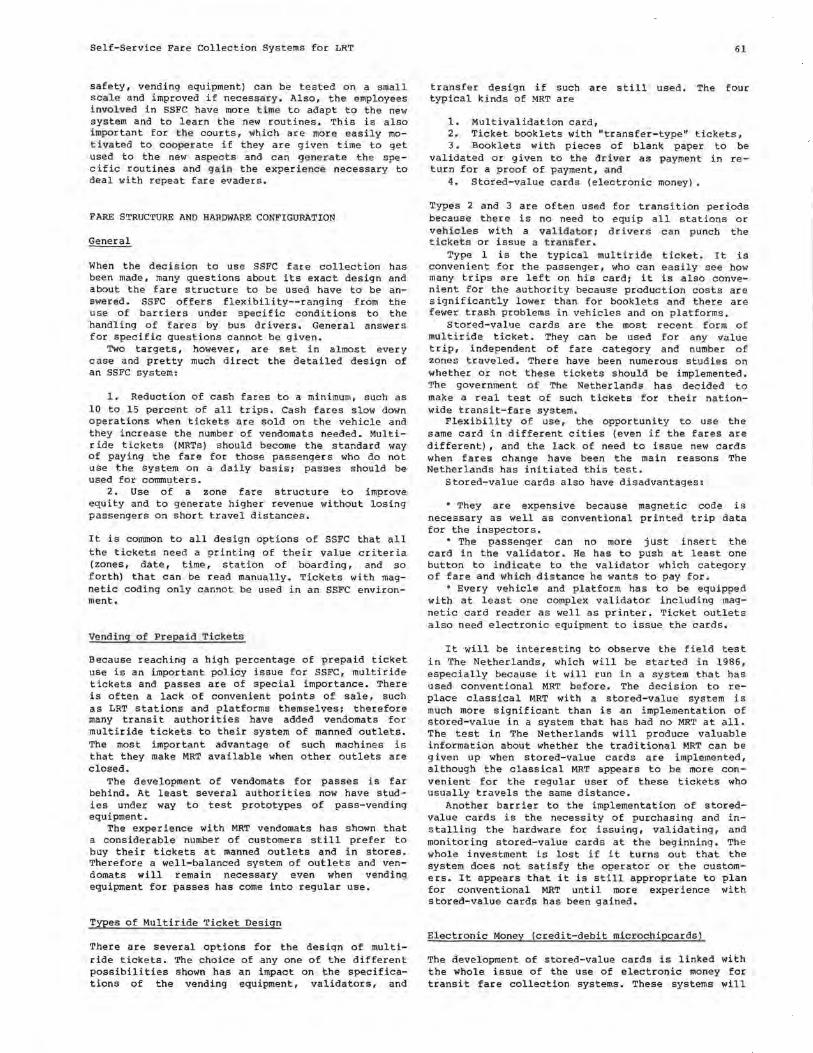
Self-Service Fare Collection Systems for LRT
safety, vending equipment) can be tested on a small scale and improved if necessary. Also, the employees involved in SSFC have more time to adapt to the new system and to learn the new routines. This is also important for the courts, which are more easily motivated to cooperate if they are given time to get used to the new aspects and can generate the specific routines and gain the experience necessary to deal with repeat fare evaders.
FARE STRUCTURE AND HARDWARE CONFIGURATION
General
When the decision to use SSFC fate collection has been made, many questions about its exact design and about the fare structure to be used have to be answered. SSFC offers flexibility--ranging from the use of barriers under specific conditions to the handling of fares by bus drivers. General answers for specific questions cannot be given.
Two targets, however, are set in almost every case and pretty much direct the detailed design of an SSFC system:
1. Reduction of cash fares to a m1n1mum, such as 10 to 15 percent of all trips. Cash fares slow down operations when tickets are sold on the vehicle and they increase the number of vendomats needed. Multiride tickets (MRTs) should become the standard way of paying the fare for those passengers who do not use the system on a daily basis; passes should be used for conunuters.
2. Use of a zone fare structure to improve equity and to generate higher revenue without losing passengers on short travel distances.
It is conunon to all design options of SSFC that all the tickets need a printing of their value criteria (zones, date, time, station of boarding, and so forth) that can be read manually. Tickets with magnetic coding only cannot be used in an SSFC environment.
Vending of Prepaid Tickets
Because reaching a high percentage of prepaid ticket use is an important policy issue for SSFC, multiride tickets and passes are of special importance. There is often a lack of convenient points of sale, such as LRT stations and platforms themselves; therefore many transit authorities have added vendomats for multiride tickets to their system of manned outlets. The most important advantage of such machines is that they make MRT available when other outlets are closed.
The development of vendomats for passes is far behind. At least several authorities now have studies under way to test prototypes of pass-vending equipment.
The experience with MRT vendomats has shown that a considerable number of customers still prefer to buy their tickets at manned outlets and in stores. Therefore a well-balanced system of outlets and vendomats will remain necessary even when vending equipment for passes has come into regular use.
Types of Multiride Ticket Design
There are several options for the design of multiride tickets. The choice of any one of the different possibilities shown has an impact on the specifications of the vending equipment, validators, and
61
transfer design if such are still used. The four typical kinds of MRT are
1. Multivalidation card, 2. Ticket booklets with "transfer-type" tickets, 3. Booklets with pieces of blank paper to be
validated or given to the driver as payment in return for a proof of payment, and
4. Stored-value cards (electronic money).
Types 2 and 3 are often used for transition periods because there is no need to equip all stations or vehicles with a validator; drivers can punch the tickets or issue a transfer.
Type 1 is the typical multiride ticket. It is convenient for the passenger, who can easily see how many trips are left on his card; it is also convenient for the authority because production costs are significantly lower than for booklets and there are fewer trash problems in vehicles and on platforms.
Stored-value cards are the most recent form of mul tir ide ticket. They can be used for any value trip, independent of fare category and number of zones traveled. There have been numerous studies on whether or not these tickets should be implemented. The government of The Netherlands has decided to make a real test of such tickets for their nationwide transit-fare system.
Flexibility of use, the opportunity to use the same card in different cities (even if the fares are different), and the lack of need to issue new cards when fares change have been the main reasons The Netherlands has initiated this test.
Stored-value cards also have disadvantages:
• They are expensive because magnetic code is necessary as well as conventional printed trip data for the inspectors,
• The passenger can no more just insert the card in the validator. He has to push at least one button to indicate to the validator which category of fare and which distance he wants to pay for.
• Every vehicle and platform has to be equipped with at least one complex validator including magnetic card reader as well as printer. Ticket outlets also need electronic equipment to issue the cards.
It will be interesting to observe the field test in The Netherlands, which will be started in 1986, especially because it will run in a system that has used conventional MRT before. The decision to replace classical MRT with a stored-value system is much more significant than is an implementation of stored-value in a system that has had no MRT at all. The test in The Netherlands will produce valuable information about whether the traditional MRT can be given up when stored-value cards are implemented, although the classical MRT appears to be more convenient for the regular user of these tickets who usually travels the same distance.
Another barrier to the implementation of storedvalue cards is the necessity of purchasing and installing the hardware for issuing, validating, and monitoring stored-value cards at the beginning. The whole investment is lost if it turns out that the system does not satisfy the operator or the customers. It appears that it is still appropriate to plan for conventional MRT until more experience with stored-value cards has been gained.
Electronic Money (credit-debit microchipcards)
The development of stored-value cards is linked with the whole issue of the use of electronic money for transit fare collection systems. These systems will
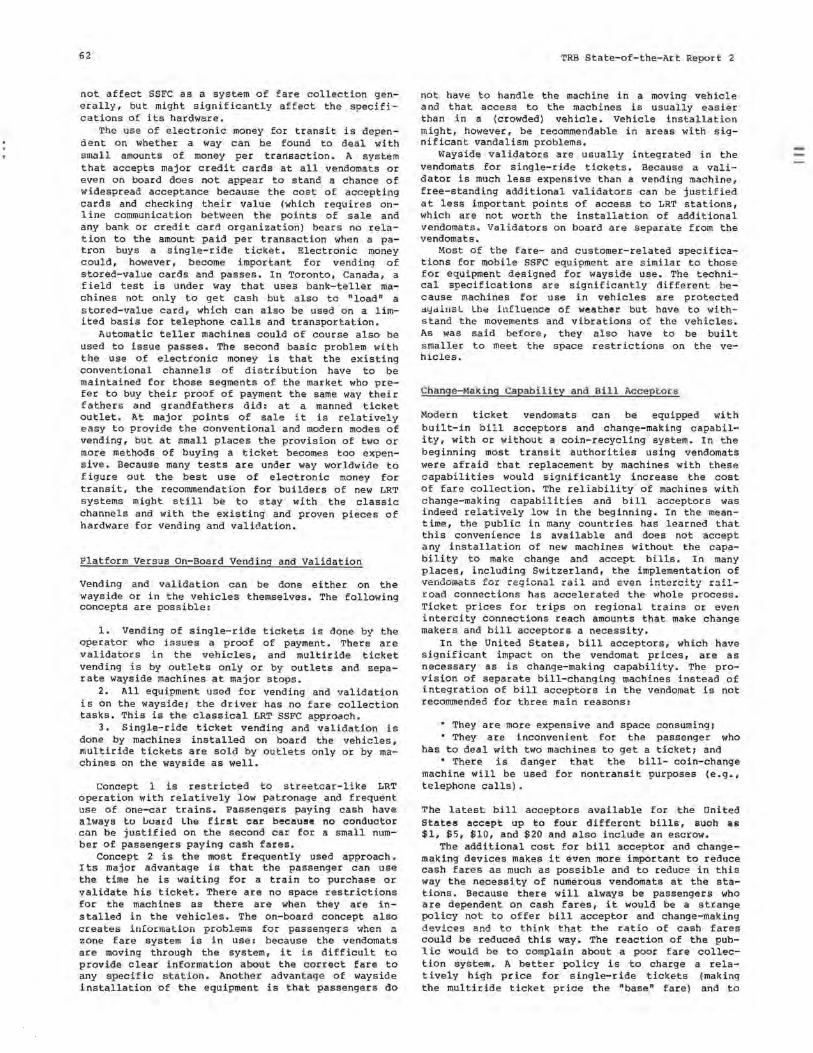
62
not affect SSFC as a system of fare collection generally, but might significantly affect the specifications of its hardware.
The use of electronic money for transit is dependent on whether a way can be found to deal with small amounts of money per transaction. A system that accepts major credit cards at all vendomats or even on board does not appear to stand a chance of widespread acceptance because the cost of accepting cards and checking their value (which requires online communication between the points of sale and any bank or credit card organization) bears no relation to the amount paid per transaction when a patron buys a single-ride ticket. Electronic money could, however, become important for vending of stored-value cards and passes. In Toronto, Canada, a field test is under way that uses bank-teller machines not only to get cash but also to "load" a stored-value card, which can also be used on a limited basis for telephone calls and transportation.
Automatic teller machines could of course also be used to issue passes. The second basic problem with the use of electronic money is that the existing conventional channels of distribution have to be maintained for those segments of the market who prefer to buy their proof of payment the same way their fathers and grandfathers did: at a manned ticket outlet. At major points of sale it is relatively easy to provide the conventional and modern modes of vending, but at small places the provision of two or more methods of buying a ticket becomes too expensive. Because many tests are under way worldwide to figure out the best use of electronic money for transit, the recommendation for builders of new LRT systems might still be to stay with the classic channels and with the existing and proven pieces of hardware for vending and validation.
Platform Versus On-Board Vendinq and Validation
Vending and validation can be done either on the wayside or in the vehicles themselves. The following concepts are possible:
1. Vending of single-ride tickets is done by the operator who issues a proof of payment. There are validators in the vehicles, and multiride ticket vending is by outlets only or by outlets and separate wayside machines at major stops.
2. All equipment used for vending and validation is on the wayside; the driver has no fare collection tasks. This is the classical LRT SSFC approach.
3. Single-ride ticket vending and validation is done by machines installed on board the vehicles, multiride tickets are sold by outlets only or by machines on the wayside as well.
Concept 1 is restricted to streetcar-like LRT operation with relatively low patronage and frequent use of one-car trains. Passengers paying cash have always tu uuatcl Lhe firl!lt ear beeaul!le no conductor can be justified on the second car for a small number of passengers paying cash fares.
Concept 2 is the most frequently used approach. I ts major advantage is that the passenger can use the time he is waiting for a train to purchase or validate his ticket. There are no space restrictions for the machines as there are when they are installed in the vehicles. The on-board concept also creates information problems for passengers when a zone fare system is in use: because the vendomats are moving through the system, it is difficult to provide clear information about the correct fare to any specific station. Another advantage of wayside installation of the equipment is that passengers do
TRB State-of-the-Art Report 2
not have to handle the machine in a moving vehicle and that access to the machines is usually easier than in a (crowded) vehicle. Vehicle installation might, however, be recommendable in areas with significant vandalism problems.
Wayside validators are usually integrated in the vendomats for single-ride tickets. Because a validator is much less expensive than a vending machine, free-standing additional validators can be justified at less important points of access to LRT stations, which are not worth the installation of additional vendomats. Validators on board are separate from the vendomats.
Most of the fare- and customer-related specifications for mobile SSFC equipment are similar to those for equipment designed for wayside use. The technical specifications are significantly different because machines for use in vehicles are protected ayalnsl Lhe influence of weather but have to withstand the movements and vibrations of the vehicles. As was said before, they also have to be built smaller to meet the space restrictions on the venicles.
Change-Making Capability and Bill Acceptors
Modern ticket vendomats can be equipped with built-in bill acceptors and change-making capability, with or without a coin-recycling system. In the beginning most transit authorities using vendomats were afraid that replacement by machines with these capabilities would significantly increase the cost of fare collection. The reliability of machines with change-making capabilities and bill acceptors was indeed relatively low in the beginning. In the meantime, the public in many countries has learned that this convenience is available and does not accept any installation of new machines without the capability to make change and accept bills. In many places, including Switzerland, the implementation of vendomats for regional rail and even intercity railroad connections has accelerated the whole process. Ticket prices for trips on regional trains or even intercity connections reach amounts that make change makers and bill acceptors a necessity.
In the United States, bill acceptors, which have significant impact on the vendomat prices, are as necessary as is change-making capability. The provision of separate bill-changing machines instead of integration of bill acceptors in the vendomat is not recommended for three main reasons:
• They are more expensive and space consuming; • They are inconvenient for the passenger who
has to deal with two machines to get a ticket; and • There is danger that the bill- coin-change
machine will be used for nontransit purposes (e.g., telephone calls).
The latest bill acceptors available for the United States accept up to four different bills, suoh as $1, $5, $10, and $20 and also include an escrow.
The additional cost for bill acceptor and changemaking devices makes it even more important to reduce cash fares as much as possible and to reduce in this way the necessity of numerous vendomats at the stations. Because there will always be passengers who are dependent on cash fares, it would be a strange policy not to offer bill acceptor and change-making devices and to thin!( that the ratio of cash fares could be reduced this way. The reaction of the pub-1 ic would be to complain about a poor fare collection system. A better policy is to charge a relatively high price for single-ride tickets (making the multiride ticket price the "base" fare) and to
Self-Service Fare Collection Systems for LRT
offer good convenience for those passengers who pay a cash fare. Because most passengers who pay cash fares do not use transit frequently and often do not understand how to use transit, convenience is more important for them than is a low price.
Ticket Dispensers for Drivers
Using a proof of payment system for LRT usually means that the integration of the bus system includes proof of payment on the buses. This has the consequence that drivers have to issue proof of payment to all cash-paying passengers who do not transfer from another vehicle.
Ticket dispensers, which replace the use of transfers for proof of payment, have been developed to help the driver issue these tickets. Two different types of machines are on the market:
1. Driver monitored machines. The driver has to indicate to the machine the fare and the machine produces the ticket. Such machines are in wide use on regional bus systems. Most of them, such as the well known Almex and Tim types of machines, work mechanically. An electric machine of this type was used in the Portland SSFC fare collection demonstration project.
2. Electronic machines with microprocessor. Such machines receive continuous input about the location of the vehicle they are installed in (from the driver or from automatic vehicle location determination). The dispenser also "knows" the whole fare structure and the zone configuration. The driver needs only to input the category of fare and the destination zone or station and the machine automatically issues the correct ticket. With additional memory and a card reader such a machine can also issue and identify tickets that are magnetically coded.
This type of machine makes possible the sale of tickets for complex trips in multizonal systems, including intermodal transfers directly to the desti-
63
nation, by the driver without generating an overload for him.
CONCLUSIONS
SSFC is the most efficient and convenient way of collecting fares on an LRT system and therefore became the standard mode of fare collection for LRT.
SSFC offers possibilities for easily integrating the bus system into the fare system of an LRT system. A step-by-step implementation program is recommended.
SSFC can also be used for heavy rail and regional train services as many applications in Europe have shown in recent years.
SSFC, including the idea of proof of payment for all passengers, is more a general philosophy than it is a system of fare collection as such.
SSFC has gone through an intense development process since the method was used for the first time. The most important improvements can be found in the fields of hardware quality, fare inspection procedures, and cooperation between the transit authorities in the courts.
SSFC can be implemented in many various forms because it is a flexible mode of fare collection. That every concept "works" appears to discourage many agencies from going through a clean evaluation process to define the best solution for their environment.
In the United States a psychological barrier against barrier-free fare collection still appears to exist. The reason for this problem might be that many professionals know barrier systems better than the barrier-free approach and therefore have a problem trusting SSFC.
As it did in the past the idea of SSFC will certainly grow further and be fine tuned as new technologies and new needs come up. The next challenge for SSFC (as well as for other methods of fare collection) will be the integration of the electronic money systems.
Getting the Most on a Modest Budget - Santa Clara County Transit District LRV Maintenance Facility Kenneth E Brenek Santa Clara County Transportation Agency San Jose, California
Wallace A. Dela Barre Daniel, Mann, Johnson & Mendenhall San Francisco, California
The Santa Clara County Transit District Guadalupe Corridor Light Rail Project is the longest new rail transit line to be built in 50 years in the United States. This project includes a facility that will house all vehicle and system maintenance and repair, parts storage, operations, and administrative functions. Because a modest budqet was established for the facility, the planning and design process required following the most cost-effective approach. The various components of the facility are discussed and the cost conscious procedure that was followed in its development is detailed.
During the design phases of the Santa Clara County project the major items that were carefully analyzed included site selection, alternative layouts for yard and buildings, car spot studies, investigation of future expansion items, cost studies at various design levels for budget control, constant investigation of cost reduction items and their effects on maintenance and operations, and project phasing for early construction. The analyses and concepts were also subject to peer group reviews at two points in the design development process. A close consultantclient relationship was developed in which the client played an active role in design and decision making. This produced a product that will not require major modifications after completion and that stayed within the design budget.
The final plan selected accommodates 50 new light rail cars and allows for expansion to increase the fleet to 100 vehicles. Construction of the facility started in April 1984 and is scheduled to be completed in December 1985 at a total construction cost of $16.5 million. It was funded with UMTA, State of California, and local funds.
Final design of the maintenance facility was done by a consultant team led by the firm of Daniel, Mann, Johnson & Mendenhall under the direction of the Santa Clara County Transportation Agency. Other team members included Gannett Fleming Transportation Engineers, Ruth & Going, Fleet Maintenance Consultants, and Sanji Yano Associates.
SITE SELECTION
Alternative sites were analyzed during the system concept phase to select the best available location.
64
sixteen sites were initially identified and, after initial screening, the best six were selected for detailed analysis. The six sites and the selected Highway 17 site are shown in Figure 1. The selection criteria included physical characteristics of the site, cost, time required for environmental and property itcma, location, phasing and expansion, surrounding land use, supply and maintenance access, joint use of facility, and support of the site location by the city jurisdiction. Specific items that were investigated for each er i ter ion are shown in Figure 2.
The evaluation of the criteria for each site was summarized in a matrix (Figure 3). The selectea Highway 17 site was optimal with respect to the following items:
1. It is located along the earliest possible first phase main-line segment,
2. The property was publicly owned and thus acquisition did not require removal of private property from the tax rolls,
3. It has favorable deadheading costs and lost maintenance time costs,
4. The location is best if other light rail transit (LRT) corridors are built,
5. Sufficient land is available for future expansion,
6, Few environmental problems were involved with the site,
7. It is hidden from view--recessed from the main thoroughfare and located adjacent to two major highways,
8. It is compatible with the city jurisdiction's land use plans because it is zoned "Public/ Quasi-Public,"
9. No residences are adjacent to the site, and 10. It is located close to the center of the LRT
system and close to the downtown central business district (CBD).
The parcel comprises 22 acres. The facility will be developed on 18 acres, and the remaining 4 acres will be reserved for other uses.
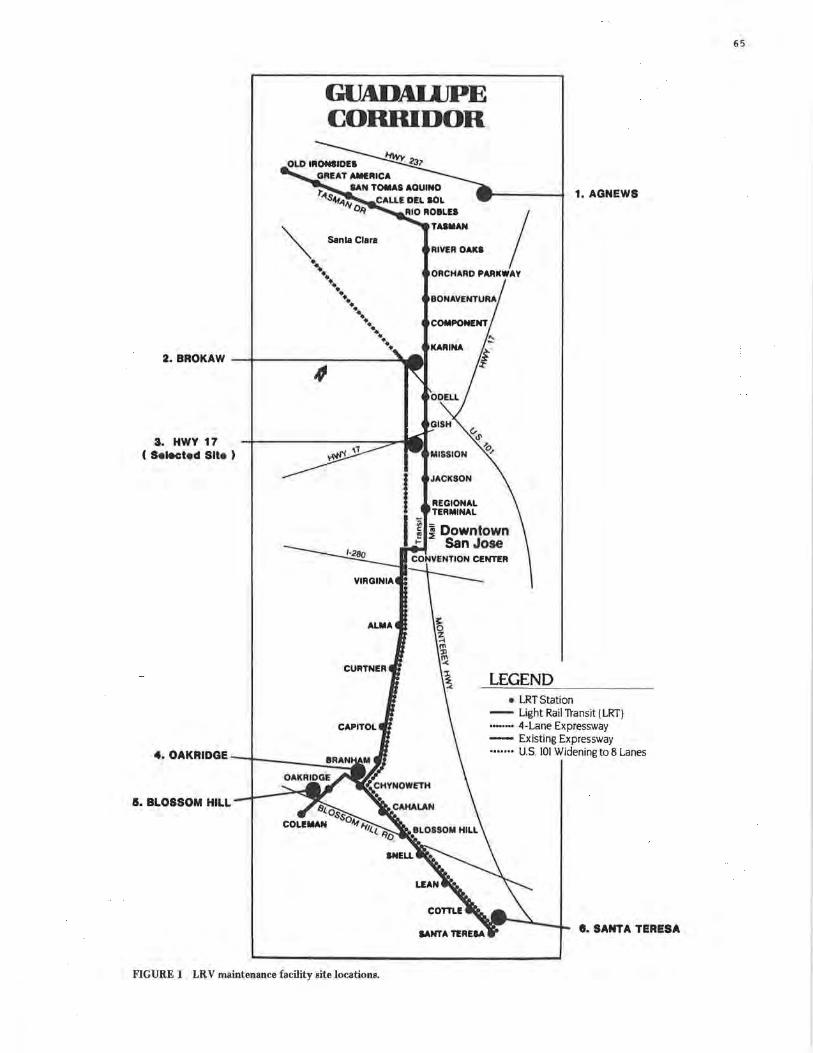
GUADALUPE CORRIDOR
GREAT AMERICA ,- M.N TOMAS AQUINO "Is~,."' CAUE DEL IOL
011
~ Santa Clara
TUMAN
Al\1£A OAKI
1. AGNEWS
I ·~ •• ORCHARD PARKWAY
••• •• •• ...
•• .... ....
' 3. HWY 17
( Selected Site )
CURTNER
CAPITOL
5. BLOSSOM HILL
FIGURE 1 LRV maintenance facility site locations.
LEGEND • LRT Station
-- Light Rail Transit (LRT) ·-·-· 4-Lane Expressway - Existing Expressway ••••••• U.S. IOI Widening to 8 Lanes
I. SANT A TERESA
65
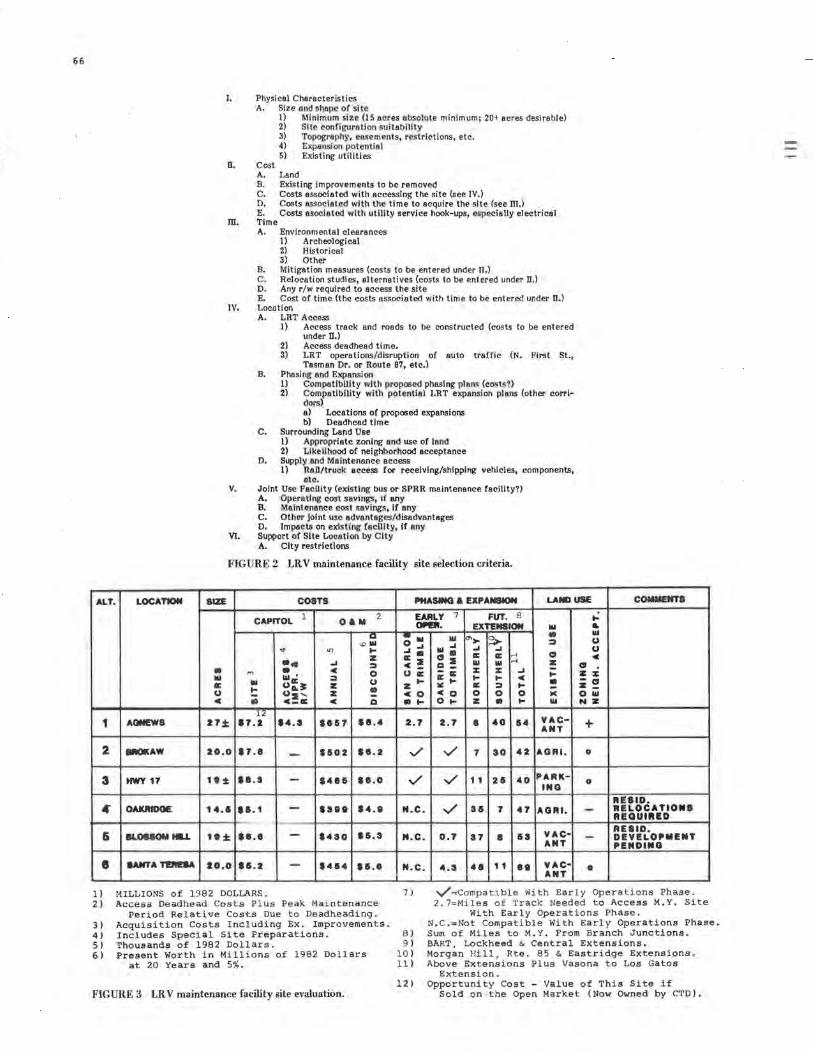
66
ALT. LOCATION
1 AONEWS
I. Physicel Cheracteristics A. Size and shape of site
I) Minimum size (l 5 oeres absolute minimum; 20+ ecres desireble) 2) Site configuration suitebili\y 3) Topography, easements, restrictions, etc. 4) Expansion potential 5) Existing utilities
II. Cost A. Lend B. Existing improvements to be removed C. Costs associeted with accessing the site (see JV.) D. Costs associated wl'th the time to acquire the slle (seem.) E. Costs asociated with utility service hook-ups, especially electrical
m. Time A. Environmentel cleerences
I) Archeologlcal 2) Historical 3) Other
B. Mitigation meesures (costs to be entered under II.) C. Relocetion studies, alternatives (costs to be entered under II.) D, Any r/w required to access the site E, Cost of time (the costs associated with time to be entered under II.)
IV, Locntion A. LRT Access
I) Access track and roads to be constructed (costs to be entered under II.)
2) Access deedhead time. 3) LRT operations/disruption oi auto traffic (N. First St.,
Tasmen Dr. or Route 87, etc.) B. Pheslng end Expension
I) Compatibility with proposed phasing pion., (costs?) 2) Compatibfllty with potentiel LRT expansion plens (other corri
dors) a) Locations of proposed expensions b) Deadhead time
C, Surrounding Lend Use I) Appropriate zoning and use of land 2) Likelihood of neighborhood acceptance
D. Supply and Maintenance access I) nan/truck access for receiving/shipping vehicles, components,
etc. V. Joint Use Facility (existing bus or SPRR maintenence facility?)
A. Operating cost savings, it any B. Maintenance cost savings, if any c. Other Joint use advan,teges/dlsadvantages D, Impacts on existing feo[lity, if any
VI. Support of Site Location by City A. City restrictions
FIGURE 2 LRV maintenance facility site selection criteria.
SIZE COSTS PHASING A EXPANSION LAND USE
CAPITOL l
• Ill II: u C
Ill ... •
l;L 17± .7.Z .4.3
0 AM 2
..I C ::::, z z C
••n
Cl .., l&I ...
z ::::, 0 u • Cl
$11.4
EARLY 7 0Pa. ...
0 ..I ..I.
: ! u II:
z ... co .... 2.7
Ill Ill ..I C, •
Cl ! ic II: :al: ...
co 0 ...
2.7
FUT. B EXTENSION
"'>- ;?.>, ..I ..I II: II: r< l&I Ill r< :z: :z: ..I I- I- C II: ::::, ... 0 0 0 z ....
II 40 54
Ill
• ::::,
C, z ... • IC l&I
VACANT
C,
... .. l&I u u C
z :z: Z! 0 l&I NZ
+ 2 BRC)l(AW 20.0 .7.11 $502 $8.2 v' V 7 30 42 AGRI. 0
3 HWY 17 1t :t ••. 3 $4115 1e.o v v 11 25 40 PARKING
0
OAKRIDGE 14.1 ,1.1 1:nt 14.t N.C. V 35 7 47 AGRI. Rl!IID. RELOCATION• REQUIRED
& 19± ••.• 1430 •5.3 N.C. 0.7 37 8 53 VAC• ANT
RE81D. DEVELOPMENT PENDING
e 1414 15.e N.C.
1 ) MILLIONS of l'.l82 DOLLARS. 7 J 2 ) Access Deadhead Costs Plus Peak Maintenance
Period Relative Costs Due to Deadheading. 3) Acquisition Costs Including Ex. Improvements. 4) Includes Special Site Preparations. 8) 5) Thousands of 1982 Dollars. 9) 6) Present Worth in Millions of 1982 Dollars 10 )
at 20 Years and 5%. 11 l
12) FIGURE 3 LRV maintenance facility site evaluation.
4.3 48 11 •• VAC• ANT
0
.../=Compatible With Early Operations Phase. 2.7=Miles of Track Needed to Access M.Y. Site
With Early Operations Phase. N.C.=Not Compatible With Early Operations Phase. Sum of Miles to M.Y. From Branch Junctions. BART, Lockheed & Central Extensions. Morgan Hill, Rte. 85 & Eastridge Extensions. Above Extensions Plus Vasona to Los Gatos
Extension. Opportunity Cost - Value of This Site if
Sold on the Open Market (Now Owned by CTD).
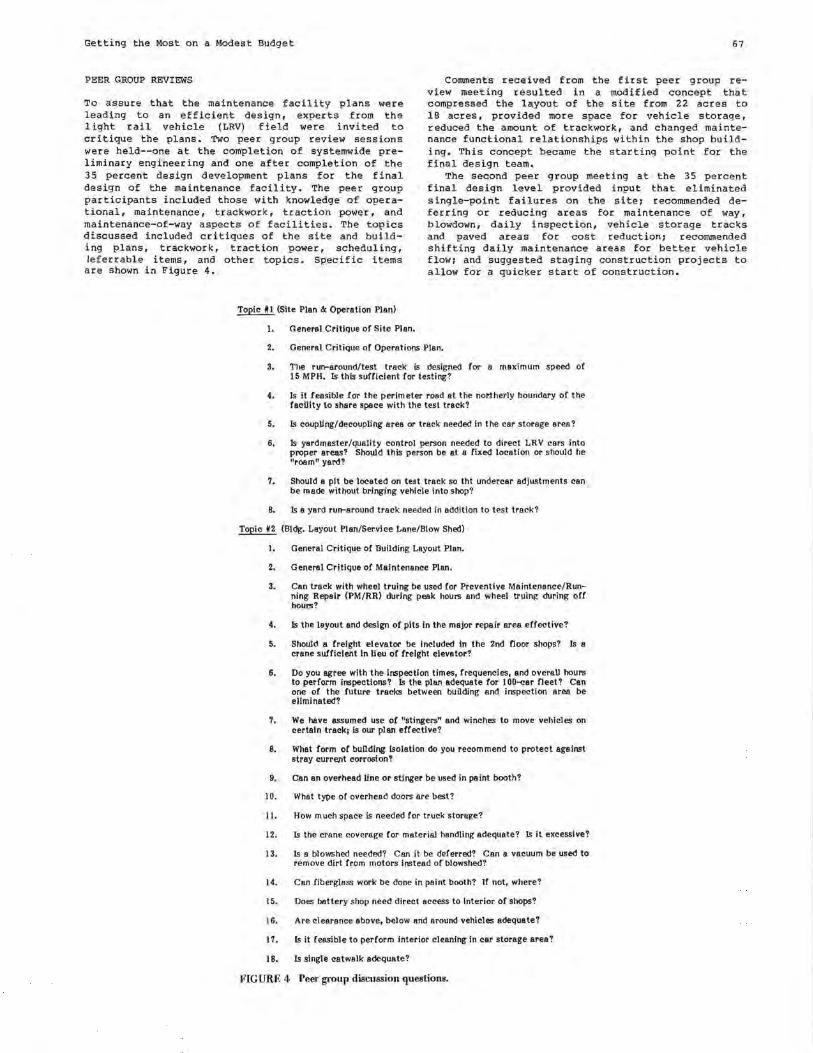
Getting the Most on a Modest Budget 67
PEER GROUP REVIEWS
To assure that the maintenance facility plans were leading to an efficient design, experts from the light rail vehicle (LRV) field were invited to critique the plans. Two peer group review sessions were held--one at the completion of systemwide preliminary engineering and one after completion of the 35 percent design development plans for the final design of the maintenance facility. The peer group participants included those with knowledge of operational, maintenance, trackwork, traction power, and maintenance-of-way aspects of facilities. The topics discussed included critiques of the site and building plans, trackwork, traction power, scheduling, leferrable items, and other topics. Specific items are shown in Figure 4.
Comments received from the first peer group review meeting resulted in a modified concept that compressed the layout of the site from 22 acres to 18 acres, provided more space for vehicle storage, reduced the amount of trackwork, and changed maintenance functional relationships within the shop building. This concept became the starting point for the final design team.
The second peer group meeting at the 35 percent final design level provided input that eliminated single-point failures on the sitei recommended deferring or reducing areas for maintenance of way, blowdown, daily inspection, vehicle storage tracks and paved areas for cost reduction; recommended shifting daily maintenance areas for better vehicle flowi and suggested staging construction projects to allow for a quicker start of construction.
Topic # I (Site Plan & Operation Plan)
I. General Critique of Site Plan.
2. General Critique of Operations Plan.
3. The run-around/test track is designed for a maximum speed of 15 MPH. Is this sufficient for testing?
4. Is it feasible for the perimeter road et the northerly boundary of the facility to share space with the test track?
5. Is coupling/decoupling area or track needed in the car storage area?
6. ls yardmaster/quality control person needed to direct LRV cars into proper areas? Should this person be at a fixed location or should he "room" ye.rd?
7. Should a pit be located on test track so tht undercar adjustments can be made without bringing vehicle into shop?
8. Is a yard run-around track needed in addition to test track?
Topic #2 (Bldg. Layout Plan/Service Lene/Blow Shed)
I. General Critique of Building Layout Plan.
2. General Critique of Maintenance Plan.
3. Can track with wheel truing be used for Preventive Maintenance/Running Repair (PM/RR) during peak hours and wheel truing" during off hours?
4. Is the layout and design of pits in the major repair area effective?
5. Should a freight elevator be included in the 2nd noor shops? Is a crane sufficient in lieu of freight elevator?
6. Do you agree with the inspection times, frequencies, and overall hours to perform inspections? ls the plan adequate for 100-car fleet? Can one of the future tracks between building and inspection area be eliminated?
7. We have assumed use of "stingers• and winches to move vehicles on certain track; is our plan effective?
8. What form of building Isolation do you recommend to protect against stray currllllt corrosion?
9. Can an overhead line or stinger be used in paint booth?
I 0. What type of overhead doors are best?
11. How much space is needed for truck storag"e?
12. Is the crane coverage for material handling adequate? Is it excessive?
13. Is a blowshed needed? Can it be deferred? Can a vacuum be used to remove dirt from motors instead of blowshed?
14. Can fiberglass work be done in paint booth? If not, where?
15. Does battery shop need direct access to Interior of shops?
16. Are clearance above, below and around vehicles adequate?
17. ls it feasible to perform Interior cleaning in car storage area?
18. Is single catwalk adequate?
FIG URE 4 Peer group discussion questions.
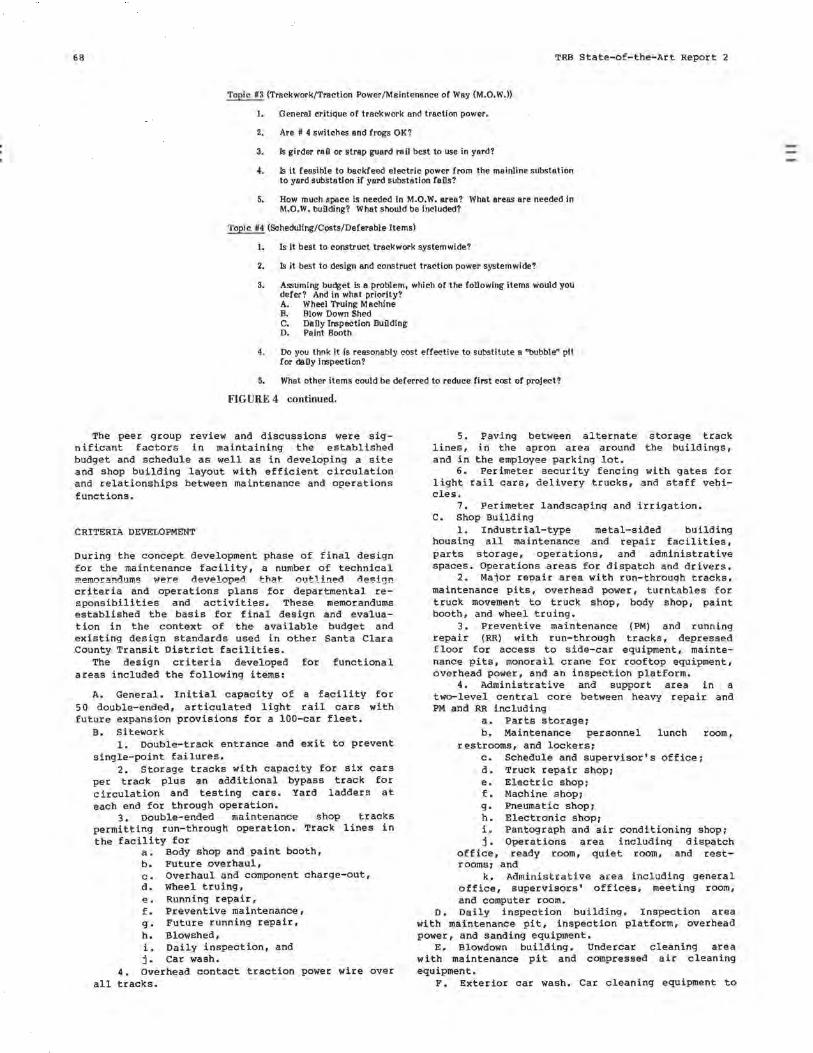
68 TRB State-of-the-Art Report 2
Topic #3 (Treckwork/Trection Power/Meintenence of Wey (M.O.W.))
I. Generel critique of treckwork end traction power.
2. Are # 4 switches end frogs OK?
3. Is girder reil or strep guard reil best to use in yerd?
4. Is it feasible to beckfeed electric power from the mainline substation to yard substation if yard substation fails?
5. How much space is needed In M.O.W. area? Whet areas are needed In M.O.W. building? What should be included?
'foplc #4 (Scheduling/Costs/Deferable Items)
I. Is it best to construct trackwork systemwide?
2. Is it best to design and construct traction power systemwide?
3. Assuming budget is a problem, which of the following items would you defer? And in whet priority? A. Wheel Truing Machine B. Blow Down Shed C. Deily Inspection Building D. Point Booth
4. Do you thnk it is reasonably cost effective to substitute a "bubble" pit for daily inspection?
5. Whet other items could be deferred to reduce first cost of project?
FIGURE 4 continued.
The peer group review and discussions were significant factors in maintaining the established budget and schedule as well as in developing a site and shop building layout with efficient circulation and relationships between maintenance and operations functions.
CRITERIA DEVELOPMENT
During the concept development phase of final design for the maintenance facility, a number of technical memorandums we:re rlP.vf!lt.lnpPn that nn~i;nPn design criteria and operations plans for departmental responsibilities and activities. These memorandums established the basis for final design and evaluation in the context of the available budget and existing design standards used in other Santa Clara County Transit District facilities.
The design criteria developed for functional areas included the following items:
A. General. Initial capacity of a facility for 50 double-ended, articulated light rail cars with future expansion provisions for a 100-car fleet.
B. Sitework 1. Double-track entrance and exit to prevent
single-point failures. 2. storage tracks with capacity for six cars
per track plus an additional bypass track for circulation and testing cars. Yard ladders at each end for through operation.
3. Double-ended maintenance shop tracks permitting run-through operation. Track lines in the facility for
a. Body shop and paint booth, b. Future overhaul, c. Overhaul and component charge-out, d. Wheel truing, e. Running repair, f. Preventive maintenance, g. Future running repair, h. Blowshed, i. Daily inspection, and j. Car wash.
4. Overhead contact traction power wire over all tracks.
5. ~aving between alternate storage track lines, in the apron area around the buildings, and in the employee parking lot.
6. Perimeter security fencing with gates for light rail cars, delivery trucks, and staff vehicle!.,
7. Perimeter landscaping and irrigation. C. Shop Building
1. Industrial-type metal-sided building housing all maintenance and repair facilities, parts storage, operations, and administrative spaces. Operations areas for dispatch and drivers.
2. Maior repair area with run-throuqh tracks, maintenance pits, overhead power, turntables for truck movement to truck shop, body shop, paint booth, and wheel truing.
3. Preventive maintenance (PM) and running repair (RR) with run-through tracks, depressed floor for access to side-car equipment, maintenance pits, monorail crane for rooftop equipment, overhead power, and an inspection platform.
4. Administrative and support area in a two-level central core between heavy repair and PM and RR including
a. Parts storage; b. Maintenance personnel lunch room,
restrooms, and lockers; c. Schedule and supervisor's office; d. Truck repair shop; e. Electric shop; f. Machine shop; g. Pneumatic shop; h. Electronic shop; i. Pantograph and air conditioning shop; j. Operations area including dispatch
office, ready room, quiet room, and restrooms; and
k. Administrative area including general office, supervisors' offices, meeting room, and computer room.
D. Daily inspection building, Inspection area with maintenance pit, inspection platform, overhead power, and sanding equipment,
E. Slowdown building. Undercar cleaning area with maintenance pit and compressed air cleaning equipment.
F. Exterior car wash. Car cleaning equipment to
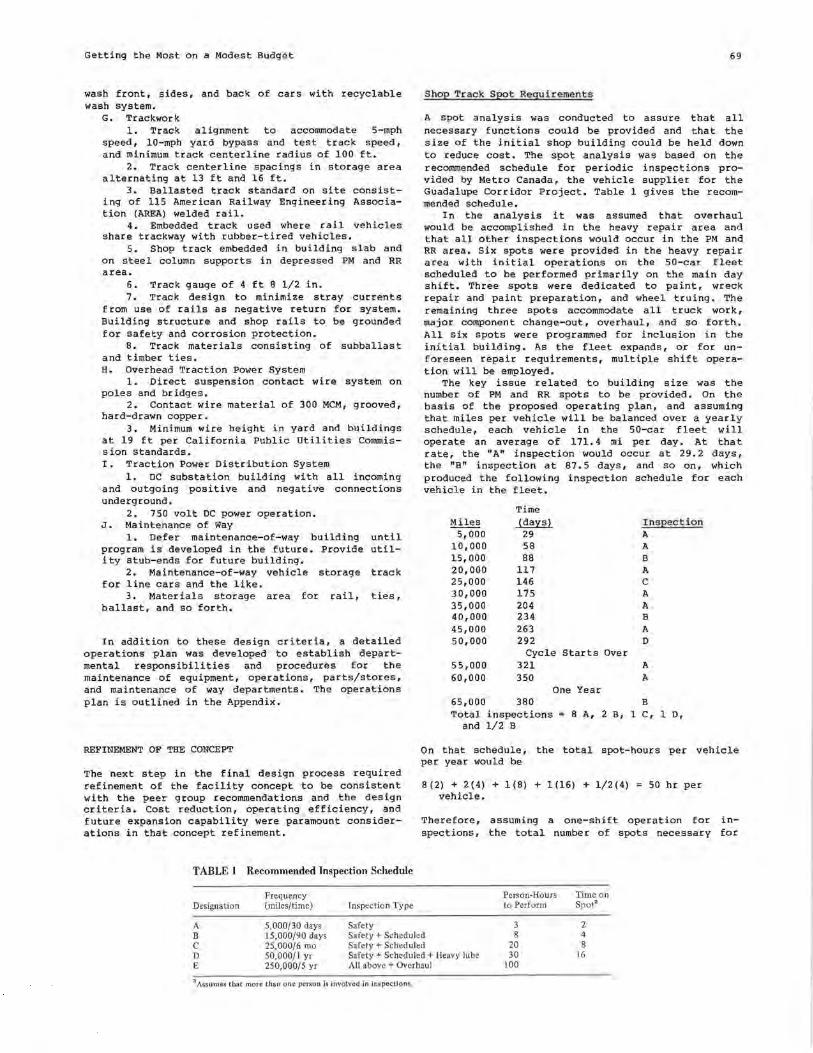
Getting the Most on a Modest Budget
wash front, sides, and back of cars with recyclable wash system.
G. Trackwork 1. Track alignment to accommodate 5-mph
speed, 10-mph yard bypass and test track speed, and minimum track centerline radius of 100 ft.
2. Track centerline spacings in storage area alternating at 13 ft and 16 ft.
3. Ballasted track standard on site consisting of 115 American Railway Engineering Association (AREA) welded rail.
4. Embedded track used where rail vehicles share trackway with rubber-tired vehicles.
5. Shop track embedded in building slab and on steel column supports in depressed PM and RR area.
6. Track gauge of 4 ft 8 1/2 in. 7. Track design to minimize stray currents
from use of rails as negative return for system. Building structure and shop rails to be grounded for safety and corrosion protection.
8. Track materials consisting of subballast and timber ties. H. Overhead Traction Power System
1. Direct suspension contact wire system on poles and bridges.
2. Contact wire material of 300 MCM, grooved, hard-drawn copper.
3. Minimum wire height in yard and buildings at 19 ft per California Public Utilities Commission standards. I. Traction Power Distribution System
1. DC substation building with all incoming and outgoing positive and negative connections underground.
2. 750 volt DC power operation. J. Maintenance of Way
1. Defer maintenance-of-way building until program is developed in the future. Provide utility stub-ends for future building.
2. Maintenance-of-way vehicle storage track for line cars and the like.
3. Materials storage area for rail, ties, ballast, and so forth.
In addition to these design criteria, a detailed operations plan was developed to establish departmental responsibilities and procedures for the maintenance of equipment, operations, parts/stores, and maintenance of way departments. The operations plan is outlined in the Appendix.
REFINEMENT OF THE CONCEPT
The next step in the final design process required refinement of the facility concept to be consistent with the peer group recommendations and the design criteria. Cost reduction, operating efficiency, and future expansion capability were paramount considerations in that concept refinement.
TABLE 1 Recommended Inspection Schedule
Frequency Designation (miles/time) Inspection Type
A 5,000/30 days Safety
69
Sho p Track Spot Requirements
A spot analysis was conducted to assure that all necessary functions could be provided and that the size of the initial shop building could be held down to reduce cost. The spot analysis was based on the recommended schedule for periodic inspections provided by Metro Canada, the vehicle supplier for the Guadalupe Corridor Project. Table 1 gives the recommended schedule.
In the analysis it was assumed that overhaul would be accomplished in the heavy repair area and that all other inspections would occur in the PM and RR area. Six spots were provided in the heavy repair area with initial operations on the 50-car fleet scheduled to be performed primarily on the main day shift. Three spots were dedicated to paint, wreck repair and paint preparation, and wheel truing. The remaining three spots accommodate all truck work, major component change-out, overhaul, and so forth. All six spots were programmed for inclusion in the initial building. As the fleet expands, or for unforeseen repair requirements, multiple shift operation will be employed.
The key issue related to building size was the number of PM and RR spots to be provided. On the basis of the proposed operating plan, and assuming that miles per vehicle will be balanced over a yearly schedule, each vehicle in the 50-car fleet will operate an average of 171.4 mi per day. At that rate, the "A" inspection would occur at 29.2 days, the "B" inspection at 87. 5 days, and so on, which produced the following inspection schedule for each vehicle in the fleet.
Miles 5,000
10,000 15,000 20,000 25,000 30,000 35,000 40,000 45,000 50,000
55,000 60,000
65,000
Time
~ 29 58 88
117 146 175 204 234 263 292
Cycle Starts Over 321 350
One Year 380
I nspection A
A
B A
C A A B A
D
A
A
B
Total inspections= 8 A, 2 B, 1 c, 1 D, and 1/2 B
On that schedule, the total spot-hours per vehicle per year would be
8(2) + 2(4) + 1(8) + 1(16) + 1/2(4) vehicle.
50 hr per
Therefore, assuming a one-shift operation for inspections, the total number of spots necessary for
Person-Hours Time on to Perform Spot"
3 2 B 15,000/90 days Safety+ Scheduled 8 4 C 25,000/6 mo Safety+ Scheduled 20 8 D 50,000/1 yr Safety+ Scheduled + Heavy lube 30 ' 16 E 250,000/5 yr All above+ Overhaul 100
a Assumes that more than one person is fovolved in inspections.
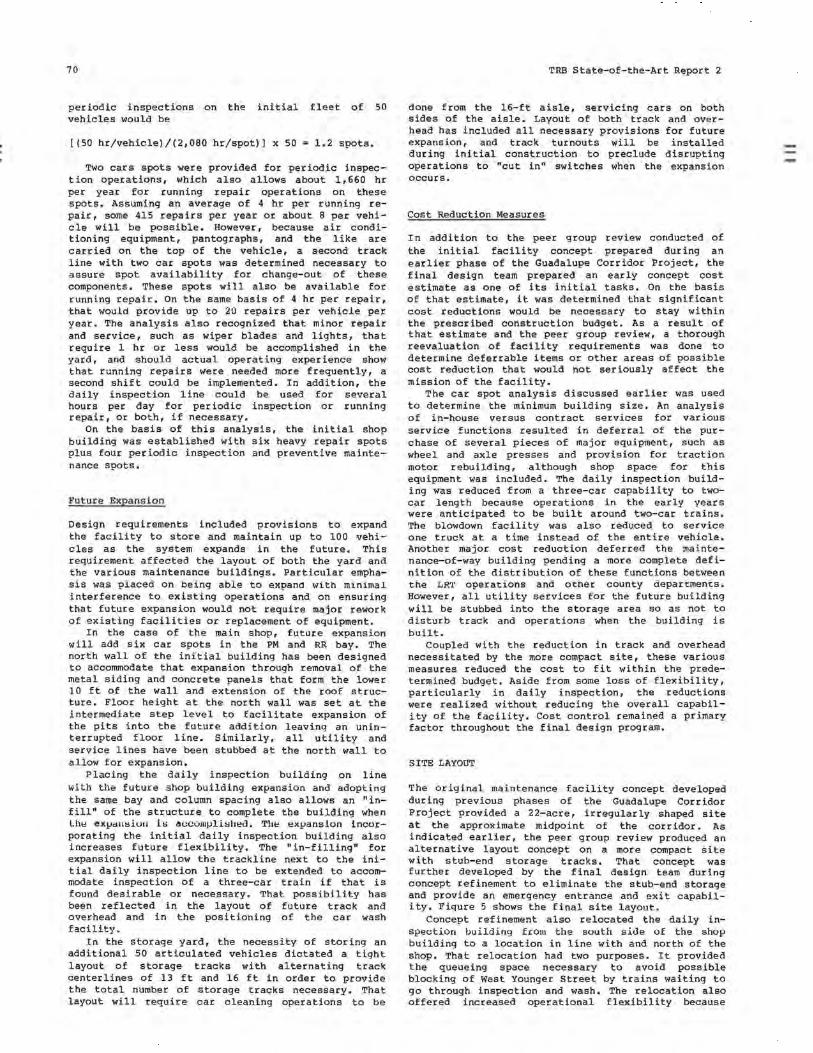
70
periodic inspections on the initial fleet of 50 vehicles would be
((50 hr/vehicle)/(2,080 hr/spot)] x 50 = 1.2 spots.
Two cars spots were provided for periodic inspect ion operations, which also allows about 1,660 hr per year for running repair operations on these spots. Assuming an average of 4 hr per running repair, some 415 repairs per year or about 8 per vehicle will be possible. However, because air conditioning equipment, pantographs, and the like are carried on the top of the vehicle, a second track line with two car spots was determined necessary to assure spot availability for change-out of these components. These spots will also be available for running repair. On the same basis of 4 hr per repair, that would provide up to 20 repairs per vehicle per year. The analysis also recognized that minor repair and service, such as wiper blades and lights, that require 1 hr or less would be accomplished in the yard, and should actual operating experience show that running repairs were needed more frequently, a second shift could be implemented. In addition, the daily inspection line could be used for several hours per day for periodic inspection or running repair, or both, if necessary.
On the basis of this analysis, the initial shop building was established with six heavy repair spots plus four periodic inspection and preventive maintenance spots.
Future Expansipn
Design requirements included provisions to expand the facility to store and maintain up to 100 vehicles as the system expands in the future. This requirement affected the layout of both the yard and the various maintenance buildings. Particular emphasis was p l aced on being able to expand with minimal interference to existing operations and on ensuring that future expansion would not require major rework of existing facilities or replacement of equipment.
In the case of the main shop, future expansion will add six car spots in the PM and RR bay. The north wall of the initial building has been designed to accommodate that expansion through removal of the metal siding and concrete panels that form the lower 10 ft of the wall and extension of the roof structure. Floor height at the north wall was set at the intermediate step level to facilitate expansion of the pits into the future addition leaving an uninterrupted floor line. Similarly, all utility and service lines have been stubbed at the north wall to allow for expansion.
Placing the daily inspection building on line with the future shop building expansion and adopting the same bay and column spacing also allows an "infill" of the structure to complete the building when Lh!c! exvc1mslu11 ill ac<.:umvlished. The exvansion incorporating the initial daily inspection building also increases future flexibility. The • in-filling" for expansion will allow the trackline next to the initial daily inspection line to be extended to accommodate inspection of a three-car train if that is found desirable or necessary. That possibility has been reflected in the layout of future track and overhead and in the positioning of the car wash -F:.ro-11 ,r,,..y,.
In the storage yard, the necessity of storing an additional 50 articulated vehicles dictated a tight layout of storage tracks with alternating track centerlines of 13 ft and 16 ft in order to provide the total number of storage tracks necessary. That layout will require car cleaning operations to be
TRB State-of-the-Art Report 2
done from the 16-ft aisle, servicing cars on both sides of the aisle. Layout of both track and overhead has included all necessary provisions for future expansion, and track turnouts will be installed during initial construction to preclude disrupting operations to "cut in" switches when the expansion occurs.
Cost Reduction Measures
In addition to the peer group review conducted of the initial facility concept prepared during an earlier phase of the Guadalupe Corridor Project, the final design team prepared an early concept cost estimate as one of its initial tasks. On the basis of that estimate, it was determined that significant cost reductions would be necessary to stay within the prescribed construction budget. As a result of that estimate and the peer group review, a thorough reevaluation of facility requirements was done to determine deferrable items or other areas of possible cost reduction that would not seriously affect the mission of the facility.
The car spot analysis discussed earlier was used to determine the minimum building size. An analysis of in-house versus contract services for various service functions resulted in deferral of the purchase of several pieces of major equipment, such as wheel and axle presses and provision for traction motor rebuilding, although shop space for this equipment was included. The daily inspection building was reduced from a three-car capability to twocar length because operations in the early years were anticipated to be built around two-car trains. The blowdown facility was also reduced to service one truck at a time instead of the entire vehicle. Another major cost reduction deferred the maintenance-of-way building pending a more complete definition of the distribution of these functions between the LRT operations and other county departments. However, all utility services for the future building will be stubbed into the storage area so as not to disturb track and operations when the building is built.
Coupled with the reduction in track and overhead necessitated by the more compact site, these various measures reduced the cost to fit within the predetermined budget. Aside from some loss of flexibility, particularly in daily inspection, the reductions were realized without reducing the overall capability of the facility. Cost control remained a primary factor throughout the final design program.
SITE LAYOUT
The original maintenance facility concept developed during previous phases of the Guadalupe Corridor Project provided a 22-acre, irregularly shaped site at the approximate midpoint of the corridor. As indicated earlier, the peer group review produced an alternative layout concept on a more compact site with stub-end storage tracks. That concept was further developed by the final design team during concept refinement to eliminate the stub-end storage and provide an emergency entrance and exit capability. Figure 5 shows the final site layout.
Concept refinement also relocated the daily inspection building from the south siU.e of the shop building to a location in line with and north of the shop. That relocation had two purposes. It provided the queueing space necessary to avoid possible blocking of West Younger Street by trains waiting to go through inspection and wash. The relocation also offered increased operational flexibility because
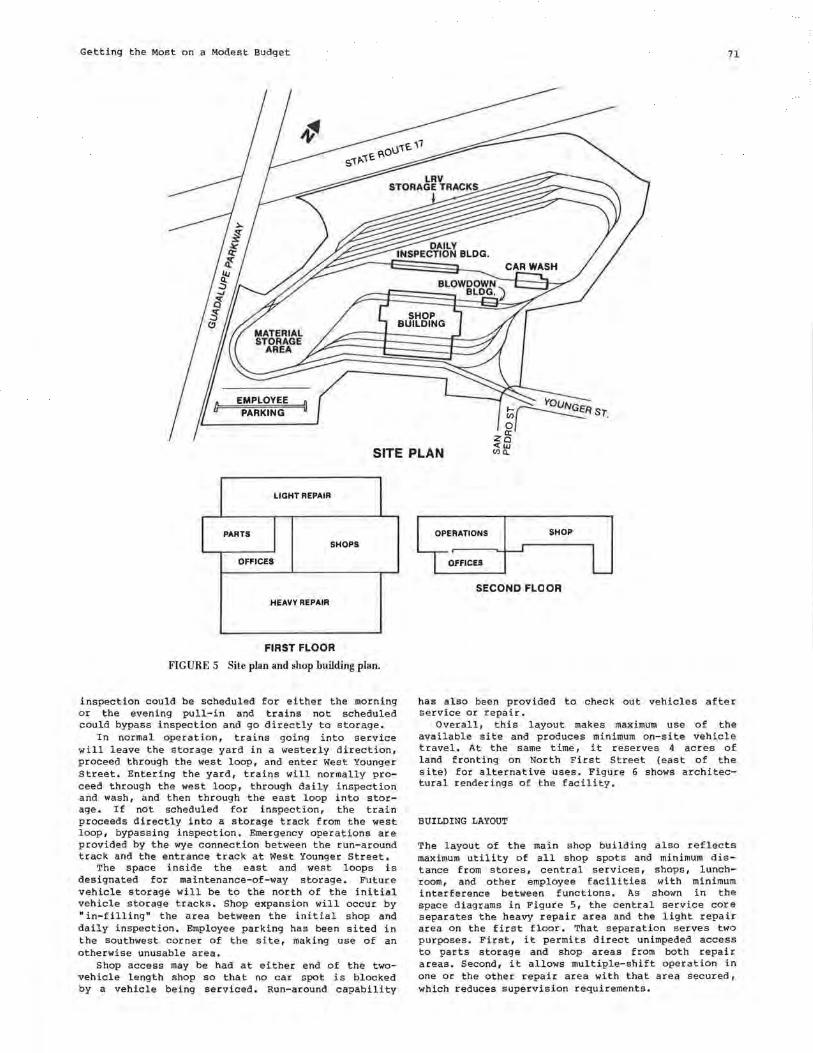
Getting the Most on a Modest Budget 71
SITE PLAN
LIGHT REPAIR
I PARTS I SHOPS
OFFICES
HEAVY REPAIR
FIRST FLOOR
FIGURE 5 Site plan and shop building plan.
inspection could be scheduled for either the morning or the evening pull-in and trains not scheduled could bypass inspection and go directly to storage.
In normal operation, trains going into service will leave the storage yard in a westerly direction, proceed through the west loop, and enter West Younger Street. Entering the yard, trains will normally proceed through the west loop, through daily inspection and wash, and then through the east loop into storage. If not scheduled for inspection, the train proceeds directly into a storage track from the west loop, bypassing inspection. Emergency operations are provided by the wye connection between the run-around track and the entrance track at West Younger Street.
The space inside the east and west loops is designated for maintenance-of-way storage. Future vehicle storage will be to the north of the initial vehicle storage tracks. Shop expansion will occur by "in-filling" the area between the initial shop and daily inspection. Employee parking has been sited in the southwest corner of the site, making use of an otherwise unusable area.
Shop access may be had at either end of the twovehicle length shop so that no car spot is blocked by a vehicle being serviced. Run-around capability
SHOP
SECOND FLO OR
has also been provided to check out vehicles after service or repair.
Overall, this layout makes maximum use of the available site and produces minimum on-site vehicle travel. At the same time, it reserves 4 acres of land fronting on North First Street (east of the site) for alternative uses. Figure 6 shows architectural renderings of the facility.
BUILDING LAYOUT
The layout of the main shop building also reflects maximum utility of all shop spots and minimum distance from stores, central services, shops, lunchroom, and other employee facilities with minimum interference between functions. As shown in the space diagrams in Figure 5, the central service core separates the heavy repair area and the light repair area on the first floor. That separation serves two purposes. First, it permits direct unimpeded access to parts storage and shop areas from both repair areas. Second, it allows multiple-shift operation in one or the other repair area with that area secured, which reduces supervision requirements.
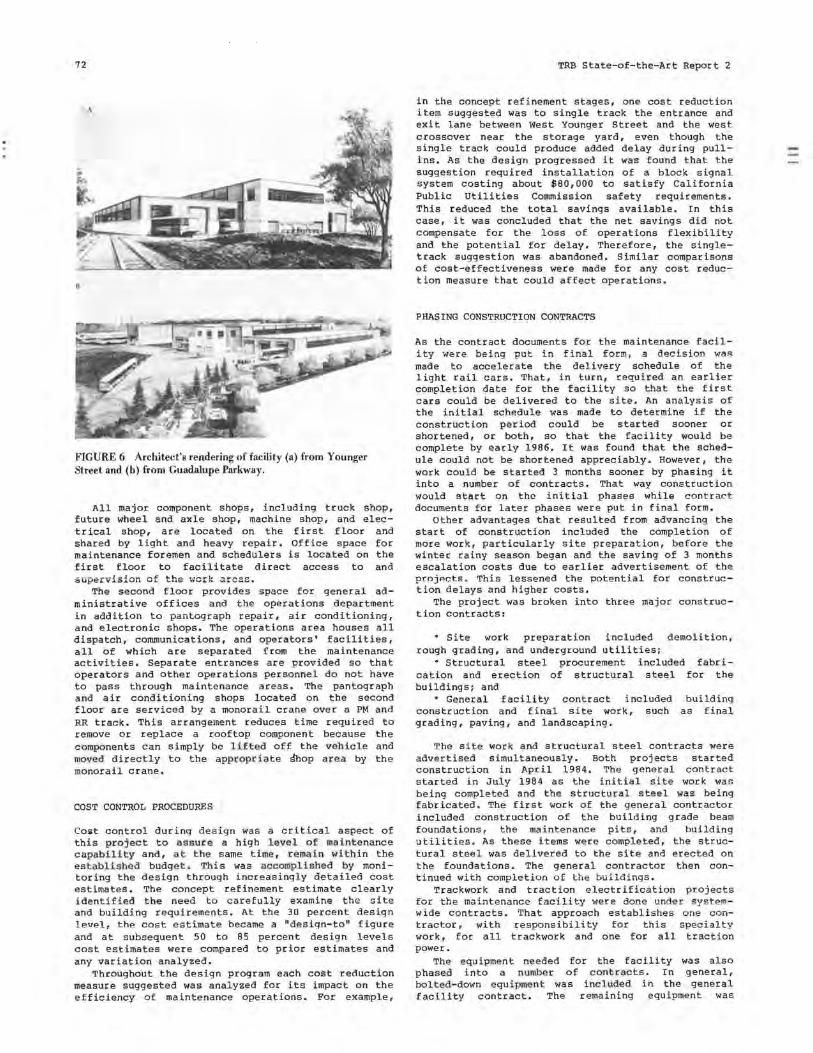
72
FIGURE 6 Architect's rendering of facility (a) from Younger Street and (h) from Guadalupe Parkway.
All major component shops, including truck shop, future wheel and axle shop, machine shop, and electrical shop, are located on the first floor and shared by light and heavy repair. Office space for maintenance foremen and schedulers is located on the first floor to facilitate direct access to and supervision of the work areas.
The second floor provides space for general administrative offices and the operations department in addition to pantograph repair, air conditioning, and electronic shops. The operations area houses all dispatch, communications, and operators' facilities, all of which are separated from the maintenance activities. Separate entrances are provided so that operators and other operations personnel do not have to pass through maintenance areas. The pantograph and air conditioning shops located on the second floor are serviced by a monorail crane over a PM and RR track. This arrangement reduces time required to remove or replace a rooftop component because the components can simply be li.fted off the vehicle and moved directly to the appropriate :fuop area by the monorail crane.
COST CONTROL PROCEDURES
Cost control during design was a critical aspect of this project to assure a high level of maintenance capability and, at the same time, remain within the established budget. This was accomplished by monitoring the design through increasingly detailed cost estimates. The concept refinement estimate clearly identified the need to carefully examine the site and building requirements. At the 30 percent design le"el, the cost estimate became a "desiqn-to" figure and at subsequent 50 to 85 percent design levels cost estimates were compared to prior estimates and any variation analyzed.
Throughout the design program each cost reduction measure suggested was analyzed for its impact on the efficiency of maintenance operations. For example,
TRB State-of~the-Art Report 2
in the concept refinement stages, one cost reduction item suggested was to single track the entrance and exit lane between West Younger Street and the west crossover near the storage yard, even though the single track could produce added delay during pullins. As the design progressed it was found that the suggestion required installa.tion of a block signal system costing about $80,000 to satisfy California Public Utilities Commission safety requirements. This reduced the total savings available. In this case, it was concluded that the net savings did not compensate for the loss of operations flexibility and the potential for delay. Therefore, the singletrack suggestion was abandoned. Similar comparisons of cost-effectiveness were made for any cost reduction measure that could affect operations.
PHASING CONSTRUCTION CONTRACTS
As the contract documents for the maintenance facili t~f were being put in final form, a decision was made to accelerate the delivery schedule of the light rail cars. That, in turn, required an earlier completion date for the facility so that the first cars could be delivered to the site. An analysis of the initial schedule was made to determine if the construction period could be started sooner or shortened, or both, so that the facility would be complete by early 1986. It was found that the schedule could not be shortened appreciably. However, the work could be started 3 months sooner by phasing it into a number of contracts. That way construction would start on the initial phases while contract documents for later phases were put in final form.
Other advantages that resulted from advancing the start of construction included the completion of more work, particularly site preparation, before the winter rainy season began and the saving of 3 months escalation costs due to earlier advertisement of the projects. This lessened the potential for construct ion delays and higher costs.
The project was broken into three major construction contracts:
• Site work preparation included demolition, rough grading, and underground utilities;
• Structural steel procurement included fabrication and erection of structural steel for the buildings; and
• General facility contract included building construction and final site work, such as final grading, paving, and landscaping.
The site work and structural steel contracts were advertised simultaneously. Both projects started construction in April 1984, The general contract started in July 1984 as the initial site work was being completed and the structural steel was being fabricated. The first work of the general contractor included construction of the building grade beam foundations, the maintenance pits, and building utilities. As these items were completed, the structural steel was delivered to the site and erected on the foundations. The general contractor then continued with completion of the buildings.
Trackwork and traction electrification projects for the maintenance facility were done under systemwide contracts. That approach establishes one contractor, with responsibility for this specialty work, for all trackwork and one for all traction power.
The equipment needed for the facility was also phased into a number of contracts. In general, bolted-down equipment was included in the general facility contract. The remaining equipment was
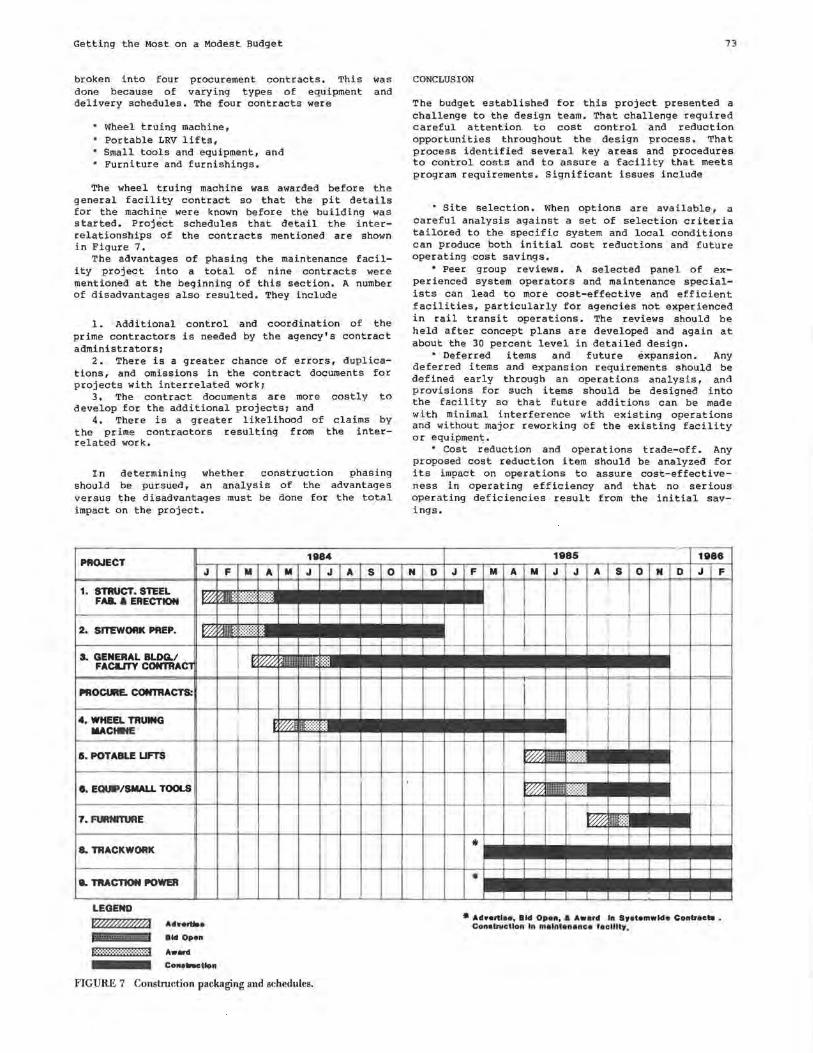
Getting the Most on a Modest Budget
broken into four procurement contracts. This done because of varying types of equipment delivery schedules. The four contracts were
• Wheel truing machine, • Portable LRV lifts, 'Small tools and equipment, and
Furniture and furnishings.
was and
The wheel truing machine was awarded before the general facility contract so that the pit details for the machine were known before the building was started. Project schedules that detail the interrelationships of the contracts mentioned are shown in Figure 7.
The advantages of phasing the maintenance facility project into a total of nine contracts were mentioned at the beginning of this section. A number of disadvantages also resulted. They include
1. Additional control and coordination of the prime contractors is needed by the agency's contract administrators;
2. There is a greater chance of errors, duplications, and omissions in the contract documents for projects with interrelated work;
3. The contract documents are more costly to develop for the additional projects; and
4. There is a greater likelihood of claims by the prime contractors resulting from the interrelated work.
In determining whether construction phasing should be pursued, an analysis of the advantages versus the disadvantages must be done for the total impact on the project.
PROJECT J
1. STRUCT.STEEL FA&. a ERECTION r0-
2. SITEWORK PREP. r0-
S. GENERAL BLDG./ FACLITY CONTRACl
PROCURE. CONTRACTS:
4, WHEEL TRUING 111.ACtafE
15. POTABLE LIFTS
8. EOUF/SMAU TOOLS
7. FURNl'TUAE
8. TRACKWORK
8. TRACTION POWER
LEGEND
Wfrffe&A A4 .......
f Ai& lld Open
L·.·,,.,..,.,···,·,··,·,·,·,i Aw..i
Co11a-tlon
1984
F M A M J J I I
',1!JJJ:::1::::::::,:, :::}:
I
1111Mt;; =:::::::::: ,:
V,W, ::::::
I V//,E 11t=··:: ·:
FIGURE 7 Construction packaging and schedules.
A s 0 l I l
I
I
I
73
CONCLUSION
The budget established for this project presented a challenge to the design team. That challenge required careful attention to cost control and reduction opportunities throughout the design process. That process identified several key areas and procedures to control costs and to assure a facility that meets program requirements. Significant issues include
• Site selection. When options are available, a careful analysis against a set of selection criteria tailored to the specific system and local conditions can produce both initial cost reductions and future operating cost savings.
• Peer group reviews. A selected panel of experienced system operators and maintenance specialists can lead to more cost-effective and efficient facilities, particularly for agencies not experienced in rail transit operations. The reviews should be held after concept plans are developed and again at about the 30 percent level in detailed design.
• Deferred i terns and future expansion. Any deferred items and expansion requirements should be defined early through an operations analysis, and provisions for such i terns should be designed into the facility so that future additions can be made with minimal interference with existing operations and without major reworking of the existing facility or equipment;.
• Cost reduction and operations trade-off. Any proposed cost reduction i tern should be analyzed for its impact on operations to assure cost-effectiveness in operating efficiency and that no serious operating deficiencies result from the initial savings.
1985 1986
N D J F M A M J J A s 0 N D J F I
I . I I
I I
I
l
I I ~ 11~1~m :::::::::::
l I l
,:::::(JIii l ~11111li111
I -I
I I I
~ 1111~::::,
• I l l I I
. 1 I I l I
I I I I I I
• AdYortlee, Bid Ope11, a Award In Bretemwldo Cont.acte . Conelnlctlon In molntonance laclllty.
74
• "Design-to" budget. After completing design development (about 30 percent working drawings), a firm budget should be established as a "design-to" limit. Subsequent design reviews should include cost estimates in increasing detail, and any variation should be analyzed and e>eplained as a basis for appropriate design or budget adjustments.
• Phasing or "fast tracking." Fast tracking can reduce escalation costs and take advantage of seasonal weather conditions. However, multiple phases or contracts can complicate construction coordination and administration. Therefore a fast track decision should be based on an analysis of overall cost-effectiveness, schedule requirements, and construction administration problems.
• Consultant-client relations. A design team that involves the client operations and maintenance personnel in every phase of the project will achieve belter schedule adherence and overall cost control because they are aware of all issues as they develop. This facilities both review and decision making and also assures satisfaction with facility operations.
Applying these concepts to the design process for the Guadalupe Corridor Maintenance Facility Project produced a high-quality product and assured that the Santa Clara County Transit District did "get the most on a modest budget."
APPENDIX
I . Operations plan A. Maintenance of equipment
1. All vehicle-related and repair
maintenance
a. Preventive maintenance/period-ic inspection
b. Running repair c. Scheduled overhaul d. Program changes e. Wreck repair f. Daily inspection
2. Yard operations a. Make and break train for reve
nue service consist b. Moves to shop track c. Moves to clean track
3. Daily car cleaning 4. E (e>etraordinary) cleaning 5. Car washing 6. Car sanding , 7. Vehicle work records and mainte-
nance schedule 8. Vehicle moves to/from shop 9. Shop housekeeping
10. Component shops to support vehicle maintenance
a. Truck shop b. Electric shop c. Machine shop d. Brake shop e. Electronic shop f. A/C shop and pantograph shop
B. Revenue service operations 1. Dispatch 2. Quality control--daily vehicle
inspections for damage and operating malfunctions reporting C. Parts/stores
1. Maintain secured storage 2. Coordinate shipping/receiving of
materials 3. Maintain records of material con
sumption 4. Place orders for required materials
TRB State-of-the-Art Report 2
5. Maintain adequate level of materials for day-to-day operations D. Maintenance of way
1. Main-line and yard trackwork 2. Main-line and yard substations and
electrification 3. Station maintenance 4. Right-of-way maintenance 5. Yard and main-line electrical sys
tems maintenance 6. Signals and communications systems 7. Facility building and grounds main
tenance II. Maintenance and operations department oper
ations associated with yard-related activities A. Pull-out (yard to revenue service)
1. Operator reports to dispatcher before pull-out, receives car number/numbers and location of consist in yard
2. Operator locates consist in yard and performs pre-pull-out inspection, noting deficiencies on defects card
3. Operator gives copy of defects list to yardman assigned to yard by operations during pull-out period
4. Yardman determines if defect is serious enough to retain vehicle in yard or if quick fi>e can be made; maintenance performs quick fi>e if consist can leave on schedule 1 if not, operator is assigned new consist by dispatcher
5. Operator moves consist out of yard into revenue service B. Pull-in (revenue service to yard)
1. Shepperson assigned to daily inspection track meets consist at entrance to daily inspection building and obtains observations on malfunctions during service run
2. Shopper son climbs inspection platform and observes pantograph as operator moves consist into the building
3. Shepperson walks the pit under the consist noting any defects on under-car equipment
4. Simultaneously, operator walks the interior of the car, closing windows, picking up lost items, and noting interior defects
5. Operator returns to front of consist and meets shopperson, noting additional defects on defects card
6. Shepperson releases operator 7. Shepperson takes consist through
car wash and to yard storage location 8. Operator returns to dispatch for
signout 9. Shopper son relays car defects and
consist locations to shop foreman at end of pull-ins
10. Shop admi istration relays consist locations; and oari;; on hold to di&lpatoher before pull-outs C. Daily car cleaning
1. E>eterior car wash performed once daily at end of pull-in inspection by shopperson
2. Interior cleaning performed once daily at pull-in by maintenance department in car storage area; consists of picking up loose i terns, sweeping fleer, cleaning windows, and so forth D. E (extraordinary) cleaning performed
after monthly inspection by maintenance department 1. Window cleaning 2. Scrubbing/waxing flooring
Getting the Most on a Modest Budget
3. Scrubbing/cleaning wain scot and ceiling lines
4. Cleaning fixtures E. Sanding to be performed on an as-needed
basis after pull-ins in the car storage area by mechanical department III. Vehicle-related activities provided in shop
building A. Vehicle functions
1. Preventive maintenance/periodic inspection done monthly, quarterly, semiannually and annually
2. Running repair of items needing repair on an as-needed basis
3. Major repair a. Retrofitting vehicles with new
components b. Wreck repair
4. Overhaul to be performed at 5-year intervals
s. Major truck, air pantograph
component change-out conditioner/compressor
6. Body repair
of and
7. Preparation and repainting necessitated by damage and to replace worn finish
8. Blowdown before preventive maintenance and major repair to remove carbon buildup, dirt, and the like B. Component support shops
1. Truck shop--removal and replacement of axle sets, traction motors, truck hardware, treads on resilient wheels, and so forth
75
2. Electric shop--repair of electrical components
3. Machine shop--repair of mechanical components and modification items
4. Pneumatic repair shop--rebuild brake units and systems
5. Electronic shop--vehicle electronic component repair, wayside signal electronics, fare collection equipment, and so forth
6. Air conditioning shop--repairs to compressors, condensors, and other elements
7. Items to be repaired elsewhere a. Seats and frames b. Overhaul of motors c. Axle and wheel work other than
wheel truing and tread replacement d. Batteries e. Windows f. Overhaul of compressors and
pumps g. Rebuild of condensors and
evaporators C. Vehicle maintenance scheduling
1. Shop superintendent maintains vehicle schedules for preventive maintenance
2. Yard foreman schedules consists such that cars designated for preventive maintenance can be moved to shop •··aiting track areas
3. Shop superintendent maintains running repair reports and schedules running repair work when required
Development of a Rail lransit Plan and Implementation Strategy for Los Angeles County Richard Stanger Ben Darche Los Angeles County Transportation Commission Los Angeles, California
In November 1980 the Los Angeles County Transportation Commission (LACTC) sponsored an initiative, locally known as Proposition A, to improve transit services. The initiative called for a half-cent sales tax increase throughout the county. The proceeds from the tax would go toward reducing bus fares, improving local jurisdictions' transit services, and building a countywide rail transit system.
From Janllary 1 'lR1 to July 1984 the commission developed a basic plan for a systemwide rail network and began its implementation. The purpose of this paper is to summarize how this was done.
APPROACH
The task was approached in three stages, each one logically evolving into the next. The star~ing point was the Proposition A ballot map, the "Future Rail Transit Network." In broad strokes, it outlined 13 generalized transportation corridors. The rail lines for two of the corridors were already known. The Metro Rail subway had previously been identified by the Southern California Rapid Transit District ( SCRTD) and the Urban Mass Transportation Administration as the appropriate transit mode to improve transportation services in its densely populated corridor.
In addition, LACTC had already studied a light rail line from Long Beach to Los Angeles that would connect with the Metro Rail. LACTC had contemplated building the line whether or not Proposition A was validated.
Because it was realized that rail transit projects could not be built in all 13 corridors within the foreseeable future, the firRt st~p was to designate certain high-priority corridors. These corridors warranted rail transit service in the near term. Relevant statistics were derived for the 11 corridors from past studies and future projections. The corridors were then stratified using criteria in the draft regional transportation plan prepared by the Southern California Association of Governments. In April 1983 LACTC·adopted six high-priority corridors.
The work in Stage 2 evaluaten a number of possible rail routes and modes within the first five high-priority corridors. (The Century Freeway corridor was not evaluated at this point.) This work involved engineering studies, cost estimates, pat-
76
ronage forecasts, land use analyses, and the continued involvement of community officials and representatives. In October 1983 the commission adopted the representative route and mode for four of the corridors 1 in January 1984 it did the same for the fifth corridor.
By combining the five representative routes and modes with the Wilshire Metro Rail starter line, the Lonq Beach-Los Angeles light rail line, the El Monte busway, the Harbor bu sway, and the Century Freeway transitway, an interim system of rail lines and busways was formed. The first step in Stage 3 was to evaluate this system to better understand how it might operate, what design requirements would be needed where rail lines or busways intersect, and how the attractiveness of the system of routes might affect patronage estimates for the individual lines.
The second task in Stage 3 was to evaluate the system implications of either a busway-high occupancy vehicle (HOV) facility or a ra.il line-HOV facility within the Century Freeway transitway. This question was the only one not answered by the work of Stage 2 because, to evaluate it, the results of Stage 2 were needed.
The third step in Stage 3 was to take the estimated costs of all these rail lines and compare them with LACTC's projected revenue stream for rail capital. LACTC I s ability to construct more of the Proposition A rail system depends on this, plus the order in which LACTC may wish to implement the segments of the system.
Thus an evaluation was also made of the costeffectiveness of each segment. The ability of LACTC to construct more of the Proposition A rail system is directly related to the amount of Proposition A funds programmed for the two top-priority lines, especially the Metro Rail lin~. Thdl, ln Lurn, may depend on the level of federal funds committed to the Metro Rail, which is not known at this time.
STAGE !--IDENTIFYING HIGH-PRIORITY RAIL CORRIDORS
The work in Stage 1 progressed as follows, First LACTC staff reviewed previous technical reports to derive future congestion levels, transit patronage, and costs. Demographic and land use information was added. A set of er i teria developed by the Southern California Association of Governments (SCAG) , the
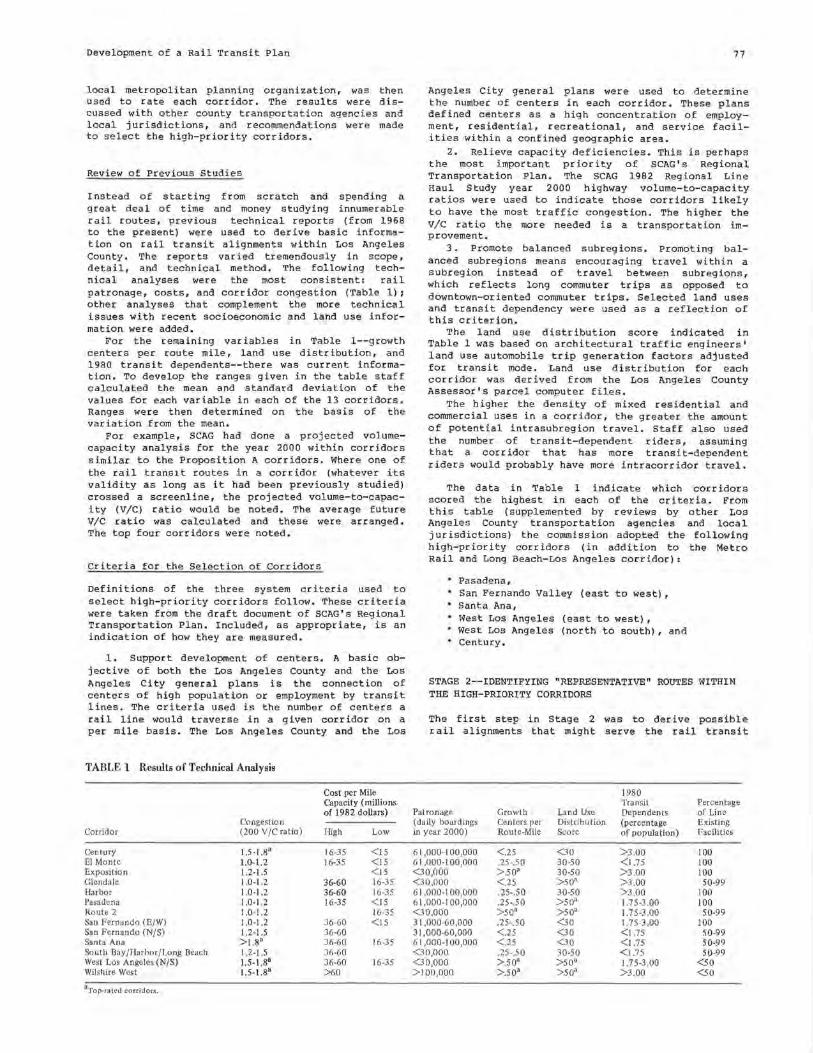
Development of a Rail Transit Plan
local metropolitan planning organization, was then used to rate each corridor. The results were discussed with other county transportation agencies and local jurisdictions, and recommendations were made to select the high-priority corridors.
Review of Previous Studies
Instead of starting from scratch and spending a great deal of time and money studying innumerable rail routes, previous technical reports (from 1968 to the present) were used to derive basic information on rail transit alignments within Los Angeles County. The reports varied tremendously in s cope, detail, and technical method. The following technical analyses were the most consistent: rail patronage, costs, and corridor congestion (Table l); other analyses that complement the more technical issues with recent socioeconomic and land use information were added.
For the remaining variables in Table 1--growth centers per route mile, land use distribution, and 1980 transit dependents--there was current information. To develop the ranges given in the table staff calculated the mean and standard deviation of the values for each variable in each of the 13 corridors. Ranges were then determined on the basis of the variation from the mean.
For example, SCAG had done a projected volumecapacity analysis for the year 2000 within corridors similar to the Proposition A corridors. Where one of the rail transit routes in a corridor (whatever its validity as long as it had been previously studied) crossed a screenline, the projected volume-to-capacity (V/C) ratio would be noted. The average future V/ C ratio was calculated and these were arranged. The top four corridors were noted.
Criteria for the Selection of Corridors
Definitions of the three system criteria used to select high-priority corridors follow. These criteria were taken from the draft document of SCAG's Regional Transportation Plan. Included, as appropriate, is an indication of how they are measured.
1. Support development of centers. A basic objective of both the Los Angeles County and the Los Angeles City general plans is the connection of centers of high population or employment by transit lines. The criteria used is the number of centers a rail line would traverse in a given corridor on a per mile basis. The Los Angeles County and the Los
TABLE 1 Results of Technical Analysis
Cost per Mile Capacity (millions of 1982 dollars)
Congestion Corridor (200 V /C ratio) High Low
Century 1.5-1.8" 16-35 <IS El Monte 1.0-1.2 16-35 <IS Exposition 1.2-1.5 <JS Glendale 1.0-1.2 36-60 16-35 Harbor 1.0-1.2 36-60 16-35 Pasadena 1.0-1.2 16-35 <IS Route 2 1.0-1.2 16-35 San Fernando (E/W) 1.0-1.2 36-60 <15 San Fernando (N/S) 1.2·1.5 36-60 Santa Ana > 1.8" 36-60 16-35 South Bay/Harbor/Long Beach 1.2 -1.5 36-60 West Los Angeles (N/S) 1.5-1.8" 36-60 16-35 Wilshire West 1.5-1.83 >60 9Top~rated corridors.
77
Angeles City general plans were used to determine the number of centers in each corridor. These plans defined centers as a high concentration of employme nt, residential, recreational, and service facilities within a confined geographic area.
2. Relieve capacity deficiencies. This is perhaps the most important priority of SCAG's Regional Transportation Plan. The SCAG 1982 Regional Line Haul Study year 2000 highway volume-to-capacity ratios were used to indicate those corridors likely to have the most traffic congestion. The higher the V/ C ratio the more needed is a transportation improvement.
3. Promote balanced subregions. Promoting balanced subregions means encouraging travel within a subregion instead of travel between subregions, which reflects long commuter trips as opposed to downtown-oriented commuter trips. Selected land uses and transit dependency were used as a reflection of this criterion.
The land use distribution score indicated in Table 1 was based on architectural traffic engineers' land use automobile trip generation factors adjusted for transit mode. Land use distribution for each corridor was derived from the Los Angeles County Assessor's parcel computer files.
The higher the density of mixed residential and commercial uses in a corr i dor, the greater the amount of potential intrasubregion travel. Staff also used the number of transit-dependent riders, assuming that a corridor that has more transit-dependent riders would probably have more intracorridor travel.
The data in Table 1 indicate which corridors scored the highest in each of the criteria. From this table ( supplemented by reviews by other Los Angeles County transportation agencies and local j ur isd ictions) the commission adopted the following high-priority corridors (in addition to the Metro Rail and Long Beach-Los Angeles corridor):
• Pasadena, San Fernando Valley (east to west),
• Santa Ana, • West Los Angeles (east to west),
West Los Angeles (north to south), and • Century.
STAGE 2--IDENTIFYING "REPRESENTATIVE" ROUTES WITHIN THE HIGH-PRIORITY CORRIDORS
The first step in Stage 2 was to derive possible rail alignments that might serve the rail transit
1980 Transit Percentage
Patronage Growth Land Use Dependents of Line (daily boardings Centers per Distribution (percentage Existing in year 2000) Route-Mile Score of population) Facilities
61,000-100,000 <.25 <30 >3.00 100 61,000-100,000 .25-.50 30-50 <us 100 <30,000 >.so• 30-50 >3.00 100 <30,000 <.25 >so• >3.00 50-99 61 ,000-100,000 .25-.50 30-50 >3.00 100 61,000-100,000 .25-,50 >so• 1.75-3.00 100 <30,000 >so• >so• 1.75-3.00 50-99 31,000-60,000 .25-.50 <30 1.75-3 ,00 100 31,000-60,000 <.25 <30 <us 50-99 61,000-100,000 <.25 <30 <us 50-99 <30,000 .25-.50 30-50 <1.75 50-99 <30,000 >.so• >so• 1.7 5-3 .00 < so >100,000 >.so• >so• >3.00 < so
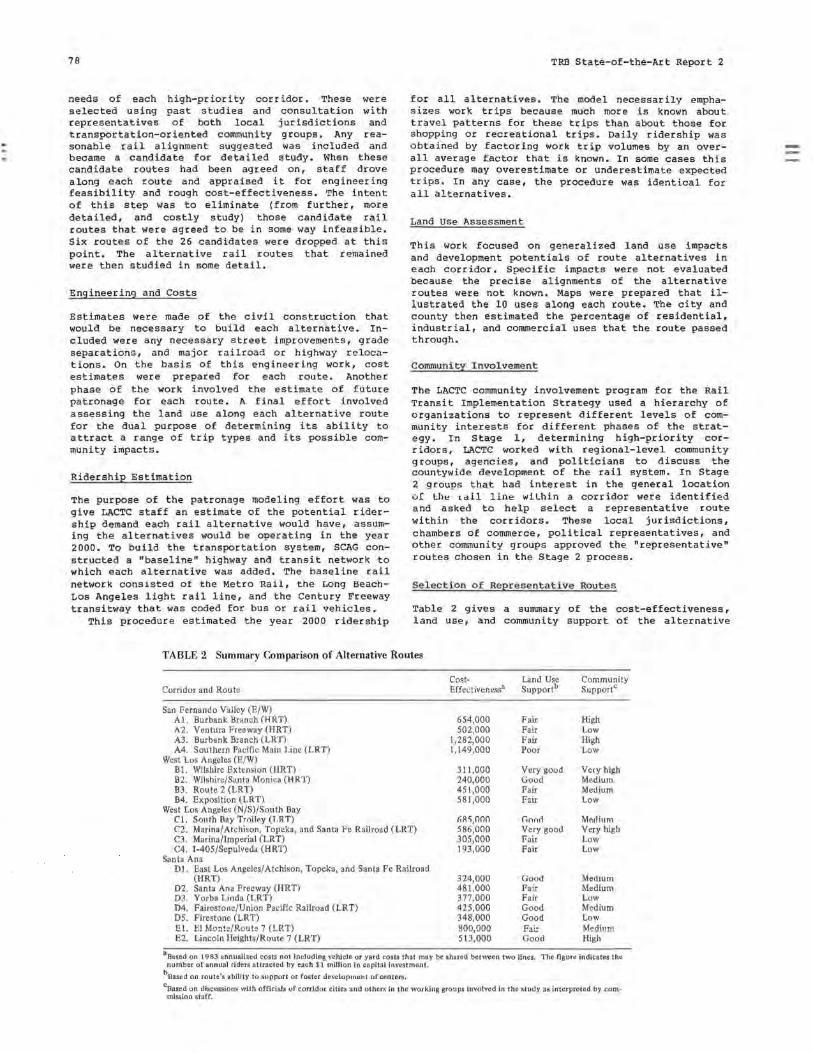
78
needs of each high-priority corridor. These were selected using past studies and consultation with representatives of both local jurisdictions and transportation-oriented community groups. Any reasonable rail alignment suggested was included and became a candidate for detailed study. When these candidate routes had been agreed on, staff drove along each route and appraised it for engineering feasibility and rough cost-effectiveness. The intent of this step was to eliminate ( from further, more detailed, and costly study) those candidate rail routes that were agreed to be in some way infeasible . Six routes of the 26 candidates were dropped at this point. The alternative rail routes that remained were then studied in some detail.
Engineering and Costs
Estimates were made of the civil construction that would be necessary to build each alternative. Included were any necessary street improvements, grade separations, and major r a ilroad or highway relocations. On the basis of this engineering work, cost estimates were prepared for each route. Another phase of the work involved the estimate of future patronage for each route. A final effort involved assessing the land use along each alternative route for the dual purpose of determining its ability to attract a range of trip types and its possible community impacts.
Ridership Estimation
The purpose of the patronage modeling effort was to give LACTC staff an estimate of the potential ridership demand each rail alternative would have, assuming the alternatives would be operating in the year 2000. To build the transportation system, SCAG constructed a "baseline" highway and transit network to which each alternative was added. The baseline rail network consisted of the Metro Ra i l, tne LOng BeachLos Angeles light rail line, and the Century Freeway transitway that was coded for bus or rail vehicles.
This procedure estimated the year 2000 ridership
TRB State-of-the-Art Report 2
for all alternatives. The model necessarily emphasizes work trips because much more is known about travel patterns for these trips than about those for shopping or recreational trips. Daily ridership was obtained by factoring work trip volumes by an overall average factor that is known. In some cases this procedure may overestimate or underestimate expected trips. In any case, the procedure was identical for all alternatives.
Land use Assessment
This work focused on generalized land use impacts and development potentials of route alternatives in each corridor. Specific impacts were not evaluated because the precise alignments of the alternative routes were not known. Maps were prepared that illustrated the 10 uses along each route, The city and county then estimated the percentage of residential, industrial, and commercial uses that the route passed through.
community I nvol ve me n t
The LACTC community involvement program for the Rail Transit Implementation Strategy used a hierarchy of organizations to represent different levels of community interests for different phases of the strategy. In Stage 1, determining high-priority corridors, LACTC worked with regional-level community groups, agencies, and politicians to discuss the countywide development of the rail system. In Stage 2 groups that had interest in the general location or th., Ldil llne wiLhin a con:idor were identified and asked to help select a representative route within the corridors. These local jurisdictions, chambers of commerce, political representatives, and other community groups approved the "representative" routes chosen in the Stage 2 process.
Selection o f Re presen t a tive Routes
Table 2 gives a summary of the cost-effectiveness, land use, and community support of the alternative
TABLE 2 Summary Comparison of Alternative Routes
Corridor and Route
San Fernando Valley (E/W) Al. Burbank Branch (HRT) A2. Ventura Freeway (HRT) A3. Burbank Branch (LRT) A4. Southern Pacific Main Line (LRT)
West Los Angeles (E/W) Bl. Wilshire Extension (HRT) B2. Wilshire/Santa Monica (HRT) B3. Route 2 (LRT) B4. Exposition (LRT)
West Los Angeles (N/S)/South Bay Cl. South Bay Trolle.y (T.RT) C2. Marina/Atchison, Topeka, and Santa Fe Railroad (LRT) C3. Marina/Imperial (LRT) C4. 1-405/Sepulveda (HRT)
Santa Ana DI. East Los Angeles/Atchison, Topeka, and Santa Fe Railroad
(HRT) D2. Santa Ana Freeway (HRT) D3. Yorba Linda (LRT) D4. Fairestone/Union Pacific Railroad (LRT) DS. Firestone (LRT) El. El Monte/Route 7 (LRT) E2. Lincoln Heights/Route 7 (LRT)
CostEffectiveness8
654,000 502,000
1,282,000 1,149,000
311,000 240,000 451,000 581,000
liR'i,000 586,000 305,000 193,000
324,000 481,000 377.000 42s:ooo 348,000 800,000 513,000
Land Use Supportb
Fair Fair Fair Poor
Very good Good Fair Fair
Gnnn Very good Fair Fair
Good Fair Fair Good Good Fair Good
Community Supportc
High Low High Low
Very high Medium Medium Low
M~ninm Very high Low Low
Medium Medium Low Medium Low MPrtl11n,
High
3Based on 1 9 B3 annualized costs not including vehicle or yard costs that may be shared between two lines. The figure indicates the number of annual riders attracted by each $1 million in capital Investment.
bBased on route's ability to support or foster development of centers.
cBased on discussions with officials of corridor cities and others in the working groups involved in the study as interpreted by commission staff.
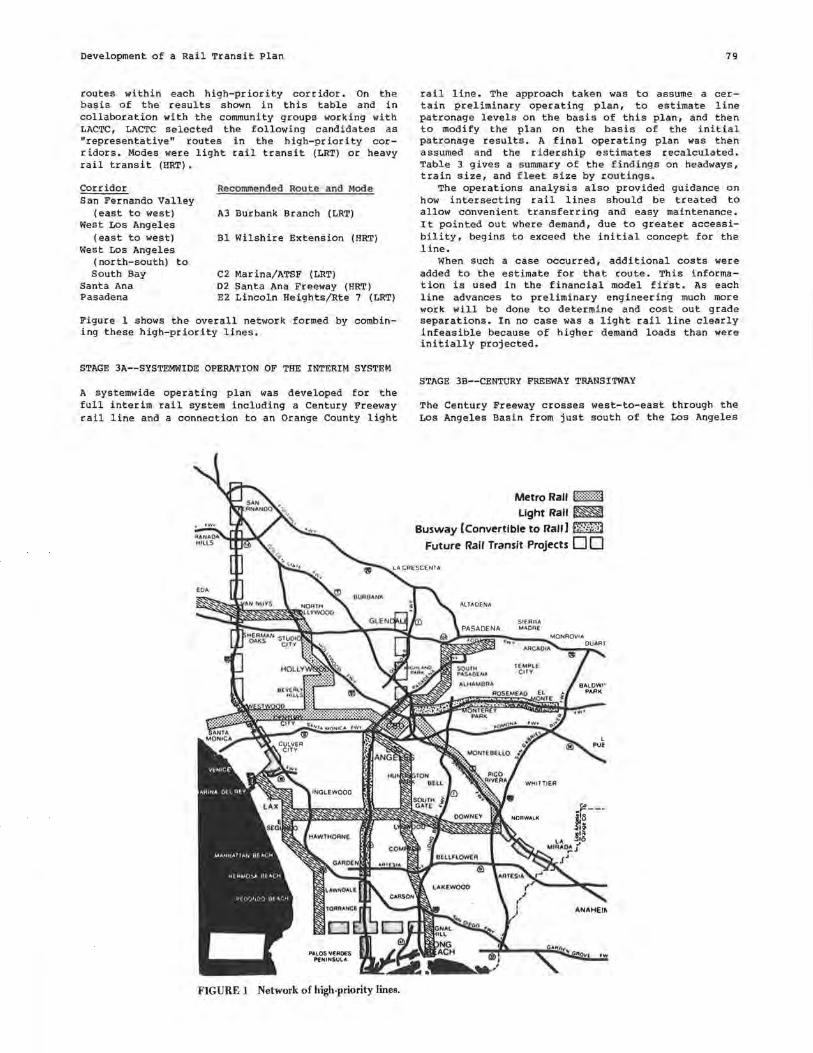
Development of a Rail Transit Plan
routes within each high-priority corridor. On the basis of the results shown in this table and in collaboration with the community groups working with LACTC, LACTC selected the following candidates as "representative" routes in the high-priority corridors. Modes were light rail transit (LRT) or heavy rail transit (HRT).
Corridor San Fernando Valley
( east to west) West Los Angeles
(east to west) West Los Angeles
(north-south) to South Bay
Santa Ana Pasadena
Recommended Route and Mode
A3 Burbank Branch (LRT)
Bl Wilshire Extension (HRT)
C2 Marina/ATSF (LRT) D2 Santa Ana Freeway (HRT) E2 Lincoln Heights/Rte 7 (LRT)
Figure 1 shows the overall network formed by combining these high-priority lines.
STAGE 3A--SYSTEMWIDE OPERATION OF THE INTERIM SYSTEM
A systemwide operating plan was developed for the full interim rail system including a Century Freeway rail line and a connection to an Orange County light
FIGURE 1 Network of high-priority lines.
79
rail line. The approach taken was to assume a certain preliminary operating plan, to estimate line patronage levels on the basis of this plan, and then to modify the plan on the basis of the initial patronage results. A final operating plan was then assumed and the ridership estimates recalculated. Table 3 gives a s ummary of the fi nding s on headways, train size, and fleet size by r out lngs.
The operations analysis also provided guidance on how intersecting rail lines should be treated to allow convenient transferring and easy maintenance. It pointed out where demand, due to greater accessibility, begins to exceed the initial concept for the line.
When such a case occurred, additional costs were added to the estimate for that route. This information is used in the financial model first. As each line advances to preliminary engineering much more work will be done to determine and cost out grade separations. In no case was a light rail line clearly infeasible because of higher demand loads than were initially projected.
STAGE 3B--CENTURY FREEWAY TRANSITWAY
The Century Freeway crosses west-to-east through the Los Angeles Basin from just south of the Los Angeles
Metro Rall f ::::::::::m
Light Rall~ Busway [Convertible to Rall] f);,t',,¥lj
Future Rall Transit Projects O 0
StF.RRA MADRE
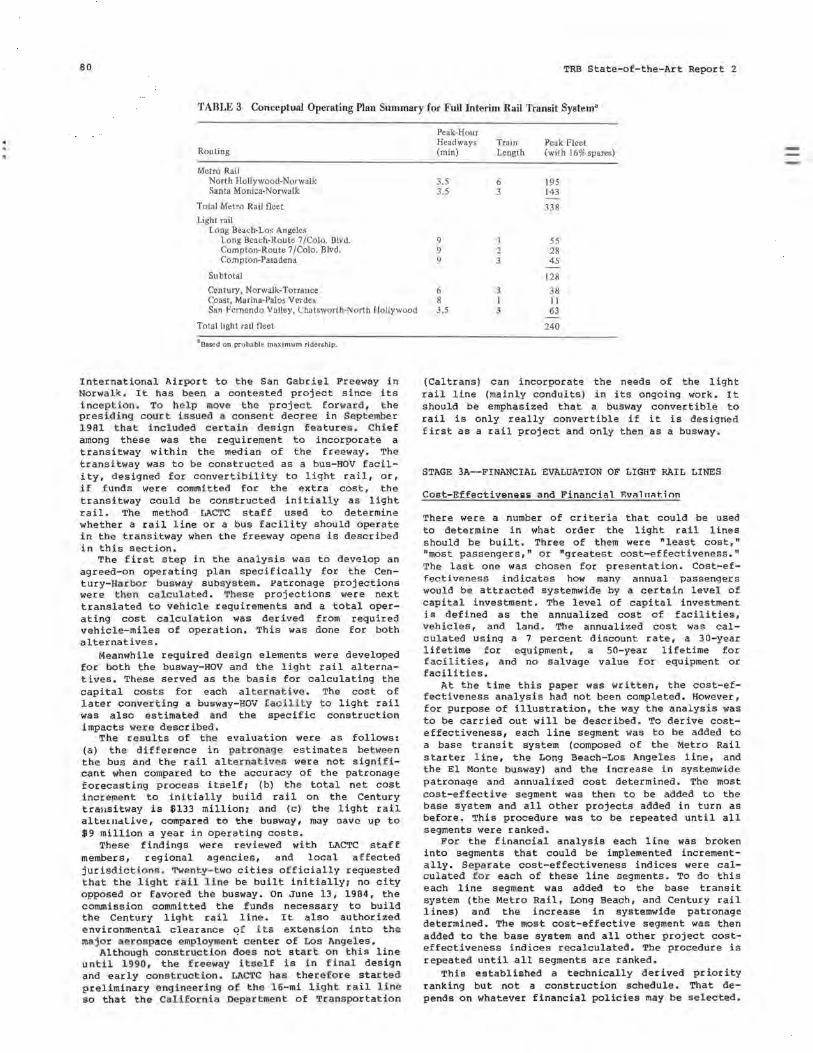
80 TRB State-of-the-Art Report 2
TABLE 3 Conceptual Operating Plan Summary for Full Interim Rail Transit System•
Routing
Metro Rail North Hollywood-Norwalk Santa Monica-Norwalk
Total Metro Rail fleet
Light rail Long Beach-Los Angeles
Long Beach-Route ? /Colo. Blvd. Compton-Route 7/Colo. Blvd. Compton-Pasadena
Subtotal
Century, Norwalk-Torrance Coast, Marina-Palos Verdes San Fernando Valley, Chatsworth-North Hollywood
Total light rail fleet
aBased on probable maximum ridership.
International Airport to the San Gabriel Freeway in Norwalk. It has been a contested project since its inceptio n . To help move the project forwa r d , the presidi ng court issued a consent dec ree in September 1981 tha t included certain des ign f ea tures . Chi ef among these was the requirement to incorporate a transitway within the median of the freeway. The transitway was to be constructed as a bus-HOV facility, designed for convertibility to light rail, or, if funds were committed for the extra cost, the transi tway could be constructed initially as light rail. The method LACTC staff used to determine whether a rail line or a bus facility should operate in the transitway when the freeway opens is described in this section.
The first step in the analysis was to develop an agreed-on operating plan specifically for the Century-Harbor busway subs ystem. Patronage projections were t he n c a lcula ted. The s e projections were next translated to vehicle requirements and a total operating cost calculation was derived from required vehicle-miles of operation. This was done for both alternatives.
Meanwhile required design elements were developed for both the busway-HOV and the light rail alternatives. These served as the basis for calculating the capital cos ts for each alternative. The cost of later converting a busway-HOV f acil i t y to light rail was also estimated and the specific construction impacts we1:e described .
The results of the evaluation were as follows: (a) the difference in pat ronage estimates bet wee n the bus and the rail alternative s were not significant when compared to the accuracy of the patronage forecasting process itself; (b) the total net cost increment to initially build rail on the Century transitway is $133 million; and (c) the light rail altti111dllve, compared to the busway, may oavc up to $9 million a year in operating costs.
These findings were reviewed with LACTC staff members, regional agencies, and local affected jurisdict ion$. 'l'wenty-two cities officially requested that the light r ail line be built initially; no city opposed or favored the busway. On June 13, 1984, the commission committed the funds necessary to build the Century light rail line. It also authorized environmental clearance of its extension into the major aerospace employment center of Los Ange les.
Although construction does not start on this line until 1990, the fr eewa y i ·t s e lf is i n ·f i nal design and early construct i on. LI\.CTC ha s there for e star t e d preliminary engine ering o f the 1 6-mi l .i ght rail line so that the California Depa rtment of Trans portati on
Peak-Hour Headways Train Peak Fleet (min) Length (with 16% spares)
3.5 6 195 3.5 3 143
338
9 3 55 9 2 28 9 3 45
128
6 3 38 8 I 11 J.S 3 63
240
(Caltrans) can incorporate the needs of the light rail line (mainly conduits) in its ongoing work. It should be emphasized that a busway convertible to rail is only really convertible if it is designed first as a rail project and only then as a busway.
STAGE 3A--FINANCIAL EVALUATION OF LIGHT RAIL LINES
Cost-Effectivenei;;i;; and Financial F.vi'llni'lt.ion
There were a number of criteria that could be used to determine in what order the light rail lines should be built. Three of them were "least cost," "most passengers," or "greatest cost-effectiveness." The last one was chosen for presentation. Cost-effectiveness indicates how many annual passengers would be attracted systemwide by a certain level of capital investment. The level of capital investment is defined as the annualized cost of facilities, vehicles, and land. The annualized cost was calculated using a 7 percent discount rate, a 30-year lifetime for equipment, a SO-year lifetime for facilities, and no salvage value for equipment or facilities.
At the time this paper was written, the cost-effectiveness analysis had not been completed. However, for purpose of illustration, the way the analysis was to be carried out will be described. To derive costeffectiveness, each line segment was to be added to a base transit system (composed of the Metro Rail starter line, the Long Beach-Los Angeles line, and the El Monte busway) and the increase in systemwide patronage and annualized cost determined. The most cost-effective segment was then to be added to the base system and all other projects added in turn as before. This procedure was to be repeated until all segments were ranked.
For the financial analysis each line was broken into segments that could be implemented incrementally. Se parate cost-effectiveness indices were calculated f o r each of these line segments. To do this each line segment was added to the base transit system (the Metro Rail, Long Beach, and Century rail lines) and the increase in systemwide patronage determined. The most cost-effective segment was then added to the base system and all other project costeffectiveness indices recalculated. The procedure is repeated until all segments are ranked.
This established a technically derived priority ranking but not a construction schedule. That depends on whatever financial policies may be selected.
-
Development of a Rail Transit Plan
The principal ones are (a) the extent to which the commission uses local funds to pay for the Metro Rail program, (b) the coverage ratio to be used for bonding, and (c) the speed with which the system is built. The financial model evaluates the implications of varying these and other policies for the commission's ability to construct the system faster. Any number of scenarios have been formulated and analyzed. Thus far no firm decisions have been made primarily because of continued uncertainty about the Metro Rail project. However, these finds have been made:
1. The commission can build up to 100 mi of light rail and rapid transit lines by the year 2000. Forty miles are now committed by 1992; added to Metro Rail's starter line, that would be 58 mi.
81
2. It is best for the overall program if progress is made continually and not in a burst of extensive construction. Debt servicing of the intense construction will constrain further building.
3. It is better to build the high-cost sections as soon as possible (the LRT downtown tunnel in particular) to lessen the effects of escalation. However, such sections should be constructed incrementally.
4. Because of their cost, extensions of the Metro Rail starter line will require additional federal and state funds, which cannot realistically be expected to be committed before the Metro Rail is well into construction. Incremental extension of Metro Rail both to the east and to the west will be pursued as fast as federal funding permits.
Evaluation of Light Rail Transit for Austin, Texas Alan Wulkan Capital Metro Austin, Texas
Lyndon Henry Texas Association for Public Transportation Austin, Texas
Although rail transit modes have, for several decades, been considered applicable mainly for larger, high-density conurbations, a number of North American cities of lower density and population have begun implementation or serious consideration of light rail as a feasible component of their urban transit networks. This is due primarily to the typically lower capital characteristics of light rail transit (LRT) and the lower patronage levels that are therefore required for feasibility. Austin, Texas, is one such smaller city in which, after more than a decade of evaluating LRT, actual implementation at last appears to be nearing reality because of the availability of a newly instituted dedicated funding base.
The process through which these developments have occurred, and the factors involved in determining feasibility, provide some insight into the LRT planning process that may be relevant to other medium-sized urban areas. This discussion will deal with these issues, focusing on the specifics of the Austin case but with some view to general applicability. Also of interest is the degree to which private citizens and their organizations have initiated new concepts, maintained public interest in light rail, and interacted with official staff and decision makers in the planning process.
KEY PLANNING ISSUES
An overview of the background of the development of the LRT concept in Austin, including major issues involved in the evaluation and planning process, will lead into a discussion of the current situation.
Background
In the early 1970s conventional wisdom in Austin, and in the u.s. transport planning profession generally, held that, because of its typically high capital costs, rail transit could only be justified in quite large metropolises with high population densities. Representative of this attitude was the State o-f Texas Public Transportation Development Manual (.!) , prepared in 1971 for the then-existing Texas Mass Transportation Commission (subsequently merged into the Texas State Department of Highways
82
and Public Transportation) by Wilbur Smith & Associates. Declaring that one of the criteria necessary for rail transit was density of more than 14,000 persons per square mile, the manual definitively pronounced that "no Texas city meets these criteria" (.!). Unfortunately, the manual neglected to note that the Lindenwold high-speed heavy rail line had recently been inaugurated, with great success, in a New Jersey suburban area with fewer than 500,000 population and a density of about 2,000 persons per square mile; Atlanta, with only 3,900 persons per square mile central-city density, was proceeding to install rail transit i and, most interestingly, rail transit was already operating successfully in Texas--particularly the highly successful private sur f ace-subway light rail line in Ft. worth, which has a density of less than 2,000 persons per square mile.
Transit was a "hot" issue in Austin at this time. An innovative free-fare shuttle bus system for students had been inaugurated by the University of Texas (UT) and its ridership was soaring, which indicated a potential for the right application of transit in the right opportunity. Austin's private urban system was being ever more heavily subsidized from municipal funds and was e\.Tentually acquired outright by the city in 1973. Although its ridership subsequently increased modestly, it lacked many of the specific rider-attracting features of the UT shuttle bus service (e.g., free fare, exclusively limited-stop operation, frequent headways), and some decision makers and planners exhibited interest in more innovative and ambitious transit possibilities.
Interest in some form of rail rapid transit had been evidenced in Austin as early as 1968, when the leader of the city'!! downtown organization propo!!ed a "oubway conveyance" to move Austinites to, from, and between its major central activity concentrations. These concentrations (Figure 1) combine into a "core area" of 1.8 mi 2 (4. 7 km2
) made up of three powerful traffic-generator subareas: the central business district (CBD) with (in 1980) 24,000 employees, the Capitol Complex (c l uster of state offices) with about 15,000 employees, and the University of Texas campus with some 45,000 students and 20,000 employees. Added to this core area, which is itself an extraordinarily dense activity concentration for a smaller city, is the predominantly linear north-south urban development pattern that is
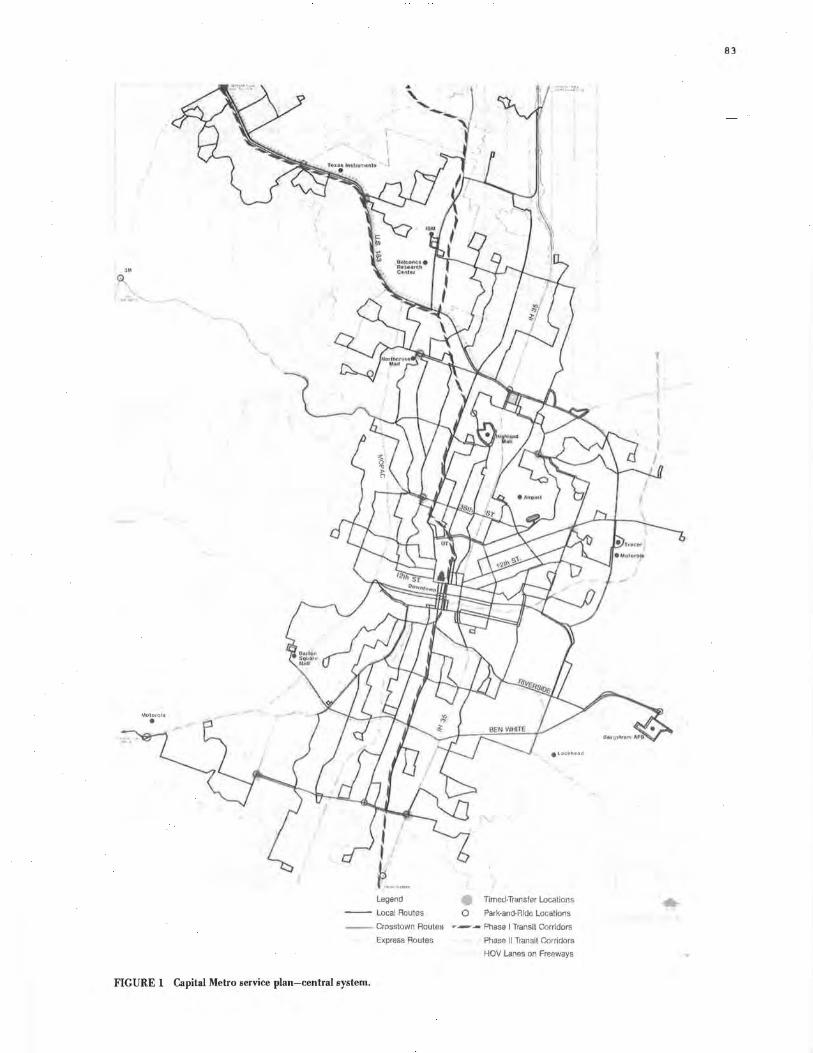
Legend
--- Local Routes 0
Timed-Transfer locations
Park-and-Ride Locations
--- Crosstown Routes r-- Phase I Transit Corridors
Express Routes
FIGURE 1 Capital Metro service plan-central system.
Phase 11 Transit Corridors
HOV Lanes on Freeways
83
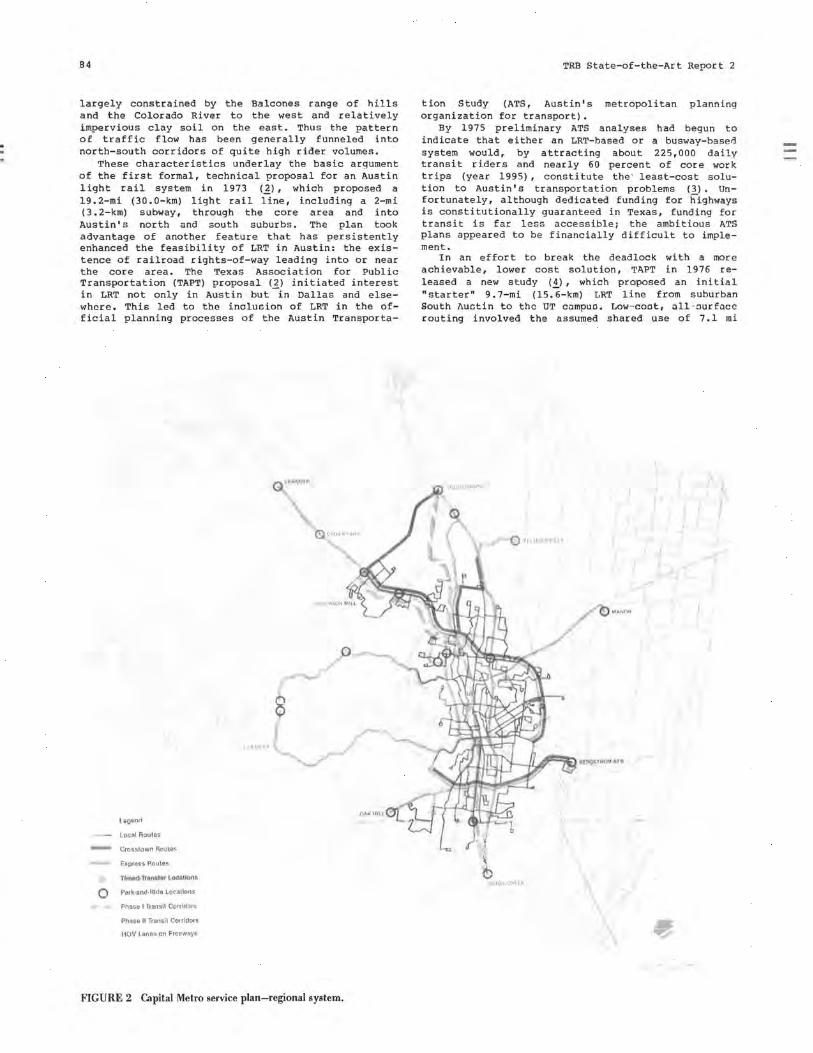
84
largely constrained by the Balcones range of hills and the Colorado River to the west and relatively impervious clay soil on the east. Thus the pattern of traffic flow has been generally funneled into north-south corridors of quite high rider volumes.
These characteristics underlay the basic argument of the first formal, technical proposal for an Austin light rail system in 1973 (~), which proposed a 19.2-mi (30.0-km) light rail line, including a 2-mi (3.2-km) subway, through the core area and into Austin's north and south suburbs. The plan took advantage of another feature that has persistently enhanced the feasibility of LRT in Austin: the existence of railroad rights-of-way leading into or near the core area. The Texas Association for Public Transportation (TAPT) proposal (2) initiated interest in LRT not only in Austin but -in Dallas and elsewhere. This led to the inolucion of LRT in the official planning processes of the Austin Transporta-
liigtilnrl
Local Routes
- Crasslown Routes
ExprGSS Roules
Tlm1Nf, lt0fl~lbf l.ocat le>(t 8i
Q Park-and-Ride Locations
Phase I Transil Corridors
Phase II Transit Corridors
HOV Lanes on Freeways
0
\,'\,:;EWAV
FIGURE 2 Capital Metro service plan-regional system.
TRB State-of-the-Art Report 2
tion Study (ATS, Austin's metropolitan planning organization for transport).
By 1975 preliminary ATS analyses had begun to indicate that either an LRT-based or a busway-based system would, by attracting about 225,000 daily transit riders and nearly 60 percent of core work trips (year 1995), constitute the' least-cost solution to Austin's transportation problems (3). Unfortunately, although dedicated funding for highways is constitutionally guaranteed in Texas, funding for transit is far less accessible; the ambitious ATS plans appeared to be financially difficult to implement.
In an effort to break the deadlock with a more achievable, lower cost solution, TAPT in 1976 released a new study (i), which proposed an initial "starter" 9.7-mi (15.6-km) LRT line from suburban South Auotin to the UT campuo. Low-coot, all-ourfacc routing involved the assumed shared use of 7 .1 mi
~ 1h ...,
0 PftlJGEAVlLL!:
ONION CtH:t,c
O MANDA
...,..
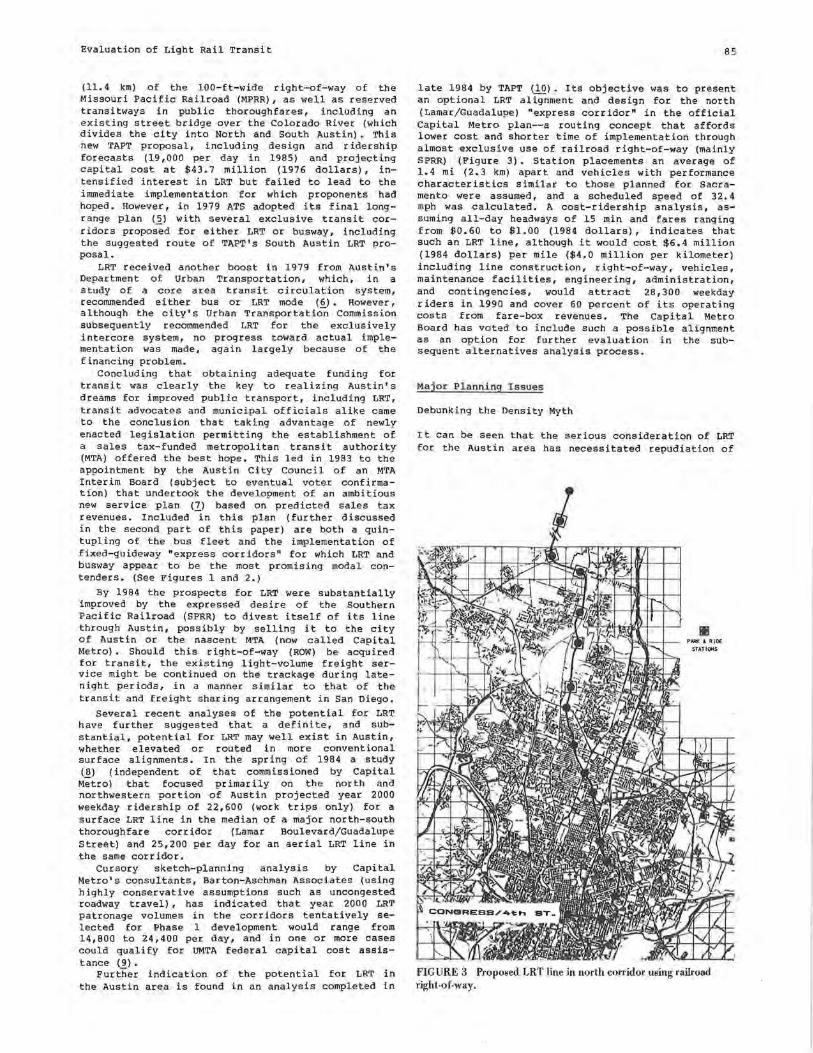
Evaluation of Light Rail Transit
(11.4 km) of the 100-ft-wide right-of-way of the Missouri Pacific Railroad (MPRR), as well as reserved transitways in public thoroughfares, including an existing street bridge over the Colorado River (which divides the city into North and South Austin). This new TAPT proposal, including design and ridership forecasts (19,000 per day in 1985) and projecting capital cost at $43. 7 million ( 1976 dollars), intensified interest in LRT but failed to lead to the immediate implementation for which proponents had hoped. However, in 1979 ATS adopted its final longrange plan (_?_) with several exclusive transit corridors proposed for either LRT or busway, including the suggested route of TAPT's South Austin LRT proposal.
LRT received another boost in 1979 from Austin's Department of Urban Transportation, which, in a study of a core area transit circulation system, recommended either bus or LRT mode (6). However, although the city's Urban Transportation Commission subsequently recommended LRT for the exclusively intercore system, no progress toward actual implementation was made, again largely because of the financing problem.
Concluding that obtaining adequate funding for transit was clearly the key to realizing Austin's dreams for improved public transport, including LRT, transit advocates and municipal officials alike came to the conclusion that taking advantage of newly enacted legislation permitting the establishment of a sales tax-funded metropolitan transit authority (MTA) offered the best hope. This led in 1983 to the appointment by the Austin City Council of an MTA Interim Board (subject to eventual voter confirmation) that undertook the development of an ambitious new service plan (7) based on predicted sales tax revenues. Included in this plan (further discussed in the second part of this paper) are both a quintupling of the bus fleet and the implementation of fixed-guideway "express corridors" for which LRT and busway appear to be the most promising modal contenders. (See Figures 1 and 2.)
By 1984 the prospects for LRT were substantially improved by the expressed desire of the Southern Pacific Railroad (SPRR) to divest itself of its line through Austin, possibly by selling it to the city of Austin or the nascent MTA ( now called Capital Metro). Should this right-of-way (ROW) be acquired for transit, the existing light-volume freight service might be continued on the trackage during latenight periods, in a manner similar to that of the transit and freight sharing arrangement in San Diego.
Several recent analyses of the potential for LRT have further suggested that a definite, and substantial, potential for LRT may well exist in Austin, whether elevated or routed in more conventional surface alignments. In the spring of 1984 a study (8) (independent of that commissioned by Capital M;tro) that focused primarily on the north and northwestern portion of Austin projected year 2000 weekday ridership of 22,600 (work trips only) for a surface LRT line in the median of a major north-south thoroughfare corridor (Lamar Boulevard/Guadalupe Street) and 25,200 per day for an aerial LRT line in the same corridor.
Cursory sketch-planning analysis by Capital Metro's consultants, Barton-Aschman Associates (using highly conservative assumptions such as uncongested roadway travel), has indicated that year 2000 LRT patronage volumes in the corridors tentatively selected for Phase 1 development would range from 14,800 to 24,400 per day, and in one or more cases could qualify for UMTA federal capital cost assistance (9).
Further indication of the potential for LRT in the Austin area is found in an analysis completed in
85
late 1984 by TAPT (10). Its objective was to present an optional LRT alignment and design for the north (Lamar/Guadalupe) "express corridor" in the official Capital Metro plan--a routing concept that affords lower cost and shorter time of implementation through almost exclusive use of railroad right-of-way (mainly SPRR) (Figure 3) • Station placements an average of 1.4 mi (2.3 km) apart and vehicles with performance character is tics similar to those planned for Sacramento were assumed, and a scheduled speed of 32.4 mph was calculated. A cost-ridership analysis, assuming all-day headways of 15 min and fares ranging from $0.60 to $1.00 (1984 dollars), indicates that such an LRT line, although it would cost $6.4 million (1984 dollars) per mile ($4.0 million per kilometer) including line construction, right-of-way, vehicles, maintenance facilities, engineering, administration, and contingencies, would attract 28,300 weekday riders in 1990 and cover 60 percent of its operating costs from fare-box revenues. The Capital Metro Board has voted to include such a possible alignment as an option for further evaluation in the subsequent alternatives analysis process.
Major Planning I s sue s
Debunking the Density Myth
It can be seen that the serious consideration of LRT for the Austin area has necessitated repudiation of
FIGURE 3 Proposed LRT line in north corridor using railroad right-of-way.
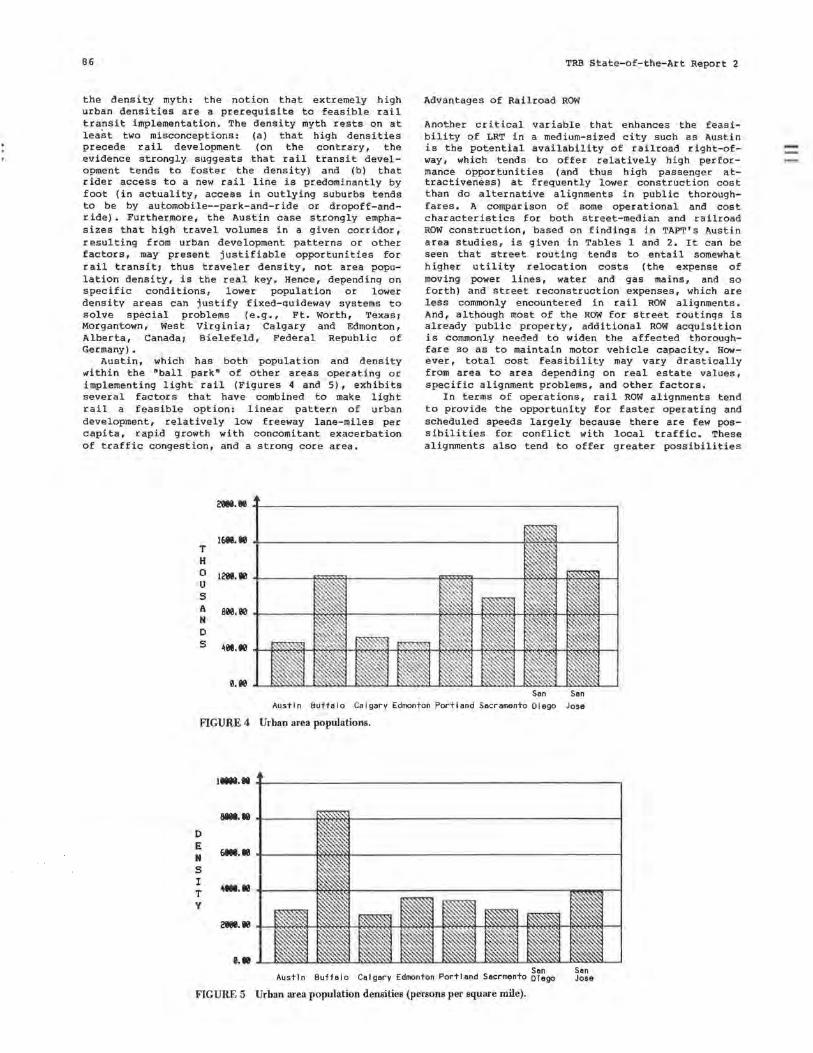
86
the density myth: the notion that extremely high urban densities are a prerequisite to feasible rail transit implementation. The density myth rests on at least two misconceptions: (a) that high densities precede rail development (on the contrary, the evidence strongly suggests that rail transit development tends to foster the density) and (b) that rider access to a new rail line is predominantly by foot (in actuality, access in outlying suburbs tends to be by automobile--park-and-ride or dropoff-andr ide). Furthermore, the Austin case strongly emphasizes that high travel volumes in a given corridor, resulting from urban development patterns or other factors, may present justifiable opportunities for rail transiti thus traveler density, not area population density, is the real key. Hence, depending on specific conditions, lower population or lower density areas can justify fixed-quideway systems to solve special problems (e.g., Ft. worth, Texasi Morgantown, West Virginiai Calgary and Edmonton, Alberta, Canadai Bielefeld, Federal Republic of Germany).
Austin, which has both population and density w-ithin the "ball park" of other areas operating or implementing light rail (Figures 4 and 5), exhibits several factors that have combined to make light rail a feasible option: linear pattern of urban development, relatively low freeway lane-miles per capita, rapid growth with concomitant exacerbation of traffic congestion, and a strong core area.
2011.811
1681.10 T H 0 1281.10 u s A see. e0 N D s ~ell.II
0.110
TRB State-of-the-Art Report 2
Advantages of Railroad ROW
Another er i ti cal variable that enhances the feas ibili ty of LRT in a medium-sized city such as Austin is the potential availability of railroad right-ofway, which tends to offer relatively high performance opportunities (and thus high passenger attractiveness) at frequently lower construction cost than do alternative alignments in public thoroughfares. A comparison of some operational and cost characteristics for both street-median and railroad ROW construction, based on findings in TAP'l''s Austin area studies, is given in Tables 1 and 2. It can be seen that street routing tends to entail somewhat higher utility relocation costs (the expense of moving power lines, water and gas mains, and so forth) and street reconstruction expenses, which are less commonly encountered in rail ROW alignments. And, although most of the ROW for street routings is already public property, additional ROW acquisition is commonly needed to widen the affected thoroughfare so as to maintain motor vehicle capacity. However, total cost feasibility may vary drastically from area to area depending on real estate values, specific alignment problems, and other factors.
In terms of operations, rail ROW alignments tend to provide the opportunity for faster operating and scheduled speeds largely because there are few possibilities for conflict with local traffic. These alignments also tend to offer greater possibilities
San San ~usT!n Buffalo Caigary Edmonton Portland Sacramento Diego Jose
F1GURE 4 Urban area populations.
INll,81
-·· D E
6M.10 N s I
4tN.10 T y
211)1.10
e.10 San San
Austin Buffalo Calgary Edmonton Portland Sacrmento Diego Jose
FIGURE 5 Urban area population densities (persons per square mile).
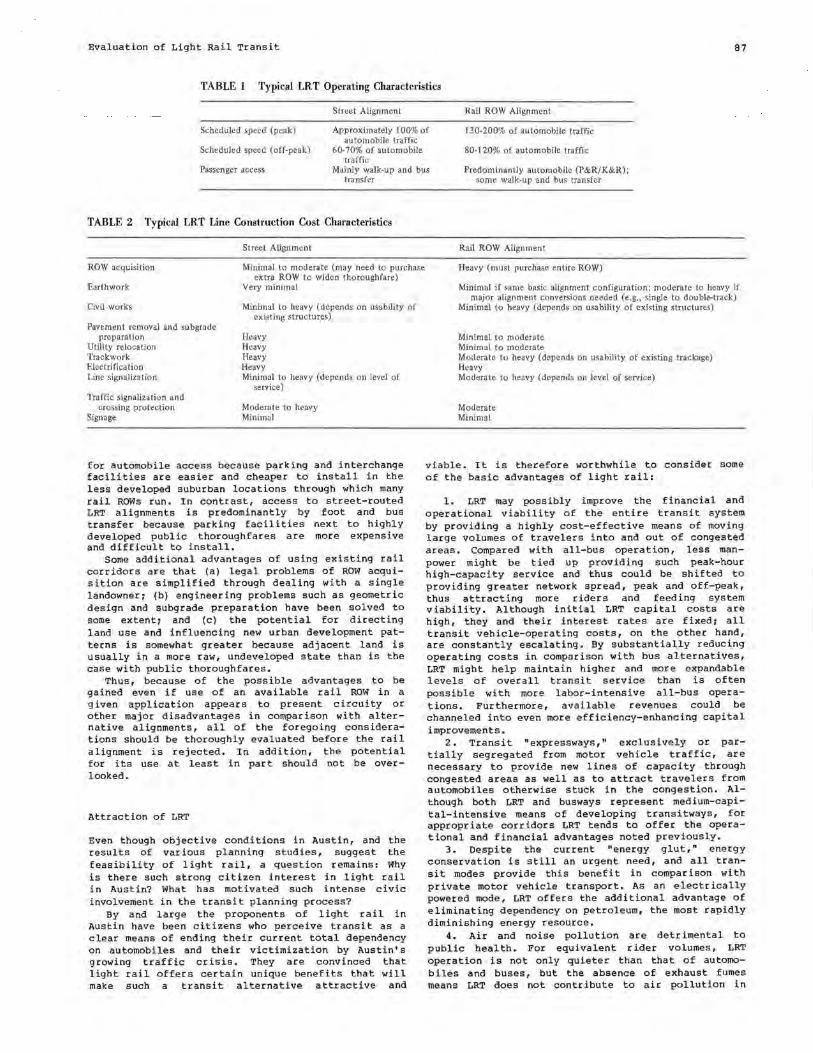
Evaluation of Light Rail Transit 87
TABLE 1 Typical LRT Operating Characteristics
Street Alignment Rail ROW Alignment
Scheduled speed (peak)
Scheduled speed (off-peak)
Approximately I 00% of automobile traffic
60-70% of automobile traffic
130-200% of automobile traffic
80-120% of automobile traffic
Predominantly automobile (P&R/K&R); Passenger access Mainly walk-up and bus transfer some walk-up and bus transfer
TABLE 2 Typical LRT Line Construction Cost Characteristics
ROW acquisition
Earthwork
Civil works
Pavement removal and subgrade preparation
Utility relocation Trackwork Electrification Line signalization
Traffic signalization and crossing protection
Sign age
Street Alignment
Minimal to moderate (may need to purchase extra ROW to widen thoroughfare)
Very minimal
Minimal to heavy (depends on usability of existing structures)
Heavy Heavy Heavy Heavy Minimal to heavy (depends on level of
service)
Moderate to heavy Minimal
for automobile access because parking and interchange facilities are easier and cheaper to install in the less developed suburban locations through which many rail ROWs run. In contrast, access to street-routed LRT alignments is predominantly by foot and bus transfer because parking facilities next to highly developed public thoroughfares are more expensive and difficult to install.
Some additional advantages of using existing rail corridor s are that (a) legal problems of ROW acquisition are simplified through dealing with a single landowner: (b) engineering problems such as geometric design and subgrade preparation have been solved to some extent: and (c) the potential for directing land use and influencing new urban development patterns is somewhat greater because adjacent land is usually in a more raw, undeveloped state than is the case with public thoroughfares.
Thus, because of the possible advantages to be gained even if use of an available rail ROW in a given application appears to present circuity or other major disadvantages in comparison with alternative alignments, all of the foregoing considerations should be thoroughly evaluated before the rail alignment is rejected. In addition, the potential for its use at least in part should not be overlooked.
Attraction of LRT
Even though objective conditions in Austin, and the results of various planning studies, suggest the feasibility of light rail, a question remains: Why is there such strong citizen interest in light rail in Austin? What has motivated such intense civic involvement in the transit planning process?
By and large the proponents of light rail in Austin have been citizens who perceive transit as a clear means of ending their current total dependency on automobiles and their victimization by Austin's growing traffic crisis. They are convinced that light rail offers certain unique benefits that will make such a transit alternative attractive and
Rail ROW Alignment
Heavy (must purchase entire ROW)
Minimal if same basic alignment configuration; moderate to heavy if major alignment conversions needed (e.g., single to double-track)
Minimal to heavy (depends on usability of existing structures)
Minimal to moderate Minimal to moderate Moderate to heavy (depends on usability of existing trackage) Heavy Moderate to heavy (depends on level of service)
Moderate Minimal
viable. It is therefore worthwhile to consider some of the basic advantages of light rail:
1. LRT may possibly improve the financial and operational viability of the entire transit system by providing a highly cost-effective means of moving large volumes of travelers into and out of congested areas. Compared with a ll-bus operation, less manpower might be tied up providing such peak-hour high-capacity service and thus could be shifted to providing greater network spread, peak and off-peak, thus attracting more riders and feeding system viability. Although initial LRT capital costs are high, they and their interest rates are fixed; all transit vehicle-operating costs, on the other hand, are constantly escalating. By substantially reducing operating costs in comparison with bus alternatives, LRT might help maintain higher and more expandable levels of overall transit service than is often possible with more labor-intensive all-bus operations. Furthermore, available revenues could be channeled into even more efficiency-enhancing capital improvements.
2. Transit "expressways," exclusively or partially segregated from motor vehicle traffic, are necessary to provide new lines of capacity through congested areas as well as to attract travelers from automobiles otherwise stuck in the congestion. Although both LRT and busways represent medium-capital-intensive means of developing transitways, for appropriate corridors LRT tends to offer the operational and financial advantages noted previously.
3. Despite the current "energy glut," energy conservation is still an urgent need, and all transit modes provide this benefit in comparison with private motor vehicle transport. As an electrically powered mode, LRT offers the additional advantage of eliminating dependency on petroleum, the most rapidly diminishing energy resource.
4. Air and noise pollution are detrimental to public health . For equivalent rider volumes, LRT operation is not only quieter than that of automobiles and buses, but the absence of exhaust fumes means LRT does not contribute to air pollution in
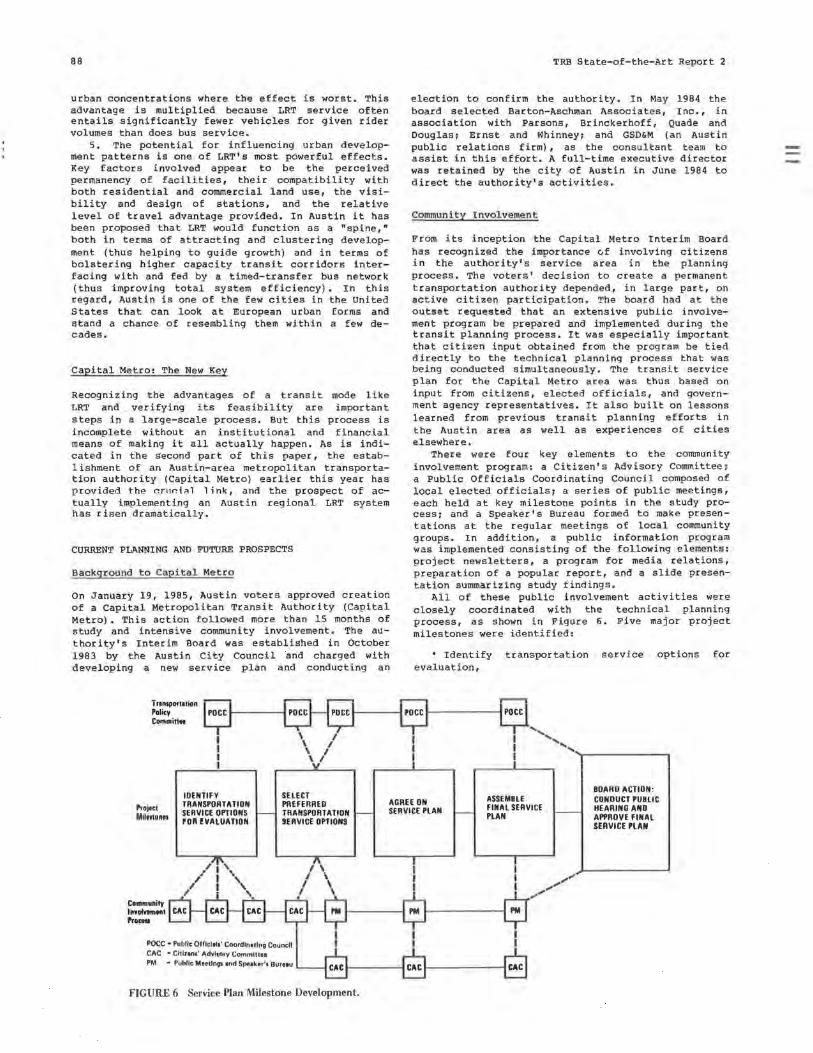
88
urban concentrations where the effect is worst. This advantage is multiplied because LRT service often entails significantly fewer vehicles for given rider volumes than does bus service.
5. The potential for influencing urban development patterns is one of LRT's most powerful effects. Key factors involved appear to be the perceived permanency of facilities, their compatibility with both residential and commercial land use, the visibility and design of stations, and the relative level of travel advantage provided. In Austin it has been proposed that LRT would function as a "spine," both in terms of attracting and clustering development (thus helping to guide growth) and in terms of bolstering higher capacity transit corridors interfacing with and fed by a timed-transfer bus network ( thus improving total system efficiency). In this regard, Austin is one of the few cities in the United States that can look at European urban forms and stand a chance of resembling them within a few decades.
Capital Metro: The New Key
Recognizing the advantages of a transit mode like LRT and . verifying its feasibility are important steps in a large-scale process. But this process is incomplete without an institutional and financial means of making it all actually happen. As is indicated in the second part of this paper, the estab-1 ishment of an Austin-area metropolitan transportation authority (Capital Metro) earlier this year has provided the r.r11r,i<1l 1 ink, and the prospect of actually implementing an Austin regional LRT system has risen dramatically.
CURRENT PLANNING AND FUTURE PROSPECTS
Background t o Capi tal Metr o
On January 19, 1985, Austin voters approved creation of a Capital Metropolitan Transit Authority (Capital Metro). This action followed more than 15 months of study and intensive community involvement. The authority• s Interim Board was established in October 1983 by the Austin City Council and charged with developing a new service plan and conducting an
Transponalion Policy CommittN
I I 'v'
IDENTIFY SELECT
TRB State-of-the-Art Report 2
election to confirm the authority. In May 1984 the board selected Barton-Aschman Associates, Inc., in association with Parsons, Brinckerhoff, Quade and Douglas; Ernst and Whinney; and GSD&M (an Austin public relations firm) , as the consultant team to assist in this effort. A full-time executive director was retained by the city of Austin in June 1984 to direct the authority's activities.
Co mmu nity I nvolvement
From its inception the Capital Metro Interim Board has recognized the importance c,f involving citizens in the authority's service area in the planning process. The voters' decision to create a permanent transportation authority depended, in large part, on active citizen participation. The board had at the outset requested that an extensive public involvement program be prepared and implemented during the transit planning process. It was especially important that citizen input obtained from the program be tied directly to the technical planning process that was being conducted simultaneously. The transit service plan for the Capital Metro area was thus based on input from citizens, elected officials, and government agency representatives. It also built on lessons learned from previous transit planning efforts in the Austin area as well as experiences of cities elsewhere.
There were four key elements to the community involvement program: a Citizen's Advisory Committee; a Public Officials Coordinating Council composed of local elected officials; a series of public meetings, each held at key milestone points in the study process; and a Spea ker's Bureau formed to make presentations at the regular meetings of local community groups. In addition, a public information p rogr am was implemented consisting of the following elements : project newsletters, a program for media relations, preparation of a popular report, and a slide presentation summarizing study f indings.
All of these public involvement activities were closely coordinated with the technical planning process, as shown in Figure 6. Five major project milestones were identified:
• Identify transportation service options for evaluation,
I I -~
I
BOARD ACTION:
l'rojecl Milnlonn
TRANSPORTATION PREFERRED AGREE ON ASSEMBLE CONDUCT PUBLIC FINAL SERVICE HEARING AND SERVICE OPTIONS - TRANSPORTATION
POii !VALUATION SERVICE OPTIONS
Community 1 ............
"'·-
'i' ,. '
POCC • Publlc Offlcl1l1' Coordln11lng Counclt CAC • Citi11n1' Advisory Commlnee PM • Public: Meetlnos and Speaker's Bureau
t'-
-
FIGURE 6 Service Plan Milestone Development .
SERVICE PLAN - PLAN f-APPROVE FINAL SERVICE PLAN
I I -~
Evaluation of Light Rail Transit
'Select preferred transportation service options,
Agree on service plan, ' Assemble final service plan, and ' Conduct public hearing and approve final
service plan.
The process provided the Capital Metro Interim Board with the following four sources of advice before acceptance of a service plan:
'Citizens, through the Citizen's Advisory Committee and grass-roots public involvement activities;
' Elected officials, through the Public Officials Coordinating Council;
The board's own executive director and staff; and
The board's consultants.
Additional public input came from two surveys conducted _in May 1984. The first, a study of Austin Transit System riders, asked transit users about their existing service opinions and desired improvements. It also contained questions on demographic characteristics and final transit origins and destinations (useful also in technical tasks such as ridership forecasting and route planning). The second survey approached a random sample of households in the Capital Metro service area and asked a series of questions about various transportation- and trafficrelated issues (also useful in gauging potential voter support).
Service Development Plan
The service plan that evolved from the foregoing process outlines a series of short-term and long-term transit improvements for Capital Metro's service area. It represents a commitment to expanded and enhanced transit services throughout the Austin region and sketches an extensive program of improvements extending into the next century.
The Short-Term Improvement Program includes transit improvements that can be implemented by 1988: an improved bus system, expanded paratransi t services, and an expanded ridersharing program. Because Austin is becoming the fastest growing city in Texas (and perhaps in the country) , the short-term plan had to stress immediate improvements. Thus a fivefold increase in the bus fleet, expansion to a regional service area of more than 1,000 mi 2 (2592 km 2
),
177 mi ( 285 km) of express service, and much more are planned during the Authority's first 3 years. However, in addition to this ambitious short-term program, an equally ambitious long-term program--including the possibility of light rail--is also planned.
Figure 2 shows the 10 travel corridors selected to be studied for long-term high-level transit improvements. The next phase of planning, alternatives analysis, has begun on the Guadalupe-Lamar corridor, which has been identified as a high-priority corridor in the service plan. Light rail is one of the leading technologies being considered in this study.
Major Planning Considerations
In the first part of this paper some of the primary reasons for which a city the size of Austin is looking at light rail were enumerated. A few points merit emphasis and elaboration. Of particular importance is that a rare opportunity may exist in Austin, which, although growing quickly (43 percent during
89
the past 10 years), still has a metropolitan population of only 600,000. Thus Austin can look at Canadian and Euopean cities, which have planned transit systems to complement land use and transportation needs, and use transit as a powerful tool to manage and guide future growth. Growth management is a critical issue in Austin; unlike the situation in other Texas cities, serious land use planning has begun in order to provide such management of future growth. Transit is viewed as one tool that can be used to implement the growth management plan being developed for Austin.
Will Austinites use light rail or other forms of "express transit"? As noted earlier, sketch-planning work done by Parsons, Brinckerhoff, Quade and Douglas indicates that ridership estimates in the GuadalupeLamar and several other corridors warrant consideration of light rail. This determination is not difficult to understand when it is remembered that Austin has not kept pace with the rest of urban Texas in highway construction. During the 1960s and 1970s a number of efforts to pass local bonds for roadways were defeated, partly out of a desire to restrain growth. In addition, few state-level highway dollars were committed to Austin because of opposition to new highway construction on the part of key Austin area legislators. The result has been fewer highway lane-miles per capita than there are in most other Texas cities. Meanwhile, coupled with the extraordinary population growth of recent years, congestion has reached near-er isis proportions on most major Austin arteries. Vehicle registration has increased by more than 70 percent in the last 10 years, and congestion has increased by more than 100 percent. A doubling of area traffic is projected before the year 2000.
Austin now has the opportunity to implement some form of express transit, a complement to other necessary transportation improvements. Although new highway construction is clearly needed, the expansion of the highway system can be balanced with express transit construction to avoid such massive highway investments as were made in Houston, Dallas, and similar major cities.
Confirmation Election: Key Issues
These concepts were put to the crucial test on January 19, 1985, in the election to confirm or reject creation of Capital Metro and its ambitious service plan. And by a margin of nearly 60 percent Austin area voters approved the proposals. This was indubitably an important victory for public transit, not to be gainsaid; yet it was also not without its weak points, and it is valuable to subject these to some closer scrutiny in hopes that future mistakes, both in Austin and in other localities, will be minimized.
Capital Metro was approved in the city of Austin proper and in several important but small outlying municipalities. It unfortunately failed to pass in Travis County (of which Austin is the county seat) and in several fairly large suburban municipalities.
In many respects voter turnout was a er i tical factor in the character of the vote: almost acrossthe-board Capital Metro passed wherever turnout was high. Turnout in the city of Austin--where the proposal passed by a comfortable margin--was especially high, perhaps reflecting the expenditure of approximately 90 percent of campaign funds on this target area. Also, in Austin proper there was no confusion over who could vote in the election. In contrast, in the surrounding county and in other areas there was considerable confusion as to who could vote for what, which caused may voters to simply stay home.
Likewise, where the pro-Metro campaign was
90
focused (through public involvement programs, speakers' bureau activities, and so forth), the vote tended to go extremely well for the proposal. Within the city of Austin the campaign was probably run as well as humanly possiblei for example, a particularly dramatic advantage was obtaining a former Austin mayor, a well-known community leader, and respected woman opinion-molder to spearhead the campaign committee--a development that brought substantial credibility to the campaign.
On the other hand, the campaign seemed to fall short in focusing on the issues outside the city of Austin. In Travis County the proposal lost 52 to 48 percent in the aggregate of 5 voting units. However, even here the nature of the vote exhibits some redeeming qualities: the vote was extremely close in three of the county voting units, and the pro-Capital Metro vote totally swept an additional unit.
In addition to the loss in Travis County, another major disappointment was the defeat of Capital Metro in Round Rock, the largest suburban municipality, located just north of the city of Austin. Low voter turnout, which probably indicated a leery "waitand-see" attitude, plus some residual anti-Austin feeling (exemplified by newspaper editorials in the vein of "Let's not make another of Austin's mistakes") undoubtedly were major factors in the negative vote here. Yet, in financial and operational terms, the loss of Round Rock might actually turn out to be a gain for the authority, because the lost tax revenue will not equal even 1 percent of the total 1 furthermore, Round Rock residents currently spend more than 75 percent of their sales tax-producing dollars in the city of Austin. Thus, in pffect, Round Rock residents will be paying most of the new tax but will not be directly acquiring the new transit service for their area.
Despite these drawbacks, why did Capital Metro succeed? First, Austin was ready for a regional authority: the transportation problems in the area were clearly regional in scope. Despite Austin's hesitancy to provide highway and other infrastructure improvements to accommodate growth, growth occurred anyway, both inside and around the city's limits.
Second, Austin has always considered itself the most progressive city in Texas. Dallas, Houston, Ft. Worth, and San Antonio have already established metropolitan transportation authorities, and Austin has recognized that it has had an opportunity to create its own authority before traffic problems become as serious as they are in these other cities.
Finally, the decision to rely heavily on community involvement and on striking a balance between shortand long-term improvements has built up public confidence in the plan. Realistic time frames have been
TRB State-of-the-Art Report 2
used in discussing light rail and express transit. Thus people in the region have not felt that the authority was promising service it could not deliver in the short term. However, a true commitment to long-term improvements was also perceived by Austinites.
Although it is still technically undetermined whether Austin will install a light rail system, the · planning process used to date has certainly set the stage for future express transit development. It is hoped that other Sun Belt cities of Austin's approximate size will find this process helpful in the development of their own transit systems.
REFERENCES
1. Wilbur Smith & Associates. State of Texas Public Transportation Development Manual. Texas Mass Transportation Commission, Austin, 1971.
2. L. Henry. CARTRANS: High Speed Transit for the Texas Capital--A Preliminary Feasibility Study for a Capital Area Rapid Transit System. Texas Association for Public Transportationi Rail Foundation, Washington, D.C., 1973.
3. Report on Transportation System Alternatives: Computer Modeling Analyses. Austin Transportation Study Office, Austin, Tex., Jan. 1976.
4. L. Henry. Preliminary Feasibility Study for a South Austin Light Rail Transit Demonstration Line. Texas Association for Public Transportation, Austin, 1976.
5. Long-Range Transportation Plan for Austin/Travis Connty. Ans tin 'T'ransportation Study Office, Austin, Tex., 1979.
6. Proposed Central Area Shuttle System: Preliminary Alternatives Analysis. Austin Department of Urban Transportation, Austin, Tex., Aug. 1979.
7. Capital Metro Service Plan. Barton-Aschman Associates, Inc., Evanston, Ill.1 Capital Metropolitan Transportation Authority, Austin, Tex., Nov. 1984.
B. Analysis of Long Range Transit Improvements for the Guadalupe-North Lamar Corridor. PRC Engineering, Fort Worth, Texi City of Austin, Tex., Sept. 1984.
9. Travel Demand Analysis: Alternatives Tested, Model Runs, and File Inventory. Supplement to Travel Forecasting Methodology. Barton-Aschman Associates, Inc., Evanston, Ill., Oct. 1984.
10. L. Henry. Alternative Light Rail Transit Alignment for North Express Corridor in Austin, Texas: Cost/Ridership Analysis {projected 1990). Texas Association for Public Transportation, Austin, Nov. 1984.
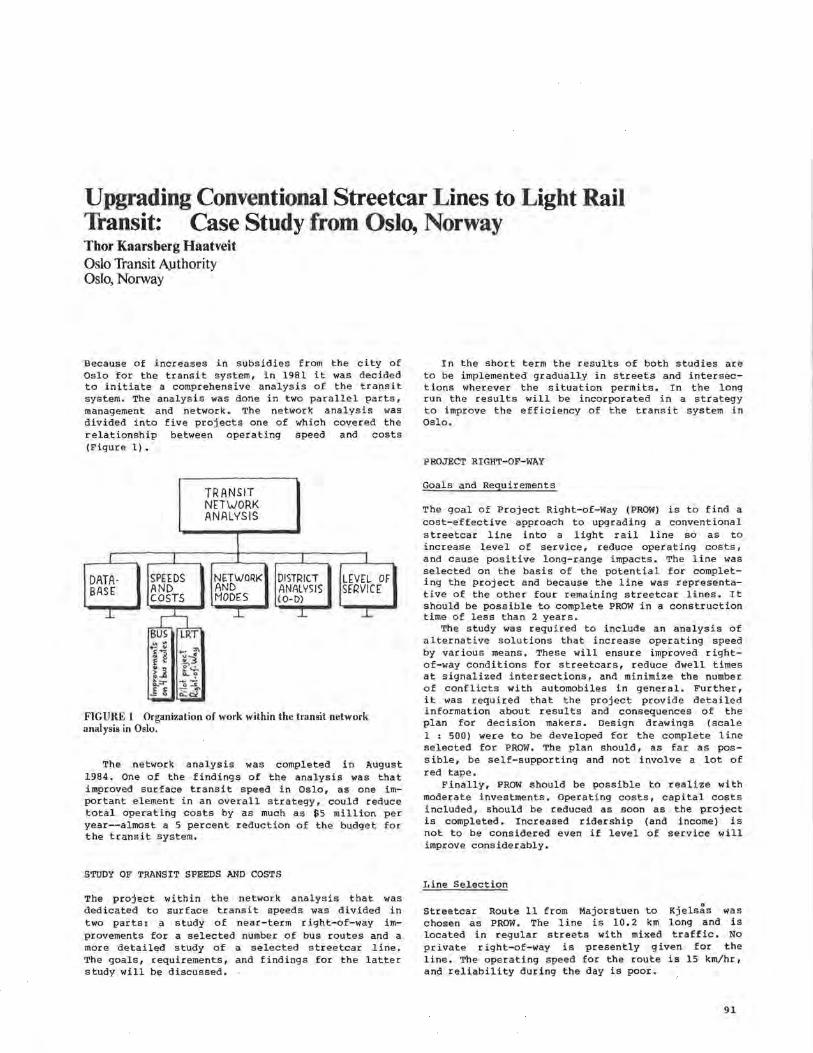
Upgrading Conventional Streetcar Lines to Light Rail Transit: Case Study from Oslo, Norway Thor Kaarsberg Haatveit Oslo Transit AJ.Ithority Oslo, Norway
Because of increases in subsidies from the city of Oslo for the transit system, in 1981 it was decided to initiate a comprehensive analysis of the transit system. The analysis was done in two parallel parts, management and network. The network analysis was divided into five projects one of which covered the relationship between operating speed and costs (Figure 1).
TRANSIT NETWORK ANALYSIS
I I I I I
DATA- SPHDS NETWORK DISTRICi L[VEL OF BASE AND AND ANALYSIS SfRVICE
COSTS MODES (0-D)
_J_
sJs I
JT .J_ _l_ J...
.., ~ 1i .- "' E ~ t-1 u .e~ .... ~ li_::r a~ I:" - ., ~er
FIGURE 1 Organization of work within the transit network analysis in Oslo.
The network analysis was completed in August 1984. One of the findings of the analysis was that improved surface transit speed in Oslo, as one important element in an overall strategy, could reduce total operating costs by as much as $5 million per year--almost a 5 percent reduction qf the budget for the transit system.
STUDY OF TRANSIT SPEEDS AND COSTS
The project within the network analysis that was dedicated to surface transit speeds was divided in two parts: a study of near-term right-of-way improvements for a selected number of bus routes and a more detailed study of a selected streetcar line. The goals, requirements, and findings for the latter study will be discussed.
In the short term the results of both studies are to be implemented gradually in streets and intersections wherever the situation permits. In the long run the results will be incorporated in a strategy to improve the efficiency of the transit system in Oslo.
PROJECT RIGHT-OF-WAY
Goals and Requirements
The goal of Project Right-of-Way (PROW) is to find a cost-effective approach to upgrading a conventional streetcar line into a light rail line so as to increase level of service, reduce operating costs, and cause positive long-range impacts. The line was selected on the basis of the potential for completing the project and because the line was representative of the other four remaining streetcar lines. It should be possible to complete PROW in a construction time of less than 2 years.
The study was required to include an analysis of alternative solutions that increase operating speed by various means. These will ensure improved rightof-way conditions for streetcars, reduce dwell times at signalized intersections, and minimize the number of conflicts with automobiles in general. Further, it was required that the project provide detailed information about results and consequences of the plan for decision makers. Design drawings (scale 1: 500) were to be developed for the complete line selected for PROW. The plan should, as far as possible, be self-supporting and not involve a lot of red tape.
Finally, PROW should be possible to realize with moderate investments. Operating costs, capital costs included, should be reduced as soon as the project is completed. Increased ridership (and income) is not to be considered even if level of service will improve considerably.
Line Selection
Streetcar Route 11 from Majorstuen to Kjels;s was chosen as PROW. The line is 10.2 km long and is located in regular streets with mixed traffic. No private right-of-way is presently given for the line. The operating speed for the route is 15 km/hr, and reliability during the day is poor.
91
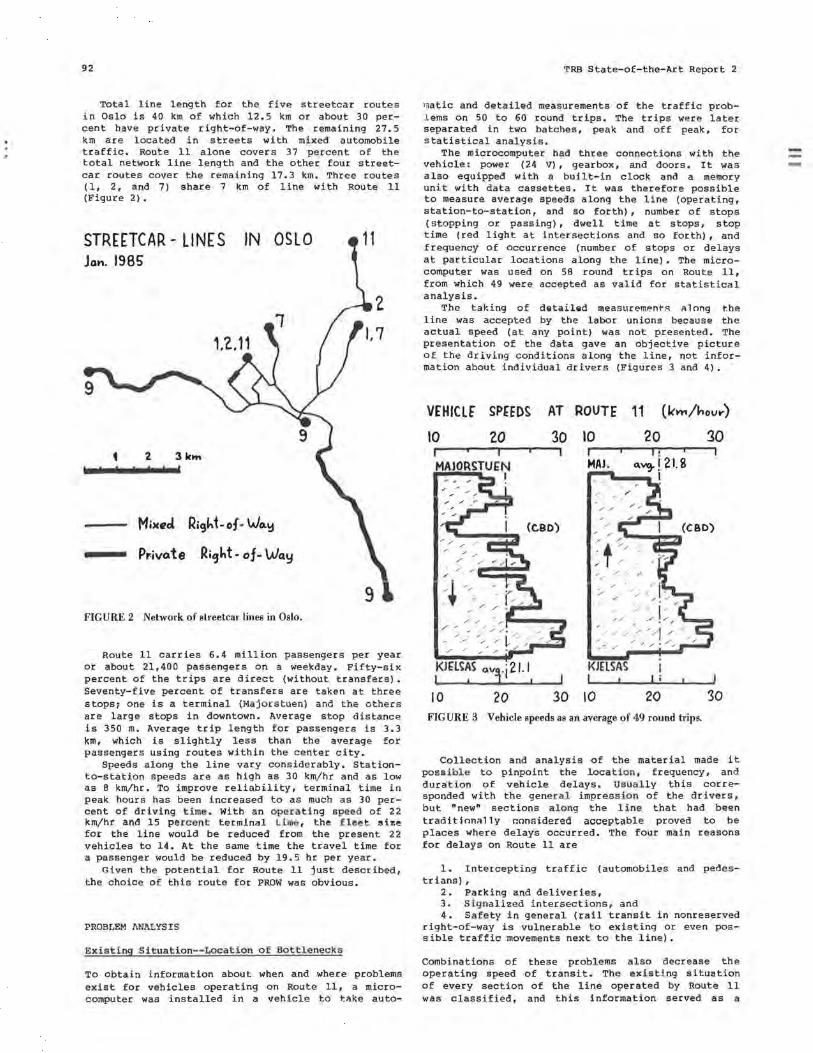
92
Total line length for the five streetcar routes in Oslo is 40 km of which 12.5 km or about 30 percent have private right-of-way . The remaining 27. 5 km are located in streets with mixed automobile traffic. Route 11 alone covers 37 percent of the total network line length and the other four streetcar routes cover the remaining 17.3 km. Three routes (1, 2, and 7) share 7 km of line with Route 11 (Figure 2).
STREETCAR - LINES Jan. 1985
• 2 3km
IN OSLO
M ixeol Right -of· Wo..y
Pr-ivote Ri(Jht- of-Way
FIGURE 2 Network of slreetcar lines in Oslo.
Route 11 carries 6.4 million passengers per year or about 21,400 passengers on a weekday. Fifty-six percent of the trips are direct (without transfers). Seventy-five percent of transfers are taken at three stops; one is a terminal (Majorstuen) and the others are large stops in downtown. Average stop distance is 350 m. Average trip length for passengers is 3.3 km, which is slightly less than the average for passengers using routes within the center city.
Speeds along the line vary considerably. Stationto-station speeds are as high as 30 km/hr and as low as B km/hr. To improve reliability, terminal time in peak hours has been increased to as much as 30 percent of driving time. With an opera ting s peed of 22 km/hr ani, 15 percent terminal Llme , the flee t size for the line would be reduced from the present 22 vehicles to 14. At the same time the travel time for a passenger would be reduced by 19.5 hr per year.
Gi ven the potential for Route 11 just described, the choice of this route for PROW was obvious.
PROBLEM hNALYS!S
Ex is t ing S i t ua t i on--Locat i on o f Bottlenecks
To obtain information about when and where problems exist for vehicles operating on Route 11, a microcomputer was installed in a vehicle to t:11.ke auto-
TRB State-of-the-Art Report 2
''latic and detailed measurements of the traffic probl ems on 50 to 60 round trips. The trips were later separated in two batches, peak and off peak, for statistical analysis.
The microcomputer had three connections with the vehicle: power (24 V), gearbox, and doors. It was also equipped with a built-in clock and a memory unit with data cassettes. It was therefore possible to measure average speeds along the line (operating, station-to-station, and so forth) , number of stops ( stopping or passing) , dwell time at stops, stop time (red light at intersections and so forth), and frequency of occurrence (number of stops or delays at particular locations along the line). The microcomputer was used on 58 round trips on Route 11, from which 49 were accepted as valid for statistical analysis.
The taking of detailed measurement,s 11long the line was accepted by the labor unions because the actual speed (at any point) was not presented. The presentation of the data gave an objective picture o f the driving conditions along the line , not information about individual drivers (Figures 3 and 4).
V£HICLf SPfEOS AT ROUTE 11 (kn,/hovr)
10 20
10 20
30
(CBD)
10 20 . MAJ. ~vg. ! 21. g
, ' I / . , /
//
, /
,/ / / ,,, :..--/.,,/ ,"" I,
/ / ,,, .,.,. '// 1· / /
,/,, / , /~ , , /// / /1 /
~/ / / / /. /.,,
KJELSAS I
30 10 20 FIGURE 3 Vehicle speeds as an average of 49 round trips.
30
30
Collection and analysis of the material made it poss ible to pinpoint the locatio n , frequency, and duration of vehicle delays. Usually this corresponded with the general impress ion of the drivers, but "new" sections along the l i ne that had been tradition11lly ~onsidered acceptable proved to be places where delays occurred. The four main reasons for delays on Route 11 are
1. Intercepting traffic (automobiles and pedes-trians),
2. Parking and deliveries, 3. Signalized intersections, and 4. Safety in general (rail transit in nonreserved
right-of-way is vulnerable to existing or even possible traffic movements next to the line).
Combinations of these problems also decrease the operating speed of transit. The existing situation of every section of the line operated by Route 11 was classified, and this information served as a
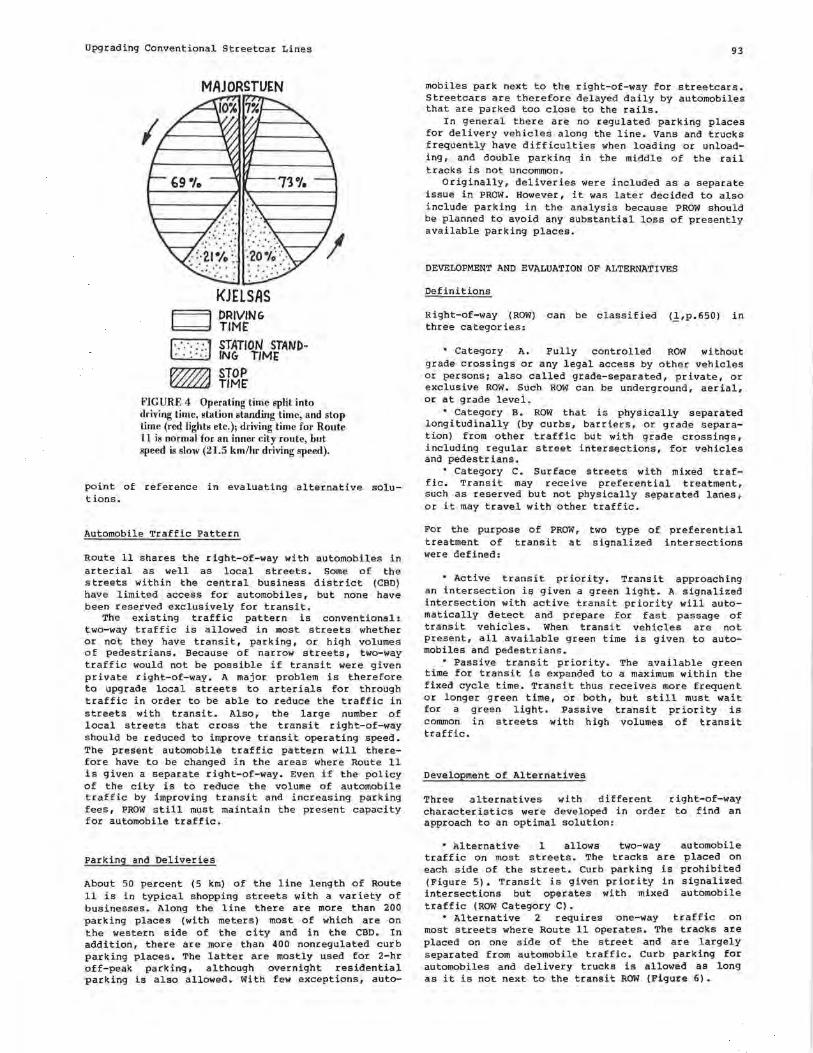
Upgrading Conventional Streetcar Lines
MAJORSTUEN
bd r:-::i ~
~
KJHSAS DRIVING TIME
STATION STANDING TIME
STOP TIME'
FIGURE 4 Operating time split into driving time, station standing time, and stop time (red lights etc.); driving time for Route 11 is normal for an inner city route, hut speed is slow (21.5 km/hr driving speed).
point of reference in evaluating alternative solutions.
Automobile Traffic Pattern
Route 11 shares the right-of-way with automobiles in arterial as well as local streets. Some of the streets within the central business district (CBD) have limited access for automobiles, but none have been reserved exclusively for transit.
The existing traffic pattern is conventional: two-way traffic is allowed in most streets whether or not they have transit, parking, or high volumes of pedestrians. Because of narrow streets, two-way traffic would not be possible if transit were given private right-of-way. A major problem is therefore to upgrade local streets to arterials for through traffic in order to be able to reduce the traffic in streets with transit. Also, the large number of local streets that cross the transit right-of-way should be reduced to improve transit operating speed. The present automobile traffic pattern will therefore have to be changed in the areas where Route 11 is given a separate right-of-way. Even if the policy of the city is to reduce the volume of automobile traffic by improving transit and increasing parking fees, PROW still must maintain the present capacity for automobile traffic.
Parking and Deliveries
About 50 percent (5 km) of the line length of Route 11 is in typical shopping streets with a variety of businesses. Along the line there are more than 200 parking places (with meters) most of which are on the western side of the city and in the CBD. In addition, there are more than 400 nonregulated curb parking places. The latter are mostly used for 2-hr off-peak parking, although overnight residential parking is also allowed. With few exceptions, auto-
93
mobiles park next to the right-of-way for streetcars. Streetcars are therefore delayed daily by automobiles that are parked too close to the rails.
In general there are no regulated parking places for delivery vehicles along the line. Vans and trucks frequently have difficulties when loading or unloading, and double parking in the middle of the rail tracks is not uncommon.
Originally, deliveries were included as a separate issue in PROW. However, it was later decided to also include parking in the analysis because PROW should be planned to avoid any substantial loss of presently available parking places.
DEVELOPMENT AND EVALUATION OF ALTERNATIVES
Definitions
Right-of-way (ROW) can be classified (_!,p.650) in three categories:
' Category A. Fully controlled ROW without grade crossings or any legal access by other vehicles or persons; also called grade-separated, private, or exclusive ROW. Such ROW can be underground, aerial, or at grade level.
' Category B. ROW that is physically separated longitudinally (by curbs, barriers, or grade separation) from other traffic but with grade crossings, including regular street intersections, for vehicles and pedestrians.
Category C. Surface streets with mixed traffic. Transit may receive preferential treatment, such as reserved but not physically separated lanes, or it may travel with other traffic.
For the purpose of PROW, two type of preferential treatment of transit at signalized intersections were defined:
• Active transit priority. Transit approaching an intersection is given a green light. A signalized intersection with active transit priority will automatically detect and prepare for fast passage of transit vehicles. When transit vehicles are not present, all available green time is given to automobiles and pedestrians.
' Passive transit priority. The available green time for transit is expanded to a maximum within the fixed cycle time. Transit thus receives more frequent or longer green time, or both, but still must wait for a green light. Passive transit priority is common in streets with high volumes of transit traffic.
Development of Alternatives
Three alternatives with different right-of-way character is tics were developed in order to find an approach to an optimal solution:
'Alternative 1 allows two-way traffic on most streets. The tracks are each side of the street. Curb parking is (Figure 5). Transit is given priority in intersections but operates with mixed traffic (ROW Category C).
automobile placed on prohibited signalized automobile
• Alternative 2 requires one-way traffic on most streets where Route 11 operates. The tracks are placed on one side of the street and are largely separated from automobile traffic. Curb parking for automobiles and delivery trucks is allowed as long as it is not next to the transit ROW (Figure 6).
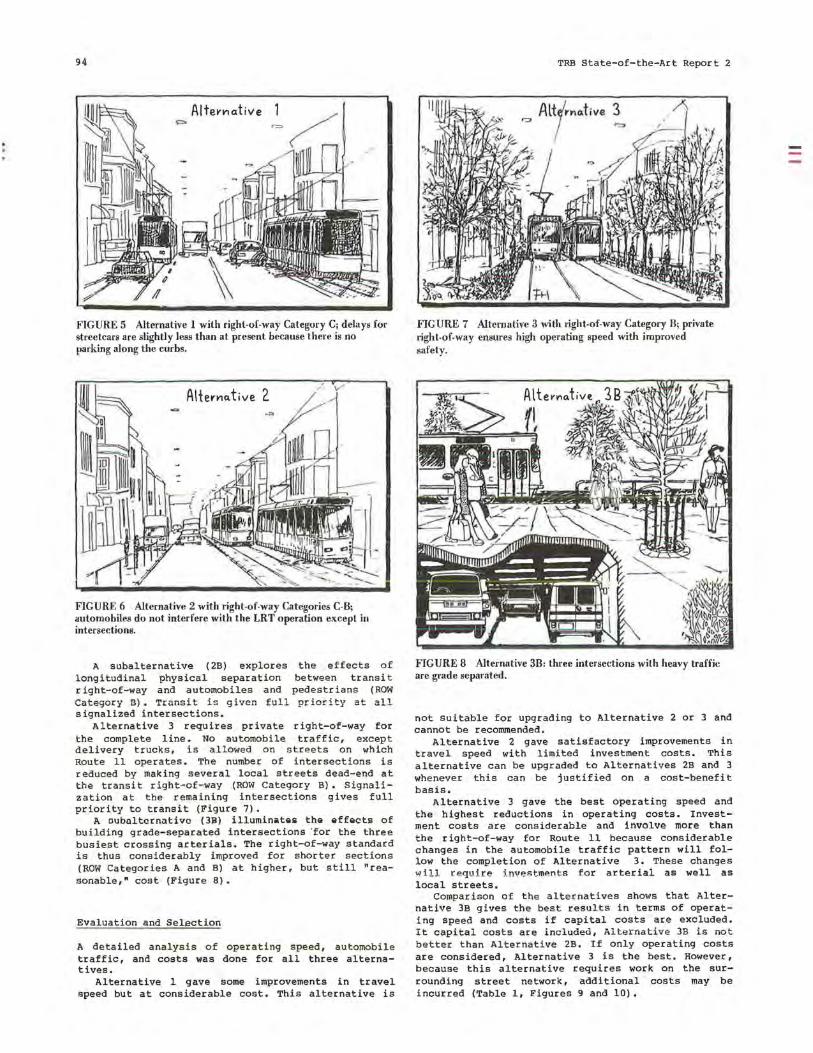
94
Alternative
FIGURE 5 Alternative 1 with right-of-way Category C; delays for streetcars are slightly less than at present because there is no parking along the curbs.
Alternative 2
FIGURE 6 Alternative 2 with right-of-way Categories C-B; automobiles do not interfere with the LRT operation except in intersections.
A subalternative (2Bl explores the effects of longitudinal physical separation between transit right-of-way and automobiles and pedestrians (ROW Category B). Trans it is given full priority at all signalized intersections.
Alternative 3 requires private right-of-way for the complete line. No automobile tra f fic , excep t delivery trucks, is allowed on streets on which Route 11 ope r a t es . The numbe r o f i ntersect i ons i s r educed b y maki ng several local streets dead- end at the transit right- of- way (ROW Category B). Signalizat ion a t the remaining inter s e c t ions gives full priority to transit (Figure 7).
A ouboltcrnativc (JB) illuminatei. the effects of building grade-separated intersections 'for the three busiest crossing arterials. The right-of-way standard is thus considerably improved for shorter sections (ROW Categories A and BJ at higher, but still "reasonable," cost (Figure 8).
Evaluation and Selection
A detailed analysis of operating speed, automobile traffic, and costs was done for all three alternatives.
Alternative 1 gave some improvements in travel speed but at considerable cost. This alternative is
TRB State-of-the-Art Report 2
FIG URE 7 Alternative 3 with right-of-way Category B; private right-of-way ensures high operating speed with improved safety.
FIGURE 8 Alternative 3B: three intersections with heavy traffic are grade separated.
not suitable for upgrading to Alternative 2 or 3 and cannot be recommended.
Alternative 2 gave satisfactory improvements in tr a vel speed with limited investment costs. This alternative can be upgraded to Al t ernat i ves 2B and 3 whe never this can be justified on a cost-benefit basis.
Alternative 3 gave the best operating speed and the highest reductions in operating costs. Investment costs are considerable and involve more than the right- of- way for Route 11 because considerable changes in the automobile traffic pattern will follow the completion of Alternative 3. These changes will require inuestments f o r arterial as well as local streets.
Compa ris on o f t he alternative s shows tha t Alternative 3B gives the best results in t e r ms of ope r a t ing speed and costs if capital costs are excluded. It capital c ost s a r e inc luded, Alternative 3B is not better than Alterna t i ve 2B. If only operating costs are considered, Alternative 3 is the best. However, because this alternative requires work on the surrounding street network, additional costs may be incurred (Table 1, Figures 9 and 10).

Upgrading Conventional streetcar Lines 95
TABLE 1 Investments and Reductions in Costs and Operating Times for Different ROW Alternatives
Investments Savings per (millions) year (millions) Round-Trip Reduction Operating
Travel Time Speed Alternative $US NOK $US NOK (min) Minutes Percentage (km/hr)
1n$/y, ... 1.0 0.8 0,6
0.'I 0.2
!i
Today 1 2 2B 3 3B
i I
2.0 2.4 2.7 3.9 6.9
i --t·-· , . .r---· 10
80.7 19.2 0.2 2.0 72.0 22.9 0.4 3.9 70.3 25.3 0.4 3.9 66.3 37.2 0.6 5.8 61.4 65.2 0.6 5.8 53.7
l!i 20 wi$
FIGURE 9 Relationship between investments and reductions in operating costs for each of the alternatives; the lower curve shows annual reduction if capital costs are included in operating costs.
km/h 22 20 IS 16
14
lncte<1se ,n Of!ero.tin~_s~
o.lterno.tive. 3 2 28
1 I I ! . ~ . J-----·~ .;+1"' I
-·ii i i . . i
5 10
38
i oiher routes j ------;-, , .... eluded. 1
15
i I
20m$
FIGURE 10 Relationship between investments and increases in operating speed. ROW improvements for Route 11 also influence the other routes. The lower curve shows the increase in opcril ling speed for the complete stl'l:etcar network after impl menlll lion of the different al.lernative.s.
Neither of the alternatives in its present form is desirable for achieving an optimal solution. It was subsequently decided to develop a composite of Alternatives 2B and 3. The following elements should, if possible, be included in the alternative:
• Construction costs lower than for Alternative 3,
• Operating speed higher than for Alternative 2B,
Automobile traffic pattern principally as in Alternative 2B but with dead-end local streets as in Alternative 3.
The alternative should be defined in terms of general criteria for design. Thereafter the design for the complete line can be developed.
CRITERIA FOR RIGHT-OF-WAY STANDARD
A set of design elements that includes the most important geometric issues for the project was de-
15.0 8. 7 10.9 16.8
10.4 12.9 17.2 14.1 17.6 18.2 19.3 24.0 19.7 27.0 33.5 22.5
veloped. The establishment of these guidelines was important for two reasons. First, it serves as an initial reference, subject to updating, in the process of making plans for the actual line design . Second, when adjusted and approved, i t may be a future design standa.rd that can be applied and enforced in all construction work that involves the right-of-way for light rail transit (LRT).
Definiti on of Design Elements
Design elements for PROW are as follows:
1. The right-of-way for light rail transit in both directions is preferably located in the same street.
2. The track sets are preferably parallel to each other.
3. If the street has three or more lanes, two ar e reserved for LRT. If the street has two lanes, mixe d traffic may exceptionally be allowed in one l ane.
4. Only local automobile traffic, if any, is allowe d in the lane for LRT. Through traffic is not allowed in streets with LRT unless separate lanes are provided •
5. Parking next to the LRT right-of-way is prohibited •
6. signalized intersections are to be designed with minimum waiting time for LRT.
7. The LRT right-of-way is, wherever possible, to be physically separated from automobile traffic.
8. The street surface for LRT shall be unsui table, but in emergencies possible, to use for automobile traffic.
9. There are to be fences between the LRT right-of-way and the sidewalk.
10. Passenger entry and exit are not allowed to or from an adjacent (to the LRT ROW) automobile lane in the street. Three alternative solutions for design of stops are to be used: (a) The stop is located on the sidewalk wherever the location of tracks allows. ( b) In streets with an automobile lane next to the
LRT ROW at the right side, the sidewalk is extended out to the tracks at the stop. The automobile lane shares the LRT ROW in front of transit stops. (c) In streets wide enough for more than one automobile lane to the right side of the LRT ROW, the transit stop is placed on an island.
PROPOSAL FOR PILOT PROJECT RIGHT-OF-WAY
The design of right-of-way for PROW was done for the complete line with 21 drawings (scale 1 : 500). The drafts were colored and presented in a report in which all sections of the line were discussed in terms of existing situations and problems and recommended solutions and actions. Each block and crossing street was included in the discussion in order to
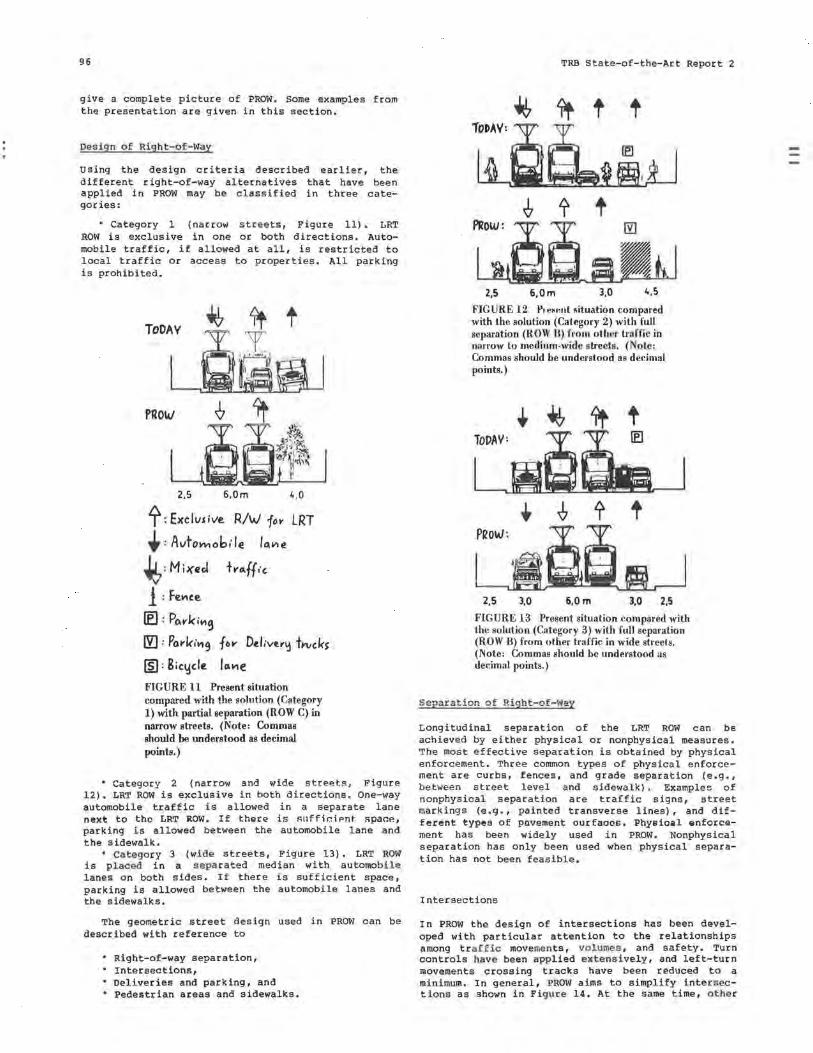
96
give a complete picture of PROW. Some examples from the presentation are given in this section.
Design of Right-of-Way
using the design criteria described earlier, the different right-of-way alternatives that have been applied in PROW may be classified in three categories:
• Category 1 (narrow streets, Figure 11). LRT ROW is exclusive in one or both directions. Automobile traffic, if allowed at all, is restricted to local traffic or access to properties. All parking is prohibited.
ToDAV t
PROW
2,5 6,0m 4,0
1: Exclvsive. R/'vJ for LRT
+' Avtomobi le '""'e t, MiKecl +r11.{f,·c
i : fe.l'ICe.
[e] : Pnrki.,,9
rt]' Pol'ki119 foll' Delive.r11 tn,cks
[fil: &icycle lll11e FIGURE 11 Present situation compared with the solution (Category 1) with partial separation (ROW C) in narrow streets. (Note: Commas should be understood as decimal points.)
• Category 2 (narrow and wide streets, Figure 12). LRT ROW is exclusive in both directions. One-way automobile traffic is allowed in a separate lane next to the LRT ROW. If there is Allffir.iPnt. spac:P., parking is allowed between the automobile lane and the sidewalk.
• Category 3 (wide streets, Figure 13). LRT ROW is placed in a separated median with automobile lanes on both sides. If there is sufficient space, parking is allowed between the automobile lanes and the sidewalks.
The geometric street design used in PROW can be described with reference to
• Right-of-way separation, Intersections,
• Deliveries and parking, and • Pedestrian areas and sidewalks.
TRB State-of-the-Art Report 2
2,S 6,0m 3,0 4,S
FIGURE 12 P, """"t ~ituation compared with the solution (Category 2) with full separation (RO' 13) from oth r trarric in narrow to medium-wide streets. ( otc: Commas should be understood as decimal points.)
TODAY:
P~oW:
2,S 3,0 6,0m 3,0 2,5
FIGURE 13 Present situation compared with the solution (Category 3) with full separation (ROW B) from other traffic in wide streets. (Note: Commas should be understood as decimal points.)
Separation of Right-of-Way
Longitudinal separation of the LRT ROW can be achieved by either physical or nonphysical measures. The most effective separation is obtained by physical enforcement. Three common types of physical enforcement are curbs, fences, and grade separation (e.g., between street level and sidewalk). Examples of nonphysical separation are traffic signs, street markings (e.g., painted transverse lines) , and different types of pavement ourfaocs. Physical enforcement has been widely used in PROW, Nonphysical separation has only been used when physical separation has not been feasible,
Intersections
In PROW the design of intersections has been developed with particular attention to the relationships among traffic movements, volumes, and safety. Turn controls have been applied extensively, and left-turn movements crossing tracks have been reduced to a minimum. In general, PROW aims to simplify intersections as shown in Figure 14, At the same time, other
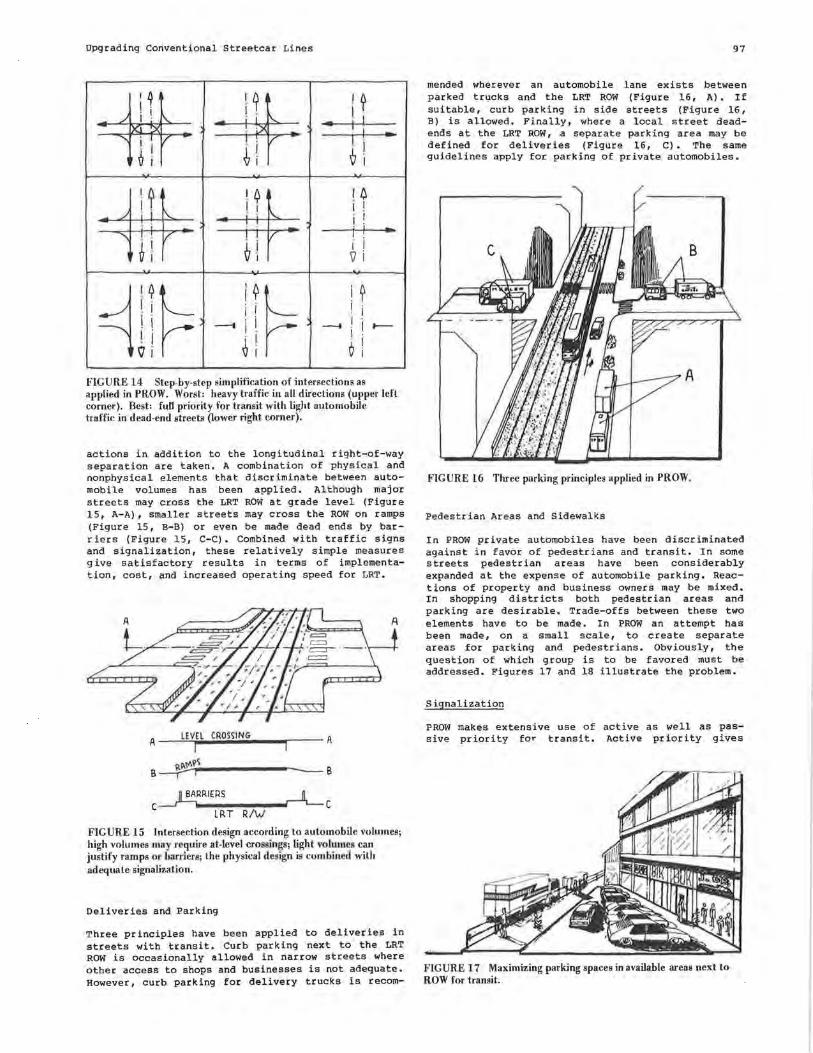
Upgrading Conventional Streetcar Lines
r ~'
+ '? I .
.,I i \ I\.. . l . .. I I )Cl':) . I " • I V •
! I . ! I
1 ~i ii &i
\?
+ ( Ci , I
I\.. i l . ./ i I . I
• i I . . I .. ', I • V I .
bl .
i ! 'iJ l
~l!~ i~~ I ? I
i i i i -Iii __. I i t--
. I i ¢i ~ l
i
FIGURE 14 Step-by-step simplification of intersections as applied in PROW. Worst: heavy traffic in all directions (upper left corner). Best: futl priority for transit with light automobile traffic in dead-end streets (lower right corner).
actions in addition to the longitudinal right-of-way separation are taken. A combination of physical and nonphysical elements that discriminate between automobile volumes has been applied. Although major streets may cross the LRT ROW at grade level (Figure 15, A-A), smaller streets may cross the ROW on ramps (Figure 15, B-B) or even be made dead ends by barriers (Figure 15, C-CJ. Combined with traffic signs and signalization, these relatively simple measures give satisfactory results in terms of implementation, cost, and increased operating speed for LRT.
A UVEL CROSSING A
B 9.p.l'IVS
B
BARRIERS C C
LRT R/W
FIGURE 15 Intersection design according to automobile volumes; high volumes mny require at-level crossings; light volumes can justify ramps or barriers; the physical design is combined with adequate signalization.
Deliveries and Parking
Three principles have been applied to deliveries in streets with transit. Curb parking next to the LRT ROW is occasionally allowed in narrow streets where other access to shops and businesses is not adequate. However, curb parking for delivery trucks is recom-
97
mended wherever an automobile lane exists between parked trucks and the LRT ROW (Figure 16, A) • If suitable, curb parking in side streets (Figure 16, B) is allowed. Finally, where a local street deadends at the LRT ROW, a separate parking area may be defined for deliveries (Figure 16, C). The same guidelines apply for parking of private automobiles.
FIGURE 16 Three parking principles applied in PROW.
Pedestrian Areas and Sidewalks
In PROW private automobiles have been discriminated against in favor of pedestrians and transit. In some streets pedestrian areas have been considerably expanded at the expense of automobile parking. Reactions of property and business owners may be mixed. In shopping districts both pedestrian areas and parking are desirable. Trade-offs between these two elements have to be made. In PROW an attempt has been made, on a small scale, to create separate areas for parking and pedestrians. Obviously, the question of which group is to be favored must be addressed. Figures 17 and 18 illustrate the problem.
Signalization
PROW makes extensive use of sive priority for transit.
active as well as pasActive priority gives
FIGURE 17 Maximizing parking spaces in available areas next to ROW for transit.
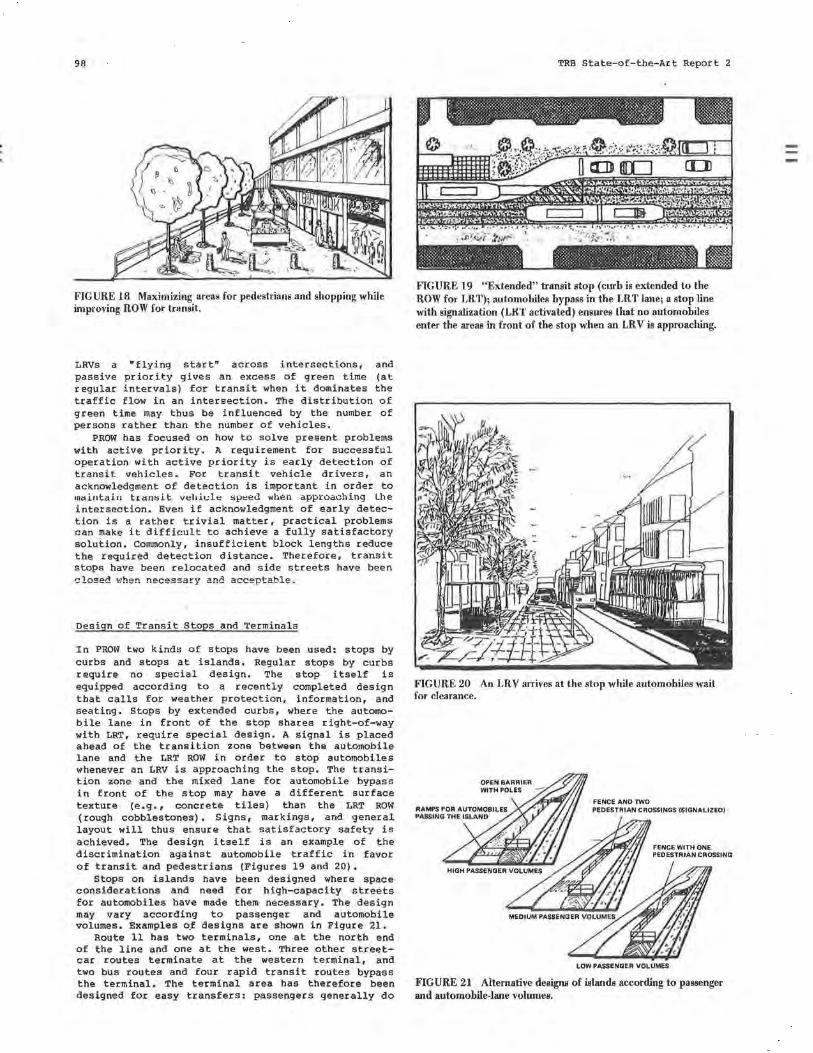
98
FIGURE 18 Maximizing areas for pedestrians and shopping while improving IlOW for transit.
LRVs a passive regular traffic
"flying start" across intersections, priority gives an excess of green time intervals) for transit when it dominates flow in an intersection. The distribution
and (at the of
green time may thus be influenced by the number of persons rather than the number of vehicles.
PROW has focused on how to solve present problems with active priority. A requirement for successful operation with active priority is early detection of transit vehicles. For transit vehicle drivers, an acknowledgment of detection is important in order to mc1.inta.in t1:c1n,;l t v"hlc:l" sp.,e<l when approaching Lhe intersection. Even if acknowledgment of early detection is a rather trivial matter, practical problems can make it difficult to achieve a fully satisfactory solution. Commonly, insufficient block lengths reduce the required detection distance. Therefore, transit stops have been relocated and side streets have been closed when necessary and acceptable~
Design of Transit Stops and Terminals
In PROW two kinds of stops have been used: stops by curbs and stops at islands. Regular stops by curbs require no special design. The stop itself is equipped according to a recently completed design that calls for weather protection, information, and seating. Stops by extended curbs, where the automobile lane in front of the stop shares right-of-way with LRT, require special design. A signal is placed ahead of the transition zone between the automobile lane and the LRT ROW in order to stop automobiles whenever an LRV is approaching the stop. The transition zone and the mixed lane for automobile bypass in front of the stop may have a different surface texture (e.g., concrete tiles) than the LRT ROW ( rough cobblestones). Signs, markings, and general layout will thus ensure that satisfactory safety is achieved. The design itself is an example of the discrimination against automobile traffic in favor of transit and pedestrians (Figures 19 and 20).
Stops on islands have been designed where space considerations and need for high-capacity streets for automobiles have made them necessary. The design may vary according to passenger and automobile volumes. Examples o_f designs are shown in Figure 21.
Route ll has two terminals, one at the north end of the line and one at the west. Three other streetcar routes terminate at the western terminal, and two bus routes and four rapid transit routes bypass the terminal. The terminal area has therefore been designed for easy transfers: passengers generally do
TRB State-of-the-Art Report 2
FIGURE 19 "Extended" transit stop (curb is extended to the ROW for LR T); automobiles bypass in the LR T lane; a stop line with signalization (LK'I' activated) ensures that no automobiles enter the areas in front of the stop when an LR V is approaching.
FIGURE 20 An LRV arrives at the stop while automobiles wait for clearance.
LOW PASSENGER VOLUMES
FIGURE 21 Alternative designs of islands according to passenger and automobile-lane volumes.
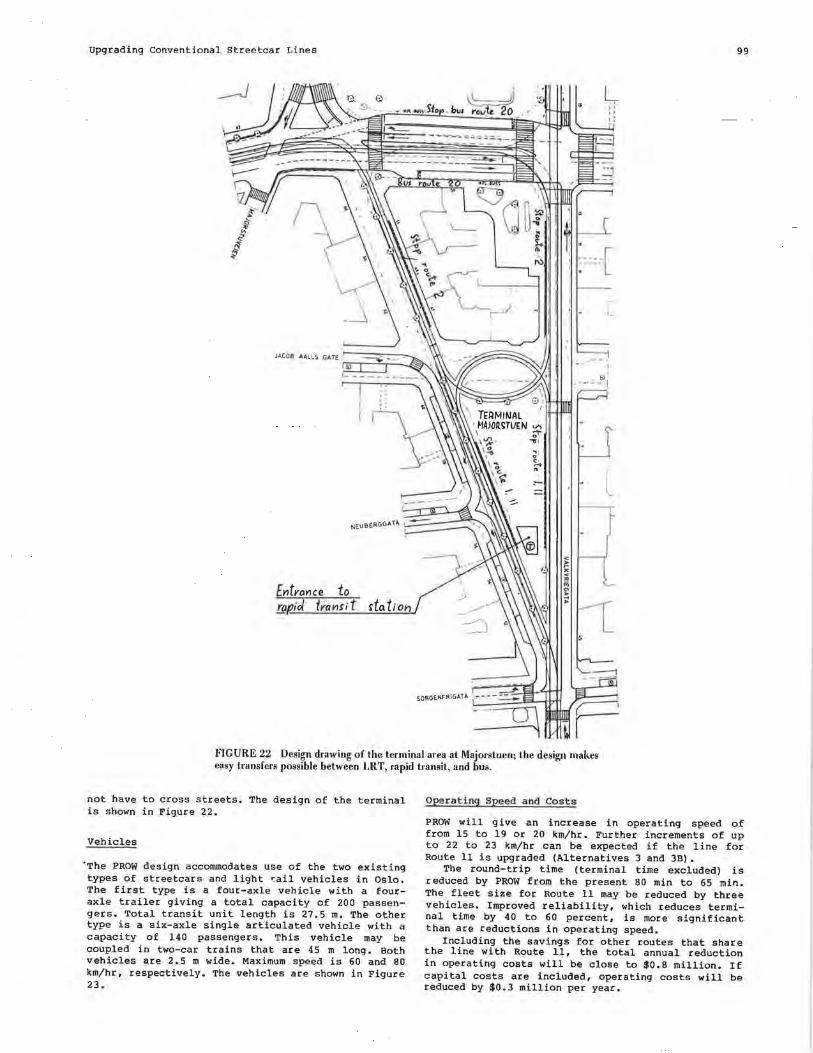
Upgrading Conventional Streetcar Lines 99
' L
~, o' ~ ..
l ,-
Entrance to !PP.Jr;( transd ~to.t; o,.,
FIGURE 22 Design drawing of the terminal area at Majorstuen; the design makes easy transfers possible between LRT, rapid transit, and bus.
not have to cross streets. The design of the terminal is shown in Figure 22.
Vehicles
·The PROW design accommodates use of the two existing types of streetcars and light ~ail vehicles in Oslo. The first type is a four-axle vehicle with a fouraxle trailer giving a total capacity of 200 passengers. Total transit unit length is 27.5 m. The other type is a six-axle single articulated vehicle with a capacity of 140 passengers. This vehicle may be coupled in two-car trains that are 45 m long. Both vehicles are 2.5 m wide. Maximum speed is 60 and BO km/hr, respectively. The vehicles are shown in Figure 23.
Operating Speed and Costs
PROW will give an increase in operating speed of from 15 to 19 or 20 km/hr. Further increments of up to 22 to 23 km/hr can be expected if the line for Route 11 is upgraded (Alternatives 3 and 3B).
The round-trip time (terminal time excluded) is reduced by PROW from the present 80 min to 65 min. The fleet size for Route 11 may be reduced by three vehicles. Improved reliability, which reduces terminal time by 40 to 60 percent, is more significant than are reductions in operating speed.
Including the savings for other routes that share the line with Route 11, the total annual reduction in operating costs will be close to $0.8 million. If capital costs are included, operating costs will be reduced by $0.3 million per year.
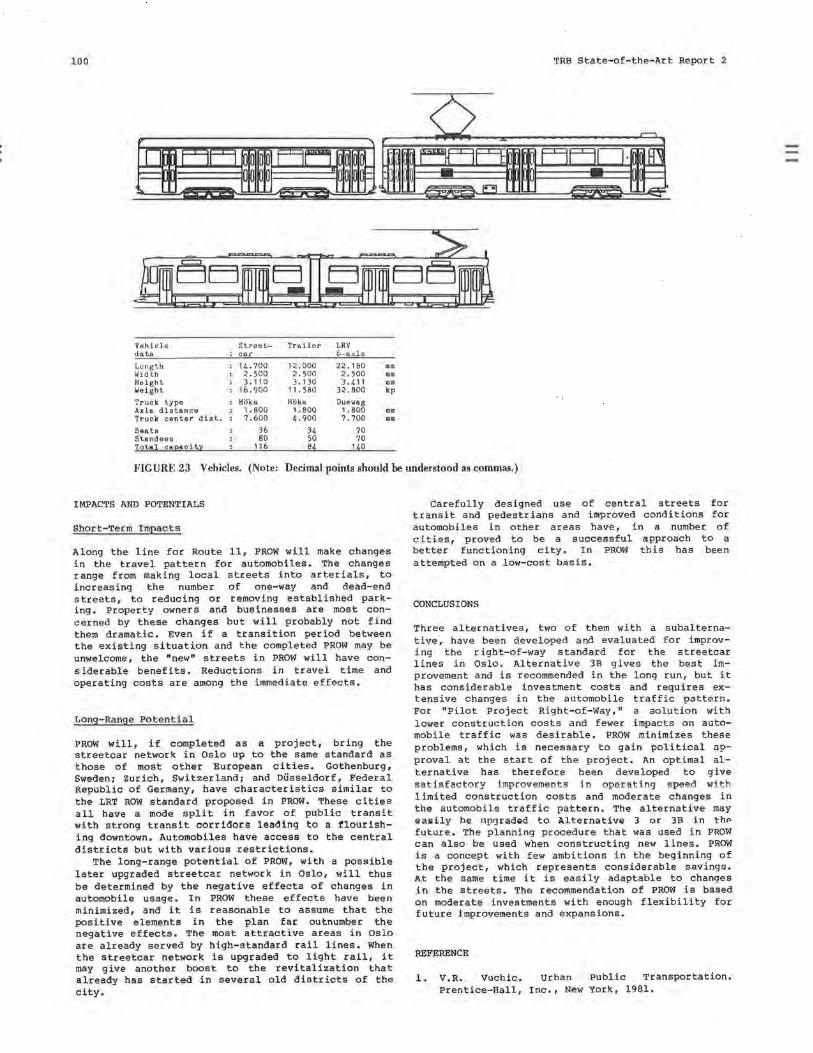
100 TRB State-of-the-Art Report 2
6 I I II I 0 00 Flii 0 .;T?ffl F9F91 l Fri ...
a e- ,____ .... -
' IC ,....,.,
Vehicle Street- Trailer LRV data car 6 axle
Length 14.700 12.000 22.180 mm Width 2.500 2.500 2.500 mm Height J .110 3.130 3.411 mm Weight 16 .900 11. 580 32. BOO kp
Truck type HOka HOka Duewag Axle distance 1.800 1.800 1.800 mm Truck center dist. 7.600 , . 900 7.700 mm
Seats 36 34 70 Standees BO 50 70 Total ca~acit;:t 116 e4 140
FIGURE 23 Vehicles. (Note: Decimal points should he understood as commas.)
IMPACTS AND POTENTIALS
Short-Term Impacts
Along the line for Route 11, PROW will make changes in the travel pattern for automobiles. The changes range from making local streets into arterials, to increasing the number of one-way and dead-end streets, to reducing or removing established parking. Property owners and businesses are most concerned by these changes but will probably not find them dramatic. Even if a transition period between the existing situation and the completed PROW may be unwelcome, the "new" streets in PROW will have considerable benefits. Reductions in travel time and operating costs are among the immediate effects.
Long'-Range Potential
PROW will, if completed as a project, bring the streetcar network in Oslo up to the same standard as those of most other European cities. Gothenburg, Sweden; Zurich, Switzerland; and Dusseldorf, Federal Republic of Germany, have characteristics similar to the LRT ROW standard proposed in PROW. These cities all have a mode split in favor of public transit with strong transit corridors leading to a tlourishing downtown. Automobiles have access to the central districts but with various restrictions.
The long-range potential of PROW, with a possible later upgraded streetcar network in Oslo, will thus be determined by the negative effects of changes in automobile usage. In PROW these effects have been minimized, and it is reasonable to assume that the positive elements in the plan far outnumber the negative effects. The most attractive areas in Oslo are already served by high-standard rail lines. When the streetcar network is upgraded to light rail, it may give another boost to the revitalization that already has started in several old districts of the city.
Carefully designed use of central streets for transit and pedestrians and improved conditions for automobiles in other areas have, in a number of cities, proved to be a successful approach to a better functioning city. In PROW this has been attempted on a low-cost basis.
CONCLUSIONS
Three alternatives, two of them with a subalternative, have been developed and evaluated for improving the right-of-way standard for the streetcar lines in Oslo. Alternative 3B gives the best improvement and is recommended in the long run, but it has considerable investment costs and requires extensive changes in the automobile traffic pattern. For "Pilot Project Right-of-Way," a solution with lower construction costs and fewer impacts on automobile traffic was desirable. PROW minimizes these problems, which is necessary to gain political approval at the start of the project. An optimal alternative has therefore been developed to give satisfactory improvements in operating speed with limited construction costs and moderate changes in the automobile traffic pattern. The alternative may &asily be llp')radad to Alternative 3 or 3B in thP future. The planning procedure that was used in PROW can also be used when constructing new lines. PROW is a concept with few ambitions in the beginning of the project, which represents considerable savings. At the same time it is easily adaptable to changes in the streets. The recommendation of PROW is based on moderate investments with enough flexibility for future improvements and expansions.
REFERENCE
1. V.R. Vuchic. Urban Public Transportation. Prentice-Hall, Inc., New York, 1981.
Application of Transit Operating Cost Models Cynthia Ann Walker Charles M. Trapani, Jr. Gibbs & Hill, Inc. New York, New York
Sheldon Fialkoff Metropolitan Transportation Authority New York, New York
Gordon Schultz Barton-Aschman Associates, Inc. Washington, D.C.
A set of cost models that were developed for the Queens Subway Option Study, in which it was necessary to perform a cost buildup analysis, is described. This analysis entailed the comparison of operating costs of five alternatives with varying use of rapid transit, commuter rail, and bus service. Thus it was important for the models to be absolutely, and not just relatively ("rank-wise") , accurate.
BACKGROUND
Cost models were developed for surface transit (bus), rapid transit, and commuter rail operations. The bus cost model is a three-factor cost model based on bus-miles, bus-hours, and peak-period buses. The rapid transit and the commuter rail operating cost models are cost buildup models that separate costs into activity groups with well-defined functions.
The bus, rapid transit, and commuter rail models were developed to evaluate operating costs for five different transportation alternatives with the degree of accuracy that was required for the Queens Subway Options Study. The models can be used to evaluate complete system operating costs. In the Queens Subway Option Study incremental operating costs were evaluated by inputting the incremental value of the required cost parameters. However, these incremental cost parameters were evaluated by calculating the total value of the input parameter for the desired alternative and subtracting from it the present value of that parameter.
The five alternatives investigated in the Queens Subway Options Study are shown in Figure 1 and are briefly described to facilitate discussion of the application of the cost models in specific instances. It should be noted that this paper is intended only to address the structure and application of the cost models using these five alternatives as examples and not in any way to compare the operating costs or other merits of the five alternatives.
Alternative 1--No Additional Construction
This alternative includes only those projects already built or under construction. Included are the 63rd street subway tunnel from Manhattan to Long Island City in Queens and the Archer Avenue subway in Jamaica. In addition, certain bus routes in Jamacia will be modified to serve the new subway lines.
Alternative 2--Queens Boulevard Line Local Connection
This alternative proposes that the local tracks of the existing Queens Boulevard line be connected to the terminus of the 63rd Street subway in Long Island City. It increases the utilization of the subway system to provide the new service by rerouting current Queens local service to Brooklyn into Manhattan. A number of local trains are added, and local tracks are thus used to their full capacity, Buses are rerouted as in Alternative l.
Alternative 3--Queens Bypass Express
This alternative proposes that a new two-track subway line be built at grade alongside the Long Island Rail Road (LIRR) main line to connect the 63rd Street subway to the Queens Boulevard express lines in Forest Hills. This service differs from Alternative 2 by enriching the express service in eastern Queens instead of the local service in western Queens. Buses are rerouted as in Alternative l.
Alternative 4--Subway-LIRR Montauk Transfer
This alternative proposes that the Montauk branch of the LIRR be electrified for commuter rail operation, employ MU cars, and serve eastern and southeastern Queens. The new commuter rail operation would terminate at a new station in Long Island City where passengers would transfer to a subway that connects
101
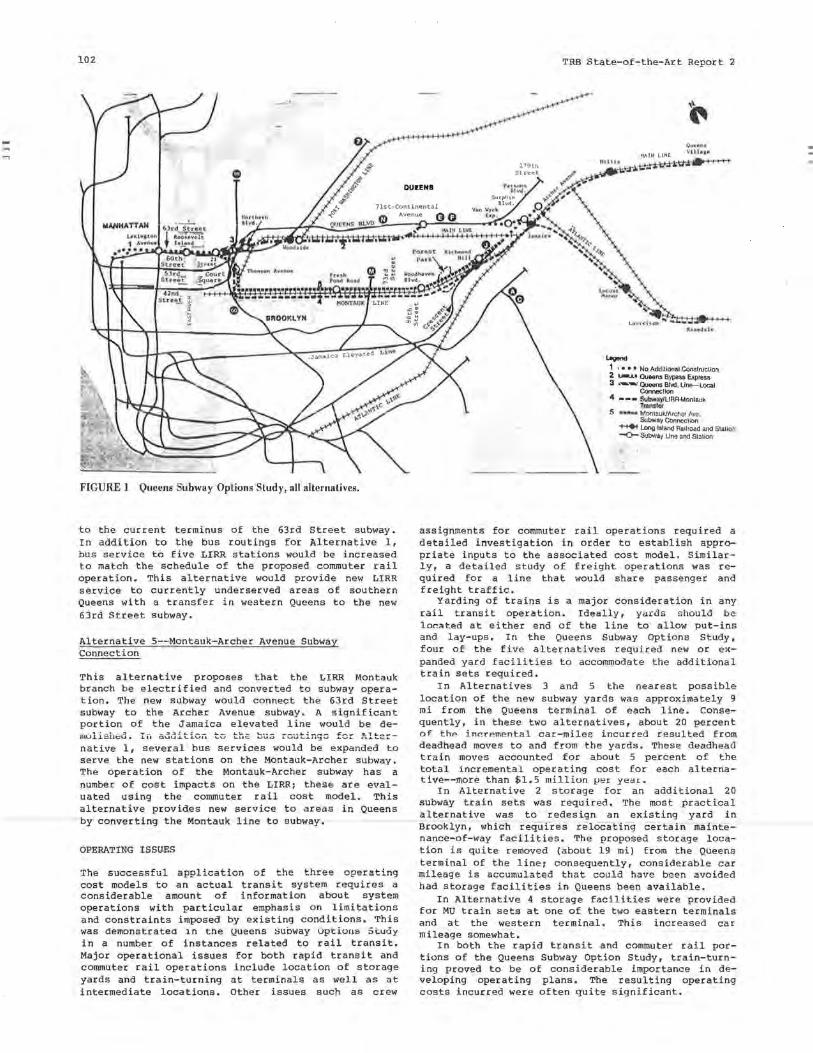
102
FIGURE 1 Queens Subway Options Study, all alternatives.
to the current terminus of the 63rd Street subway. In addition to the bus routings for Alternative 1, bus service to five LIRR stations would be increased to match the schedule of the proposed commuter rail operation. This alternative would provide new LIRR service to currently underserved areas of southern Queens with a transfer in western Queens to the new 63rd Street subway.
Alternative 5--Montauk-Archer Avenue Subway Connection
This alternative proposes that the LIRR Montauk branch be electrified and converted to subway operation. The new subway would connect the 63rd Street subway to the Archer Avenue subway. A significant portion of the Jamaica elevated line would be de-
native 1, several bus services would be expanded to serve the new stations on the Montauk-Archer subway. The operation of the Montauk-Archer subway has a number of cost impacts on the LIRR; these are evaluated using the commuter rail cost model. This alternative provides new service to areas in Queens by converting the Montauk line to subway.
OPERATING ISSUES
The successful application of the three operating cost models to an actual transit system requires a considerable amount of information about system operations with particular emphasis on limitations and constraints imposed by existing conditions. This was demonstrated 1n tne Queens t;ubway Options 5tuay in a number of instances related to rail transit, Major operational issues for both rapid transit and commuter rail operations include location of storage yards and train-turning at terminals as well as at intermediate locations. Other issues such as crew
TRB State-of-the-Art Report 2
~ 1 1 • • • No Addllional Construclion 2 Ula.A.• Queens Bypass Express 3 .. -..-..· Queens Blvd, Line-Local
Connection 4 • - • Sub\itil}'ILIRA-Monlauk
T111nstcr 5 •11••• Montauk/Archcr /\'te.
Subway Connec:1ion ~ L.ono Island Railroad and Station -0- Subway Une and Slation
assignments for commuter rail operations required a detailed investigation in order to establish appropriate inputs to the associated cost model. Similarly, a detailed study of freight operations was required for a line that would share passenger and freight traffic.
Yarding of trains is a major consideration in any rail transit operation. Ideally , yards should be lor.;,ted at either end of the line to allow put-ins and lay-ups. In the Queens Subway Options Study, four of the five alternatives required new or expanded yard facilities to accommodate the additional train sets required.
In Alternatives 3 and 5 the nearest possible location of the new subway yards was approximately 9 mi from the Queens terminal of each line. Consequently, in these two alternatives, about 20 percent of thP inr.remental car-miles incurred resulted from deadhead moves to and from the yards. These deadhead train moves accounted for about 5 percent of the total incremental operating cost for each alternative--more than $1. 5 million l,)er ye,H.
In Alternative 2 storage for an additional 20 subway train sets was required. The most practical alternative was to redesign an existing yard in Brooklyn, which requires relocating certain maintenance-of-way facilities. The proposed storage location is quite removed (about 19 mi) from the Queens terminal of the line; consequently, considerable car mileage is accumulated that could have been a"'JOided had storage facilities in Queens been available.
In Alternative 4 storage facilities were provided for MU train sets at one of the two eastern terminals and at the western terminal. This increased car mileage somewhat.
In both the rapid transit and commuter rail portions of the Queens Subway Option Study, train-turning proved to be of considerable importance in developing operating plans. The resulting operating costs incurred were often quite significant.
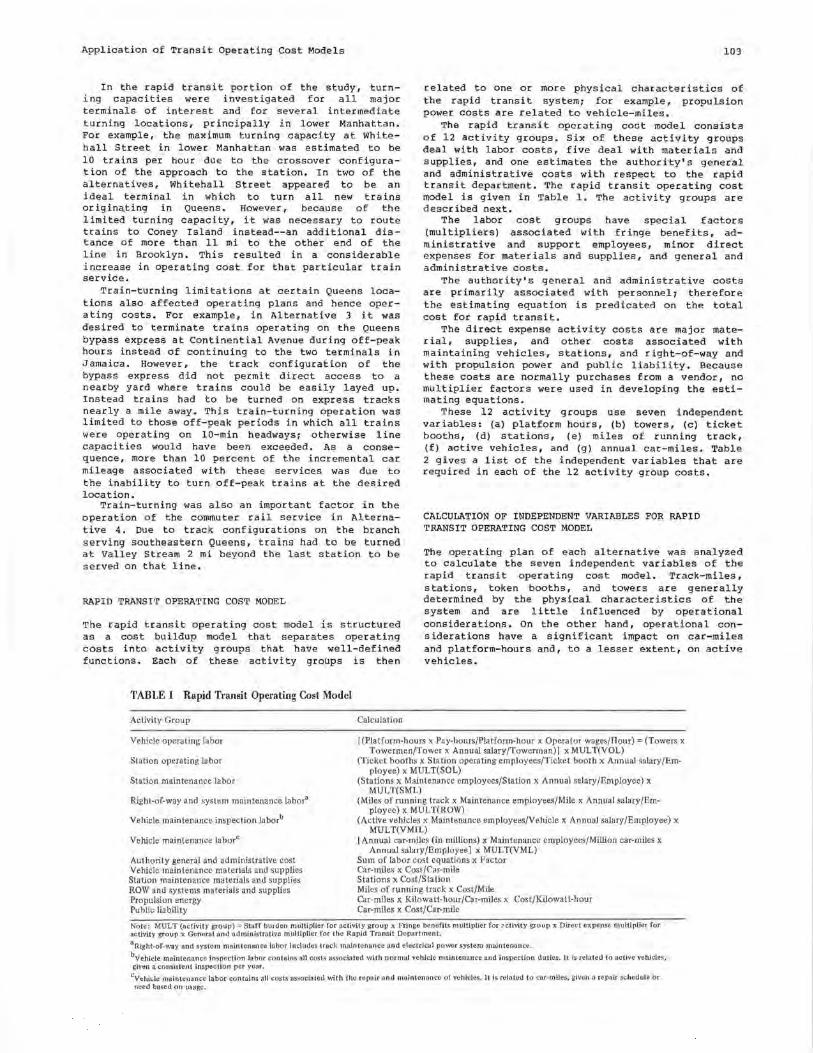
Application of Transit Operating Cost Models
In the rapid transit port i on of the study, turning capacities were investigated for all major terminals of interest and for several intermediate turning locations, principally in lower Manhattan. For example, the maximum turning capacity at Whitehall Street in lower Manhattan was estimated to be 10 trains per hour due to the crossover configuration of the approach to the station. In two of the alternatives, Whitehall Street appeared to be an ideal terminal in which to turn all new trains originating in Queens. However, because of the limited turning capacity, it was necessary to route trains to Coney Island instead--an additional distance of more than 11 mi to the other end of the line in Brooklyn. This resulted in a considerable increase in operating cost. for that particular train service.
Train-turning limitations at certain Queens locations also affected operating plans and hence operating costs. For example, in Alternative 3 it was desired to terminate trains operating on the Queens bypass express at Continential Avenue during off-peak hours instead of continuing to the two terminals in Jamaica. However, the track configuration of the bypass express did not permit direct access to a nearby yard where trains could be easily layed up. Instead trains had to be turned on express tracks nearly a mile away. This train-turning operation was limited to those off-peak per i ods in which all trains were operating on 10-min headways; otherwise line capacities would have been exceeded. As a conseque nce, more than 10 percent of the incremental car mileage associated with these services was due to the inability to turn off-peak trains at the desired location.
Train-turning was also an important factor in the operation of the commuter rail service in Alternative 4. Due to track configurations on the branch serving southeastern Queens, trains had to be turned at Valley Stream 2 mi beyond the last station to be s erved on that line.
RAPID TRANSIT OPERATING COST MODEL
The rapid transit operating cost model is structured as a cost buildup model that separates operating costs into activity groups that have well-defined functions. Each of these activity groups is then
TABLE I Rapid Transit Operating Cost Model
Activity Group Calculation
103
related to one or more physical characteristics of the rapid transit system; for example, propulsion power costs are related to vehicle-miles.
The rapid transit operating coot model consists of 12 activity groups. Six of these activity groups deal with labor costs, five deal with materials and supplies, and one estimates the authority's general and administrative costs with respect to the rapid transit department. The rapid transit operating cost model is given in Table 1. The activity groups are described next.
The labor cost groups have special factors (multipliers) associated with fringe benefits, administrative and support employees, minor direct e xpenses for materials and supplies, and general and administrative costs.
The authority's general and administrative costs are primarily associated with personnel; therefore the estimating equation is predicated on the total cost for rapid transit.
The direct expense activity costs are major material, supplies, and other costs associated with maintaining vehicles, stations, and right-of-way and with propulsion power and public liability. Because these costs are normally purchases from a vendor, no multiplier factors were used in developing the estimating equations.
These 12 activity groups use seven independent variables: (a) platform hours, (b) towers, (c) ticket booths, (d) stations, (e) miles of running track, (f) active vehicles, and (g) annual car-miles. Table 2 gives a list of the independent variables that are required in each of the 12 activity group costs.
CALCULATION OF INDEPENDENT VARIABLES FOR RAPID TRANSIT OPERATING COST MODEL
The operating plan of each alternative was analyzed to calculate the seven independent variables of the rapid transit operating cost model. Track-mi les, stations, token booths, and towers are generally determined by the physical characteristics of the s ystem and are little influenced by operational considerations. On the other hand, operational considerations have a significant impact on car-miles and platform-hours and, to a lesser extent, on active vehicles.
Vehicle operating labor
Station operating labor
Station maintenance labor
[(Platform-hours x Pay-hours/Platform-hour x Operator wages/Hour)= (Towers x Towermen/Tower x Annual salary/Towerman)] x MULT(VOL)
Right-of-way and system maintenance labor•
Vehicle maintenance inspection Jaborb
Vehicle maintenance laborc
Authority general and administrative cost Vehicle maintenance materials and supplies Station maintenance materials and supplies ROW and systems materials and supplies Propulsion energy Public liability
(Ticket booths x Station operating employees/Ticket booth x Annual salary/Employee) x MULT(SOL)
(Stations x Maintenance employees/Station x Annual salary/Employee) x MULT(SML)
(Miles of runrung track x Maintenance employees/Mile x Annual salary/Employee) x MULT(ROW)
(Active vehicles x Maintenance employees/Vehicle x Annual salary/Employee) x MULT(VMIL)
[Annual car-miles (in millions) x Maintenance employees/Million car-miles x Annual salary/Employee] x MULT(VML)
Sum of labor cost equations x Factor Car-miles x Cost/Car-mile Stations x Cost/Station Miles of running track x Cost/Mile Car-miles x Kilowatt-hour/Car-miles x Cost/Kilowatt-hour Car-miles x Cost/Car-mile
Note: MULT (activity group); Staff burden multiplier for activity group x Fringe benefits multiplier for rictivity group x Direct expense multiplier for activity group x General and administrative multiplier for the Rapid Transit Department. 8 Right-of-way and system maintenance labor includes track maintenance and electrical power system maintenance.
bVehicle maintenance inspection labor contains all costs associated with normal vehicle maintenance and inspection duties. It is related to active vehicles, given a consistent inspection per year.
cVehicle maintenance labor contains all costs associated with the repair and maintenance of vehicles. It is related to car-mUes, given a repair schedule or need based on usage.
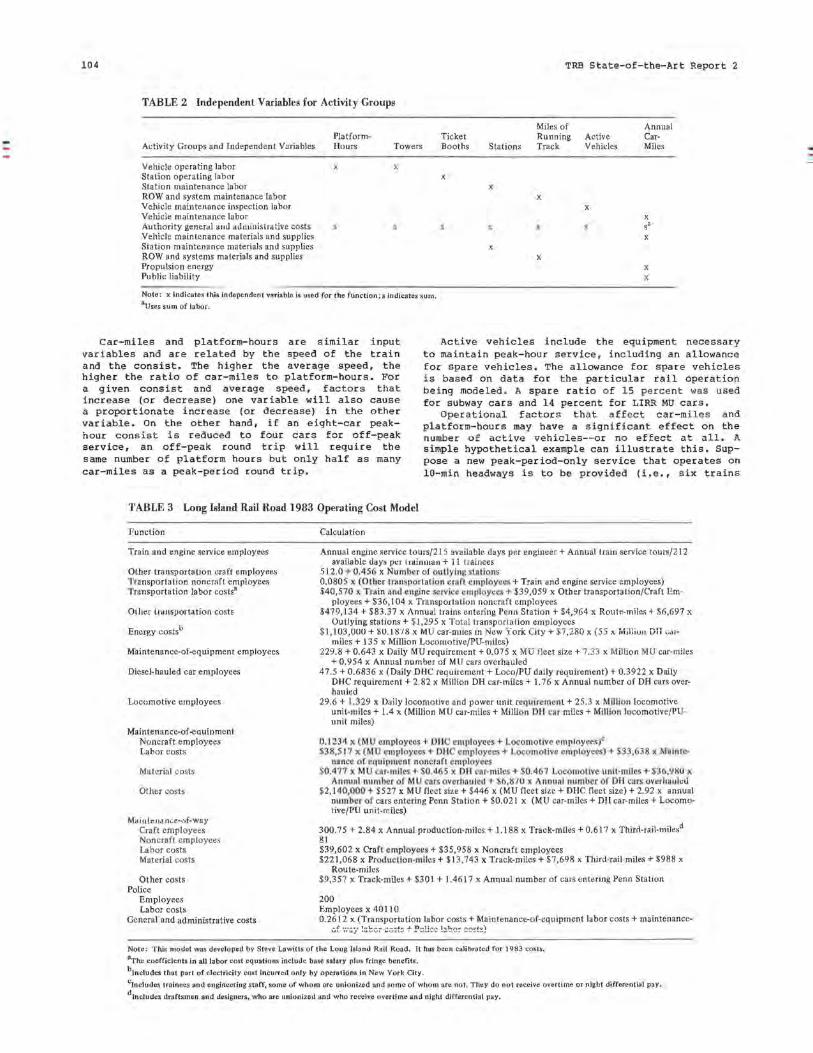
104 TRB State-of-the-Art Report 2
TABLE 2 Independent Variables for Activity Groups
Activity Groups and Independent Variables
Vehicle operating labor Station operating labor Station maintenance labor ROW and system maintenance labor Vehicle maintenance inspection labor Vehicle maintenance labor Authorit y generai arn..i adminis tra tive costs Vehicle maintenance materials and supplies Station maintenance materials and supplies ROW and systems materials and supplies Propulsion energy Public liability
PlatformHours
X
Ticket Towers Booths
X
X
Miles of Runn ing
Stations Track
X
X
s
X
X
Active Vehicles
X
Annual CarMiles
X Sa
X
X
X
Note: x indicates this independent variable is used for the function ; s indicates sum. 8 Uses sum of labor.
Car-miles and platform- hours are similar input vari a bles a nd a re re l a t e d by the s peed of the train and the consist. The higher the average speed, the higher the ratio of car-miles to platform-hours. For a give n consist and average speed , factor s that increase (or decrease) one variable will also cause a proportionate increase (or decrease) in the other variable. On the other hand, if an eight-car peakhour cons ist is reduced to four cars for off-peak service, an off-peak round trip will require the same number of platform hours but only half as many car-miles as a peak-period round trip.
Active vehicles include the equipment necessary to maintain peak-hour service , including an allowance for spare vehicles. The allowance for spare vehicles is based on data for the particular rail operation be i ng mode l ed . A spare ratio o f 1 5 percent was used for subway cars and 14 percent for LIRR MU cars.
Operational factors tha t affect car-mile s and platform-hours may have a significant effect on the number of active vehicles--or no effect at all. A simple hypothetical example can illustrate this. Suppose a new peak-period-only service that operates on 10-min headways is to be provided (i.e., six trains
TABLE 3 Long Island Rail Road 1983 Operating Cost Model
Function Calculation
Train and engine service employees
Other t ransportation craft employees 'J'ransportation noncraft employees Transportation labor costs3
Oth~r transportation costs
Energy costs0
Maintenance-of-equipment employees
Diesel-hauled car employees
Locomotive employees
Maintenance-of-equipment Noncraft employees Labor costs
Material costs
Other costs
MaiutcJMJlce-uf-wny Craft employees Noncraft employees Labor costs Material costs
Other costs Police
Employees Labor costs
General and administrative costs
Annual engine service tours/21 5 available days per engineer+ Annual train service tours/212 availabie days p~r lrainman + 11 t rainees
512.0 + 0.456 x umbe r of ou tlylngstations 0.080 S x (Other tra nsportat ion cmrt ernploytcs + Train and engine service employees) $40,570 x Train nnd engine serv i e cm1))(1y•cs + $39,059 x Other transportation/Craft Em-
ployees+ $36, l 04 x Transportation noncraft employees $479,134 + $83.37 x Annual trains entering Penn Station+ $4,964 x Route-miles + $6,697 x
Outlying stations+ $1,295 x Total transporta tion employees $1 , 103,UUO + $U. l 8"/8 x MU car-miles in New ~fork City+ $7,280 x (55 x MHi.i.vH DII Ccii
miles + 135 x Million Locomotive/PU-miles) 229.8 + 0.643 x Daily MU requirement+ 0.075 x MU fleet size+ 7.33 x Million MU car-miles
+ 0.954 x Annual number of MU cars overhauled 47.5 + 0.6836 x (Daily DHC requirement+ Loco/PU daily requirement)+ 0.3922 x Daily
DHC requirement+ 2.82 x Million DH car-miles+ l. 76 x Annual number of DH cars overhauled
29.6 + 1.329 x Daily locomotive and power unit rcquir~mcnt + 25 .3 x Mill ion locomotive unit-miles+ 1.4 x (Million MU car-miles + Million OM car miles+ Million locomotive/PUunit miles)
·0. 1234 x (MU employees + OH c111ployccs + Locomotive rmr,loyc:o ,C S38,S 17 x (MU cmploytes + OH employees+ Locomolivc employee)+ S33,63t! x Molntc
n, nee or e11uipmen t no ncrufl employees $0.477 Mll car-mi les+ S0 .465 x l)M car- miles+ S0.467 Lo~omQtiVe u nit-miles+ S36,98U x
Anmrnl nu mber of MU cnrs ovcrlm uled + S6,87U • Annunl numbor of DII curs l)> ur lmul~,l $2, 140,000 + $527 x MU fleet size+ $446 x (MU fleet si ze + DHC fl eet size)+ 2.92 x annual
num ber of cars ente ring Penn Station+ $0.021 x (MU car-miles + DH car-miles+ Locomotive/PU unit-miles)
300.75 + 2.84 x Annual production-miles+ 1.188 x Track-miles+ 0.617 x Third-rail-milesd 81 $39,602 x Crart employees + $35,958 x Noncraft employees $221 ,068 x Production-miles+ $13,743 x Track-miles+ $7,698 x Third-rail-miles+ $988 x
Route-miles $9 ,357 x Track-miles+ $301 + 1.4617 x Annual number of cars entering Penn Station
200 Employees x 40110 0.2612 x (Transportation labor costs + Maintenance-of-equipment labor costs + maintenance-
vf-···- ; · 1-\.. - · .... ~ ....... ..1. n ..... 1; ,.. ,. 1,,1-. "' ... ,.,... ... t-.,)
Note: This model was developed by Steve Lawitts of the Long Island Rail Road. 1t has been calibrated for 1983 costs.
3The coefficients in all labor cost equatio ns include base salary plus fringe benefits .
blncludes that part of electricity cost incurred onJy by operations in New York City.
clncJudes trainees and engineering starr, some of whom are unionized and some of whom are not. They do no t receive overtime or nJght differential pay.
dlncludes draftsmen and designers, who are unionized and who receive overtime and night differential pay.
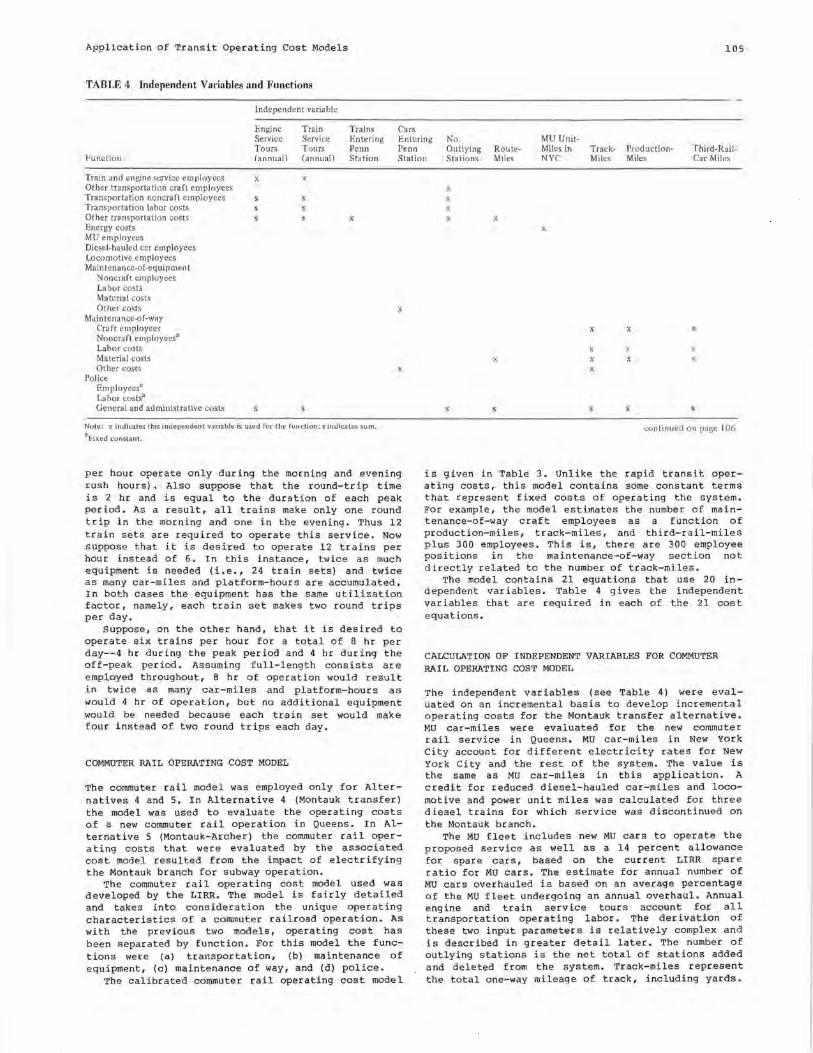
Application of Transit Operating Cost Models 105
TABLE 4 Independent Variables and Functions
Independent variable
Trains Cars Engine Service Tours (annual)
Train Service Tours (annual)
Entering Entering No. MU Unit-Penn Penn Outlying Route- Miles in Track- Production- Third-Rail-
Function Station Station Stations Miles NYC Miles Miles Car Miles
Train and engine service employees Other transportation craft employees Transportation noncraft employees Transportation la bar costs Other transportation costs Energy costs MU employees Diesel-hauled car employees Locomotive employees Maintenance-of-equipment
Noncraft employees Labor costs Material costs Other costs
Maintenance-of-way Craft employees Noncraft employees' Labor costs Material costs Other costs
Police Employees' La bar costs' General and administrative costs
X X
X
Note: x indicates this independent variable is used for the function; s indicates sum. 8 Fixed constant.
X
X
per hour operate only during the morning and evening rush hours) , Also suppose that the round-trip time is 2 hr and is equal to the duration of each peak period, As a result, all trains make only one round trip in the morning and one in the evening, Thus 12 train sets are required to operate this service. Now suppose that it is desired to operate 12 trains per hour instead of 6. In this instance, twice as much equipment is needed (i.e., 24 train sets) and twice as many car-miles and platform-hours are accumulated. In both cases the equipment has the same utilization factor, namely, each train set makes two round trips per day.
Suppose, on the other hand, that it is desired to operate six trains per hour for a total of 8 hr per day--4 hr during the peak period and 4 hr during the off-peak period. Assuming full-length consists are employed throughout, 8 hr of operation would result in twice as many car-miles and platform-hours as would 4 hr of operation, but no additional equipment would be needed because each train set would make four instead of two round trips each day.
COMMUTER RAIL OPERATING COST MODEL
The commuter rail model was employed only for Alternatives 4 and 5. In Alternative 4 (Montauk transfer) the model was used to evaluate the operating costs of a new commuter rail operation in Queens. In Alternative 5 (Montauk-Archer) the commuter rail operating costs that were evaluated by the associated cost model resulted from the impact of electrifying the Montauk branch for subway operation.
The commuter rail operating cost model used was developed by the LIRR. The model is fairly detailed and takes into consideration the unique operating characteristics of a commuter railroad operation. As with the previous two models, operating cost has been separated by function. For this model the functions were (a) transportation, (b) maintenance of equipment, (c) maintenance of way, and (d) police.
The calibrated commuter rail operating cost model
X
X X
X
X
X
X
X
X
X
X
X
continued on page 106
is given in Table 3. Unlike the rapid transit operating costs, this model contains some constant terms that represent fixed costs of operating the system. For example, the model estimates the number of maintenance-of-way craft employees as a function of production-miles, track-miles, and third-rail-miles plus 300 employees. This is, there are 300 employee positions in the maintenance-of-way section not directly related to the number of track-miles.
The model contains 21 equations that use 20 independent variables. Table 4 gives the independent variables that are required in each of the 21 cost equations.
CALCULATION OF INDEPENDENT VARIABLES FOR COMMUTER RAIL OPERATING COST MODEL
The independent variables (see Table 4) were eval·uated on an incremental basis to develop incremental operating costs for the Montauk transfer alternative. MU car-miles were evaluated for the new commuter rail service in Queens. MU car-miles in New York City account for different electricity rates for New York City and the rest of the system. The value is the same as MU car-miles in this application. A credit for reduced diesel-hauled car-miles and locomotive and power unit miles was calculated for three diesel trains for which service was discontinued on the Montauk branch.
The MU fleet includes new MU cars to operate the proposed service as well as a 14 percent allowance for spare cars, based on the current LIRR spare ratio for MU cars, The estimate for annual number of MU cars overhauled is based on an average percentage of the MU fleet undergoing an annual overhaul, Annual engine and train service tours accoun t for all transportation operating labor, The derivation of these two input parameters is relatively complex and is described in greater detail later. The number of outlying stations is the net total of stations added and deleted from the system. Track-miles represent the total one-way mileage of track, including yards.
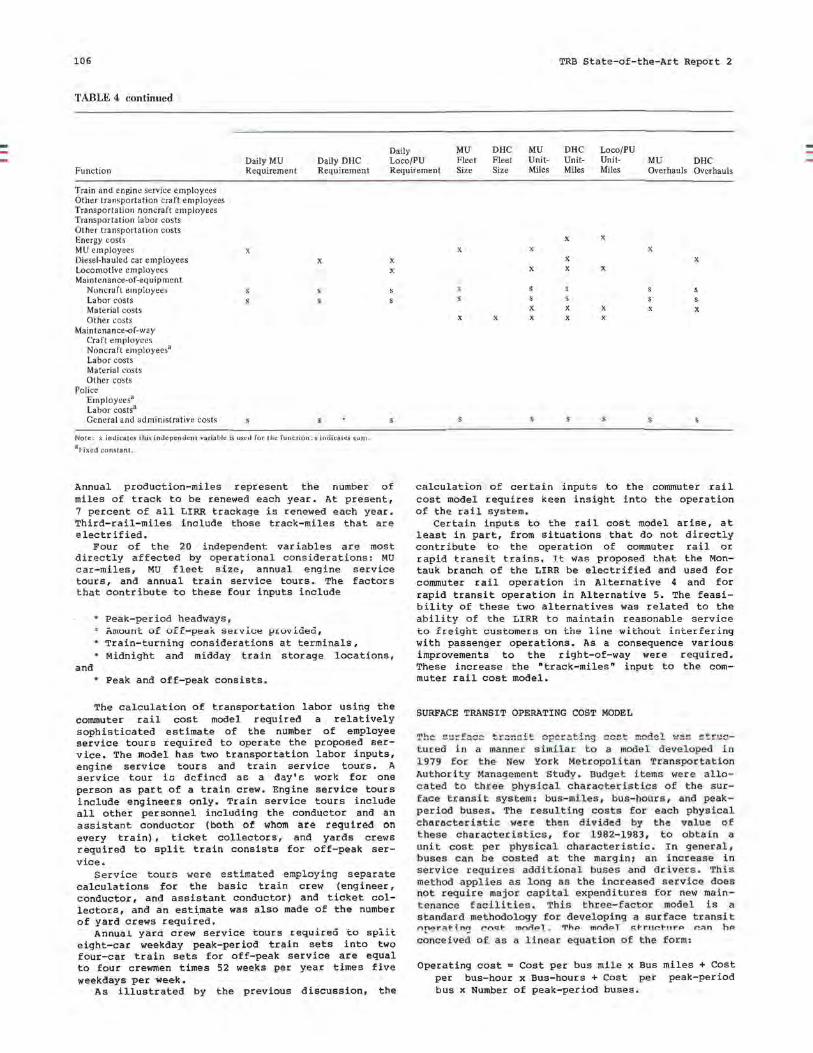
106 TRB State-of-the-Art Report 2
TABLE 4 continued
Function Daily MU Requirement
Daily DHC Requirement
Daily Loco/PU Requirement
MU Fleet Size
DHC Fleet Size
MU UnitMiles
DHC UnitMiles
Loco/PU UnitMiles
MU DHC Overhauls Overhauls
Train and engine service employees Other transportation craft employees Transportation noncraft employees Transportation la bar costs Other transportat10n costs Energy costs MU employees Diesel-hauled car employees Locomotive employees Maintenance-of-equipment
Noncrart employees Labor costs Material costs Other costs
Maintenance-of-w ay Craft employees Noncraft employees8
Labor costs Material costs Other costs
Police Employees" Labor costs• General and adminjstrative costs
X
X
Note: x indicates ihis independtmi variabh: is usi::tJ for thi:: funciion; s indicaii::s sum. 3 Hxed constant ,
X
X
Annual production-miles represent the number of miles of track to be renewed each year. At present , 7 percent of all LIRR trackage is renewed each year. Third-rail-miles include those track-miles that are electrified.
Four of the 20 independent variables are most d irectly affec ted by ope rationa l considerat ions: MU car - miles, MU fleet size, annual engine service tours, and annual train service tours. The factors that contribute to these four inputs include
and
• Peak-period headways, Amount uf ULL-peak Service ptovided,
• Train-turning considerations at terminals, Midnight and midday train storage locations,
• Peak and off-peak consists.
The calculation of transportation labor using the commuter rail cost model required a relatively sophisticated estimate of the number of employee service tours required to operate the proposed service. The model has two transportation labor inputs, engine service tours and train service tours. A service tour in defined as a day's work for one person as part of a train crew. Engine service tours include engineers only. Train service tours include all other personnel including the conductor and an assistant conductor (both of whom are required on every train), ticket collectors, and yards crews required to split train consists for off-peak service.
Service tours were estimated employing separate calculations for the basic train crew (engineer, conductor, and assistant conductor) and ticket collectors, and an est~mate was also made of the number of yard crews required.
Annua.L yard crew service tours requirea to split eight-car weekday peak-period train sets into two four-car train sets for off-peak service are equal to four crewmen times 52 weeks per year times five weekdays per week.
As illustrated by the previous discussion, the
X X
X X X
X X
X X X
X X X X X X X X X X
calculation of certain inputs to the commuter rail cost model requires keen insight into the operation of the rail system.
Certain inputs to the rail cost model arise, at least in part, from situations that do not directly contribute to the operation of commuter rail or rapid transit trains, It was p r oposed t hat the Montauk branch of the LIRR be electrified and used for commuter rail operation in Alternative 4 and for rapid transit operation in Alternative 5. The feasibility of these two alternatives was related to the ability of the LIRR to maintain reasonable service to freight customers on the line without interfering with passenger operations. As a consequence various improvements to the right-of-way were required. These increase the "track-miles• input to the commuter rail cost model.
SURFACE TRANSIT OPERATING COST MODEL
tured in a manner similar to a model developed in 1979 for the Ne w York Metropolitan Transportation Authority Manageme nt Study . Budget items we r e allo cated to t h ree ph,ysica.l ch.aracter istic-s of t he s urface transit system : bus-miles , bus-hours , a nd pea kperiod buses . The result ing costs f o r each p hys.ical characteri~tic were t hen div i ded by the v a l ue of t hese cha rac te r i s tics, for 198 2- 1983 , to obta i n a unit cos t per phys ica l character i s tic, I n general, buses c a n be costed at t he margin ; an i ncrease in serv ice requires additional buses a nd dri vers . This method applies as long as the i nc r e ased serv ice does not requ ire ma jor capi tal e xpend i t ures fo r new maintenance facilities . Thi-s three-factor model is a standa rd me thodo logy for developing a su.rfac e t.ransit ('lr-e r ~t in,::! ,...,c:t- mnrl~ l :- "'"'iP mnrlD1 Af- r u c t-11.-P r.;1.n h P
conceived of as a li near equa tion of t he for m:
Operating cost= Cost per bus mile x Bus miles+ Cost per bus-hour x Bus-hours+ Cost per peak-period bus x Number of peak-period buses.
Application of Transit Operating cost Models
The bus model requires only three input parameters: bus-miles, bus-hours, and peak-period buses. As is the case for the rapid transit cost model, bus-miles and bus-hours are related by the average speed of the bus.
Bus routes were altered and service was expanded where necessary to provide feeder bus service to
107
subway stations in each of the five alternatives and to commuter rail stations in Alternative 4. Scheduling of buses was coordinated with rail schedules. In addition, some bus routes were increased in length or new services were created to provide access to these rail stations.
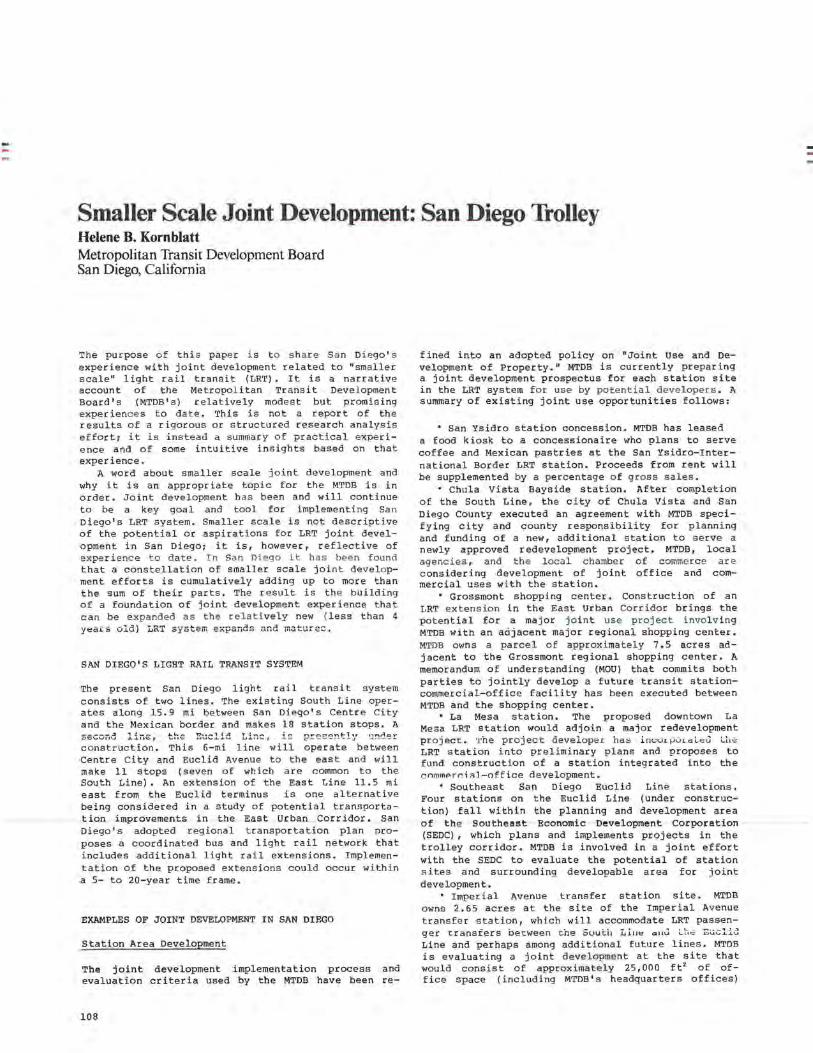
Smaller Scale Joint Development: San Diego Trolley Helene B. Kornblatt Metropolitan Transit Development Board San Diego, California
The pu r pose o f thi s pape r i s t o s h a r e Sa n Di ego' s experience with joint development related to "smaller scale" light rail transit (LRT). It is a narrative account of the Metropol itan Transit Deve l opment Board's (MTDB's) relatively modest but promising experience s t o date. This is not a report of the results of a rigorous or structured research analysis effort: it is instead a summary of practical experience and of some intuitive insights based on that experience.
A word about smaller scale joint development and why it is an appropriate topic for the MTDB is in order. Joint development h as been and will continue to be a key goal and tool for implementing San Diego's LRT system. Smaller scale is not descriptive of the potential or aspirations for LRT joint development in San Diego: it is, however, reflective of expe ri enc e to d a t e . In San Diego it has been found that a constellation of smaller scale joint development efforts is cumulatively adding up to more than the sum of their parts. The result is the building of a foundation of joint development experience that can be e xpanded as the relatively new ( less than 4 years old) LRT system expands and muture~.
SAN DIEGO'S LIGHT RAIL TRANSIT SYSTEM
The present San Diego light rail transit system consists of two lines. The existing South Line operates along 15. 9 mi between San Diego's Centre City and the Mexican border and makes 18 station stops. A -----~ ;:iC"-VIIU
c onst r uc tion . This 6-mi line will operate between Centre City and Euclid Ave nue to the eas t a nd will make 11 stops (seven of which are common to the South Line) . An extension of the East Line 11. 5 mi east from the Euclid terminus is one alternative being considered in a study of potential transportation improvements in the East Urban Corridor. San Diego ' s adopted regional t ransportation plan proposes a coordinated bus and light rail network that includes additional light rail extensions. Implementation of the proposed extensions could occur wi th i n a 5- to 20-year time frame.
EXAMPLES OF JOINT DEVELOPMENT IN SAN DIEGO
Station Area Development
The joint development implementation process and evaluation criteria used by the MTDB have been re-
108
fine d into an adopte d policy on "Joint Use and Development of Property." MTDB is currently preparing a joint development prospectus for each station site in the LRT system f or use by potential developers . A summary of existing joint use opportunities follows:
• San Ysidro station concession. MTDB has leased a food kiosk to a concessionaire who plans to serve coffee and Mexican pastries at the San Ysidro-International Border LRT station. Proceeds from rent will be supplemented by a pe rce n t age o f gross sales .
• Chula Vista Bayside station. After completion of the South Line , the c i ty of Chula Vista and San Diego County executed an agreement with MTDB specifying city and county responsibility for planning and funding of a new, additional station to serve a newly approved redevelopment project. MTDB, local agencies , and the l oca l chamber of c ommerc e a r e c onsidering development of joint office and commercial uses wi th the station.
• Grossmont shopping center. Construction of an LRT exte nsion in the East Urban Corridor br i ngs the pot ential for a ma j or joi n t use project invol v i ng MTDB with an adjacent major regional shopping center. MTDB owns a parcel of approximately 7. 5 a c res adjacent to the Grossmont regional shopping center. A memorandum of understanding (MOU) that commits both parties to jointly develop a future transit stationcommercial-office facility has been executed between MTDB and the shopping center.
• La Mesa s t ation. The p r oposed downtown La Mesa LRT station would adjoin a maj o r redevelopment proj ect . '!'he project deve l oper has i ncu1.}JU1.c1 L~U. Lhe LRT station into preliminary p l ans and proposes to fund construct i on of a station integrated into the ~ommPr r. ; ~J-off i c e d e velopment.
• Southeast San Diego Euclid Line stations, Four stations on t he Euclid Line (under construction) fall within the planning and development area of the Southeast Economic Development Corporation (SEDC) , which plans and implements projects in the trolley corridor. MTDB is involved in a joint effort with the SEDC to evaluate the potential of station sites and surrounding developable area for joint development.
• Imperial Avenue transfer station site. MTDB owns 2.65 acres at the site of the Imperial Avenue transfer station, which will accommodate LRT passenger t ransfers be t ween t he 5uu t h L.i11t:! cu1U. Lh t: Buel.id Line and perhaps among additional future lines. MTDB is evaluating a joint development at the site that would consist of approximately 25,000 ft 2 of office space ( including MTDB' s headquarters offices)
Smaller Scale Joint Development
and 10,000 ft 2 of ground floor retail commercial space.
Deve luper Contributions to Plan , Construct, and Operate Light Rail Transit
This category of joint development involves developer contributions of right-of-way or funds, or both, to plan, construct, or operate LRT. Contributions are often made as a form of mitigation for traffic and parking impacts a s sociated with deve l opment. Two examples of developer participation follow:
• Mission Valley projects. Mission Va lley is a rapidly developing urban commercial-office-residential area adjacent to the San Diego Rive r . Traffic and parking problems could severely constrain d e velopment. The city of San Diego, in consultation with MTDB, ha s a pproved major pro jec t s in Mission Valley s ubject to deve l oper participation in future light rail transit including a contribution fo r a light rail transit study , reservation and dedication of LRT right-of-way within the Northside project, funding for construction of an LRT line a nd s tation within the Northside project, 20 percent funding for an LRT grade separation project, and funding for the construction of an LRT line through an adjacent property.
• Major Centre City project. The Santa Fe Land Improveme nt Company is implementing a major commercial-office-hotel development in downtown San Die go . In seeki ng approval for the pro ject , the develope r agreed to a donation of right-o f-way, or to a financial contribution not to exceed Sl million, for a future light rail extension to the north.
WHAT HAS BEEN LEARNED ABOUT LRT JOINT DEVELOPMENT IN SAN DIEGO
Lesson 1: Realistic Expectations
Joint development does not simply occur as a function of the presence of a new LRT line. There are many determinants of station site joint development potential, some of which are more amenable to control and change than others:
1. Station site environs. An LRT station is not an island, and station site joint development does not occur in a vacuum, independent of the surrounding environment. The following features of station environs can help or hinder joint development potential:
A. Development density and urban form. Highdensity development in station environs is one determinant of joint development potential that many cities (San Francisco, Philadelphia, Boston) may take for granted. In San Diego it is a relatively new concept that must be actively fostered, The relatively low-density development around many LRT stations can challenge efforts to encourage joint development.
B. Surrounding land use, The historical presence of a freight railroad in the LRT corridors has been a primary determinant of the types of surrounding land uses. Much of the LRT environment consists of the "back door" of industrial and manufacturing uses that were and continue to be served by freight delivery trains. The land uses provide a less favorable joint development environment.
c. Redevelopment and new development environment. In the Euclid line and East Urban extension areas, concerted redevelopment efforts
109
by local cities and redevelopment authorities could create an impetus for change in the urban environment that wou l d e nhance joint development potential. In Mission Va l l ey a boominq new development environment could be more conducive to joint development than the South and Euclid line environs proved to be. 2. Physical attributes of the site. An LRT
station site is no different from any o t her potential development site. Physical cons traints can affect development potential.
3. Amount of developable land available and potential for combined development with adjacent lands. MTDB has acquired a suitable amount of real property necessary to implement LRT facilities wi thout r esult i ng in a su r plus. The refore joint d e velo p ment poten tial is enha nced by the possibility o f c ombi ned dev·elopment with land ad j ace nt to station sites and owned by others.
Given these determinants of station site development potential, t he most p r omisi ng joint d e velopment possibilities i n San Di ego involve deve lopment o f air r ights, parking area s (where the de velopmen t i ncorpo·r ates a dequa·te s ta tion a s well as p r oj e c t parking·), a nd development o f small joi nt developme n t uses (news kiosks, automatic teller machines, flower stands) that can be accommodated in surplus area pockets on station sites.
Lesson 2 : Strong Public Policy Commitment
A firm public policy commitment to successful impleme ntation of joint development is an essential prerequisite for success. The mere presence of the LRT does not usually result in spontaneous development. Public policy ma kers must "prime t he p ump" for station si t e joint developmen t to happen, a nd the pump must be primed early and often.
In San Diego the newness of and lack of familiarity with the implications of the first South LRT Line resulted in a perhaps understandable hesitancy to aggressively change public policy to address the LRT line's full potential. For the Euclid Line and other proposed lines, joint development-related cooperative planning efforts and private sector involvement are occurring during planning and early construction.
Specif ic policy actions that foster joint development include
• Appropriate land use qes igna t ions and zoning that are conducive to joint d e velopment i
• Integrated planning (e.g., station area plans) that establishes the LRT station as an integral part of community development and provision for well-planned pedestrian station access and circulation;
'Development incentives that encourage joint development (e.g., density bonuses or reduced parking requirements, or both) of locations adjacent to a station;
• Aggressive LRT-focused policy commitment to pursue joint development by the city and redevelopment agencies
• Private sector outreach by the LRT authority (transit development board), city council, and redevelopment authority, emphasizing the advantages of joint development to the private sector;
• Adopt i on of transit development board policies demonstrating a commitment to seek developer assistance in financing transit improvements and indicating where developer contributions are appropriate;
• City land use plans, zoning, and policies
-.. ..
110
that designate planned LRT corridors and require developer contributions for transit to help ensure orderly growth and reduce adverse development impacts: and
• Strong city infrastructure policies that view developer contributions to finance transit improvements in the same light as more traditional developer-provided necessities (e.g., schools, roads).
Lesson 3: Benefits of Joint Development
Private sector developer participation in joint development can be achieved when the advantage to the private sector participant is clear and compelling. In San Diego (e.g., Mission Valley) developer participation in funding transit can mean the difference between approval and denial of a project by local authorities concerned about adverse traffic and parking impacts associated with a project.
Developers can be enthusiastic about participation in LRT implementation when the economic and patron access advantages of the LRT to pr iv ate enterprise are clearly demonstrated and emphasized.
TRB State-of-the-Art Report 2
Lesson 4: Smaller Scale Joint Developments
A number of smaller scale joint developments can have cumulative nonquantifiable benefits in addition to financial benefits. Such nonquantifiable benefits include
• Increased visibility of the LRT in the potential rider community;
• Increases in LRT station amenities and resulting overall enhancement of the LRT rider experience;
• Promotion of the idea of joint development and the LRT-private sector partnership: and
• An opportunity to gain joint development experience that will be applicable to subsequent, m0re ambitious efforts.
These nonquantifiable benefits of smaller scale joint development efforts could ultimately result in quantifiable gains in LRT revenues and in increased and more ambitious joint development.
Part 3 Facility Design and
Rail Car Technology
Resuscitating an Old 'Irolley System John A. Bailey Transportation Systems Associates Philadelphia, Pennsylvania
Christopher Zearfoss Transit Operations and Planning Division, Department of Public Property City of Philadelphia, Pennsylvania
As was the case in most principal American cities, public transportation services in Philadelphia began in earnest in 1858 just before the Civil War. A plethora of independent horsecar lines, concentrated mainly in a dense network within 2 mi of City Hall, had developed by 1883. In that year, a brief 12-year experience with cable car operation on a few routes began. Steam dummies hauled cars on a handful of other lines. The advent of electric traction in 1892 allowed the system to expand its comprehensive service territory to include about a 6-mi radius from City Hall. By 1897 the street railway system had been completely electrified, and, with the exception of four small companies serving the fringes of the city, was consolidated under one management, Union Traction Company.
At the turn of the century success with subway and elevated lines in Boston, Chicago, and New York City led to a flurry of proposals and new companies with franchises to construct such lines in Philadelphia. In 1902 trends elsewhere and pressures from the city government, which was awarding franchises for many rapid transit lines, prompted reorganization of Union Traction Company as the Philadelphia Rapid Transit Company (PRT) for the purpose of constructing a 7-mi subway-elevated line. This line included a 1-mi section of four-track subway, two tracks of which were used by trolley cars.
However, the private company found it could not raise sufficient capital and had to turn to the city for public funds (1). Comparatively little expansion of the trolley system occurred after 1911, the year PRT came under the control of the efficiency-minded Thomas E. Mitten. Under Mitten's management, which lasted until 1931, PRT provided first-rate trolley service; however, the city was disenchanted with PRT' s inaction on constructing badly needed subwayelevated extensions. Accordingly, the city built two new rapid transit lines in the 1920s, but PRT resisted operating the lines. Mitten thought his trolley cars could handle virtually all the transit riders in the nation's third largest city.
The low-capital bus and trackless trolley technology that evolved in the early 1920s appealed to Mitten, however, and by 1929 about 20 such routes complemented almost 70 trolley routes. Under Mi tten' s tenure in 1926 PRT trolley service reached its peak--2,700 cars carried 811 million passengers over 660 mi of track.
During the 1930s six weak trolley routes were converted to bus operation. In 1940 PRT emerged from a 5-year period of bankruptcy, reorganized as the Philadelphia Transportation Company (PTC). Freed at last from staggering rental payments to PRT under-1 iers, PTC was able to pursue a major modernization program that had actually had its small beginnings in 1938. A major facet of this program was the purchase of 260 new PCC trolleys between 1938 and 1942. World War II intervened, and these PCC cars, instead of permitting the retirement of older cars, were required just to keep up with wartime riding. In 1946 the trolley system used 1,900 cars on 58 routes to carry more than 720 million passengers, or 65 percent of the transit system total. Buses then accounted for only 11 percent of system patronage (~).
After the war another 210 PCC cars were purchased, three trolley routes were converted to trackless trolley operation, and another nine were either abandoned as duplicative or converted to bus operation. In 1954 PTC was a conservative, almost "family run" organization. Although ridership was still at immediate prewar levels--strong in relation to trends elsewhere--the trolley fleet was in dire shape. Only one-third of the 1,500-car fleet consisted of PCC cars. The balance were 30 to 40 years old and, although reasonably well maintained, could not continue to attract riders and afford satisfactory service.
NATIONAL CITY LINES (1955-1962)
The progressive new city administration that took office in 1952 encouraged PTC to modernize its fleet. However, the effects of inflation prevented PTC from acquir mg any new rolling stock between 1950 and 1955. In 1955, out of sheer exasperation rather than any sense of confidence, the city acquiesced in the board of director's decision to enlist National City Lines (NCL) to manage the transit system. Although NCL had the initiative to undertake organizational efficiencies and service adjustments, which the old management had eschewed, their principal remedy for an ailing PTC was to eliminate the trolley system as soon as possible.
Clearly, some retrenchment from the 1954 level of PTC trolley operation was warranted because some routes were duplicative or simply no longer justified trolley service because of low patronage. However,
113
114
NCL's view of the situation, perhaps biased to some degree by their known predisposition toward motor bus service, entailed contraction of the trolley system by two-thirds. Between 1955 and 1957 the number of trolley routes shrank from 46 to 14. Those 14 were sufficient to use the fleet of 557 PCC cars, which as a group were only about one-third depreciated.
Five of the remaining 14 trolley routes used the surface car subway for downtown access. The original 1-mi trolley subway, opened in 1905 by the old PRT, was extended 1 1/2 mi by the city in the early 1950s. The extension opened in 1955 just after NCL took control of PTC. Although concepts for using the trolley subway for rapid transit trains or trackless trolleys had been advanced, ultimately no serious consideration was given to these ideas. The other nine trolley lines retained by NCL were chosen mainly to consolidate routes at the newest carhouses and to provide interconnecting trackage. The residual life of the track, ridership levels, and operating conditions all played lesser roles in determining which routes remained trolley operated. The nine routes were to be retained only until their PCC fleets were depreciated.
Within 3 months of takeover by NCL, PTC had received 300 new large diesel buses and had plans for another 700 (3). Proceeds from the sale of several depot and shop facilities and a large amusement park, plus salvage of plant and equipment, helped pay for the buses. PCT employment plummeted by 30 percent within 3 years. Although some of the city government's concerns about PTC were resolved by NCL, the attendant indiscriminate reduction in trolley service did not occur unnoticed. Correspondence from the period indicates that the city wanted PTC to justify each trolley route conversion, a request never acknowledged by PTC.
In 1956 the city hired a new engineering staff to pursue its interests before the State Public Utilities Commission. PTC argued that traffic congestion along trolley routes necessitated conversion to buses. A protracted controversy arose when the busy Chestnut and Walnut Street trolley routes were changed over to buses in 1956. The city's stance in opposition to this change was vindicated when rider-ship fell and servic~ zlowed .:lfter bu:; conversion. It is believed that this is the result of most conversions and that it occurs partly because buses cannot accelerate as rapidly as can trolleys and partly because more automobiles are attracted to routes served by buses.
Despite the city's concerns about tions and policies during the late James H.J. Tate (who took office in
PTC' s opera-1950s, Mayor
1962) was not disposed to seek a municipal ~ak~ov~c of th~ tr~nc;t
system. When NCL relinquished control of PTC in 1962 the effects of their policies on the trolley system were apparent.
An adequate overhaul shop had been lacking since 1957, and the PCC car fleet was deteriorating. Programmed track renewals had ceased; rail renewal occurred only when absolutely necessary. Even so, during 1962 the 487 PCC cars on PTC's 14 trolley routes carried 20 percent of PTC's passengers, or 92 million riders. During that same year, subway-elevated trains carried 25 percent of riders; trackless trolleys 5 percent; and motor buses 50 percent.
CREATION OF SEPTA (1963-1977)
The decision to create a transit authority covering the five Pennsylvania counties in the Philadelphia Standard Metropolitan Statistical Area (SMSA) took a long time. It began before 1950 and came to a head in 1963 when the Pennsylvania Transportation Company
TRB State-of-the- Art Report 2
had a 19-day strike followed almost immediately by an even longer strike at the Philadelphia Suburban Transportation Company. The latter served Delaware County, the principal opponent of joint city-county action just a decade earlier.
Mayor Tate, noted earlier as an opponent of a strong public transit agency, opened the dialogue with the counties, sent a staff team to several large cities in North America with regional transit agencies, and persuaded the five counties to estab-1 ished a drafting committee for transit authority legislation. The mayor accepted the suburban demands that the counties be equally represented on the board. Each county has two voting representatives; the state has one member on the board because all regional politicians anticipated that the state would be a major source of funds. Members representing one-third of the region's population in the latest census could veto any action, but this only led to postponement and required an extraordinary vote to pass at the next regular meeting.
The legislature agreed to the draft and enacted the bill after making a few minor changes, one of which concerned condemnation of railroad property and another of which made the effective date in mid-January 1964 (Act 450 of Aug. 14, 1963, Pub. L. No. 984). Thus, when the counties and city named two board members each in January or February, the Southeastern Pennsylvania Transportation Authority (SEPTA) came into being as an instrumentality of the Commonwealth of Pennsylvania. It should be noted that it was an instrumentality without a dedicated source of funds, a requirement of the state administration before it would lend its support.
Thus the region had its regional transportation agency; but the city, then with half the population but a far higher share of the region's transit users, had only two appointees on an 11-member board. As one would expect, the road since has been stormy. Many observers feel that the city has not received the quality and amount of transit service its citizens need (4,p.25A), but it has been possible to use that heavy -suburban majority to help persuade the state to provide substantial grants for transit agencies throughout the state. Thus SEPTA has had to be a beggar at the county seats, the state house, and Washington.
Some observers have said the main objective of any suburban SEPTA board appointee is to attempt to minimize the funds needed from the counties, even at the expense of the quality of transit service. During the tenure of Mayor Frank Rizzo, from 1972 to 1980, SEPTA was nearly paralyzed and its grants for both operating and capital purposes were insignificant in
-- ---- .... Qa a,i;;<t;:11 u:t
outside observers. Despite these handicaps, SEPTA, with the aid of
city guarantees of the debt incurred to buy out the stockholders, was able to acquire the property of the PTC in Philadelphia well as the segments constructed by the city.
Thue the North Philadelphia trolley eyetem wae acquired by SEPTA in 1968 when the system consisted of
• 14 routes, 188 mi of single track,
• 465 PCC cars the average age of which was then approximately 24 years,
• An old and poorly maintained traction power system, and
• ~u m1LL1on annuaL riders.
About one-third of the track-miles, cars, and ridership was attributed to the five subway-surface r0utes and the balance to the surface routes under discussion.
Resuscitating an Old Trolley System
As would be expected, the attitude of a suburban board toward a trolley system that served a large section of poor Philadelphia, and which was operated by many of the same managers who had been employed to dispose of the electric-powered system 13 years earlier, did not lead to improved service. This attitude prevailed even though the pro-trolley views of Toronto and most Western European cities were well known and the city had a transit operations engineer who was convinced that the trolley system was more efficient than diesel-powered buses. Between 1968 and 1977 SEPTA made only one permanent conversion of a trolley route to bus operation, and this only with a prolonged 3-year controversy (1968 to 1971). A short shuttle trolley route was combined with a longer trunk route in 1971.
Accordingly, since 1971 there have been 12 urban trolley routes operated by SEPTA1 five routes use the surface car subway and seven use the so-called "North Philadelphia" trolley routes, which operate entirely on-street and which are the focus of this paper. See Figure 1.
The several dichotomies that were present (city versus suburbs: Democrats versus Republicans, transit versus automobiles and highways, transit versus suburban railroad lines, and, finally, SEPTA' s Chairman, James C. McConnon, versus Mayor Frank Rizzo) were sufficient to completely immobilize the staff. The transit system continued to consume its own assets with inadequate maintenance, slow use of capital grants when they were received, and fares that were too low to support the system.
SEPTA DEVELOPMENTS 1978-1983
By 1978 the newest of the PCC cars were fully depreciated. Thub the trolley fleet, despite halfhearted cosmetic repairs in the mid-1970s, was nearing collapse. More than 20 years of inadequate track renewals and inattention to the traction power system contributed to the malaise . SEPTA finally recognized what even NCL had admitted reluctantly more than 20 years earlier--that the five trolley routes that used the surface car subway were permanent. Accordingly in 1979 SEPTA awarded a contract to Nissho-Iwai for 112 new light rail vehicles (LRVs) for these routes, these cars were delivered in 1981 and 1982.
In the meantime the city was pursuing several activities that aided somewhat the seven surface trolley routes. The condition of some track streets had grown so terrible that many of the city's street reconstruction projects were on trolley routes. Because, in these instances, the city paid for excavation and paving in the track area, SEPTA cooperated and renewed the rail. Second, in compliance with Environmental Protection Agency (EPA) mandates, the city provided exclusive trolley lanes along portions of three trolley routes on comparatively wide streets, the lanes were demarcated in a low-cost "paint and signs" format. The EPA issued these mandates in the November 28, 1973, Federal Register and specified certain corridors for transit preferential strategies. In view of these factors, and of ecological and energy considerations, the new SEPTA management advanced a project for a thorough overhaul of 148 (later reduced to 112) PCC cars for the seven surface trolley routes. Officially, however, the PCC overhaul program was a stopgap measure to buy about 8 years of extended service while a permanent modal choice was deliberated for these routes. Production of the rebuilt cars commenced in 1980 at the slow rate of two per month. At the end of 1984, 80 cars had been completed.
The overall situation deteriorated until 1977
115
when Mayor Rizzo concluded that it was time to replace his SEPTA board appointees and put Hillel Levinson, the city's Managing Director, on the board. Levinson was an attorney who had demonstrated a problem-solving ability and a competence for management of complex organizations. About the same time, the disenchantment of the suburbs with SEPTA Board Chairman McConnon' s performance led to his replacement by John MacMurray, a Bell Telephone financial executive, who determined the true state of the property by establishing a crude reporting system and analyzing available data at his kitchen table. MacMurray had the votes to discharge the general manager, but he was not able to employ a manager selected by his own committee. Nevertheless, he had begun a turn-around and the true and appalling condition of the plant was becoming known outside SEPTA. MacMurray's replacement was David F. Girard Di Carlo, a labor attorney appointed by the governor, who had become familiar with the authority while serving as its labor counsel. Girard Di Carlo persuaded the board to hire an effective manager from outside the city, David Gunn.
Gunn speeded up the rebuilding of the bus, subway, and elevated systems and began to work on a better management structure for the commuter railroads under the deadlines established by Congress to take Conrail out of this role. The North Philadelphia trolley system continued to languish, in part because of inadequate funds and limited staff capabilities.
In the meantime, the new SEPTA management became entangled in several disagreements with the city over such projects as the Center City Commuter Railroad Connection (linking two disparate rail systems) and the new Airport High-Speed Rail Line, both under construction by the city in 1980. SEPTA also took issue with the city's plan for reconstruction of the 6-mi Frankford Elevated structure. unfortunately, by 1982, yet another period of strained relations with the city ensued. SEPTA also attempted to blame many of its problems on so-called "dualownership," or the fact that the city designed, built, and owned much of the rapid transit infrastructure. In essence SEPTA resisted city involvement in the public transportation function, save for its subsidy contribution. It is in this climate that discussion of the trolley system from 1982 to the present must be viewed.
For a while it appeared that SEPTA might perceive the value of such a large in-place, albeit deteriorated, trolley system the likes of which many cities of the western United States are having to pay enormous costs to obtain (San Diego, Sacramento, San Jose, Portland, Long Beach) • However, by the early part of 1982, SEPTA's internal staff committee put forth the results of its deliberations in a draft report that one critic described as a perfect committee report, meaning that it had parts written by supporters of the trolley system and other sections prepared by members who thought the diesel bus offered the cheapest and best possible service. Because of strong criticism, the report ostensibly went back to the drafting table for considerable rework only to appear 8 months later in November 1982 with only superficial changes (.~).
It appeared obvious that top SEPTA management had decided to scrap the trolley lines. The city staff was somewhat ambivalent about some routes and agreed with a few of SEPTA's recommendations; on the whole, however, there was a strong sentiment that the system was too valuable to be scrapped. The year 1983 was the last year of Mayor William J. Green's term. The city administration was arguing with SEPTA about the proper level of fares for the commuter rail 1 ines and was being er i ticized by the city council for turning over the Frankford Elevated reconstruc-
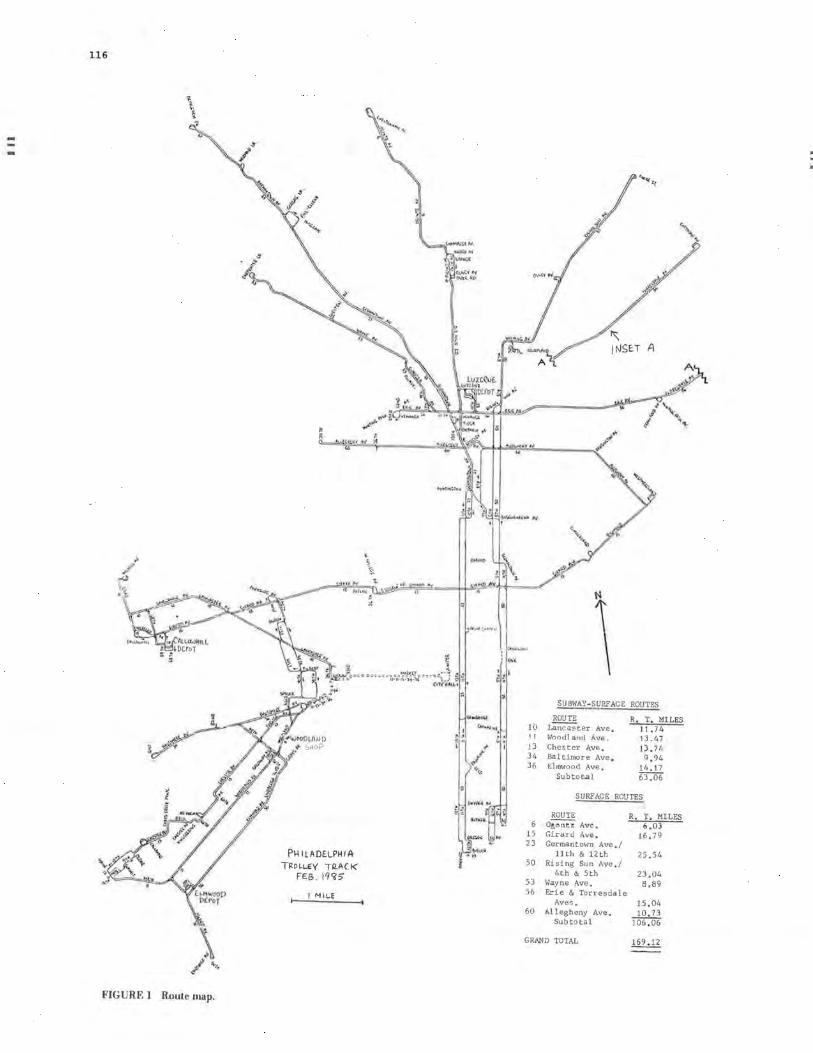
116
---
FIGURE 1 Route map.
"'"" 'M
p~ I LAOE.L.PHI~ Tl<ol.L . .EY TQ.A(K
FEB. 19'?5"
I MILE
" l. ~
•-.Miilit
"""'· ;1 ~l '1\
'I-_,
10 11 13 34 36
6 15 23
50
53 56
60
SUBWAY-SURFACE ROUTES
ROUTE
L~ter Ave . Wood] and Ave_
Chester Ave. Baltiroore Ave . Elmwood Ave.
Subtotal
R. T. MILES 11. 74 13.47 13. 74 9.94
14.17 63.06
SURFACE ROUTES
ROUTE
0~ Ave. Girard Ave . Germantown Ave./
11th & 12th Rising Sun Ave./
4th & 5th Wayne Ave . Erie & Torresdale
Aves . Allegheny Ave.
Subtotal
R. T. MILES 6 .03
16. 79
25 . 54
23.04 8.89
15.04 10.73
106 . 06
GRAND TOTAL
Resuscitating an Old Trolley System
t ion project to SEPTA. Consequently, there was not much effort focused on the trolley system. But an emboldened SEPTA, feeling its strength, decided to force the issue and announced that it would go to public hearings to abandon trolley service on three routes immediately and would plan to abandon the other four routes when either the rebuilt PCC cars wore out or when some major problem developed with the track or power system (communication from SEPTA to Mayor W.J. Green, May 12, 1982). Consequently, in July 1983, Mayor Green wrote to Lewis F. Gould, Chairman of SEPTA, that the city acquiesced in SEPTA's decision to hold immediate hearings on the possible abandonment of trolley service on three routes, noting that the whole issue of the evaluation of the mode to be used would require "ongoing cooperation between the city and SEPTA," and convening a task force to "review the possible testimony on these three route conversions and to ensure cooperation on all outstanding issues with respect to these three routes and the other surface streetcar routes in the city" (Mayor W.J. Green to Lewis P. Gould, July 11, 1983). As a result of this letter, a task force of eight members, chaired by John Bailey, a consultant to the city, was established. The member agencies of the task force were the SEPTA Operations Planning Department; the city's Departments of Public Property, Streets, Police, and wateri the City Planning Commission; and the Philadelphia Parking Authority.
Realizing the short time remaining in the Green administration and being aware of the pressure of the SEPTA staff to proceed with their trolley abandonment hearings, the task force was organized and held its first meeting on August 31, 1983. The task force clearly understood that it had a difficult assignment, that no funds were appropriated for retention of consultant assistance, and that the obvious deadline of a report to an outgoing administration in only 4 months would be extremely difficult to meet.
The task force held meetings during those 4 months, assigned work elements to subcommittees, and approached the end of the year without agreement on a course of action. Nonetheless, the chairman (one of the authors of this paper) felt that a consensus could be developed around a middle-of-the-road set of decisions based on several pieces of information developed during the 4 months and identified briefly herein.
First, it appeared that SEPTA had used an extremely high cost for procurement of new trolleys--$1 million each when recent procurements suggested that $650,000 would be more appropriate for nonarticulated cars. Second, excluding some broadly based capital projects that cut across several modes, it appeared that SEPTA had invested less than half as many capital dollars per rider in the trolley network as in the low-capital bus system ($117 versus $262) and had already committed more than $1,500 per rider to the commuter rail system. In 1984, the seven surface trolley routes carried 97,000 riders per day compared to 80,000 on the entire commuter rail network. Obviously, the surface rail system had been starved for funds. A third factor evaluated was that SEPTA's analysis had not given adequate consideration to the 3 3 percent larger carrying capacity of a trolley compared to a single bus even though these routes carried large numbers of riders. Nor had SEPTA given adequate consideration to the reduced pollutant levels of the electric trolley in residential neighborhoods.
Additional difficulty arose in programming street and track reconstruction projects because many of the North Philadelphia trolley routes are on state highways. It had been thought that putting an additional member on the task force to represent the
117
state would only have complicated the process and extended it by many months; thus a major voice was absent, but the overall views of the Pennsylvania Department of Transportation (PennDOT) on the issue were known.
The chairman drafted a report based on his assessment of those task force factors and his professional evaluation of the SEPTA planning report. He hoped to develop a consensus around his "middleof-the-road assessment" of the committee's views (6). This draft was distributed to the committee and elicited strong opposition on the part of several members of the committee who still desired to explore several aspects in much more depth. That exploration would have taken both time and funds that were not available. Although the chairman concluded that further deliberation probably would not change his position, it might also be noted that the strongest trolley advocate on the task force considered ill-advised even the 2-mi of trackage that the report recommended for elimination.
The basic conclusion of the report was that trolley service should be retained or reinstituted on five routes and that part of the sixth route be eliminated. The report concluded that SEPTA' s capital budget could provide the funds for new cars, timely replacement of tracks and traction power systems, and necessary improvements to carhouse facilities. A brand new heavy overhaul shop for LRVs, with capacity for cars on seven North Philadelphia lines, opened in June 1984. The report observed that there was no identifiable source of capital funds in the Department of Street's budget to cover paving costs but that, to date, no track or street reconstruction project had failed to be completed because of these 1 imitations. The report further suggested that the city would have to face and resolve the problem of inadequate street funds whether or not the trolley system were retained, especially because buses cause substantial wear and tear on streets.
The seventh line, which the report left in limbo, was Route 60 on Allegheny Avenue from Richmond Street on the east to 35th Street on the west. This route was converted temporarily to bus operation in September 1977, primarily because of a shortage of operable PCC cars. However, when the car shortage eased in 1982, this route was passed over for restoration of trolley service because the track was in such disrepair--most of it dates from the early 1920s. Route 60 connects with Route 15 trolley line at Richmond Street, passes under the Frankford Elevated at Kensington Avenue, over the Broad Street subway, and within one block of the Allegheny station on the commuter rail system. Thus it is a major connector for several substantial employment and residential communities. However, it appeared that the SEPTA budget could not cover immediate replacement of the 10 mi of track that would be essential to return this line to service. It was suggested that some method of funding, other than the normal channels, had to be secured for Allegheny Avenue or trolley service on Allegheny Avenue would be abandoned permanently. Actually, a SEPTA planner had suggested a demonstration of LRT quality of service on a North Philadelphia trolley line rebuilt to LRT standards within a relatively short period of time. This was the general tenor of the draft task force report.
CURRENT CITY ADMINISTRATION--1984
Immediately after Mayor W. Wilson Goode took office on January 2, 1984, his attention was diverted to several issues more pressing than the trolley system. However, during April 1984, several meetings were
118
held, some involving Mayor Goode's cabinet members, to evolve a formal city policy on the trolley system. City Managing Director Leo A. Brooks, Mayor Goode's cabinet member who is specifically charged with transportation policy matters, agreed with the task force report but took its recommendations one step further by concluding that the entire trolley system, even the few miles that the task force had acceded to abandoning, should be revitalized. He and the city's two SEPTA board representatives took such a recommendation to Mayor Goodei he concurred and formally committed this policy to writing in a letter (addressed to Judith Harris and Mary Harris) to the
SEPTA board on May 11, 1984. It should be noted that the public hearings con
ducted by SEPTA during August 1983 on conversion of three trolley routes to diesel bus operation elicite~ verbal and written testimony that was 85 percent in favor of keeping and upgrading the trolley system. Nevertheless, the SEPTA staff attempted to secure board approval of trolley service abandonment on these three routes in December 1983 and again in March 1984 but failed on both occasions. In view of Mayor Goode' s policy statement in favor of trolley retention, no further board action on abandonment has been sought by the SEPTA staff.
The Mayor's policy decision was based on the following considerations:
1. No on-site pollution would occur in the populated neighborhoods served by the trolleys.
2. Higher transit ridership and revenue potential, and lower operating expenses, would result from upgraded trolley service compared to diesel buses over the long term.
3. The five routes currently served by trolleys should continue to have trolley service while the car fleet and infrastructures are renewed. A sixth route, currently served by buses, should resume trolley service as soon as possible. All six of these routes have a schedule requirement of 91 cars, which should make efficient use of the fleet of 112 rehabilitated PCC cars until new cars can be provided.
4. The seventh route, Allegheny Avenue, should continue to have temporary bus service while the city seeks a federal demonstration grant for rebuilding the route to LRT standards.
5. Improved trolley operation affords a higher level of service than do diesel buses and, in general, accents the character of the neighborhood through which they operate. The 97,000 daily riders on these seven routes (more than the entire commuter rail system) warrant the long-deferred capital investment in better trolley service.
6. The condition of many track streets is so bad that total street and utility construction would likely be required within the next 10 to 15 years even if the trolleys were abandoned. It would be more cost-effective to rebuild these streets sooner, say within 6 years, with new trolley tracks and reap the long-term service , economic, and environmental dividends from upgraded trolley service.
7. It is estimated that the capital resources required over the next 6 years for six of the seven trolley routes would comprise only 13. 7 percent of anticipated funding levels (1984). This compares to only 1. 6 percent of capital funding that was allocated to these routes during the period 1972-1984. These routes carry about 6 percent of SEPTA's ridership. Un a typical weekday these six trolley routes carry 80,000 riders, as many as the 12 SEPTA commuter railroad branches. In simple terms, the capital requirements for the trolley routes are not inordinate.
8. Most trolley routes operate on state-main-
TRB State-of-the-Art Report 2
tained streets. Because the Commonwealth of Pennsylvania has not been able to provide top-quality maintenance to the highway system in Philadelphia, it would be cost-effective to include some track area paving reconstruction in SEPTA's UMTA-funded grants. Relatively speaking, recent UMTA capital funds have been more plentiful than federal or state highway funds. The mountable curbs contemplated in the Allegheny Avenue concept would make the track area somewhat less useful to motorists and truckers.
In spite of the mayor's policy decision, the SEPTA board's refusal to sanction trolley abandonment, and SEPTA staff's own documentation of capital needs on the trolley system, little progress has been noted since May 1984. Engineering projects for new cars and a new carhouse have been included in SEPTA'S FY 1985 capital budgeti however, nothing substantive has transpired in regard to the critical track and traction power needs. At this writing (February 5, 1985), the city administration finds itself in a quandary somewhat parallel to that faced by a minority stockholder in a large private corporation: "How does one get an obdurate majority to change its policies to give a fair break to the minority's clients?" Unfortunately, the city cannot "sell out," so to speak, because it could not stand the political heat of turning city residents' transit needs over completely to the suburban-dominated SEPTA board.
Thus it would appear that the city administration may have to acquiesce to SEPTA's uncooperative and insensitive actions or decide to develop a tight, highly professional set of analysts incorporated in the mayor's office. The intent would be to influence every SEPTA-related decision so the city's economic power would be used to the fullest. This potential battle may not be successful, but it appears preferable to the first and only other alternative-passivity and the resulting continued decline in the quality of service on the entire SEPTA City Transit Division.
ALLEGHENY AVENUE LIGHT RAIL PROJECT--1984
As stated before, trolley service on Allegheny Avenue was temporarily withdrawn in September 19771 the immediate cause was a shortage of PCC cars. However, for many years before that, the track, most of which dates from the 1920s, had been in poor condition with considerable attendant wear-and-tear to the rolling stock. Accordingly, when the PCC equipment shortage subsequently eased, this route was passed over for restoration of trolley service. Because virtually all of the track structure was deteriorated, piecemeal renewals were viewed as ineffectual.
In 1982 informal discussion ensued on a demonstration grant to fund rebuilding the entire route to LRT standards in a short time frame. Mayor Green's trolley task force draft report documented the concept in December 1983, and Mayor Goode specifically endorsed it in May 1984.
The proposed project qualifies for special demonstration funding for several reasons. It is novel in a broad sense because it is the first known domestic attempt to install an LRT line in a densely populated old industrial city with only a few wide streets available for improved surface transit. The upgraded transit and reconstructed highway and utility facilities would be evaluated to determine whether they slowed the process of disinvestment or sped up reinvestment in the neighborhoods along the route, or both. As alluded to earlier, the trolley infrastructure is totally depleted so timely reconstruction of the route under normal UMTA Section 3
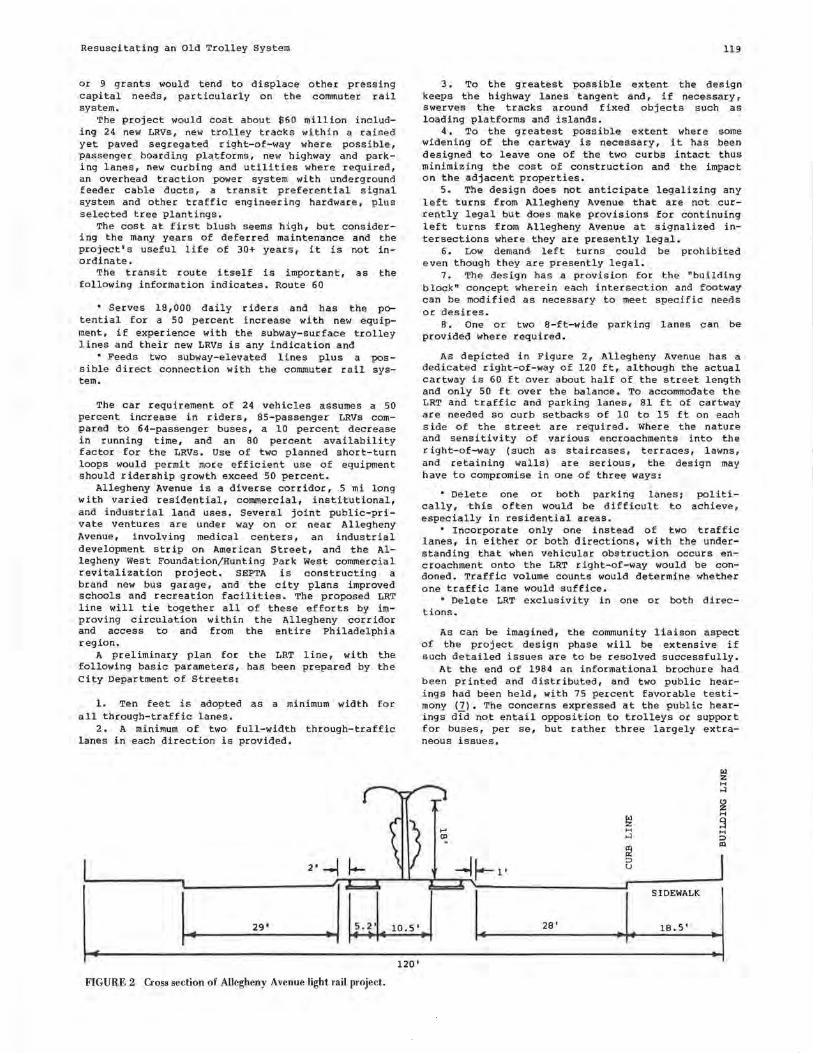
Resuscitating an Old Trolley System
or 9 grants would tend to displace other pressing capital needs, particularly on the commuter rail system.
The project would cost about $60 million including 24 new LRVs, new trolley tracks within a raised yet paved segregated right-of-way where possible, passenger boarding platforms, new highway and parking lanes, new curbing and utilities where required, an overhead traction power system with underground feeder cable ducts, a transit preferential signal system and other traffic engineering hardware, plus selected tree plantings.
The cost at first blush seems high, but considering the many years of deferred maintenance and the project's useful life of 30+ years, it is not inordinate.
The transit route itself is important, as the following information indicates. Route 60
• Serves 18,000 daily riders and has the potential for a 50 percent increase with new equipment, if experience with the subway-surface trolley lines and their new LRVs is any indication and
• Feeds two subway-elevated lines plus a possible direct connection with the commuter rail system.
The car requirement of 24 vehicles assumes a 50 percent increase in riders, BS-passenger LRVs compared to 64-passenger buses, a 10 percent decrease in running time, and an 80 percent availability factor for the LRVs. Use of two planned short-turn loops would permit more efficient use of equipment should ridership growth exceed 50 percent.
Allegheny Avenue is a diverse corridor, 5 mi long with varied residential, commercial, institutional, and industrial land uses. Several joint public-private ventures are under way on or near Allegheny Avenue, involving medical centers, an industrial development strip on American Street, and the Allegheny West Foundation/Hunting Park west commercial revitalization project. SEPTA is constructing a brand new bus garage, and the city plans improved schools and recreation facilities. The proposed LRT line will tie together all of these efforts by improving circulation within the Allegheny corridor and access to and from the entire Philadelphia region.
A preliminary plan for the LRT line, with the following basic parameters, has been prepared by the City Department of Streets:
1. Ten feet is adopted as a minimum width for all through-traffic lanes.
2. A minimum of two full-width through-traffic lanes in each direction is provided.
2' -I ~
119
3. To the greatest possible extent the design keeps the highway lanes tangent and, if necessary, swerves the tracks around fixed objects such as loading platforms and islands.
4. To the greatest possible extent where some widening of the cartway is necessary, it has been designed to leave one of the two curbs intact thus minimizing the cost of construction and the impact on the adjacent properties.
5. The design does not anticipate legalizing any left turns from Allegheny Avenue that are not currently legal but does make provisions for continuing left turns from Allegheny Avenue at signalized intersections where they are presently legal.
6. Low demand· left turns could be prohibited even though they are presently legal.
7, The design has a provision for the "building block" concept wherein each intersection and footway can be modified as necessary to meet specific needs or desires.
8. One or two 8-ft-wide parking lanes can be provided where required.
As depicted in Figure 2, Allegheny Avenue has a dedicated right-of-way of 120 ft, although the actual cartway is 60 ft over about half of the street length and only 50 ft over the balance. To accommodate the LRT and traffic and parking lanes, 81 ft of cartway are needed so curb setbacks of 10 to 15 ft on each side of the street are required. Where the nature and sensitivity of various encroachments into the right-of-way ( such as staircases, terraces, lawns, and retaining walls) are serious, the design may have to compromise in one of three ways:
• Delete one or both parking lanes; politically, this often would be difficult to achieve, especially in residential areas.
• Incorporate only one instead of two traffic lanes, in either or both directions, with the understanding that when vehicular obstruction occurs encroachment onto the LRT right-of-way would be condoned. Traffic volume counts would determine whether one traffic lane would suffice.
• Delete LRT exclusivity in one or both directions.
As can be imagined, the community liaison aspect of the project design phase will be extensive if such detailed issues are to be resolved successfully.
At the end of 1984 an informational brochure had been printed and distributed, and two public hearings had been held, with 75 percent favorable testimony (7). The concerns expressed at the public hearings did not entail opposition to trolleys or support for buses, per se, but rather three largely extraneous issues.
I'll z H ...:i
l!l z ~
H
~ H H ...:i ::,
gi Ill
::, u
.I. SIDEWALK
:I 28' 18.5 1 I . 1. 29 1 ./kW 120'
FIGURE 2 Cross section of Allegheny Avenue light rail project.
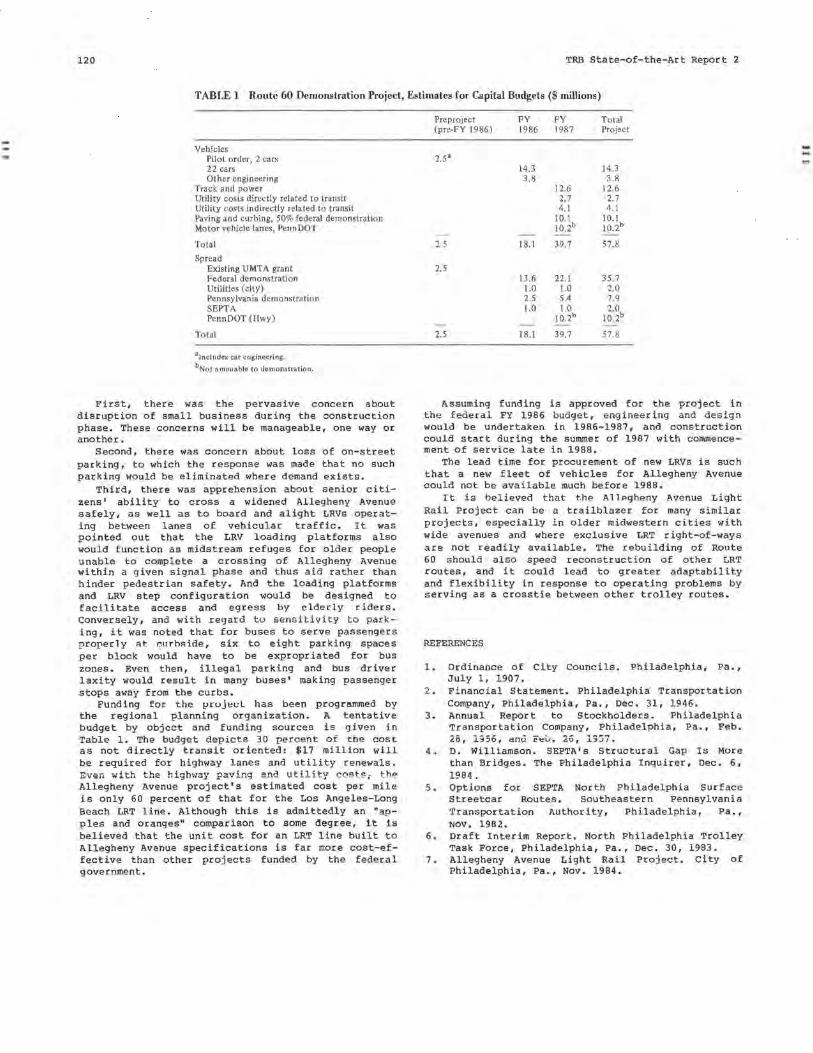
120 TRB State-of- the-Art Report 2
TABLE 1 Route 60 Demonstration Project, Estimates for Capital Budgets($ millions)
Vehicles Pilot order, 2 cars 22 cars Other engineering
Track and power Utility costs directly related to transit Utility costs indirectly related to transit Paving and curbing, 50% federal demonstration Motor vehicle lanes, Penn DOT
Total
Spread Existing UMTA grant Federal demonstration Utilities (city) Pennsylvania demonstration SEPTA PennDOT (Hwy)
Total
3 Jncludes car engineering.
bNot amenable to demonstration.
First, there was the pervasive concern about disruption of small business during the construction phase. These concerns will be manageable, one way or another.
Second, there was concern about loss of on-street parking, to which the response was made that no such parking would be eliminated where demand exists.
Third, there was apprehension about senior citizens' ability to cross a widened Allegheny Avenue safely, as well as to board and alight LRVs operating between lanes of vehicular traffic. It was pointed out that the LRV loading platforms also would function as midstream refuges for older people unable to complete a crossing of Allegheny Avenue within a given signal phase and thus aid rather than hind er pedestrian safety. And the loading platforms and LRV step configuration would be designed to facilitate access and egress by elderly riders. Conversely, and with regar d to sensi t ivity to parking, it was noted that for buses to serve passengers properly at c11rh!'lide, six to eight parking spaces per block would have to be expropriated for bus zones. Even then, illegal parking and bus driver laxity would result in many buses' making passenger stops away from the curbs.
Funding for the l!rojecL has been programmed by the regional planning organization. A tentative budget by object and funding sources is given in Table 1. The budget depicts 30 pe r cent o r the cost as not directly transit oriented: $17 million will be required for highway lanes and utility renewals, Even with the highway pa,1ing and utility costs, the Allegheny Avenue project's estimated cost per mile is only 60 percent of that for the Los Angeles-Long Beach LRT line. Although this is admittedly an "apples and oranges" comparison to some ~egree, it is believed that the unit cost for an LRT line built to Allegheny Avenue specifications is far more cost-effective than other projects funded by the federal government.
Pre project FY FY Total (pre-FY 1986) 1986 1987 Project
2.5• 14.3 14.3 3.8 3.8
12.6 12.6 2.7 2.7 4.1 4.1
10.l 10.1 10.2b 10.2b
2.5 18.1 39.7 57.8
2.5 13.6 22.1 35.7
1.0 1.0 2.0 2.5 5.4 7.9 1.0 1.0 2,0
10.2b 10 2b
2.5 18. 1 39.7 57.8
Assuming funding is approved for the project in the federal FY 1986 budget, engineering and design would be undertaken in 1986-1987, and construction could start during the summer of 1987 with commencement of service late in 1988.
The lead time for procurement of new LRVs is such that a new fleet of vehicles for Allegheny Avenue could not be available much before 1988.
It is believed that the Al lP.gheny Avenue Light Rail Project can be a trailblazer for many similar projects, especially in older midwestern cities with wide avenues and where exclusive LRT right-of-ways are not readily available. The rebuilding of Route 60 should also speed reconstruction of other LRT routes, and it could lead to greater adaptability and flexibility in response to operating problems by serving as a crosstie between other trolley routes.
REFERENCES
l, Ordinance of City Councils. Philadelphia, Pa . , July 1, 1907.
2 . Financial Statement. Philadelphia Transportation Company, Philadelphia, Pa., Dec. 31, 1946.
3 . Annual Report to Stockholders. Philadelphia Transportation Company, Philadelphia, Pa., Feb. 28, 1956, arid F~b. 26, 1;57.
4. D. Williamson. SEPTA ' s Structural Gap Is More than Bridges. The Philadelphia Inquirer, Dec. 6, 1984.
s . Options for SEPTA North Philadelphia surface Streetcar Routes. Southeastern Pennsylvania Transportation Authority, Philadelphia, Pa., NOV. 1982.
6. Draft Interim Report. North Philadelphia Trolley Task Force, Philadelphia, Pa., Dec. 30, 1983.
7. Allegheny Avenue Light Rail Project. City of Philadelphia, Pa., Nov. 1984.
Realities of Constructing LRT in City Streets Rick Thorpe San Diego Metropolitan Transit Development Board San Diego, California
The San Diego light rail transit (LRT) system, commonly referred to as the San Diego Trolley, began operation on July 26, 1981. The system extends from the Amtrak Station in downtown San Diego through the Centre City area and connects with the San Diego and Arizona Eastern (SD&AE) Railway. The LRT system then continues southerly along the SD&AE Railroad to San Ysidro near the international border with Mexico (Figure 1). Approximately 1. 7 mi of the 15. 9-mi system is in city streets.
The San Diego Metropolitan Transit Development Board (MTDB) is now in the process of extending the existing LRT system to the east. The East Urban line will extend from the Centre City easterly 17.3 mi to El Cajon (Figure 2). The same 1. 7 mi of trackage within downtown city streets will be used. Additionally, the East Urban line will use an additional 2 mi east of the downtown on city streets before entering exclusive railroad right-of-way.
Design on the East Urban line was initiated in October 1982. In May 1984 a 4.5-mi extension referred to as the Euclid line was advertised for construction. Construction on the Euclid line was initiated in June 1984 and the line will open for revenue operations in April 1986.
There were several key factors that affected the direction of the implementation of both the South and East lines of the San Diego Trolley. Initial legislation creating MTDB established certain criteria (1) that were to be followed. It required the MTDB to-
1. Give priority consideration to guideway technology presently available,
2. Require any guideway system to be planned in such a manner that it could be constructed and brought into operation on an incremental basis thus enabling available fiscal resources to be used as early as possible, and
3. Use, to the extent feasible, transportation rights-of-way of public entities in order to minimize the cost of construction.
SOUTH AND EAST LINE ALIGNMENTS
Early in the planning process for the south line construction, the MTDB adopted certain principles (~) in line with legislative mandate that wou l d further direct the design of the system. Two important principles required that the system be designed so that its capital costs would be low, and that construction be primarily at grade with exclusive right-of-way.
In November 1979 the MTDB authorized staff to purchase 108 mi of existing railroad. The purchase had the dual purpose of saving the railroad from abandonment and providing MTDB with exclusive rightof-way for LRT implementation. Both the South and East lines use this right-of-way for the majority of their length. All but approximately 2 mi of the 15. 9-mi South line use existing railroad right-ofway.
However, the railroad right-of-way extends only to the fri nge of Centre City. Planning studies (3) indicated that in order for the system to be successful from a ridership point of view, the line had to penetrate the Centre City. Therefore a method of accessing the Centre City the last few miles had to be determined.
Because of the low-cost aspect of the board's principles, construction within the Centre City area could not be underground or aerial. The only way to meet the board's principle was to determine an atgrade alignment operating in public right-of-way, if possible. Planning studies (!) ultimately resulted in a recommendation that the trolley use 12th Avenue and C Street.
To make possible the use of these city streets, a memorandum of understanding (MOU), which provided for the LRT basis of design, between MTDB and the city was negotiated. A major item that had to be addressed was what to do with the relatively old utilities within the street right-of-way.
Precedent was set in the MOU for operating the South line on city streets. Negotiations subsequently began with the city on a revised MOU that included both the South and the East line.
INFRASTRUCTURE IMPACTS OF LRT ON CITY STREETS
use of city streets was dictated by the need to observe board criteria of low-cost construction primarily at grade. Using city streets also fulfills the requirement of state legislation that calls for MTDB, to the extent feasible, to use rights-of-way of public entities in order to minimize construction costs.
To assemble exclusive private right-of-way for the light rail system within the Centre City would be expensive and time consuming. only under extreme circumstances did MTDB consider the acquisition of private property within the downtown area. Centre City right-of-way was acquired, but only where it was dictated by geometric design.
Trade-offs were required to obtain right-of-way
121
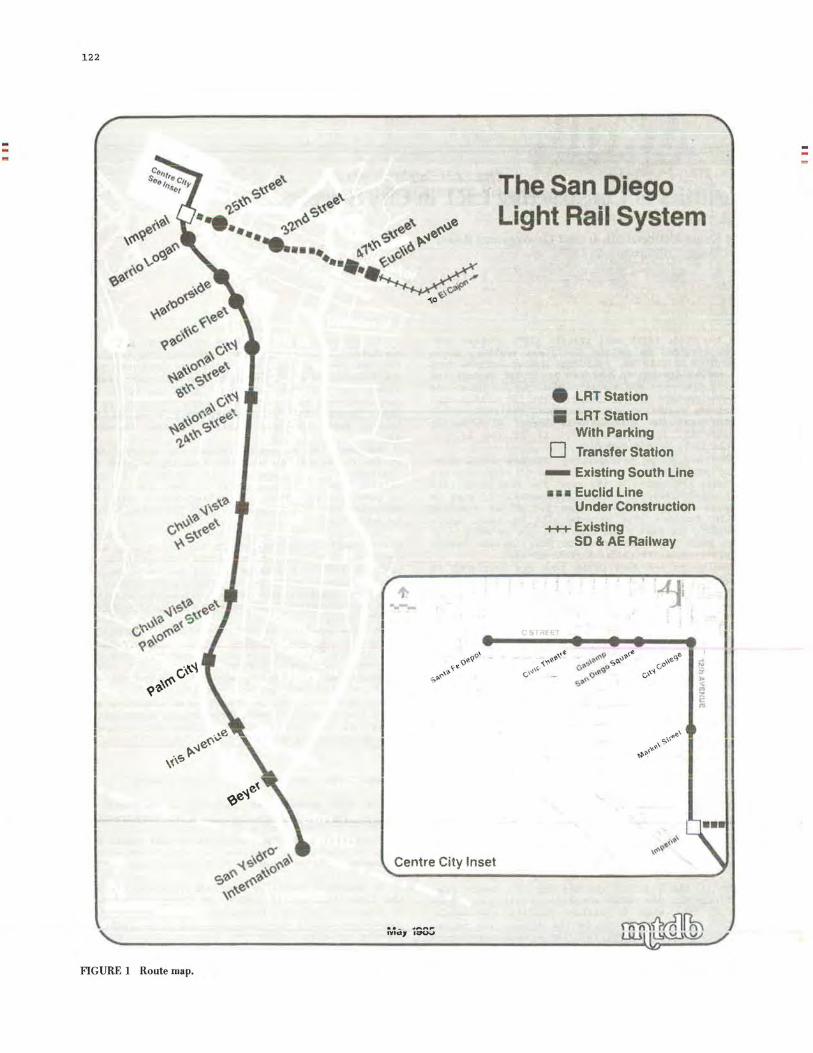
122
.. __ _
Centre City Inset
F1GURE 1 Route map.
The San Diego Light Rail System
• LAT Station
II LRT Station With Parking
D Transfer Station
- Existing South Line
• • • Euclid Line Under Construction
+++ Existing SD & AE Railway
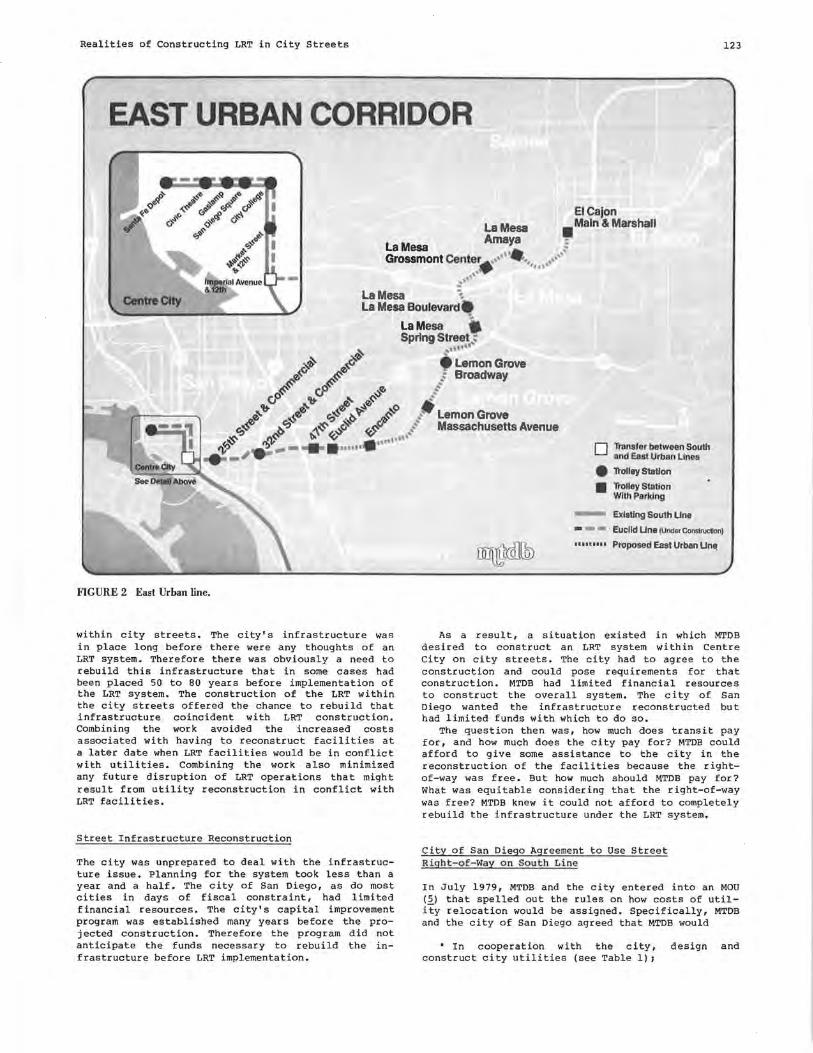
Realities of Constructing LRT in City Streets 123
EAST URBAN CORRIDOR
EIC8Jon La Mesa •_. Main & Marshall
L M Amaya a esa .• ,
Grossmont Center6' ' • ,, ,,•'' .. .,.,, . ~
La Mesa ~ La Mesa Boulevard It
La Mesa • Spring Street,.: ,, ... ~ ~ . i),f6 'li<EJ Lemon Grove
0' ,,..~ •• Broadway t$!-~ ~o'' •' cf' ,,_v- io.. ,.:.ve, /
,,. !I. . ii' ~q; 0 • ;;- ~e,e c,>$ b ti' ~ • Lemon Grove
c,~6 be:, ()..-$'- v~ .(q'<I ,i Massachusetts Avenue r.f bo ~ . ....... .
(!) -- 1111• II
F1GURE 2 East Urban line.
within city streets. The city's infrastructure was in place long before there were any thoughts of an LRT system. Therefore there was obviously a need to rebuild this infrastructure that in some cases had been placed 50 to 80 years before implementation of the LRT system. The construction of the LRT within the city streets offered the chance to rebuild that infrastructure coincident with LRT construction. Combining the work avoided the increased costs associated with having to reconstruct facilities at a later date when LRT facilities would be in conflict with utilities. Combining the work also minimized any future disruption of LRT operations that might result from utility reconstruction in conflict with LRT facilities.
Street Infrastructure Reconstruction
The city was unprepared to deal with the infrastructure issue. Planning for the system took less than a year and a half. The city of San Diego, as do most cities in days of fiscal constraint, had limited financial resources. The city's capital improvement program was established many years before the projected construction. Therefore the program did not anticipate the funds necessary to rebuild the infrastructure before LRT implementation.
O TmnsJf,lr 1>e1woen South a.nd EHi Urban L ncs
• ltolley Station
a Trolley'Statlon Wl lh Parklrig
Existing South Une
• - Euclid Uno IUn<fer Construction)
"""'" Proposed East Urban Un~
As a result, a situation existed in which MTDB desired to construct an LRT system within Centre City on city streets. The city had to agree to the construction and could pose requirements for that construction. MTDB had limited financial resources to construct the overall system. The city of San Diego wanted the infrastructure reconstructed but had limited funds with which to do so.
The question then was, how much does transit pay for, and how much does the city pay for? MTDB could afford to give some assistance to the city in the reconstruction of the facilities because the rightof-way was free. But how much should MTDB pay for? What was equitable considering that the right-of-way was free? MTDB knew it could not afford to completely rebuild the infrastructure under the LRT system.
City of San Diego Agreement to Use Street Right-of-Way o n South Line
In July 1979, MTDB and the city entered into an MOU (I) that spelled out the rules on how costs of utility relocation would be assigned. Specifically, MTDB and the city of San Diego agreed that MTDB would
• In cooperation with the city, design and construct city utilities (see Table 1) 1
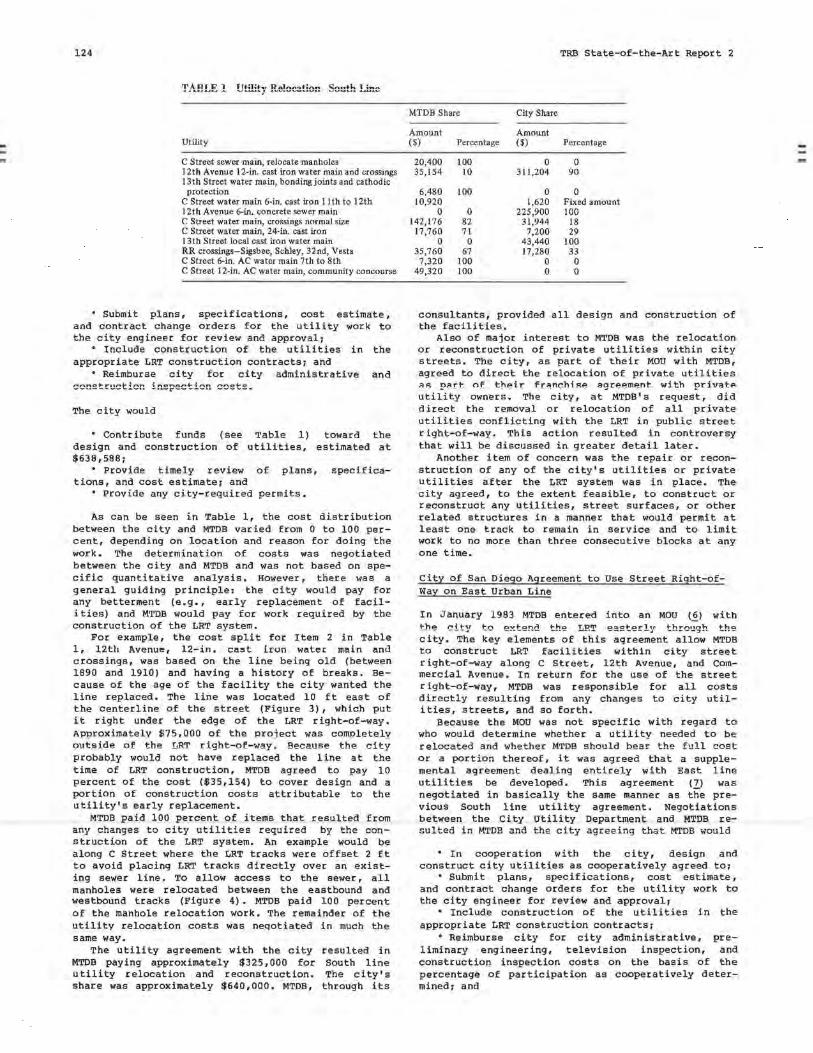
124
TABLE l
Utility
C Street sewer main, relocate manholes 12th Avenue 12-in. cast iron water main and crossings 13th Street water main, bonding joints and cathodic
protection C Street water main 6-in. cast iron 11th to 12th 12th Avenue 6-in. concrete sewer main C Street water main, crossings normal size C Street water main, 24-in. cast iron 13th Street local cast iron water main RR crossings-Sigsbee, Schley, 32nd, Vesta C Street 6-in. AC water main 7th to 8th C Street 12-in. AC water main, community concourse
• Submit plans, specifications, cost estimate, and contract change orders for the utility work to the city engineer for review and approvali
• Include construction of the utilities in the appropriate LRT construction contracts, and
• Reimburse city for city administrative and ,-.n,nC!+-r1,,..t;n.n ;nap.o,..+-;nn costs.
The city would
• Contribute funds (see Table 1) toward the design and construction of utilities, estimated at $638,5881
• Provide timely review of plans, specifications, and cost estimatei and
• Provide any city-required permits.
As can be seen in Table 1, the cost distribution between the city and MTDB varied from Oto 100 percent, depending on location and reason for doing the work. The determination of costs was negotiated between the city and MTDB and was not based on specific quantitative analysis. However, there was a general guiding principle: the city would pay for any betterment (e.g., early replacement of facilities) and MTDB would pay for work required by the construction of the LRT system.
For example, the cost split for Item 2 in Table 1, 12th Avenue, 12-in. ca,st iron water main and crossings, was based on the line being old (between 1890 and 1910) and having a history of breaks. Because of the age of the facility the city wanted the line replaced. The line was located 10 ft east of the centerline of the street (Figure 3), which put it right under the edge of the LRT right-of-way. APproximatelv S75,000 of the proj ect was completely outs i de of the LRT right-of-way, Because the city probably would not have replaced the line at the time of LRT construction, MTDB agreed to pay 10 percent of the cost (635,154) to cover design and a portion of construction costs attributable to the utility's early replacement.
MTDB paid 100 percent of items that resulted from
struction of the LRT system. An example would be along C Street where the LRT tracks were offset 2 ft to avoid placing LRT tracks directly over an existing sewer line. To allow access to the sewer, all manholes were relocated between the eastbound and westbound tracks (Figure 4). MTDB paid 100 percent of the manhole relocation work. The remainder of the utility relocation costs was neqotiated in much the same way.
The utility agreement with the city MTDB paying approximately $325,000 for utility relocation and reconstruction. share was approximately $640,000. MTDB,
resulted in South line The city's
through its
MTDB Share
Amount ($)
20,400 35,154
6,480 10,920
0 142,176
17,760 0
35,760 7,320
49,320
Percentage
100 10
100
0 82 71
0 67
100 100
City Share
Amount ($)
0 311,204
0 1,620
225,900 31,944
7,200 43,440 17,280
0 0
TRB State-of-the-Art Report 2
Percentage
0 90
0 Fixed amount 100
18 29
100 33
0 0
consultants, provided all design and construction of the facilities.
Also of major interest to MTDB was the relocation or reconstruction of private utilities within city streets. The city, as part of their MOU with MTDB, agreed to direct the relocation of private utilities as, p;i_rt nf thei1" franchiRe agreement: with private utility owners. The city, at MTDB's request, did direct the removal or relocation of all private utilities conflicting with the LRT in public street right-of-way. This action resulted in controversy that will be discussed in greater detail later.
Another item of concern was the repair or reconstruction of any of the city's utilities or private utilities after the LRT system was in place. The city agreed, to the extent feasible, to construct or reconstruct any utilities, street surfaces, or other related structures in a manner that would permit at least one track to remain in service and to limit work to no more than three consecutive blocks at any one time.
City of San Diego Agreement to Use Street Right-ofWay on East Urban Line
In January 1983 MTDB entered into an MOU (.§.) with the city to extend the LRT easterly +-hrnngh the city. The key elements of this agreement allow MTDB to construct LRT facilities within city street right-of-way along C Street, 12th Avenue, and Commercial Avenue. In return for the use of the street right-of-way, MTDB was responsible for all costs directly resulting from any changes to city utilities, streets, and so forth.
Because the MOU was not specific with regard to who would determine whether a utility needed to be relocated and whether MTDB should bear the full cost or a portion thereof, it was agreed that a supplemental agreement dealing entirely with East line utilities be developed. This agreement (7) was negotiated in basically the same manner as the previous South line utility agreement. Negotiations between the City Utility Department and MTDB resulted in MTDB and the city agreeing that MTDB would
• In cooperation with the city, design and construct city utilities as cooperatively agreed toi
• Submit plans, specifications, cost estimate, and contract change orders for the utility work to the city engineer for review and approvali
• Include construction of the utilities in the appropriate LRT construction contracts,
• Reimburse city for city administrative, preliminary engineering, television inspection, and construction inspection costs on the basis of the percentage of participation as cooperatively determinedi and
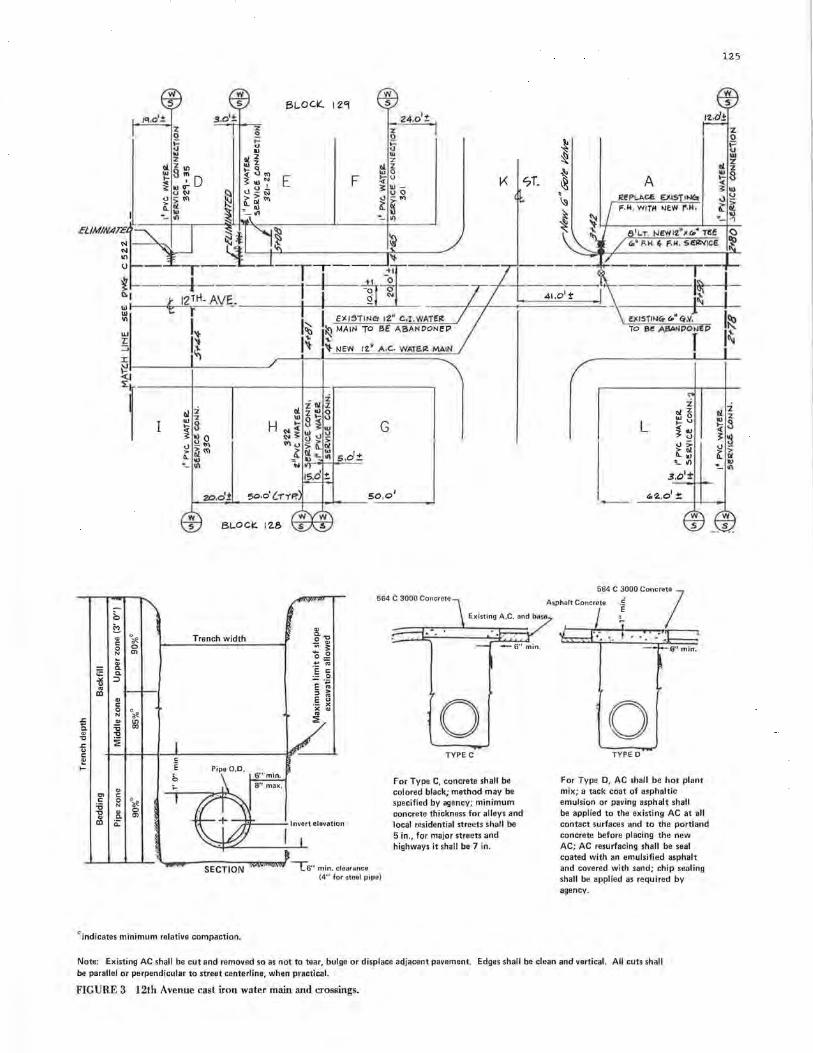
w BLOC.~ i 29
F
s
'% 0
tr ... z
t,L z ., 0
24,o'±
~o ~"' -U 0
£f' ·- IJ)
"'
A ~t'Pt..i>.CE £1.1 1°"" F,lt WIT/4 NEW ~.H,
125
w s
1?.,o'J:.
8 11..T. NEW l?."~Go· Tl!! <:) i:.• F,M. ~ f',H, Sl!:il>(IOE ~
f ii.1 wl U)
"' liJ z: :::;
-T-.-- !-----~~~--- - ,
1 I JI~----- 41 .0 1±'
~ t - I ~ _j___f____;:::=====::::=!...
I I EXl~T INC!f 1Z" C,% . WAT!ft
----T---1~4-
f I
'.E .. al
i ., .., .c
" C:
f I-
en C:
'o .., Cl> al
'+ ~ I~ MAIN TO BE' ASMDONEP
I~ ,~ ~ NE'N 12.• A,C. WAlE.lt MAIN :c >J1-- ----- -------'
~f
b ~ ., 0
C: * 0 0 N m :;; C. C. ::,
Cl> C: 0 0 N * .,
"' ;; "' .., ~
Cl> C: 0 o* N ., 0 C. m a:
I
e E i, ..
Vi 5 BLOC~ 12.8
Trench width
Pipe O.D. 6" min. 8" max .
0 TYPE C
For Type C, concrete shall be colored black; method may be specified by agency; minimum concrete thickness for alleys and local residential streets shall be 5 in., for major streets and highways it shall be 7 in.
_.__.,_......__._ "'-...---S:-E_C_T __ IO_N ____ ,, L6" min. clearance
{4" for steel pipe)
0indicates minimum relative compaction.
L
3,01:t
0 TYPED
For Type D, AC shall be hot plant mix; a tack coat of asphaltic emulsion or paving asphalt shall be applied to the existing AC at all contact surfaces and to the portland concrete before placing the new AC; AC resurfacing shall be seal coated with an emulsified asphalt and covered with sand; chip sealing shall be applied as required by agency.
Note: Existing AC shall be cut and removed so as not to tear, bulge or displace adjacent pavement. Edges shall be clean and vertical. All cuts shall be parallel or perpendicular to street centerline, when practical.
FIGURE 3 12th Avenue cast iron water main and crossings.
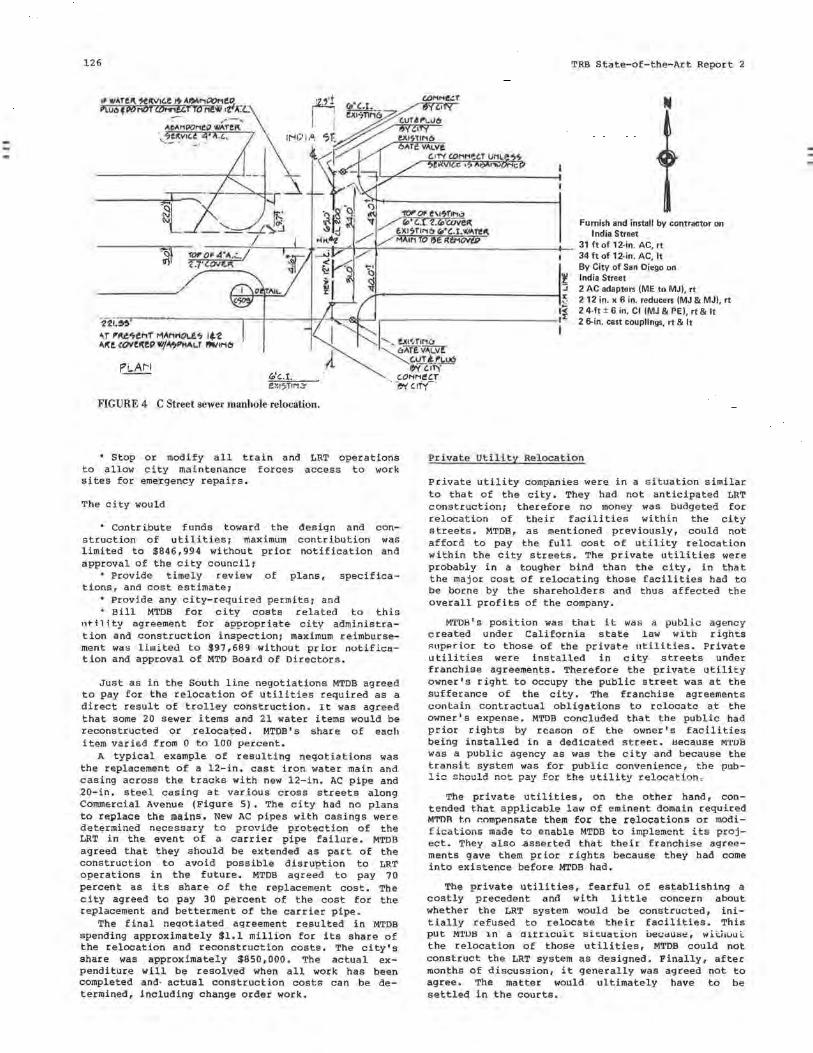
126 TRB State-of-the-Art Report 2
Furnish and install by contractor on India Street
i-.,-,----------------1-- 31 ft of 12-in. AC, rt 34 ft of 12-in. AC, It By City of San Diego on
______ __, / t India Street
....t-----------------1.J 2 AC adapters (ME to MJ), rt r. 2 12 in. x 6 in. reducers (MJ & MJ), rt •i 2 4-ft ± 6 in. Cl (MJ & PE), rt & It
tti.•"~----------,--+---++....,~!!l----'1,----------------1 2 6-in. cast couplings, rt & It
'If l"~'>i!MT' MAMl10\.e', l~'c! I "~e COVCl(er, ~'~PHAt.r i,w.,...~ ' ,, 0 1'.•T'lr,.:,
1· -....___ i:,AiTvA1..v!
e:.'c.t.
-....___q.1_!~-"~ ~,rr, COHMl!GT
1!~17TIM.:: ~ ~~ ,rry-
FIGURE 4 C Street sewer manhole relocation.
• Stop or modify all train and LRT operations to allow city maintenance forces access to work sites for emergency repairs.
The city would
• Contribute funds toward the design and construction of utilities; maximum contribution was limited to $846,994 without prior notification and approval of the city council;
• Provide timely review of plans, specifications, and cost estimate;
• Provide any city-required permits; and • Bill MTDB for city costs related to this
ut i l.i ty agreement for appropriate city administration and construction inspection; maximum reimbursement was limitecl to $97,689 without prior nutiflcation and approval of MTD Board of Directors.
Just as in the South line negotiations MTDB agreed to pay for the relocation of utilities required as a direct result of trolley construction. It was agreed that some 20 sewer items and 21 water items would be reconstructed or relocated. MTDB's share uf each item vari&d from Oto 100 percent.
A typical example of resulting negotiations was the replacement of a 12-in. cast iron water main and casing across the tracks with new 12-in. AC pipe and 20-in. steel casing at various cross streets along Commercial Avenue (Figure 5). The city had no plans to replace the mains, New AC pipes with casings were determined necessary to provide protection of the LRT in the event of a carrier pipe failure, MTDB agreed that they should be extended as part of the construction to avoid possible disruption to LRT operations in the future. MTDB agreed to pay 70 percent as its share of the replacement cost. The city agreed to pay 30 percent of the cost for the replacement and betterment of the carrier pipe.
The final neqotiated agreement resulted in MTDB spending approximately $1.1 million for its share of the relocation and reconstruction costs. The city's share was approximately $850,000. The actual expenditure will be resolved when all work has been completed and· actual construction costs can be determined, including change order work.
Private Utility Relocation
Private utility companies were in a situation similar to that of the city. They had not anticipated LRT construction; therefore no money was budgeted for relocation of their facilities within the city streets. MTDB, as mentioned previously, could not afford to pay the full cost of utility relocation within the city streets. The private utilities were probably in a tougher bind than the city, in that the major cost of relocating those facilities had to be borne by the shareholders and thus affected the overall profits of the company.
MTDB's position was that it was a public agency created under California state law with rights supArior to those of the private utilities. Private utilities were installed in city streets under franchise agreements. Therefore the private utility owner's right to occupy the public street was at the sufferance of the city. The franchise agreements contain contractual obligations to relocate at the owner's expense. MTDB concluded that the public had prior rights by reason of the owner's facilities being installed in a dedicated street. Because l"i·1·uB was a public agency as was the city and because the transit system was for public convenience, the public should net pay fer the utility relocation=
The private utilities, on the other hand, contended that applicable law of eminent domain required M'l'l)R tn r.nmpP.nsate them for the relocations or modifications made to enable MTDB to implement its project. They also ,asserted that their franchise agreements gave them prior rights because they had come into existence before MTDB had.
The private utilities, fearful of establishing a costly precedent and with little concern about whether the LRT system would be constructed, initially refused to relocate their facilities. This put M'l'Ui:1 1n a d1tt1culc sicuation uel:aui;.,, wii:.i,uui:. the relocation of those utilities, MTDB could not construct the LRT system as designed. Finally, after months of discussion, it generally was agreed not to agree. The matter would ultimately have to be settled in the courts.
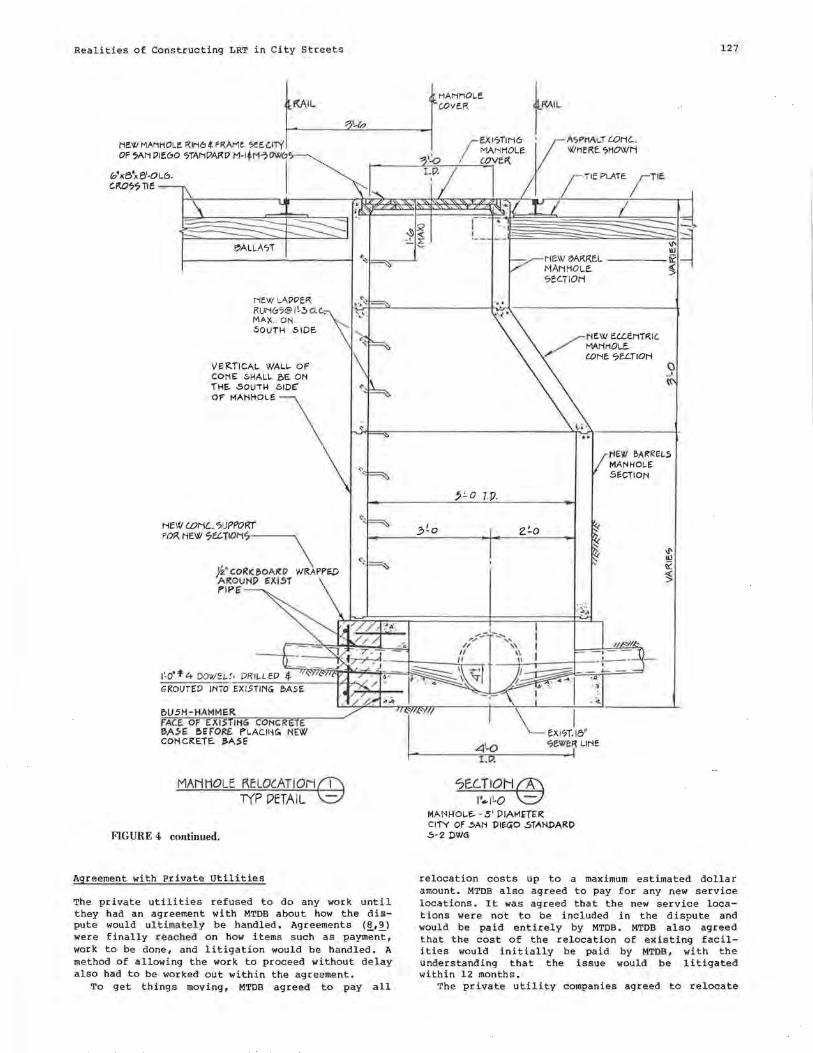
Realities of Constructing LRT in City Streets
i,ALLA<;,T
NEW LAPPER. RUN6';>@f~!>O.C.. MA)( , ON 50UTH 510E.
VER.TICAL WALL. Of COt\E 5HAL\. f>E. ON THE. .SOUTM 61DE' OF t<fANl-+OL!:
HEl(/ l'.OHl. 5UPPOITT FOP.. NEW 7U.TIOH'7\
}&'coRICt,OAIW WRAPPED AROUNP £Xf5i PIPE
e,usH-HAI-IMER. FACE OF EXI.STll'tG NCRE E 6A.S.E e.EFOR£ PLACll~G. NEW COt-1 CRETE. &A.SI:
MAHHOLE RELOCATION@ T'(P DETAIL -
FIGURE 4 continued.
Agreement with Private Utilities
The private utilities refused to do any work until they had an agreement with MTDB about how the dispute would ultimately be handled. Agreements (~1 ~)
were finally reached on how i terns such as payment, work to be done, and litigation would be handled. A method of allowing the work to proceed without delay also had to be worked out within the agreement.
To get things moving, MTDB agreed to pay all
t~,
- ~ NE.W i,AR.F{EL ,/' MANHOLE.
?i:C.TIOH
,J.o 1.v.
'?E.C.TIOH@ l''.11-0 -
MANHOLE- -5' PIAMET6:R CITY OF 5AN PIEl;O .STANDARD 5-2 DWG
127
0 _,
relocation costs up to a maximum estimated dollar amount. MTDB also agreed to pay for any new service locations. It was agreed that the new service locations were not to be included in the dispute and would be paid entirely by MTDB. MTDB also agreed that the cost of the relocation of ex.isting facilities would initially be paid by MTDB, with the understanding that the issue would be litigated within 12 months.
The private utility companies agreed to relocate
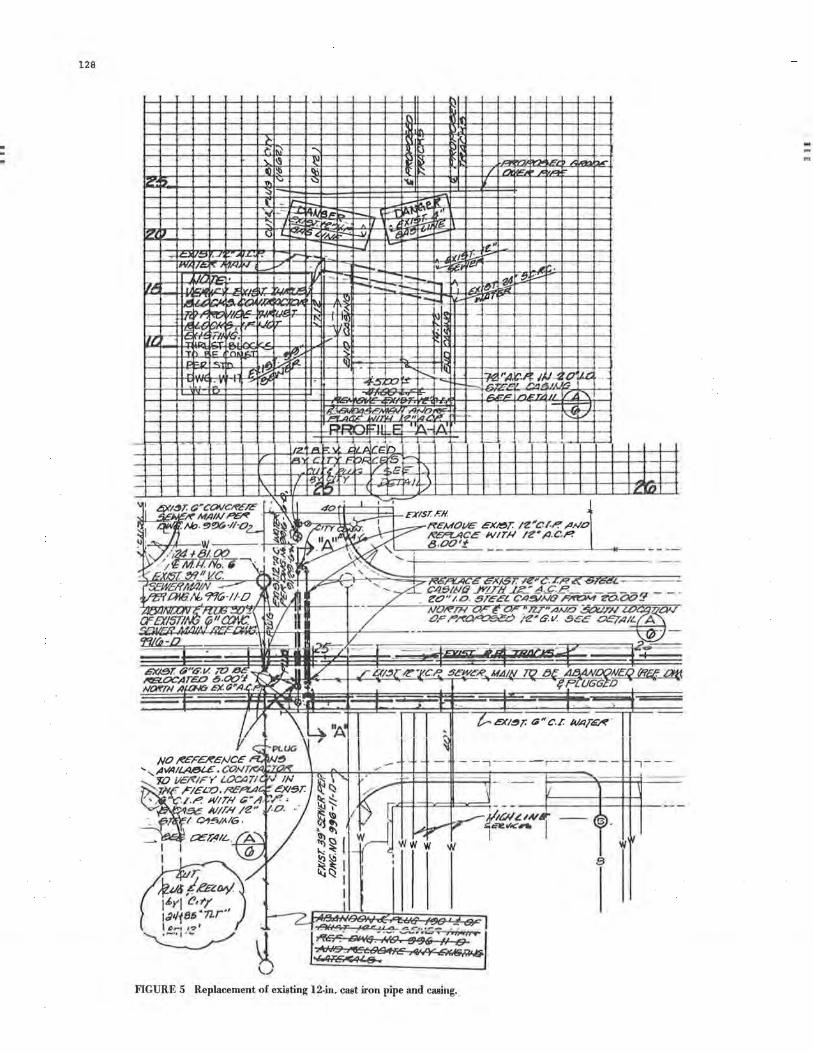
-.. ..
128
1,
>- ~
i'~ ~ '"' J '- ~ ~v i) fl ~ ll-i ~
"' " \;:: '\It
~
\ ~· _, ,. ~ Jr-!::!.•~ eo .. - ... / ,.. ·x, ~ ,c.
~- J -.- - '.!. _,._ -- , ....._
rv.<f/i:I' ,w-,,'!"', V . i -,, -yv- • I/ -
l- • =· • ,.~ ~T Ir~ --
1, ~I ;.-; 1-~ 1 _1._ I
..... " ~ 't
.
-
,_ '-~ ....... ~r..:::: -.._
. ,~ r-....
-!•.:),µ..,"'
·- -~-., -~
. i~ ~Ir
--A ~ -., A ,,. ""' ~,,? ,t l ~.J ...... r'\ C:-11 1 C ii\ r,.
'\.
.,
,_~
,-. -
F1GURE 5 Replacement of exitrting 12-in. cast iron pipe and casing.
,._.. ~ / ,n ~ .... " .. ,, ..... ~
,,, -
-
i I
Realities of Constructing LRT in City Streets
their facilities without undue delay. They also agreed not to charge MTDB for any betterments and to deduct the salvage value of materials from the cost of relocation.
The agreements with the private utilities for the East line were basically the same as for the South line with the exception that MTDB would pay for the relocation cost less 10 percent until the legal dispute was settled. When the case was decided, whoever lost would pay the other funds due plus 7 percent interest.
Portland Law Suit
Currently many agencies that are considering or that are in the process of constructing LRT in city streets (e.g., Santa Clara, Sacramento) are awaiting the results of similar litigation in the State of Oregon before determining any cost allocation attributable to the relocation of private utilities within city streets.
In Portland, Oregon, private utility companies brought suit against the city of Portland and the Tri-County Metropolitan Transportation District (Tri-Met) for having to pay the costs of utility relocation. The trial court and the Court of Appeals found that utilities must pay the cost for relocation in city streets (10). An appeal was subsequently allowed by the Supreme~ourt of Oregon (11).
The Oregon State Supreme Court will hear the appeal soon. A decision is expected sometime this summer. The results of the case will have broadreaching effects on similar situations nationwide, including on MTDB.
SUMMARY AND CONCLUSIONS
The issue of rebuilding the infrastructure as a result of LRT construction is not clear. There is no clear-cut method of determining the necessary reconstruction and relocation work that is a direct result of the construction of the LRT system. Proponents of both sides of the issue--those who think LRT should pay and those who think the utility companies should pay--have convincing arguments.
MTDB's approach was to negotiate an equitable solution that would provide benefit to both sides and keep the project moving. It has always been MTDB' s philosophy to do whatever is necessary to keep projects moving. This approach minimizes delays and resulting cost increases caused by inflation.
The lessons MTDB learned during the negotiations were
• Be flexible to keep things moving. • Realize that transit and utilities are both
public services that should not necessarily be competing with each other.
• Try to understand the other parties' points of view.
• Be realistic; the cost of delay can easily exceed the cost of compromise.
129
In the case of the East line, a compromise with the city was reached that resulted in MTDB paying a little over one-half of the relocation and reconstruction costs. The South line negotiations resulted in MTDB paying much less than one-half of the utility relocation and reconstruction costs. In any event, the resulting cost split was minor in relation to the total project. MTDB's share of the utility relocation and reconstruction costs was approximately 3 percent of the total project. In times of relatively high inflation these costs can easily be exceeded by potential project delays caused by unresolved utility relocation issues.
In summary, MTDB has found the use of city streets to be, overall, an effective way of reducing total implementation costs. At the same time, the joint use of city streets maximizes the use of public right-of-way to the further benefit of the public. In MTDB's case, the city wound up with improvements that would not have been constructed without LRT. MTDB winds up with an overall lower project cost. Even the private utility companies gain by the replacement of older facilities with new ones, which avoids much more costly replacement after the LRT system becomes operational.
REFERENCES
1, State of California, Public Utilities Code, Division II, Chapter 2, Section 120050, San Diego Metropolitan Transit Development Board.
2. Policies & Procedures 1--Rail Transit Feasibility Principles. Metropolitan Transit Development Board, San Diego, Calif., Jan. 1983.
3. Guideway Planning Project, Phase I: Evaluation of Candidate Corridor Alignments. Metropolitan Transit Development Board, San Diego, Calif., March 1977.
4. Board of Directors Workshop 3 Papers. Metropolitan Transit Planning Board, San Diego, Calif.; Bechtel, Inc., Jan. 1979.
5. Cooperative Agreement to Reconstruct City Utilities. Metropolitan Transit Development Board and City of San Diego, Calif., July 1979.
6, Memorandum of Understanding Between the City of San Diego and MTDB. Metropolitan Transit Development Board and City of San Diego, Calif., Jan. 1983.
7. Cooperative Agreement to Reconstruct City Utilities. Metropolitan Transit Development Board and City of San Diego, Calif., Dec. 1984.
8. Facilities Relocation Agreement. Metropolitan Transit Development Board, San Diego, Calif. and Pacific Telephone, Nov. 1983.
9. Facilities Relocation Agreement. Metropolitan Transit Development Board, San Diego, Calif. and San Diego Gas & Electric, Sept. 1983.
10. Northwest Natural Gas Company et al. v. City of Portland et al.; 70 Or .App. 647, 690 P. 2d 1099 (1984).
11. 298 Or. 773, 697 P.2d 556 (1985).
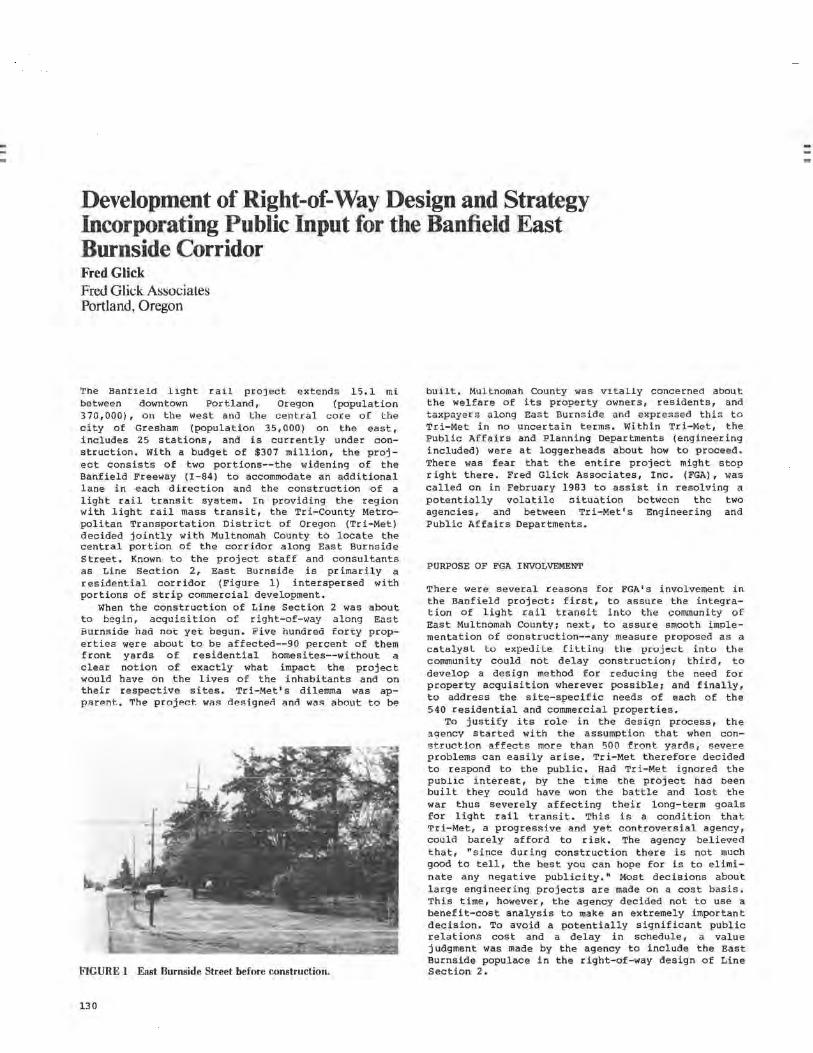
Development of Right-of-Way Design and Strategy Incorporating Public Input for the Banfield East Burnside Corridor Fred Glick Fred Glick Associales Portland, Oregon
The Banfield 1 ight rail project extends 15, l mi between downtown Portland, Oregon (population 370,000), on the west and the central core of the city of Gresham (population 35,000) on the east, includes 25 stations, and is currently under construction. With a budget of $307 million, the project consists of two portions--the widening of the Banfield Freeway (I-84) to accommodate an additional lane in each direction and the construction of a light rail transit system. In providing the region with light rail mass transit, the Tri-County Metropolitan Transportation District of Oregon (Tri-Met) decided jointly with Multnomah County to locate the central portion of the corridor along East Burnside Street, Known to the project staff and consultants as Line Section 2, East Burnside is primarily a residential corridor (Figure 1) interspersed with portions of strip commercial development.
When the construction of Line Section 2 was about to begin, acquisition of right-of-way along East Burnsiae had noc yec oegun. Five hundred forty properties were about to be affected--90 percent of them front yards of residential homesites--without a clear notion of exactly what impact the project would have on the lives of the inhabitants and on their respective sites. Tri-Met' s dilemma was app11rent. 'l'he project: was designecl and was about to be
FIGURE 1 East Burnside Street before construction.
130
built. Multnomah County was vitally concerned about the welfare of its property owners, residents, and taxpayers along East Burnside and expressed this to Tri-Met in no uncertain terms. Within Tri-Met, the Public Affairs and Planning Departments (engineering included) were at loggerheads about how to proceed. There was fear that the entire project might stop right there. Fred Glick Associates, Inc. (FGA), was called on in February 1983 to assist in resolving a potentL:illy volc1tile nituc1tion between the two agencies, and between Tri-Met's Engineering and Public Affairs Departments.
PURPOSE OF FGA INVOLVEMENT
There were several reasons for FGA's involvement in the Banfield project: first, to assure the integration of light rail transit into the community of East Multnomah County; next, to assure smooth implementation of construction--any measure proposed as a catti.lysl to o,xpeuite fitting the project into the community could not delay construction i third, to develop a design method for reducing the need for property acquisition wherever possible; and finally, to address the site-specific needs of each of the 540 residential and commercial properties.
To justify its role in the design process, the :1.9encv started with the assumption that when construction affects more than 500 front yards, severe problems can easily arise. Tri-Met therefore decided to respond to the public. Had Tri-Met ignored the public interest, by the time the project had been built they could have won the battle and lost the war thus severely affecting their long-term goals for light rail transit. This is a condition that Tr i -Met, a progressive and yet controver s i a l agency, could barely afford to risk. The agency believed that, "since during construction there is not much good to tell, the best you can hope for is to eliminate any negative publicity." Most decisions about large engineering projects are made on a cost basis. This time, however, the agency decided not to use a benefit-cost analysis to make an extremely important decision. To avoid a potentially significant public relations cost and a delay in schedule, a value judgment was made by the agency to include the East Burnside populace in the right-of-way design of Line Section 2.
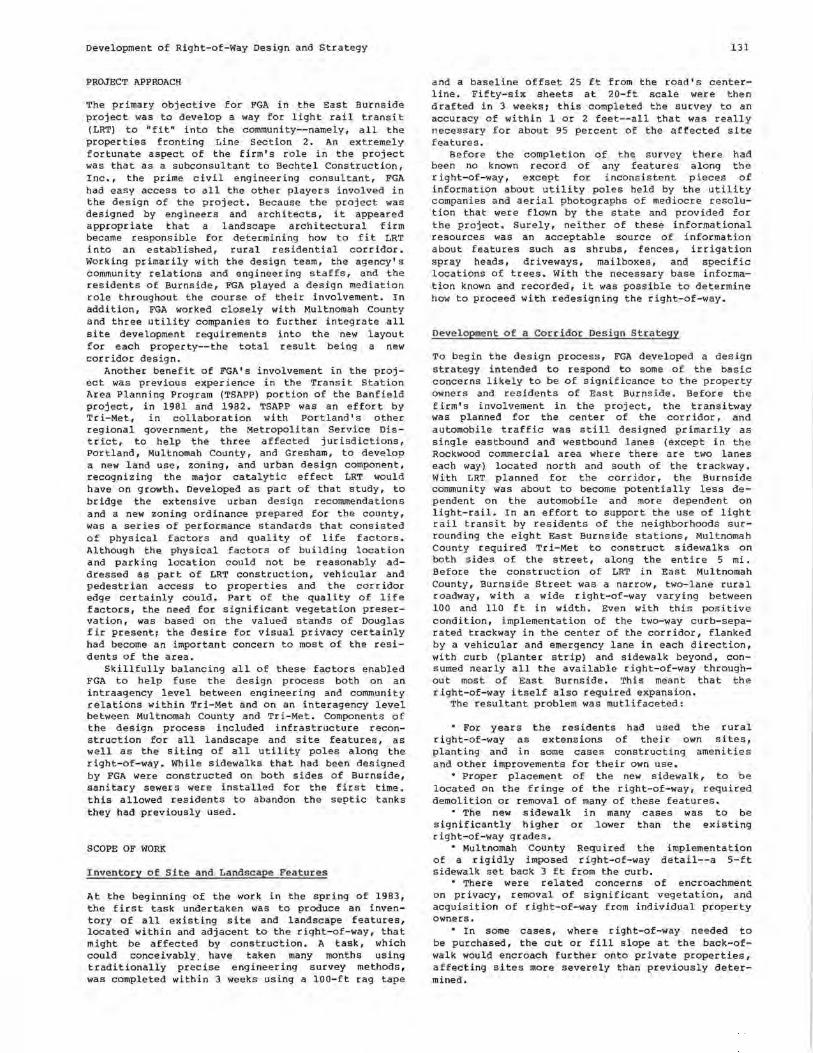
Development of Right-of-Way Design and Strategy
PROJECT APPROACH
The primary objective for FGA in the East Burnside project was to develop a way for light rail transit (LRT) to "fit" into the community--namely, all the properties fronting Line Section 2. An extremely fortunate aspect of the firm's role in the project was that as a subconsultant to Bechtel Construction, Inc., the prime civil engineering consultant, FGA had easy access to all the other players involved in the design of the project. Because the project was designed by engineers and architects, it appeared appropriate that a landscape architectural firm became responsible for determining how to fit LRT into an established, rural residential corridor. Working primarily with the design team, the agency's community relations and engineering staffs, and the residents of Burnside, FGA played a design mediation role throughout the course of their involvement. In addition, FGA worked closely with Multnomah County and three utility companies to further integrate all site development requirements into the new layout for each property--the total result being a new corridor design.
Another benefit of FGA's involvement in the project was previous experience in the Transit Station Area Planning Program (TSAPP) portion of the Banfield project, in 1981 and 1982. TSAPP was an effort by Tri-Met, in collaboration with Portland's other regional government, the Metropolitan Service District, to help the three affected jurisdictions, Portland, Multnomah County, and Gresham, to develop a new land use, zoning, and urban design component, recognizing the major catalytic effect LRT would have on growth. Developed as part of that study, to bridge the extensive urban design recommendations and a new zoning ordinance prepared for the county, was a series of performance standards that consisted of physical factors and quality of life factors. Although the physical factors of building location and parking location could not be reasonably addressed as part of LRT construction, vehicular and pedestrian access to properties and the corridor edge certainly could. Part of the quality of life factors, the need for significant vegetation preservation, was based on the valued stands of Douglas fir presenti the desire for visual privacy certainly had become an important concern to most of the residents of the area.
Skillfully balancing all of these factors enabled FGA to help fuse the design process both on an intraagency level between engineering and community relations within Tri-Met and on an interagency level between Multnomah County and Tri-Met. Components of the design process included infrastructure reconstruction for all landscape and site features, as well as the siting of all utility poles along the right-of-way. While sidewalks that had been designed by FGA were constructed on both sides of Burnside, sanitary sewers were installed for the first time. this allowed residents to abandon the septic tanks they had previously used.
SCOPE OF WORK
Lnventory of Site and Landscape Features
At the beginning of the work in the spring of 1983, the first task undertaken was to produce an inventory of all existing site and landscape features, located within and adjacent to the right-of-way, that might be affected by construction. A task, which could conceivably, have taken many months using traditionally precise engineering survey methods, was completed within 3 weeks using a 100-ft rag tape
131
and a baseline offset 25 ft from the road's centerline. Fifty-six sheets at 20-ft scale were then drafted in 3 weeks; this completed the survey to an accuracy of within 1 or 2 feet--all that was really necessary for about 95 percent of the affected site features.
Before the completion of the survey there had been no known record of any features along the right-of-way, except for inconsistent pieces of information about utility poles held by the utility companies and aerial photographs of mediocre resolution that were flown by the state and provided for the project. Surely, neither of these informational resources was an acceptable source of information about features such as shrubs, fences, irrigation spray heads, driveways, mailboxes, and specific locations of trees. With the necessary base information known and recorded, it was possible to determine how to proceed with redesigning the right-of-way.
Development of a Corridor Design Strategy
To begin the design process, FGA developed a design strategy intended to respond to some of the basic concerns likely to be of significance to the property owners and residents of East Burnside. Before the firm's involvement in the project, the transitway was planned for the center of the corridor, and automobile traffic was still designed primarily as single eastbound and westbound lanes (except in the Rockwood commercial area where there are two lanes each way) located north and south of the trackway. With LRT planned for the corridor, the Burnside community was about to become potentially less dependent on the automobile and more dependent on light-rail. In an effort to support the use of light rail transit by residents of the neighborhoods surrounding the eight East Burnside stations, Multnomah County required Tri-Met to construct sidewalks on both sides of the street, along the entire 5 mi. Before the construction of LRT in East Multnomah County, Burnside Street was a narrow, two-lane rural roadway, with a wide right-of-way varying between 100 and 110 ft in width. Even with this positive condition, implementation of the two-way curb-separated trackway in the center of the corridor, flanked by a vehicular and emergency lane in each direction, with curb (planter strip) and sidewalk beyond, consumed nearly all the available right-of-way throughout most of East Burnside. This meant that the right-of-way itself also required expansion.
The resultant problem was mutlifaceted:
• For years the residents had used the rural right-of-way as extensions of their own sites, planting and in some cases constructing amenities and other improvements for their own use.
• Proper placement of the new sidewalk, to be located on the fringe of the right-of-way,. required demolition or removal of many of these features.
• The new sidewalk in many cases was to be significantly higher or lower than the existing right-of-way grades.
• Multnomah County Required the implementation of a rigidly imposed right-of-way detail--a 5-ft sidewalk set back 3 ft from the curb.
• There were related concerns of encroachment on privacy, removal of significant vegetation, and acquisition of right-of-way from individual property owners.
• In some cases, where right-of-way needed to be purchased, the cut or fill slope at the back-ofwalk would encroach further onto private properties, affecting sites more severely than previously determined.
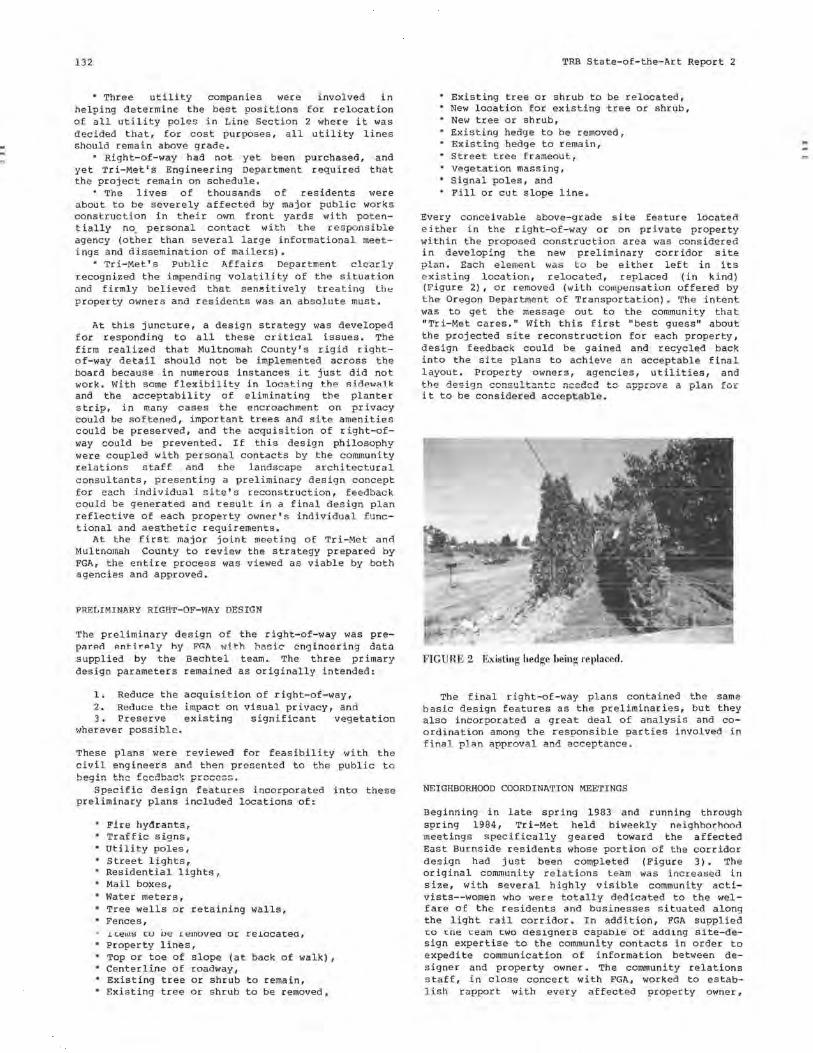
132
• Three utility companies were involved in helping determine the best positions for relocation of all utility poles in Line Section 2 where it was decided that, for cost purposes, all utility lines should remain above grade.
• Right-of-way had not yet been purchased, and yet Tri-Met' s Engineering Department required that the project remain on schedule,
• The lives of thousands of residents were about to be severely affected by major public works construction in their own front yards with potentially no. personal contact with the responsible agency (other than several large informational meetings and dissemination of mailers).
• Tri-Met's Public Affairs Department clearly recognized the impending volatility of the situation ond firmly believed that sen~itively treating Lh"' property owners and residents was an absolute must,
At this juncture, a design strategy was developed for responding to all these critical issues. The firm realized that Multnomah County's rigid rightof-way detail should not be implemented across the board because in numerous instances it just did not work. With some flexibility in locating the sid<"w;,l_k and the acceptability of eliminating the planter strip, in many cases the encroachment on privacy could be softened, important trees and site amenities could be preserved, and the acquisition of right-ofway could be prevented. If this design philosophy were coupled with personal contacts by the community relations staff and the landscape architectural consultants, presenting a preliminary design concept for each individual site's reconstruction, feedback could be generated and result in a final design plan reflective of each property owner's individual functional and aesthetic requirements.
At the first major joint meeting of Tri-Met and Multnomah County to review the strategy prepared by FGA, the entire process was viewed as viable by both agencies and approved.
PRELIMINARY RIGHT-OF-WAY DESIGN
The preliminary design of the right-of-way was prepared Ant.ir<>ly hy Fr.I\ with basic engineering data supplied by the Bechtel team. The three primary design parameters remained as originally intended:
1. Reduce the acquisition of right-of-way, 2. Reduce the impact on visual privacy, and 3. Preserve existing significant vegetation
wherever possible.
These plans were reviewed for feasibility with the civil engineers and then presented to the public to begin ~h~ ~~~~h~~~ p~~~c~s.
Specific design features incorporated into these preliminary plans included locations of:
• Fire hy~rants, Traffic signs,
• Utility poles, • Street lights,
Residential lights, •Mailboxes, • Water meters, • Tree wells or retaining walls, • Fences,
.1ce111~ cu ue removea or rel.ocatect, • Property lines, • Top or toe of slope (at back of walk), • Centerline of roadway, • Existing tree or shrub to remain, • Existing tree or shrub to be removed,
TRB State-of-the-Art Report 2
Existing tree or shrub to be relocated, • New location for existing tree or shrub,
New tree or shrub, Existing hedge to be removed, Existing hedge to remain,
• Street tree frameout, Vegetation massing,
• Signal poles, and Fill or cut slope line.
Every conceivable above-grade site feature located either in the right-of-way or on pr iv ate property within the proposed construction area was considered in developing the new preliminary corridor site plan. Each element was to be either left in its existing location, relocated, replaced (in kind) (Pigure 2), or removed (wilh compensation offered by the Oregon Department of Transportation). The intent was to get the message out to the community that "Tri-Met cares." With this first "best guess" about the projected site reconstruction for each property, design feedback could be gained and recycled back into the site plans to achieve an acceptable final layout. Property owners, agencies, utilities, and
it to be considered acceptable.
FIGURE 2 Existing hedge being replaced.
The final right-of-way plans contained the same basic design features as the preliminaries, but they also incorporated a great deal of analysis and coordination among the responsible parties involved in f i nal plan approval and acceptance.
NEIGHBORHOOD COORDINATION MEETINGS
Beginning in late spring 1983 and running through spring 1984, Tri-Met held biweekly neighborhood meetings specifically geared toward the affected East Burnside residents whose portion of the corridor design had just been completed (Figure 3). The original community relations team was increased in size, with several highly visible community activists--women who were totally dedicated to the welfare of the residents and businesses situated along the light rail corridor. In addition, FGA supplied i:o cne ceam i:wo aes1gners capable ot adding site-design expertise to the community contacts in order to expedite communication of information between designer and property owner. The community relations staff, in close concert with FGA, worked to establish rapport with every affected property owner,
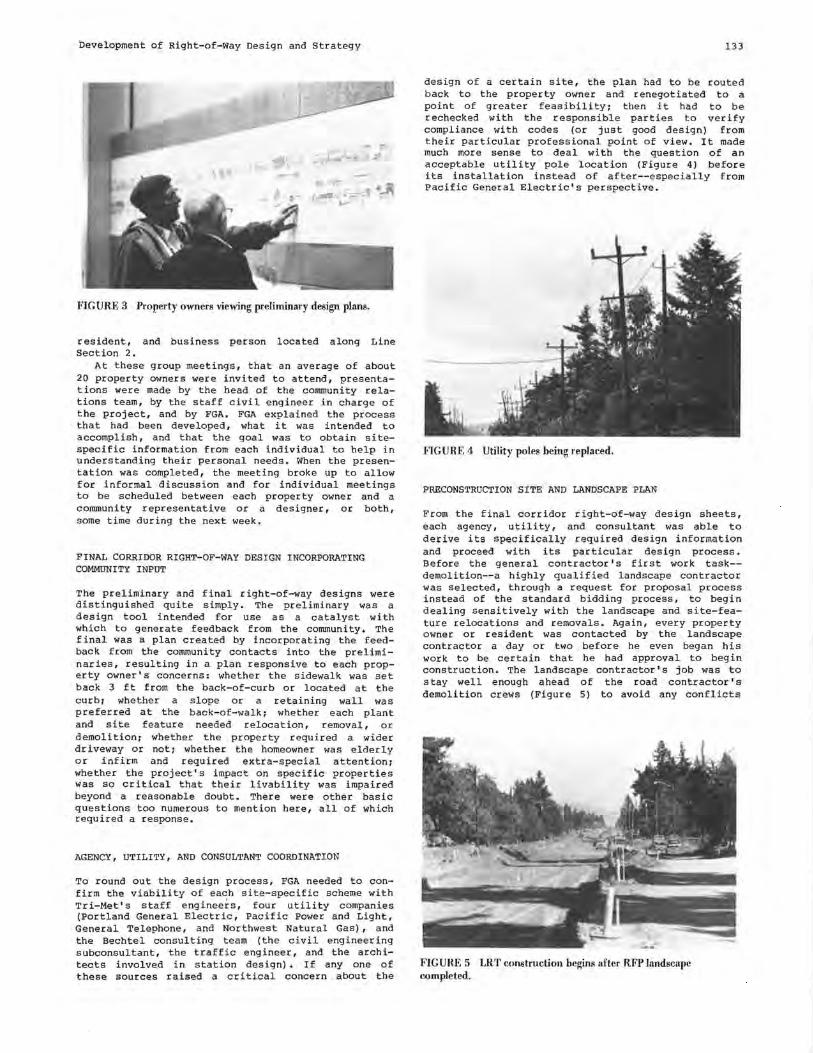
Development of Right-of-Way Design and Strategy
FIGURE 3 Property owners viewing preliminary design plans.
resident, and business person located along Line Section 2.
At these group meetings, that an average of about 20 property owners were invited to attend, presentations were made by the head of the community relations team, by the staff civil engineer in charge of the project, and by FGA. FGA explained the process that had been developed, what it was intended to accomplish, and that the goal was to obtain sitespecific information from each individual to help in understanding their personal needs. When the presentation was completed, the meeting broke up to allow for informal discussion and for individual meetings to be scheduled between each property owner and a community representative or a designer, or both, some time during the next week.
FINAL CORRIDOR RIGHT-OF-WAY DESIGN INCORPORATING COMMUNITY INPUT
The preliminary and final right-of-way designs were distinguished quite simply. The preliminary was a design tool intended for use as a catalyst with which to generate feedback from the community. The final was a plan created by incorporating the feedback from the community contacts into the preliminaries, resulting in a plan responsive to each property owner's concerns: whether the sidewalk was set back 3 ft from the back-of-curb or located at the curb: whether a slope or a retaining wall was preferred at the back-of-walk i whether each plant and site feature needed relocation, removal, or demolition: whether the property required a wider driveway or not i whether the homeowner was elderly or infirm and required extra-special attention; whether the project's impact on specific properties was so critical that their livability was impaired beyond a reasonable doubt. There were other basic questions too numerous to mention here, all of which required a response.
AGENCY, UTILITY, AND CONSULTANT COORDINATION
To round out the design process, FGA needed to confirm the viability of each site-specific scheme with Tri-Met's staff enginee~s, four utility companies (Portland General Electric, Pacific Power and Light, General Telephone, and Northwest Natural Gas) , and the Bechtel consulting team (the civil engineering subconsultant, the traffic engineer, and the architects involved in station design) • If any one of these sources raised a er i tic al concern about the
133
design of a certain site, the plan had to be routed back to the property owner and renegotiated to a point of greater feasibility i then it had to be rechecked with the responsible parties to verify compliance with codes (or just good design) from their particular professional point of view. It made much more sense to deal with the question of an acceptable utility pole location (Figure 4) before its installation instead of after--especially from Pacific General Electric's perspective.
FIGURE 4 Utility poles being replaced.
PRECONSTRUCTION SITE AND LANDSCAPE PLAN
From the final corridor right-of-way design sheets, each agency, utility, and consultant was able to derive its specifically required design information and proceed with its particular design process. Before the general contractor's first work task-demolition--a highly qualified landscape contractor was selected, through a request for proposal process instead of the standard bidding process, to begin dealing sensitively with the landscape and site-feature relocations and removals. Again, every property owner or resident was contacted by the landscape contractor a day or two before he even began his work to be certain that he had approval to begin construction. The landscape contractor's job was to stay well enough ahead of the road contractor's demolition crews (Figure 5) to avoid any conflicts
FIGURE 5 LRT construction begins after RFP landscape completed.
134
of private property interests and guarantee successful implementation of the first phase of this complex, detailed, and sensitive process. An excellent result was achieved.
FINAL LANDSCAPE AND SITE PLANS FOR PRIVATE PROPERTIES, RIGHT-OF-WAY, AND TRANSITWAY
As the final step in constructing the Line Section 2 right-of-way, FGA prepared the final landscape plans for the entire 102-block, 5-mi corridor. "Landscape" is used to describe all aspects of site development aside from structural detailing. Included are sidewalks, private lighting, fencing, low walls, er ibwall plantings, landscape finish work on private properties, slopes, right-of-way, and all plantings within the trackway.
A key to landscape plantings within the trackway, as developed by FGA, was the functional use of all plants for safety purposes wherever possible. This safety consciousness was intended to provide the agency with double the plant's value--each would, through its presence, add to the aesthetics of the corridor and, simultaneously. in ~any i~~~an~P.8 whP.n articulated properly, provide higher visibility for elements like unmarked pedestrian crossings and the interface between vehicular and LRT crossings.
CONCLUSION
The result of this involvement in the effort to fit the light rail project into the East Burnside community has been the streamlining of the entire process. Although there were serious doubts about the chances for the successful implementation of the process outlined earlier, the Director of Public Affairs viewed the program's efforts, when completed, as a "phenomenal success." Every one of the primary
TRB State-of-the-Art Report 2
players involved in this design challenge benefited in the end:
• The East Burnside populace had become part of the project.
• Tri-Met's Community Relations Department had a tremendously positive impact on the lives of the residents, compared to what could have occurred. Also, an assessment made by nonengineering people has become an accepted part of the LRT construction process.
• The engineering staff was able to draw on a wealth of important design data while keeping the project on schedule.
• Multnomah County was satisfied that its constituents were treated fairly, given the existence of major public works construction in their front yards.
• The utility companies were able to see the entire "picture" along the corridor comprehensively--the reasons for utility pole locations were apparent.
• The Bechtel team and the general contractor used the design drawings to structure the entire corridor edge t-ro~t-mon+---h11ilnin'J dri'~1et,Jay$ right from the design plans.
The role of FGA that started out with a single, thr;ee-part purpose (saving right-of-way, preserving trees, increasing privacy) resulted in a multifaceted plan that was useful for the whole project. Essentially, costs were not increased for this implementation effort (especially considering its scale) and a long-term positive impact, it is believed, will result from this experience.
Reprinted with permission of the author.
Integration of Sacramento Light Rail Transit System into the Central City James E. Roberts Robert E. Kershaw Sacramento Transit Development Agency Sacramento, California
Sacramento, the capital of California, is located midway between San Francisco and Lake Tahoe in the great central California agricultural valley. Sacramento was settled at the confluence of the Sacramento and American Rivers in 1850 as a central location for gold seekers.
From a small settlement of 2,000, Sacramento City has grown to a population of more than 300,000. The city is the seventh largest in California and the metropolitan area has a population of more than 1 million and employs almost 400,000 persons. More than 100,000 jobs are within a mile of the state capitol in the central business district (CBD).
Sacramento's transportation systems are varied. The city is served by three major railroads, 40 interstate truck carriers, four freeway systems, a deep water channel, eight major air carriers, and three bus systems. Sacramento is now in the process of complementing the existing public transportation systems with a light rail transit commuter line to augment the existing bus fleet.
BACKGROUND
The Sacramento City Council voted in September 1979 to delete the I-BO bypass freeway from the Interstate system. Withdrawal of the I-80 bypass freeway project gave Sacramento the capability of funding a major transit project to serve the Northeast Corridor of the city. To select the locally preferred transit project for the Northeast Corridor, work began on a draft alternatives analysis and an environmental impact statement (AA/EIS) in February 1980. Preparation of this draft AA/EIS was a cooperative effort between the city and county of Sacramento, Regional Transit, the Sacramento Area Council of Governments (SACOG), and the California Department of Transportation (Caltrans).
The Sacramento Transit Development Agency (STDA) was formed in early 1981 to implement the project. The STDA governing board has one representative from Caltrans, one from the city of Sacramento, one from the county of Sacramento, one from the Regional Transit District, and one public member appointed by the other members. The board makeup has since changed in response to a more active local interest.
SYSTEM DESCRIPTION
The 18.5-mi (29.5-km) Sacramento light rail transit (LRT) starter line project is being designed and
constructed to provide trunk line service for an integrated bus-LRT public transportation system for the greater Sacramento metropolitan area, which has a population of 1.1 million and an annual growth rate of 2.5 percent. Initially, a single-track main line primarily at grade will be built with doubletrack sections provided over 40 percent of the route to allow running meets between trains operating at 15-min headways in both directions. The design provides for future expansion to a fully double-tracked system as the predicted initial ridership of 25,000 increases.
This project is typical of European LRT design in which major structures are minimized by using existing rights-of-way and at-grade crossings. The integrated bus-LRT system will operate eight one- to four-car trains on 15-min headways on the trunk line to relieve express bus congestion in the downtown core and reduce operating costs of the present all-bus public transit system. The bus element will operate some 100 buses to provide feeder service to six "timed transfer" stations, thus maintaining the flexibility of buses to adjust routes as population patterns shift. The combined system will be operated at an annual operating subsidy less than that of the present all-bus transit system because of LRT operating economies attributable to lower operating costs and higher passenger-to-driver ratios. Total capital project costs for this LRT system are approximately $8. 5 million per mile ($6 million per kilometer) for double track compared to $50 to $100 million per mile ($31 to $62 million per kilometer) and more for double-tracked "heavy rail" systems that are completely grade separated. The trade-off for this lower cost is reduced level of service, but, in most western U.S. cities, population density does not warrant the more expensive heavy rail public transit systems.
The Sacramento LRT line will follow the two major transportation corridors along Interstate BO from the northeast and US-50 from the east to feed commuters into the CBD (Figure 1).
The starter line project will begin at Watt Avenue and I-BO in the Northeast Corridor. It will follow the abandoned I-BO bypass freeway right-of-way (ROW), the abandoned Sacramento Northern Swanston branch ROW along Arden Way, Del Paso Boulevard, the Route 160 bridge across the American River, 12th Street, K Street, 7th Street (southbound) and 8th Street (northbound), O Street, 12th Street, Union Pacific
135
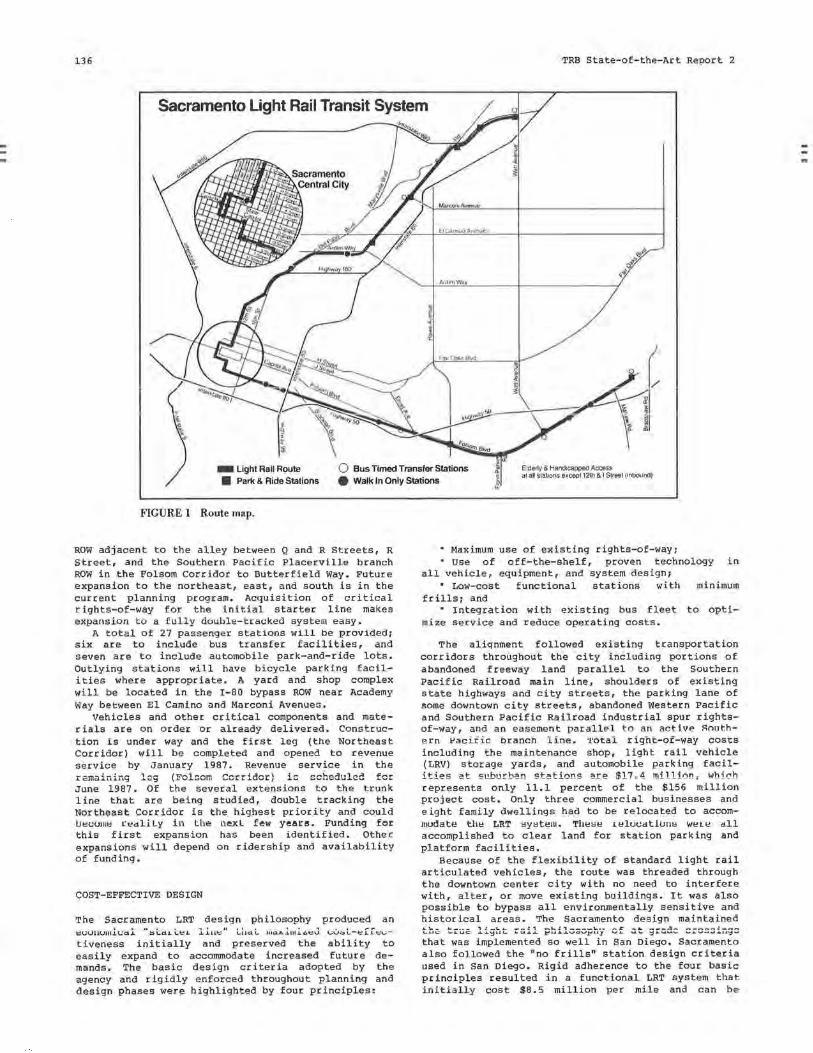
136 TRB State-of-the-Art Report 2
Sacramento Light Rail Transit System
ArdenWav
- Light Rail Route a Park & Ride Stations
0 Bus Timed Transfer Stations e Walk In Only Stations
Elderly & Handicapped Access al all stalions except 12th & I Street (inbound)
FIGURE 1 Route map.
ROW adjacent to the alley between Q and R Streets, R Street, and the Southern Pacific Placerville branch ROW in the Folsom Corridor to Butterfield Way. Future expansion to the northeast, east, and south is in the current planning program. Acquisition of critical rights-of-way for the initial starter line makes expansion to a fully double-tracked system easy.
A total of 27 passenger stations will be provided; six are to include bus transfer facilities, and seven are to include automobile park-and-ride lots. Outlying stations will have bicycle parking facilities where appropriate. A yard and shop complex will be located in the I-80 bypass ROW near Academy Way between El Camino and Marconi AvenueG.
Vehicles and other critical components and materials are on order or already delivered. Construction is under way and the first leg (the Northeast Corridor) will be completed and opened to revenue service by January 1987. Revenue service in the remaining leg (Fol~om Corridor) 1~ scheduled for June 1987. Of the several extensions to the trunk line that are being studied, double tracking the Northeast Corridor is the highest priority and could I.Jeuume redllLy in lhe nexL few years. Funding for this first expansion has been identified. Other expansions will depend on ridership and availability of funding.
COST-EFFECTIVE DESIGN
The Sacramento LRT design philosophy produced an ~cuuum.il.;dl "::;LaL l..t=L l.iut=" U1aL 1f1d.A.i111.i."'t.::U \,;UoL-1:::£.Lt::~tiveness initially and preserved the ability to easily expand to accommodate increased future demands. The basic design criteria adopted by the agency and rig idly enforced throughout planning and design phases were highlighted by four principles:
• Maximum use of existing rights-of-way; • Use of off-the-shelf, proven technology in
all vehicle, equipment, and system design; • Low-cost functional stations with minimum
frills; and • Integration with existing bus fleet to opti
mize service and reduce operating costs.
The aliqnment followed existing transportation corridors throughout the city including portions of abandoned freeway land parallel to the Southern Pacific Railroad main line, shoulders of existing state highways and city streets, the parking lane of some downtown city streets, abandoned Western Pacific and Southern Pacific Railroad industrial spur rightsof-way, and an easement parallel to an active Rout.hP.rn l'ac1r1c branch .line. ·1·ocal righc-of-way costs including the maintenance shop, light rail vehicle (LRV) storage yards, and automobile parking facilities at suburban stations are $17=4 million; which represents only 11.1 percent of the $156 million project cost. Only three commercial businesses and eight family dwellings had to be relocated to accommudate the LRT system. These u!luu11tlu11s wete 1111 accomplished to clear land for station parking and platform facilities.
Because of the flexibility of standard light rail articulated vehicles, the route was threaded through the downtown center city with no need to interfere with, alter, or move existing buildings. It was also possible to bypass all environmentally sensitive and historical areas. The Sacramento design maintained .LL.-'--··-,,!._,_ ...... __ :, ..... L..!,----'L.-- -~ _ ... ---.!1- ... -........... .:-- ... \..,U\;: 1....1..UC .L.J.~UI- J..'4.1..L .t"U.I..LU.:.iVJ::"U.:t V.L ...._I.. ~J..'"4"-4'- ._.._....,._,._,.I.J.l':j~
that was implemented so well in San Diego. Sacramento also followed the "no frills" station design criteria used in San Diego. Rigid adherence to the four basic principles resulted in a functional LRT system that initially cost $8.5 million per mile and can be
Integration of Sacramento Light Rail Transit
expanded to full double track for approximately Ill million per mile additional costs for overhead catenary, track construction, additional platform area, and some modificat-.ion of the signal system.
INFRASTRUCTURE RECONSTRUCTION
Although the system was designed to minimize costs and provide a basic, functional, no-frills system, there were numerous opportunities for enhancement of the city infrastructure that were "spin-off" benefits to the city at minimum cost. Many of these enhancements were in future plans but would not have been completed in the foreseeable future without the joint cooperation between city public works staff and STOA staff. The major infrastructure reconstruction features are itemized here and discussed individually.
• Construction of three new railroad grade separations,
• Installation of a pumping plant, • Reconstruction and realignment of an existing
on-ramp, • Resurfacing city streets, • Rehabilitation of abandoned railroad right
of-way, • Reconstruction of 100-year-old city sewer
system, • Redesign of city traffic signal system, • Upgrading of existing railroad grade cross
ings, • Reconstruction of major downtown pedestrian
mall, • Construction of new transportation mall, • Improvement of traffic flow at newspaper
plant, • Major improvement to existing all-bus system,
Rehabilitation of redevelopment area, and • Improvement of economically depressed area.
This impressive list of major improvements to the city infrastructure, estimated to cost more than $20 million, was achieved at minimum cost to the city as a direct result of LRT construction or of joint development. Most of these improvements were funded by UMTA, FHWA, the state of California, and the Southern Pacific Railroad. Although the city share of total project costs is estimated at approximately $23 million, there is an agreement between STOA and the city to repay $29 million in redevelopment tax increment bond funds when alternative local transit financing is legislated. Ultimately, the city will own a lll58 million light rail transit system and the listed infrastructure improvements for a total city investment of approximately $4 million. All other project and infrastructure improvement costs were met by the various agencies listed earlier.
Grade Separations
When it was planning the LRT project the city of Sacramento filed an application with the State Public Utility Commission (PUC) for funding to construct two railroad grade separations. The California Department of Transportation administers a lll5 million annual program to eliminate dangerous railroad grade crossings. Under the law a priority list is established by the PUC and those crossings highest on the list are funded 80 percent by the state, 10 percent by the affected railroad, and 10 percent by the local agency. In 1981 both crossings ranked high enough on the state PUC list to be eligible for funding in the 1982-1983 fiscal year.
137
The city was not in a position to finance the local 10 percent matching share. Through a cooperative agreement between STDA and the city, the LRT project provided the local match through dccign c1nd construction engineering. The trade-off for STDA was the elimination of grade-crossing construction and protective crossing gates. As a result of working together the LRT project benefited by getting several miles of separated alignment in the Northeast Corridor and the city benefited from construction of three grade separations. A third grade-separated structure was an old substandard underpass that was eliminated with construction of the new structure. Addition of this third structure to the project was made possible by combining funds and right-of-way. Total cost of these three major traffic improvements to city arterials was f;l3 million, including rightsof-way. The state funded $6.4 million of the cost, the Southern Pacific Railroad paid f;0.6 million, STOA paid $1.4 million, right-of-way worth $3.9 million was included in the Interstate transfer, and the city paid only $0.7 million for its share of all three crossings. This traffic safety project represents a significant improvement in the infrastructure that was a direct result of the LRT project and a fine example of interagency cooperation.
Pumping Plant
A major improvement to an existing highway railroad underpass will be made by the construction of a pumping plant to drain that facility. Presently that area floods a few times each year and forces closure of the highway for several hours at a time. This, of course, is totally unacceptable to the LRT system operation. The pumping plant and outflow line are a part of the LRT project but will be jointly funded because of the obvious betterment to the underpass operation. The city had planned for a pumping plant but did not have funds to construct one in the foreseeable future. Estimated cost of the pumping plant and outflow line is f;S00,000 with the city share to be paid from Federal Aid Urban (FAU) funds. This is another example of infrastructure improvement resulting directly from the cooperative planning and design efforts that produced the LRT project.
On-Ramp Improvement
As part of the agreement to use the left shoulder of the existing American River bridge for the LRT tracks, the agency redesigned the inbound on-ramp from Northgate Boulevard. This city street feeds traffic from the rapidly growing South Natomas area onto the inbound lanes of an existing freeway to the central city. The redesign and reconstruction improve traffic flow and capacity and eliminate a bottleneck, an improvement which the city would have had to independently fund and construct in the near future; cost of this reconstruction is estimated to be $80,000.
Resurfacing of Streets
Because of major utility relocation work, several downtown city streets will be resurfaced as part of the LRT contract. This work will prolong the life of those major streets and preclude the necessity for the city to budget this street maintenance work for a period of time. The utility relocation work was a contributing factor, but the streets were in need of resurfacing so this infrastructure improvement is another side benefit of the LRT project. Cost is estimated to be $200,000.
138
Rehabilitation of Abandoned Railroad Right-of-Way
In the Folsom Corr i dor the LRT alignment follows the existing Southern Pacific Railroad abandoned industrial spur for approximately 2 mi. The existing street is a gravel surfaced "alley• with numerous chuck holes and minimum railroad grade- crossing protection. The Folsom Corridor LRT contract will include reconstruction of major portions of this street at no cost to the city. In addition, crossing gates will be installed to improve traffic safety. Again, it can be argued that LRT construction dictated these improvements, but the side benefits to the city cannot be overlooked. Cost is estimated to be $500,000.
Sewer Reconstruction
Along a busy arterial in downtown Sacramento, a major 100-year-old sewer line is carried in a brick arch culvert that is in need of repair or replacement. Because the brick arch culvert will not carry the additional loads imposed by the LRT vehicles, the center city contract includes replacing portions of this sewer with a 36-in. culvert. Cost of this reconstruction is estimated at $500,000 and is being borne by the LRT project with no cost to the city.
Redesign of City Traffic Signals
At some 35 intersections where the LRT line interfaces with existing city street traffic signals, redesign to accommodate LRT movements is a necessary LRT project cost. On the other hand, the city benefits from installation of new microprocessor signal controllers that incorporate the latest in traffic signal technology and equipment. Cost of this upgrading is approximately $1.1 million.
Upgrading Railroad Grade Crossings
There are 74 r ailroad g r ade cross i ngs on the entire LRT alignment and because the line follows existing r~il corridors 39 are new crossings. On 24 of the 43 existing crossings the LRT signal contract includes crossing gates where only stop signs or flashing lights previously existed. These gates are another traffic safety improvement to the city infrastructure. Cost of these improved grade crossings is estimated at $2.2 million.
Reconstruction of Downtown Mall
The fi ve-block K Street segment is pr~sently ~ pe destrian mall, closed to public automobile traffic. In the early 1970s the downtown portion of K Street was closed to vehicular traffic and a controversial pedestrian mall with concrete sculpture~, waterfalls, grass, and play areas was constructed. Since the closure, retail activity has been in a constant state of flux and deterioration.
Because the LRT trackway and station platforms occupy the major portion of the area between building front sidewalks (center 52 ft of an 80 ft corridor), the project included complete demolition of the existing mall elements. Major utility relocation began immediately and included nettermen~ oi many or the utilities, especially a 69-kVA main electrical system for downtown Sacramento.
Retail activity is in various stages of redevelopment, several buildings are vacant, but many proposals are before the planning commission awaiting
TRB State-of-the-Art Report 2
approval. A major central city redevelopment study was recently prepared and has been going through the public-hearing process. Light rail was a key element in that study as was the revitalization of K Street. The light rail project would satisfy two major elements of that redevelopment report: the return of people to the central city by providing safe , secure, and reliable service into the center city from the outlying residential areas and the improvement of the infrastructure within the K Street alignment. As a part of the LRT project, a commitment to . improve lighting, streetscape, signs, drainage, landscaping, and surface treatment was made. These elements are included in the light rail project and will make this portion of the alignment a major attractor to the system and the redeveloped K Street mall. Cost of the mall improvements is estimated to he approximately $1.2 million.
Construction of a New Transportation Mall
Theo Street mall was a location for which a Capitol Area Plan (CAP) study was completed in 1977, but no work was started. This area of o Street is surrounded mostly by government office buildings and the plan was to create a pedestrian mall with provisions for some form of public transportation (i.e., shuttle, mini bus, LRT). The LRT O Street mall design concept includes intersection improvements, sidewalk, curb and gutter removal and replacement, improved lighting, landscaping and drainage, decorative interlocking pave rs in the station platform areas, and benches and other passenger amenities. After the final alignment was determined, renewed interest in the complete mall development was generated. Much joint planning wa s done not only to accommodate the LRT system but also to provide for the ultimate needs dictated by the CAP. State legislation, which would provide funds to complete that portion of the o Street mall not being completed by the LRT contract, is pending. Again, LRT provided the stimuli to tur n plans into action and construct the mall many years a head of its an t icipated completion. Cost of these improvements is estimated to be $1.5 million of which $1 million is being paid by the state.
Improvement of Traffic Flow
Near the center city portion of the project a major railroad line must be separated from the LRT line. This separation otructure clears the Union Pacific Railroad main line tracks by 24 ft and, to maintain no more than 7 percent grades on the LRT track, it extends approximately 600 ft in each direction from t he Un ion Pacific line. The structure also grade separates the LRT line from two major one-way streets providing for nonstop city traffic flow. This type of costly grade separation would not normally be planned on a light rail project and crossing gates would have been installed at these streets.
I mprove ment to Ex is t i ng All- Bus System
The existing Regional Transit District all-bus system operates approximately 230 buses in the metropolitan area. Because of high operating costs some areas ot the suburbs are serviced at i - n r incervai " and other areas are not served at all. This operation has a detrimental effect on ridership, which in turn forces additional service reductions. Historically, the Sacramento Regional Transit District (SRTD) has been faced with this recurring cycle and, as it is
Integration of Sacramento Light Rail Transit
for many other bus systems, ridership decline is steady.
Because of the integration of LRT into the major corridors as a trunk line, the existing bus system is being redesigned to provide more frequent service and cover a greater portion of the suburban areas. The SRTD goal is to maintain 15-min headways on all bus routes throughout the working day with reduced service levels at night and on weekends. LRT trains and buses will operate on consistent schedules.
Rehabilitation in Redevelopment Area
Alkali Flat, an area along CA-160 (12th Street), has been economically aepressed for many years. An urban design plan was adopted several years ago but was never implemented; however, redevelopment funds are now available for community improvements. After the LRT route was established, a desire to implement the plan and coordinate with the LRT project became evident. An agreement was executed in which the urban design improvements would be integrated and included in the design and construction documents for the LRT center city contract. This approach was cost-effect ive and sparked much interest from the local community not only in their improvements but in the entire LRT project. Sidewalks will be replaced and widened; lighting will be installed; and drainage, landscaping, and streetscape improvements will be made. Parking lots will be constructed to replace on-street parking removed for the LRT line. Cost of these improvements, from federal Housing and Urban Development funds, is estimated to be $250,000.
Improvement of Economically Depressed Area
Del Paso Boulevard is another economically depressed area and has been for the past 20 years since a bypass freeway was constructed. Joint planning with the redevelopment agency as well as with local community groups dictated the exact LRT alignment that allows for an existing transportation corridor improvement and retains vehicular traffic capacity. The agreement to locate an LRT station where it could be considered an anchor for future redevelopment and the construction of an off-street parking lot to replace the on-street parking removed for the station acted as a catalyst for building upgrad-
139
ing, more activity in the local business community, and a renewed interest in further development.
JOINT DEVELOPMENT
Joint development has been limited to date, but future opportunities will be enhanced because of more land use considerations along the route. Planning staffs have been supportive in seeing that planned developments along the LRT route and especially adjacent to the station areas are accessible to LRT. Often concessions are given to developers (in the form of reduced parking requirements) if they locate adjacent to a station and provide necessary access to the station.
Examples of limited but relevant contiguous development include
• A commitment of $450,000 from a developer for a pedestrian bridge to provide direct access from an LRT station to a major commercial and office development.
• A planned pedestrian underpass to tie an LRT station to another major office complex that will be constructed over an old aggregate pit. This $300,000 expenditure will allow LRT access to a proposed 600,000 ft 2 office development.
• Property deeded to the agency will allow an LRT passenger platform to be constructed adjacent to another major office development.
• A location adjacent to the Folsom Corridor terminal station was selected for a state office building. This 1 million ft 2 site was selected from six possible sites; the overriding consideration was the proximity to the LRT park-and-ride stat ion.
Other opportunities are beginning to present themselves because developers are now assured that LRT will be constructed.
CONCLUSION
As can be seen, this was not just another LRT project. Many other peripheral elements will be reconstructed and upgraded. This would not have been done had it not been for the light rail project. This project is an excellent example of integration of a transportation project into an existing central city infrastructure.
--...
Energy Loss Considerations in Traction Power Substation Design Richard L. Hearth Stoil D. Stoilov Parsons Brinckerhoff Quade & Douglas, Inc. Sacramento, California
Energy losses are playing an increasingly important role in the design of railway traction power distribution systems. As utility energy rates continue to follow an upward trend, transit authorities and design engineers alike intensify the search for means to reduce the energy bill without sacrificing system performance. Measures to reach this goal can be classified in several broad categories:
1. Operat ional procedures tha t deal mainly wi t h the train schedules and utilize coasting and the like;
2, Employing energy efficient vehicles with chopper control and regenerative braking; and
3. Selecting traction power distribution system parame t e rs, during the de sign stage , tha t r e sult in an energy efficient distribution system.
It should be noted that all design measures taken to reduce the energy losses under 2 and 3 normally result in increased capital cost or maintenance expenses, or both. Therefore the overall goal must be to minimize not simply the energy losses but the total system cost, subject to numerous technical constraints.
The problems of specifying energy efficient transformer- rectifier units for traction power substations with AC/DC conversion are addressed in this paper . Such s ubsta t i o ns , wi th 12 kV t o 3S kV, threephase, AC voltage input and 600 V to 1500 V DC output, are typical for light rail or rapid transit system applications.
Because t he layout of the traction powe r substations i s usua lly compact , the AC a nd DC bu s ba r losses will be neglected. The rectifier transformer and the traction rectifier, complete as a unit with all auxiliaries and t he interconnect ing bus, account for most of the energy losses of the substation.
using a classical approach from engineering e conomics, the present worth method, the total cost of the transformer-rectifier unit may be viewed as consisting of two components:
Capital cost component and • Energy loss component.
The capital cost component consists of the equipment pr ice plus any destination or installation charges. The energy loss component consists of the present worth of the annual energy loss cost over the eco-
140
nomic lifespan of the unit. It is affected not only by the utility energy rate, and transit system load pattern, but also by several other factors such as the selected amoritization period, the predicted energy escalation rate, and the interest rate.
The sum of the initial capital cost and the energy component loss constitutes the total unit cost. The goal then is to design a transformer-rectifier unit that meets all functional requirements , such as nominal rating, overload capability, r egulation, and maximum temperature rise, at a minimum total cost. Such a design will be referred to as the economic design.
TRACTION POWER SUBSTATION LOAD PATTERN
Knowledge of the traction power substation load is essential to the proper evaluation of the energy losses and hence the economic design of the trans former-rectifier unit. The load current from the substation bus follows a highly irregular and shift ing pattern, due to the very nature of the transit system operation. The line current of a single train during the acceleration and speed running modes follows a curve similar to the one shown in Figure 1. However, the traction power substations normally operate in parallel on the DC side and during peak periods the r e are two or more trains running be tween each two substations, This accounts for a much more complex current curve through each transformer-rectifier unit than the one shown in Figure 1. As e ach tr ain moves along i t will draw curre nt from s e ve r a l substations and the contribution of e ach substation will depend on the distribution system parameters; the train location; and, to a certain extent, the status and location o!' the other tralns 111 the vicinity. As a result the current through a substation transformer-rectifier unit will be constantly changing, reaching high peaks when a train (or trains) accelerates in the vicinity of the substation. The current-versus-time or power-versus-time graphs for different system operating conditions are best obtained by computer simulation. This can be done by using specialized computer programs written ror traction power system aes1gn. A sampl e ycapn i c.: output of such a program is presented in Figure 2, which shows substation DC current as a function of time during peak-period operation.
The results from the computer simulations can be
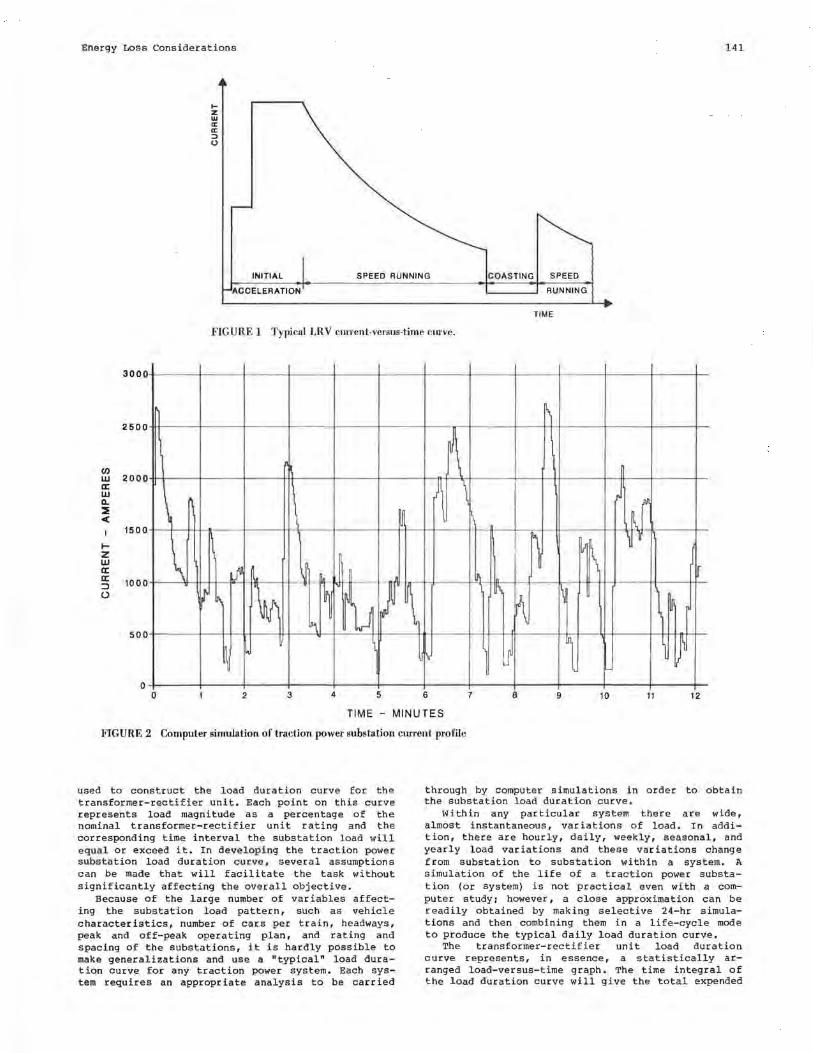
Energy Loss Considerations
,_ z w IC IC :, 0
141
INITIAL SPEED RUNNING COASTING SPEED
ACCELERATION RUNNING
TIME
FIGURE 1 Typical LRV current-versus-time curve.
3000
~ 2500
J t I
) 1 j J1/l
(/) w 2000 a: w a.
\ ~ i1 '\
~l
Jt \ (.fU II' ,I ' ~
j J\ ~ ~ . \ I\
~ ' ~
~ '1t ~ l ~ I
::E <
I 1500
I-z w a: a: 1000 ::J 0
500
0 0 2 3 4 5 6 7 8 9 10 11 12
TIME - MINUTES
FIGURE 2 Computer simulation of traction power substation current profile
used to construct the load duration curve for the transformer-rectifier unit, Each point on this curve represents load magnitude as a percentage of the nominal transformer-rectifier unit rating and the corresponding time interval the substation load will equal or exceed it. In developing the traction power substation load duration c ur ve , several assumptions can be made that will facilitate the task without significantly affecting the overall objective.
Because of the large number of variables affecting the substation load pattern, such as vehicle characteristics, number of cars per train, headways, peak and off-peak operating plan, and rating and spacing of the substations, it is hardly possible to make generalizations and use a "typical" load duration curve for any traction power system. Each system requires an appropriate analysis to be carried
through by computer simulations in order to obtain the substation load duration curve.
Within any particular system there are wide, almost instantaneous, variations of load. In addition, there are hourly, daily, weekly, seasonal, and yearly load variations and these variations change from substation to substation within a system. A
simulation of the life of a traction power substation (or system) is not practical even with a computer study; however, a close approximation can be readily obtained by making selective 24-hr simulations and then combining them in a life-cycle mode to produce the typical daily load duration curve.
The transformer-rectifier unit load duration curve represents, in essence, a s tatistically arranged load-versus-time graph. The time integral of the load duration curve will give the total expended
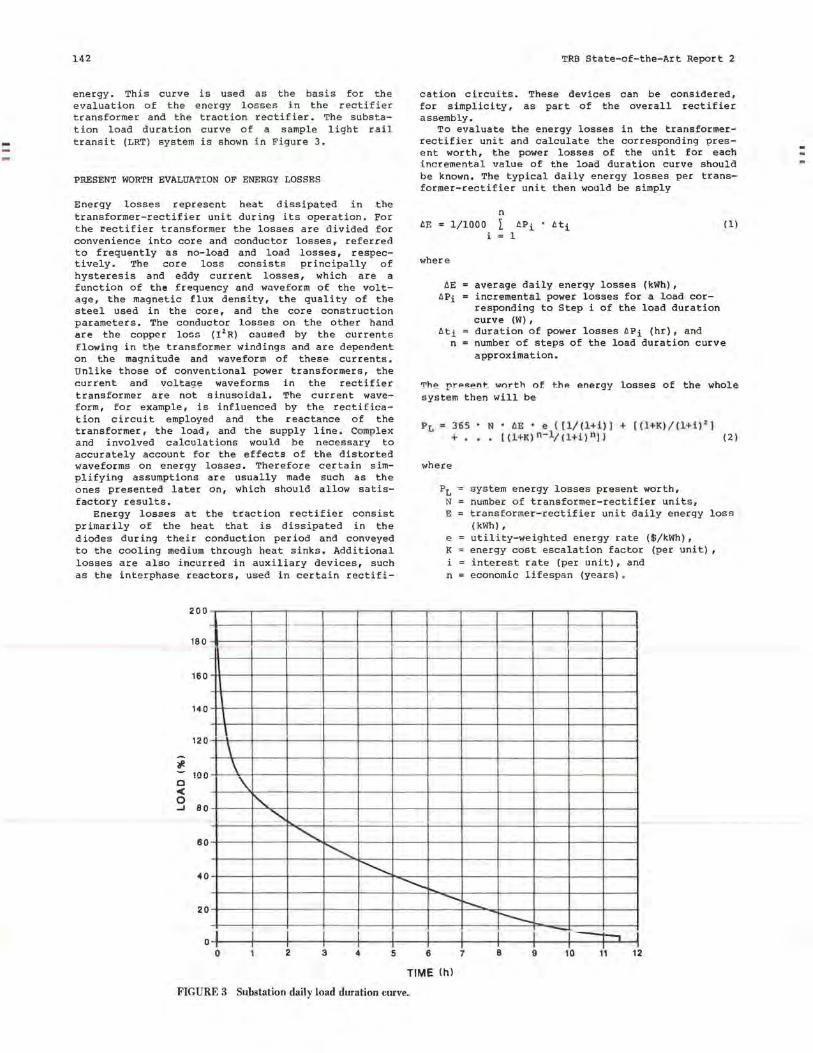
142
energy. This curve is used as the basis for the evaluation of the energy losses in the rectifier transformer and the traction rectifier. The substation load duration curve of a sample light rail transit (LRT) system is shown in Figure 3.
PRESENT WORTH EVALUATION OF ENERGY LOSSES
Energy losses represent heat dissipated in the transformer- rectifier unit during its operation. For the rectifier transformer the losses are divided for convenience into core and conductor losses, referred to frequently as no-load and load losses, respectively. The core loss consists principally of hysteresis and eddy current losses, which are a function of the frequency and waveform of the voltage, the magnetic flux density, the quality of the steel used in the core, and the core construction parameters. The conductor losses on the other hand are the copper lens ( I 2 R) caused by the currents flowing in the transformer windings and are dependent on the magnitude and waveform of these currents. Unlike those of conventional power transformers, the current and voltage waveforms in the rectifier transformer are not sinusoidal. The current waveform, for example, is influenced by the rectification circuit employed and the reactance of the transformer, the load, and the supply line. Complex and involved calculations would be necessary to accurately account for the effects of the distorted waveforms on energy losses. Therefore certain simplifying assumptions are usually made such as the ones presented later on, which should allow satisfactory results.
Energy losses at the traction rectifier consist primarily of the heat that is dissipated in the diodes during their conduction period and conveyed to the cooling medium through heat sinks. Additional losses are also incurred in auxiliary devices, such as the interphase reactors, used in certain rectifi-
200
180
160
140 I
120 \ \
'/1. 100
C < 0 ...I 80
\ \. ~
.............
60 ...............
~
40 -............_
20
TRB State-of-the-Art Report 2
cation circuits. for simplicity, assembly.
These devices can be considered, as part of the overall rectifier
To evaluate the energy losses in the transformerrectifier unit and calculate the corresponding present worth, the power losses of the unit for each incrementa l va].ue of the load duration curve should be known. The typical daily energy losses per transformer-rectifier unit then would be simply
n
1/1000 L 4Pi · t.ti i 1
(1)
where
t.E = average daily energy losses (kWh), t.Pi incremental power losses for a load cor
responding to Step i of the load duration curve (W),
t.t i duration o f power losses t. Pi (hr ) , and n = number of steps of the load duration curve
approximation.
The present worth of t:h<> energy losses of the whole system then will be
PL = 365 +
N • dB • e ( [l/(l+i)J + [( l +K)/(l+i) 2 1 (( l+l()n - l;(l+i)nJ) (2)
where
..............
PL system energy losses present worth, N = number of transformer - r ectifie r units, E transformer-rectifier unit daily energy loss
(kWh), e utility-weighted energy rate ($/kWh), K energy cost escalation factor (per unit), i interest rate (per unit), and n = economic lifespan (years ) .
-- i,....__
r--._ -o----------------i.l-----1------4-----4_~"'-I ~I ~I -,.l....-1
0 2 3 4 5 6 7 B 9 10 11 12
TIME lhl
FIGURE 3 Substation daily load duration curve.
Energy Loss Considerations
Several terms in Equation 2 can be combined in a single parameter, called present worth multiplier (PWM):
PWM = 365 + •
e • {[1/(l+i)] + [(l+K)/(l+i) 2]
[ (l+K) n-1; (l+i) nl}
Then, the present worth of the energy losses is
(3)
PL = N • PWM • ~E (4)
The overall goal, as stated before, is to minimize the system total cost function (F):
F = C + PL = minimum (5)
where C is the initial capital cost for procurement of the transformer-rectifier units.
Designing a rectifier transformer that can meet all performance and reliability requirements of the system and at the same time provide a minimum cost function (F) for a specified load duration curve and set of economic parameters is a complex optimization problem. usually the measures intended for reduction of the power losses result in increased initial cost. A few examples will be given for illustration. Higher grades of steel have smaller specific losses (watts per pound) but are more expensive to buy. Larger conductor sizes reduce the load losses and the winding temperature rise but require more metal and affect the transformer core construction too. Also, the no-load losses, for instance, are a function of the watts per pound loss of the steel employed, the total volume of the core, the flux density, and the core construction. Reducing the flux density by increasing the core cross-sectional area, assuming the number of turns remains constant, will cause the specific core losses (watts per pound) to go down faster than the flux density because of the nonlinear relationship between the two. However, the overall volume of the steel will increase, which will affect the total losses and the cost as well.
GUIDELINES FOR SPECIFYING ECONOMIC TRANSFORMER-RECTIFIER UNITS
It is a normal practice to require the rectifier transformer and rectifier to be designed by the equipment manufacturer. The task of the consulting engineer is to furnish the prospective manufacturer with functional specifications covering all performance, reliability, and safety aspects of the unit. Traction power substation procurement is usually done through a competitive bidding process. Given that different manufacturers often employ or prefer different techniques and manufacturing methods, it is even impractical. to enter into the realm of detailed equipment design.
The task facing the specifier then is not how to design a transformer-rectifier unit with an optimum efficiency but rather how to ensure that only such uni ts are being offered by the manufacturers. The guidelines that follow are deemed helpful in achieving this goal.
First, some assumptions and simplifications should be made in regard to the energy loss evaluation. This is necessary in order to avoid certain cumbersome or controversial procedures and establish a common basis of evaluation for all prospective bidders. A sample set of such assumptions follows.
1. The energy losses shall apply to the transformer-rectifier unit as a complete operable assembly.
2. The rectifier transformer no-load loss de-
143
termination shall be based on a nominal sine-wave voltage and transformer core at room temperature. The aver age-voltage voltmeter method shall be use<'! with the three wattmeters version.
3. No special or separate core loss measurement of the interphase transformer (coupling reactor) shall be made. The interphase tr ans former shall be considered as part of the rectifier assembly and its losses measured as an integral part thereof during the specified rectifier test procedures.
4. The rectifier losses shall include the connection bus between the rectifier transformer and the rectifier itself, as well as any auxiliary devices.
5. All po·11er loss measurements during the design or production tests shall be rounded off to the most significant digit of the indicating meter.
6. The reference temperature for the purposes of conductor losses evaluation shall be equal to the rectifier transformer temperature rise at full load plus 20°c.
7. During design tests, both the no-load and load losses of the prototype transformer-rectifier unit shall be measured on a joint transformer-rectif ier operation. The design tests shall be performed for each different transformer type to be furnished by the contractor.
8. Load loss measurements during the design tests shall be performed for both Method 1 and Method 3 of Section 8.3.2. of American National Standards Institute C34.2. The difference between the two tests (segregated and lumped losses) shall be used as the rectifier load losses constant for all similar units undergoing subsequent production tests. Two no-load loss tests shall be performed during the design tests as well, one with the rectifier connected to and the other with the rectifier disconnected from the transformer. The difference between the two tests shall be used as the rectifier no-load losses constant for all similar units undergoing subsequent production tests.
9. Load loss tests shall be performed with excited winding sine-wave currents having the same root mean square values as the theoretically ideal rectangular-current waves corresponding to the particular unit loading.
10. No-load and load loss measurements during production tests shall be performed on the rectifier transformer only. Traction rectifier losses shall be assumed to be the same as the ones established during the design tests.
11. The manufacturer shall submit to the engineer for approval a justification of the per unit hysteresis and eddy-current loss components to be used in the transformer excitation losses evaluation.
Second, the specifier has to furnish the prospective manufacturers with all the data they need to design the economic transformer-rectifier unit. In addition to various technical performance and reliability requirements he has to supply the present worth multiplier, calculated from Equation 3, and the transformer-rectifier load duration curve obtained through computer simulations, as described earlier.
Third, the consulting engineer has to find a means of ensuring that the manufacturers will design transformers and rectifiers with economic parameters as intended. The easiest way to accomplish this in a competitive bid situation is to include the present worth of the energy losses in the manufacturer's bidding price. It will be to the manufacturer's advantage to design the transformer-rectifier unit as close to the ideal optimum economic unit as practically possible. Two approaches could be taken.
144
T'\ ___ , ~ •• '11. ..... .-.- ........... 1,., .r,;;:;UQ.J..'-X &'1,t't::'"-'-''-''-U
The manufacturer has to furnish and guarantee with his bid offer the maximum transformer-rectifier unit power losses for varying load conditions, The same power losses are used to calculate the present worth of the system energy losses using Equations 1 and 4, The energy loss present worth is then applied as a separate entry in the bid form and added to the total equipment bid price to obtain an adjusted bid price used for bid comparison purposes only. The lowest adjusted bid pr ice will determine the contract award. The successful bidder has to prove during the manufacturing stage through factory tests that his equipment meets the power loss levels he has guaranteed. The specifier may include in the contract documents fallback clauses in case the manutacturer tails to meet the power loss levels. Such clauses may be, for example, penalties in the amount equal to the additionally incurred energy loss cost or a rejection of the equipment.
Incentive l\pproach
acceptable daily energy loss level per transformerrect i fi er unit a nd pay the p rospective manu fac t urer a bonus based on the difference between this level and the energy losses of the unit obtained through actual measurements, A value of 3 percent of the transformer-rectifier unit daily energy consumption may be used as a reasonable estimate for the maximum acceptable energy loss level. The value of the bonus is calculated in the same fashion as is energy loss present worth by s ubstituting the ener gy losses with the energy loss differential (the difference between the specified maximum acceptable energy loss and the actual unit energy loss), The equipment power losses used to calculate the energy losses (and consequently the amount of bonus if any) have to be obtained t h r ough factory tests, as they do in the penalty approach. Because the manufacturer is invol ved in a competitive bid situation, his tendency would be to subtract the anticipated energy bonus from his equipment price in an attempt to lower his bid and thereby increase his changes of success.
SAMPLE CASE
The principles and procedures discussed in this paper we r e applied i n t he desig n and procurement stages of the Guadalupe Corridor LRT system in San Jose, California.
The system consists of 21 mi of double track supplied by 14 traction power substations plus one dedicated substation for the maintenance facility. All substations are rated 1500 kW nominal at 800- V DC output voltage.
The following economic factors were established:
1. 2. 3. 4.
Life-cycle analysis term= 20 years, Energy rate= $0,07/kWh, Energy rate escalation factor= 4%/year, and Interest rate= 10%.
TRB State-of- the- Art Report 2
Th~~o f~ctcr~ =ub~titutcd i~ Equati~n 3 lend a sent worth multiplier of $287/kWh.
The following transformer-rectifier unit load duration curve was obtained through computer simulations,
Load ( % of full load) 200 150 100
75 50 25
0
Duration (hr) 0.1 0.4 1.25 2 .15 3.2 4.4
12.5
After some deliberations, the incentive approach was adopted tor implementation in the contract documents. The maximum acceptable substation energy losses level was accordingly set at 285 kWh per day.
Prebid inquiries to manufacturers concerning the energy loss characteristics of their transformerrectifier units indicated that variations were wider than previously expected. The calculated present worth of the overall system energy loss ranged between $700,000 and $1,200,000.
Because, in the incentive approach, the proposed transforme r -rect i f i er unit l oss cha r acte r istic and the bonus anticipated by each manufacturer are not explicity stated, it is difficult to make a comparative analysis. On inquiry, however, manufacturers did confirm that they had lowered their bid price in anticipation of an energy bonus from the transit authori ty .
CONCLUSIONS
Current practice in the design of traction power substations is usually to specify transformer- recti fie r un i t e fficie ncy for one or several l oad l evels. The efficiency values selected are more or less judgmental and are intended to provide for quality of the product and limit the energy losses to some acceptable level. This approach does not necessarily prov i de an optimum design from an economic standpoint.
A procedure , based on the present worth method, was developed to specify economically optimum transformer- rectifier units. It requires additional work on the part of the specifier but can result in significant s av ings ove r the l ife cycl e of the equipment. The approach described on this paper was applied successfully for the Guadalupe Corridor light rail transit system, It was favorably received by the equipment manufacture r :; . Although the exact amount of savings achieved is difficult to evaluat e, the method can be recommended because of its intrinsic economic advantages.
ACKNOWLEDGMENTS
The authors wish to thank the Santa Clara County , California, Transportation Agency and especially David Minister and James Pierson for their encouragement and helpful advice in producing this work.
Key Interfaces in the Design of Ilaction Electrification Systems for Light Rail Transit Willard n Weiss Jean-Luc Dupont Railroad and Transit Division, Morris Knudsen Engineers, Inc. San Francisco, California
As does any major project, the design of a light rail transit (LRT) system requires the integration of a large number of subsystems to produce a safe, efficient operating facility at an economical cost. Failure to identify essential points of interface among the various subsystems and to evaluate the mutual effects of different design features of each subsystem on the others can result in unnecessarily high overall costs. Often the designer of one subsystem will attempt to optimize his design without recognizing the cost effects of his design decisions on other project elements.
Examples abound, and although some interrelationships are obvious--for example selection of overbridge clearances sufficient for the vehicle to pass beneath--many others are not so apparent i for example, careful selection of track maintenance tolerances to reduce the number of overhead contact system poles.
Ideally, all subsystem interface points should be identified before the design commences so full coordination and joint evaluation of mutual impacts can be performed during the design process.
One project element that has a particularly large number of interfaces with a wide variety of other elements is the traction electrification system (TES). The purpose of this paper is to identify the principal interfaces of the TES with other subsystems and to present a number of analyses of the effects on the TES design of several key design decisions in these other subsystems. Examples of TES designs from several recent light rail transit projects are presented to demonstrate these interrelationships. The discussion is concerned with traction electrification systems that use overhead contact not third rail.
IDENTIFICATION OF INTERFACES
The design of the traction electrification system, including both the power supply system (substations, feeders, switchgear, etc.) and the overhead contact system, affects and is affected by the design of the following other LRT project elements:
• Vehicles, • Operations, • Utilities, • Trackwork,
Civil works, • Signaling and train control, • Vehicle maintenance facility, and • Architectural and urban design.
As a convenience in identifying potential TES interfaces, a detailed list has been prepared (see Appendix) of potential points of interface within each of these project elements. This list can assist LRT designers in identifying at the outset of the design process all areas in which mutual design impacts are likely to occur and where design decisions should be jointly made.
To demonstrate the effects of several of the more significant impacts on the TES design, the following sections include examples of analyses required to arrive at optimum mutual design decisions.
EFFECT OF VEHICLE OPERATIONS ON DIMENSIONS OF TRACTION POWER EQUIPMENT
One of the most fundamental interfaces in the design of the traction power system is designation of the vehicle loads to be imposed on the electrical system. These loads affect both the sizes and the spacing of the traction substations, as well as the sizes of the overhead contact system (OCS) conductors and feeders.
Vehicle loads are fundamentally derived from projected passenger traffic demand, but the translation of this demand into electrical loads involves designation of vehicle consists, frequencies, speeds, acceleration rates, and auxiliary loading requirements. All of these parameters can be varied within certain limits to produce the same traffic flow but generate different loads on the traction electrification system. Typically, the consists and schedules, as well as contingency operating requirements, are given to the traction power system designer as a fixed parameter, yet a broader systemwide optimization may indicate some overall benefit in varying these values. In determining the dimensions of the traction power system other variable inputs, including the selection of traction voltage level, need to be considered as well. Normally LRT systems employ 600- to 750-volt DC, and the choice affects equipment sizes and locations.
Thus, even with the vehicle loadings given, the power system studies required to determine optimum
145
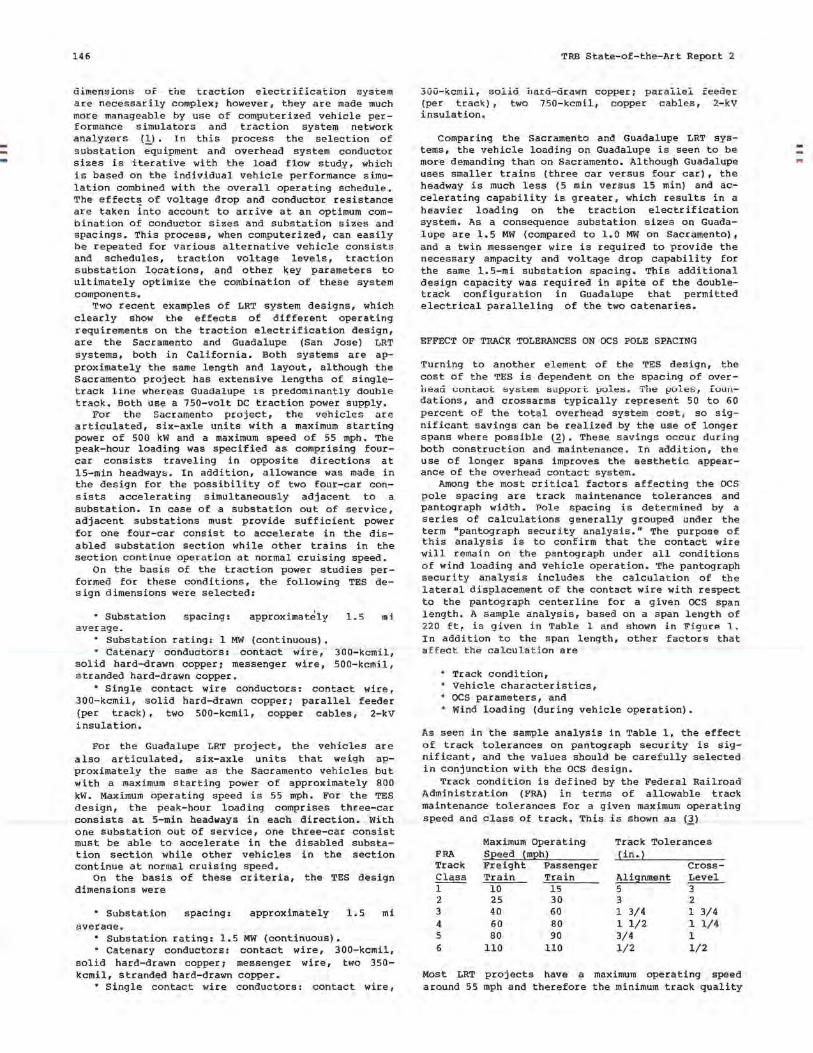
146
dimensions of tne traction electr1I1cat1on system are necessarily complexi however, they are made much more manageable by use of computerized vehicle performance simulators and traction system network analyzers (_!). In this process the selection of substation equipment and overhead system conductor sizes is iterative with the load flow study, which is based on the individual vehicle performance simulation combined with the overall operating schedule. The effects of voltage drop and conductor resistance are taken into account to arrive at an optimum combination of conductor sizes and substation sizes and spacings. This process, when computerized, can easily be repeated for various alternative vehicle consists and schedules, traction voltage levels, traction substation locations, and other key parameters to ultimately optimize the combination of these system components.
Two recent examples of LRT system designs, which clearly show the effects of different operating requirements on the traction electrification design, are the Sacramento and Guadalupe (San Jose) LRT systems, both in California. Both systems are approximately the same length and layout, although the Sacramento project has extensive lengths of singletrack line whereas Guadalupe is predominantly double track. Both use a 750-volt DC traction power supply.
For the Sacramento project, the vehicles are articulated, six- axle units with a maximum starting power of 500 kW and a maximum speed of 55 mph. The peak-hour loading was specified as comprising fourcar consists traveling in opposite directions at 15-min headway~. In addition, allowance was made in the design for the possibility of two four-car consists accelerating simultaneously adjacent to a substation. In case of a substation out of service, adjacent substations must provide sufficient power for one four-car consist to accelerate in the disabled substation section while other trains in the section continue operation at normal cruising speed.
On the basis of the traction power studies performed for these conditions, the following TES design dimensions were selected:
• Substation spacing: approximateily 1.5 mi average.
• Substation rating: 1 MW (continuous). • Catenary conductors: contact wire, 300-kcmil,
solid hard-drawn copper i messenger wire, 500-kcmil, stranded hard-drawn copper.
• Single contact wire conductors: contact wire, 300-kcmil, solid hard-drawn copper i parallel feeder (per track), two 500-kcmil, copper cables, 2-kV insulation.
For the Guadalupe LRT project , the vehicles are also articulated, six-axle units that weigh approximately the same as the Sacramento vehicles but with a maximum starting power of approximately 800 kW. Maximum opera ting speed is 5 5 mph. For the TES design, the peak-hour loading comprises three-car consists at 5-min headways in each direction. With one subs t a t ion ou t of service, one three-car consis t must be able to accelerate in the disabled substation section while other vehicles in the section continue at normal cruising speed.
On the basis of these criteria, the TES design dimensions were
• Substation averaqe.
spacing: approximately
• Substation rating: 1.5 MW (continuous).
1.5 mi
• Catenary conductors: contact wire, 300-kcmil, solid hard-drawn copper i messenger wire, two 350-kcmil, stranded hard-drawn copper.
• Single contact wire conductors: contact wire,
TRB State-of-the-Art Report 2
300- kcmil, so.L:La nara- arawn copper; para.ti.ei. feeder (per track), two 750-kcmil, copper cables, 2-kV insulation.
Comparing the Sacramento and Guadalupe LRT systems, the vehicle loading on Guadalupe is seen to be more demanding than on Sacramento. Although Guadalupe uses smaller trains (three car versus four car), the headway is much less (5 min versus 15 min) and accelerating capability is greater, which results in a heavier loading on the traction electrification system. As a consequence substation sizes on Guadalupe are 1.5 MW (compared to 1.0 MW on Sacramento), and a twin messenger wire is required to provide the necessary ampacity and voltage drop capability for the same 1. 5-mi substation spacing. This additional design capacity was required in spite of the doubletrack configuration in Guadalupe that permitted electrical paralleling of the two catenaries.
EFFECT OF TRACK TOLERANCES ON OCS POLE SPACING
Turning to another element of the TES design, the cost of the TES is dependent on the spacing of overb~ad contact system s upport pules . The poles , foui-1-dations, and crossarms typically represent 50 to 60 percent of the tota l ove rhe ad system cost , so significant savings can be realized by the use of longer spans where possible (2). These sav ings o c cur during both construction and maintenance. In addition, the use of longer spans improves the aesthetic appearance of the overhead contact system.
Among the most cri t ical factors affecting the OCS pole spacing are track maintenance tolerances and pantograph width. Pole spacing is determined by a series of calculations generally grouped under the term "pantograph security analysis." The purpose of this analysis is to confirm that the contact wire will remain on the pantograph under all conditions of wind loading and vehicle operation. The pantograph security analysis includes t he calculat ion of the lateral displacement of the contact wire with respect to the pantograph centerline for a given OCS span length. A sample analysis, based on a span length of 220 ft, is given in Table 1 and shown in F i g urP. 1. In addition to the span length, other factors that a ffec t the c a l cu l a tion are
• Track condition, • Vehicle characteristics , • OCS parameters, and • Wind loading (during vehicle operation).
As seen in the sample analysis in Table 1, the effect of track tol erances on pantograph secur i ty is significant, and the values should be carefully selected in conjunction with the OCS design.
Track condition is defined by the Federal Railroad Administration (FRA) in terms of allowable track maintenance tolerances for a given maximum operating speed and class of track. This is shown as (1)
Maximum Operating Track Tolerances FRA SEeed \mEh! !in.) Track Freight Passenger Cross-Class Train Train Alignment Level -1-- 10 15 5 3 2 25 30 3 2 3 40 60 1 3/4 1 3/4 4 60 80 1 1/2 1 1/4 5 80 90 3/4 1 6 110 110 1/2 1/2
Most LRT projects have a maximum operating speed around 55 mph and therefore the minimum track quality
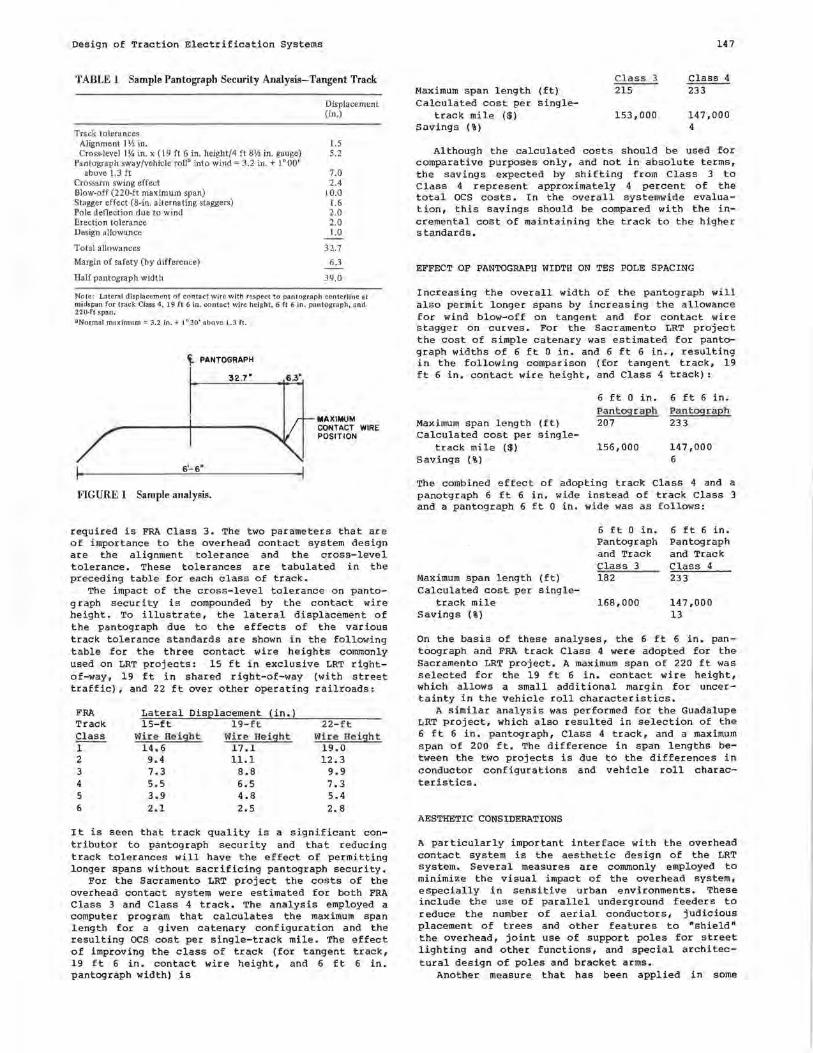
Design of Traction Electrification Systems
TABLE 1 Sample Pantograph Security Analysis-Tangent Track
Track tolerances
Displacement (in.)
Alignment I Y, in. 1.5 Cross-level 1% in. x (19 ft 6 in. height/4 ft 8\1, in. gauge) 5.2
Pantograph sway/vehicle roll" into wind= 3.2 in.+ I 0 00' above 1.3 ft 7.0
Crossarm swing effect 2.4 Blow-off (220-ft maximum span) I 0.0 Stagger effect (8-in. alternating staggers) 1.6 Pole deflection due to wind 2.0 Erection tolerance 2.0 Design allowance 1.0
Total allowances
Margin of safety (by difference)
Half pantograph width
32.7
6.3
39.0
Note: Lateral djsplacement of contact wire with respect to pantograph centerline at midspan for track CJass 4, 19 ft 6 in. contact \.Vire height, 6 ft 6 in. pantograph, and 220.ft span. 8 Normal maximum= 3.2 in.+ 1°30' above 1.3 ft.
~ PANTOGRAPH
32.7"
FIGURE 1 Sample analysis.
6.3"
MAXIMUM CONTACT WIRE POSITION
required is FRA Class 3. The two parameters that are of importance to the overhead contact system design are the alignment tolerance and the cross-level tolerance. These tolerances are tabulated in the preceding table for each class of track.
The impact of the cross-level tolerance on pantograph security is compounded by the contact wire height. To illustrate, the lateral displacement of the pantograph due to the effects of the various track tolerance standards are shown in the following table for the three contact wire heights commonly used on LRT projects: 15 ft in exclusive LRT rightof-way, 19 ft in shared right-of-way (with street traffic), and 22 ft over other operating railroads:
FRA Lateral Dis12lacement (in.) Track 15-ft 19-ft 22-ft Class Wire Height Wire Height Wire Height -1 - - 14 . 6 17.1 19.0 2 9 . 4 11.1 12.3 3 7 . 3 8.8 9.9 4 5 . 5 6.5 7.3 5 3,9 4.8 5.4 6 2,1 2.5 2.8
It is seen that track quality is a significant contributor to pantograph security and that reducing track tolerances will have the effect of permitting longer spans without sacrificing pantograph security.
For the Sacramento LRT project the costs of the overhead contact system were estimated for both FRA Class 3 and Class 4 track. The analysis employed a computer program that calculates the maximum span length for a given catenary configuration and the resulting OCS cost per single-track mile. The effect of improving the class of track (for tangent track, 19 ft 6 in. contact wire height, and 6 ft 6 in. pantograph width) is
Maximum span length (ft) Calculated cost per single
track mile ($) Savings (%)
Class 3 215
153,000
147
Class 4 233
147,000 4
Although the calculated costs should be used for comparative purposes only, and not in absolute terms, the savings expected by shifting from Class 3 to Class 4 represent approximately 4 percent of the total OCS costs. In the overall systemwide evaluation, this savings should be compared with the incremental cost of maintaining the track to the higher standards.
EFFECT OF PANTOGRAPH WIDTH ON TES POLE SPACING
Increasing the overall width of the pantograph will also permit longer spans by increasing the allowance for wind blow-off on tangent and for contact wire stagger on curves. For the Sacramento LRT project the cost of simple catenary was estimated for pantograph widths of 6 ft O in. and 6 ft 6 in., resulting in the following comparison ( for tangent track, 19 ft 6 in. contact wire height, and Class 4 track):
Maximum span length (ft) Calculated cost per single
track mile ($) Savings (%)
6 ft O in. 6 ft 6 in. Pantograph 207
156,000
Pantograph 233
147,000 6
The combined effect of adopting track Class 4 and a panotgraph 6 ft 6 in. wide instead of track Class 3 and a pantograph 6 ft O in. wide was as follows:
Maximum span length (ft) Calculated cost per single
track mile Savings (%)
6 ft O in. Pantograph and Track Class 3 182
168,000
6 ft 6 in. Pantograph and Track Class 4 233
147,000 13
On the basis of these analyses, the 6 ft 6 in. pantoograph and FRA track Class 4 were adopted for the Sacramento LRT project. A maximum span of 220 ft was selected for the 19 ft 6 in. contact wire height, which allows a small additional margin for uncertainty in the vehicle roll characteristics.
A similar analysis was performed for the Guadalupe LRT project, which also resulted in selection of the 6 ft 6 in. pantograph, Class 4 track, and a maximum span of 200 ft. The difference in span lengths between the two projects is due to the differences in conductor configurations and vehicle roll characteristics.
AESTHETIC CONSIDERATIONS
A particularly important interface with the overhead contact system is the aesthetic design of the LRT system. Several measures are commonly employed to minimize the visual impact of the overhead system, especially in sensitive urban environments. These include the use of parallel underground feeders to reduce the number of aerial conductors, judicious placement of trees and other features to "shield• the overhead, joint use of support poles for street lighting and other functions, and special architectural design of poles and bracket arms.
Another measure that has been applied in· some
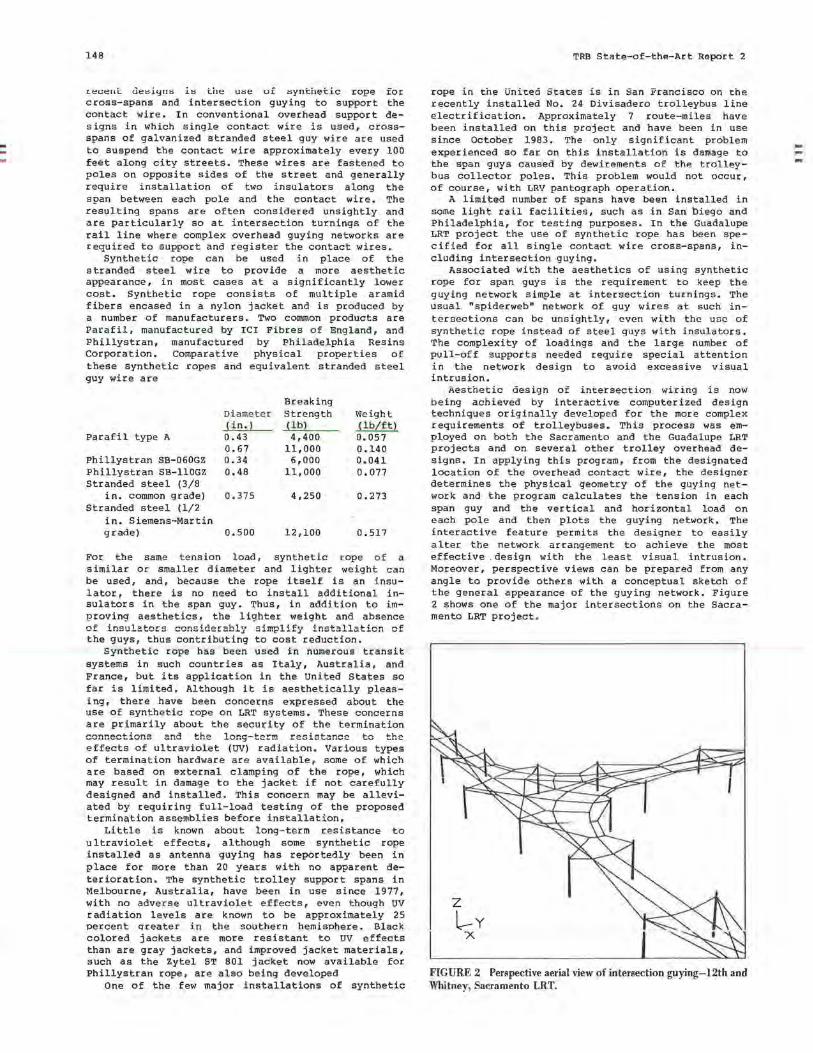
148
Leceni:. clesiyns .is the use ui synthetic rope for cross- spans and intersection guying to support the contact wire. In conventional overhead support designs in which single contact wire is used, crossspans of galvanized stranded steel guy wire are used to suspend the contact wire approximately every 100 feet along city streets. These wires are fastened to poles on opposite sides of the street and generally require installation of two insulators along the span between each pole and the contact wire. The resulting spans are often considered unsightly and are particularly so at intersection turnings of the rail line where complex overhead guying networks are required to support and register the contact wires.
Synthetic rope can be used in place of the stranded steel wire to provide a more aesthetic appearance, in most cases at a significantly lower cost. Synthetic rope consists of multiple aramid fibers encased in a nylon jacket and is produced by a number of manufacturers. Two common products are Paraf il, manuf actured by ICI F ibres of Engl and, and Phillystran, manufactured by Philadelphia Resins Corporation. Comparative physical properties of these synthetic ropes and equivalent stranded steel guy wire are
Breaking Diameter Strength Weight !in.) ! lb ! (lb/f t)
Parafil type A 0.43 4,400 0.057 0.67 11,000 0.140
Phillystran SB-060GZ 0.34 6,000 0.041 Phillystran SB-llOGZ 0.48 11,000 0.077 Stranded steel (3/8
in. common grade) 0.37 5 4,250 0.273 Stranded steel (1/2
in. Siemens-Martin grade) 0.500 12,100 0.517
For the same tension load , synthetic r ope of a similar or smaller diameter and lighter weight can be used, and, because the rope itself is an insulator, there is no need to install additional insulators in the span guy. Thus, in addition to improving aesthetics. the lighter weight and absence n-F ;nc:n,1 ::i+-nr C! ,...ri,n cdrl o r::ih1y cdmpl; f=y .fn C! +-::il l ::i +-;,...n f"'\.f'
the guys, thus contributing to cost reduction. Synthetic rope has been used in numerous transit
systems in such countries as Italy, Australia, and France, but its application in the United States so far is limited. Although it is aesthetically pleas ing, there have been concerns expressed about the use of synthetic rope on LRT systems. These concerns are primarily about the security of the termination ~ri,nno ....... ;,...nC! and the ,,...ng-+-=~m ~~~;~f-::,.n,...= to the effects of ultrav iolet (UV) radiation. Various t ypes of termination hardware are available, some of which are based on external clamping of the rope, which may result in damage to the jacket if not carefully designed and installed. This concern may be alleviated by requiring full-load testing of the proposed termination assemblies before installation,
Little is known about long- term resistance to ultraviolet effects, although some synthetic rope installed as antenna guying has reportedly been in place for more than 20 years with no apparent deterioration. The synthetic trolley support spans in Melbourne, Australia, have been in use since 1977, with no adve r se ultraviole t effects, e ve n t hough UV radiation levels are known to be approximately 25 percent qreater in the southern hemisphere. Black colored jackets are more resistant to UV effects than are gray jackets, and improved jacket materials, such as the Zytel ST 801 jacket now available for Phillystran rope, are also being developed
One of the few major installations of synthetic
TRB State-of-the-Art Report 2
rope in che Uniced Scaces is in San Francisco on che rece ntly installed No. 24 Divisadero trolleybus line electrification. Approximately 7 route-miles have been installed on this project and have been in use since October 1983. The only significant problem experienced so far on this installation is damage to the span guys caused by dew i rements of the t r olleybus collector poles. This problem would not occur, of course , with LRV pantograph operation.
A limited number of spans have been installed in some light rail facilities, such as in Sari biego and Philadelphia, for testing purposes. In the Guadalupe LRT project the use of synthetic rope has been specified for all single contact wire cross-spans, including intersection guying.
Associated with the aesthetics of using synthetic rope for span guys is the requirement to keep the guying network simple at intersection turnings. The usual "spiderweb" network of guy wires at such intersections can be unsightly , even with the use of synthetic rope instead of steel g uys with insulator s . The complexity of loadings and the large number of pull-off supports needed require special attention in the network design to avoid excessive visual intrusion.
Aesthetic design of incersection wiring is now being achieved by interactive computerized design technique s originally develope d for the more complex requirements of trolleybuses. This process was employed on both the Sacramento and the Guadalupe LRT projects and on several other trolley overhead designs. In applying this program, from the designated location of the overhead contact wire, the designer de t e r mines t he physical geometry of the guying network and the program calculates the tension in each span guy and the vertical and horizontal load on each pole and then plots the guying network. The interactive feature permits the designer to easily alter the network arrangement to achieve the most effective . design with the least visual intrusion. Moreover, perspective views can be prepared from any angle to provide others with a conceptual sketch of the general appearance of the guying network. Figure 2 shows one of the major intersections on the Sacramento LRT project .
z l.-Y
·x
FIGURE 2 Perspective aerial view of intersection guying- 12th and Whitney, Sacramento LRT.
,...
Design of Traction Electrification Systems
OTHER SITE-SPECIFIC INTERFACES
The foregoing examples have systemwide applicationi on any project there are also numerous site-specific interfaces, which can create design problems disproportionately high for their actual constructed costs. For example, on the Guadalupe project one grade crossing of a main-line railroad required a pantograph reach of 23 ft O in. where 20 ft would be acceptable for normal street operation. In San Diego, where the LRT uses an existing main-line railroad, a dispensation had to be obtained from standard rules (California General Order 95) requiring 22 ft O in. contact wire height because of pantograph reach 1 imitations.
Other common examples of site-specific interfaces include individual bridge attachments, use of eyebolts in private buildings to support cross-spans, possible interference with the operation of firefighting equipment, joint use of TES poles for lighting and traffic signals, and special foundations on sidewalks over basements.
CONCLUSION
The examples discussed here describe only a few of the more important interfaces that occur in the design of the traction electrification system. In each case it is shown that design decisions in other elements of an LRT system can seriously affect the design, and hence the cost, of the TES. Many other similar interfaces exist, as indicated in the list in the Appendix, with similar impacts. All too often many of these design decisions are made independently and given as fixed criteria to the TES designer.
To optimize the total LRT system design, and thereby minimize tQe overall costs of its construction and maintenance, it is important that all such design interfaces be investigated jointly by the respective subsystem designers. Design and cost impacts on the TES of alternative design choices in other project elements, as well as the reverse effects of alternative TES design features, can be evaluated before plans are made final. This systemwide analysis is required at the preliminary engineering stage or earlier. Careful investigation of these interfaces should serve to reduce the overall costs of LRT projects now being planned and thereby contribute to the operational and commercial success of these systems.
REFERENCES
1. A. Daniels and S.D. Jacimovic. An Analytical Method for Predicting the Performance of a Rail Transit Power System. Conference Record, Industrial Applications Society, IEEE-IAS 1983 Annual Meeting, Mexico City, Oct. 3-7, 1983.
2 . H. I. Hayes. Reducing Catenary Costs by Design. In Transportation Research Record 953, TRB, National Research Council, Washington, D.C., 1984, pp. 52-57.
3. Track Safety Standards. Office of Safety, Federal Railroad Administration, u.s. Department of Transportation, Nov. 1980.
APPENDIX: DESIGN INTERFACES FOR TRACTION ELECTRIFICATION SYSTEM
The following list includes most of the interface items likely to be encountered in the design of the
149
traction electrification system for a light rail transit project.
1. Light Rail Vehicles a. Physical dimensions and weights (empty,
loaded, crush) b. Dynamic clearance envelope (tangent,
curves) C • Vehicle roll, lateral shift (normal and
broken suspension) d. Pantograph dimensions: overall width,
carbon strip width, spacing between collectors, operating height range
e. Pantograph mass and uplift pressure f. Limitation in contact wire gradient and
gradient change g. Pantograph lateral sway h. Electrical characteristics: voltage, power i. Tractive and braking effort curves j. Acceleration and braking characteristics k. Auxiliary power supply (heating, light
ing, air conditioning, etc.) 1. Regenerative braking requirements.
2. Operations a. Train schedules, speeds, headways, dwell
times, consists (peak, off-peak) b. Emergency operation requirements (substa
tion outage, broken suspension, singletrack running, etc.)
c. Backup power supply requirements d. TES sectioning requirements (maintenance,
firefighting, etc.) e. Maximum wind speed for vehicle operations
3. Utilities a. Location and voltage levels of utility
supply points b. Utility criteria: short circuit level,
harmonics, flicker, etc. c. System grounding philosophy and criteria d. Relocation of overhead utility lines in
vicinity of TES e. Relocation of underground utilities f. Joint use of underground ducts for TES
feeders g. Provisions for emergency services (fire,
police, ambulances)
4. Trackwork a. Track dimensions, rail, ballast data b. Single- or double-track layouts, future
track additions c. Track plans: alignment,
elevations, clearances (especially on curves)
profile, between
supertracks
d. Locations and configurations of switches, crossovers, turnouts, passing sidings, etc.
e. Track maintenance tolerances (horizontal, cross-level)
f. Classification of right-of-way (exclu-sive, shared, etc.)
g. Locations of crossings
5. Civil works a. Locations, dimensions, clearances of
bridges, tunnels, etc. b. Arrangements for TES attachments on
bridges, overhead structures, and adjacent buildings
c. Locations and arrangements of passenger stations
d. Drainage systems--potential interference e. Soil characteristics for foundation design f. Soil resistivity
6. Signaling and train control a. Requirement for signal cables on TES
structures
150
b. Electromagnetic interference between power supply and signaling
c. Joint use of TES structures for LRV and street traffic signals
d. Arrangement for intersection traffic preemption
e. Signal blocks for sectionalizing f. Impedance bond locations
7. Vehicle maintenance facility a. Yard and shop track layouts b, Typical yard movements c. Secti onal izing requirements d, Building: clearances, power supply, door
operation, ground mat, warning systems, personnel safety criteria
e. Joint use of poles for yard lighting
TRB State-of-the-Art Report 2
8. Architectural and urban design a, Pole types, special assembly design
(crossarms, ·counterweights, etc,) b. Pole locations c. Use of synthetic rope for spans and guys d. Arrangement of TES at passenger stations
(locations, overlaps, poles on platforms, etc.)
e. Locations for use of single contact wire with parallel feeders
f. Joint use of poles for street lighting , traffi c s i gnal s , etc .
g, Requirements for intersection guying arrangements
h. Substation locations , architectural designs, landscaping, etc.
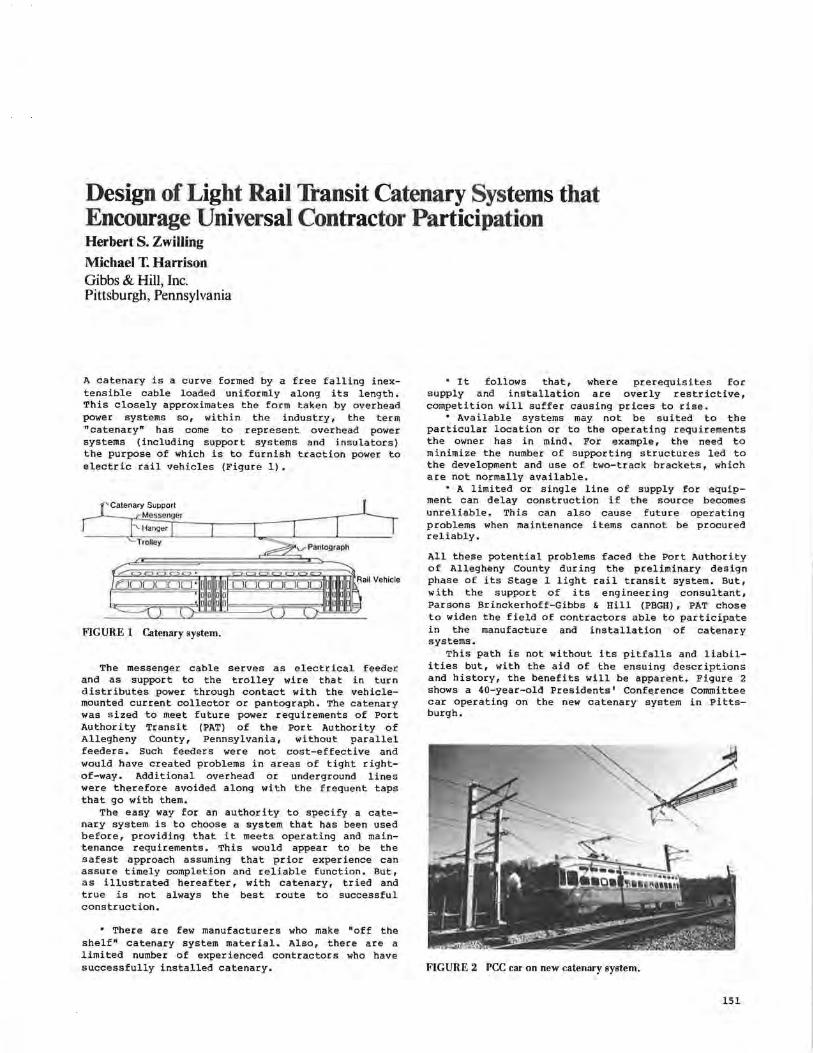
Design of Light Rail 'Iransit Catenary Systems that Encourage Universal Contractor Participation Herbert S. Zwilling
Michael T. Harrison Gibbs & Hill, Inc. Pittsburgh, Pennsylvania
A catenary is a curve formed by a free falling inextensible cable loaded uniformly along its length. This closely approximates the form taken by overhead power systems so, within the industry, the term "catenary" has come to represent overhead power systems (including support systems and insulators) the purpose of which is to furnish traction power to electric rail vehicles (Figure 1).
Catenary Support Messenger
'"'\._ Hanger
Trolloy
FIGURE I Catenary system.
The messenger cable serves as electrical feeder and as support to the trolley wire that in turn distributes power through contact with the vehiclemounted current collector or pantograph. The catenary was sized to meet future power requirements of Port Authority Transit (PAT) of the Port Authority of Allegheny County, Pennsylvania, without parallel feeders. Such feeders were not cost-effective and would have created problems in areas of tight rightof-way. Additional overhead or underground lines were therefore avoided along with the frequent taps that go with them.
The easy way for an authority to specify a catenary system is to choose a system that has been used before, providing that it meets operating and maintenance requirements. This would appear to be the safest approach assuming that prior experience can assure timely completion and reliable function. But, as illustrated hereafter, with catenary, tried and true is not always the best route to successful construction.
• There are few manufacturers who make "off the shelf" catenary system material. Also, there are a limited number of experienced contractors who have successfully installed catenary.
• It follows that, where prerequisites for supply and installation are overly restrictive, competition will suffer causing prices to rise.
• Available systems may not be suited to the particular location or to the operating requirements the owner has in mind. For example, the need to minimize the number of supporting structures led to the development and use of two-track brackets, which are not normally available.
• A limited or single line of supply for equipment can delay construction if the source becomes unreliable. This can also cause future operating problems when maintenance i terns cannot be procured reliably.
All these potential problems faced the Port Authority of Allegheny County during the preliminary design phase of its Stage 1 light rail transit system. But, with the support of its engineering consultant, Parsons Brinckerhoff-Gibbs & Hill (PBGH), PAT chose to widen the field of contractors able to participate in the manufacture and installation of catenary systems.
This path is not without its pitfalls and liabilities but, with the aid of the ensuing descriptions and history, the benefits will be apparent. Figure 2 shows a 40-year-old Presidents' Conference Committee car operating on the new catenary system in Pittsburgh.
FIGURE 2 PCC car on new catenary system.
151
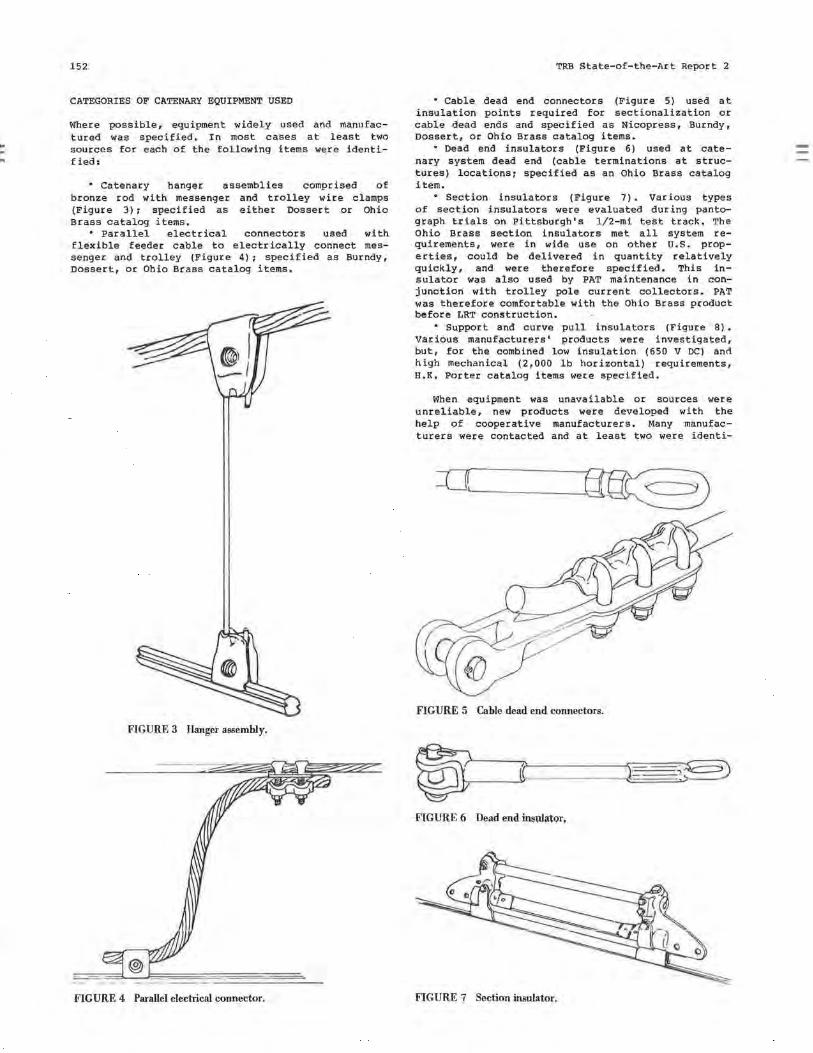
: ..
152
CATEGORIES OF CATENARY EQUIPMENT USED
Where possible, equipment widely used and manufactured was specified. In most cases at least two sources for each of the following items were identified:
• Catenary hanger assemblies comprised of bronze rod with messenger and trolley wire clamps (Figure 3); specified as either Dessert or Ohio Brass catalog items.
• Parallel electrical connectors used with flexible feeder cable to electrically connect messenger and trolley (Figure 4); specified as Burndy, Dessert, or Ohio Brass catalog items.
FIGURE 3 Hanger assembly.
FIGURE 4 Parallel electrical connector.
TRB State-of-the-Art Report 2
• Cable dead end connectors (Figure 5) used at insulation points required for sectionalization or cable dead ends and specified as Nicopress, Burndy, Dessert, or Ohio Brass catalog items.
• Dead end insulators (Figure 6) used at catenary system dead end (cable terminations at structures) locations; specified as an Ohio Brass catalog item.
• Section insulators (Figure 7). Various types of section insulators were evaluated during pantograph trials on Pittsburgh's 1/2-mi test track. The Ohio Brass section insulators met all system requirements, were in wide use on other U.S. properties, could be delivered in quantity relatively quickly, and were therefore specified. This insulator was also used by PAT maintenance in conjunction with trolley pole current collectors. PAT was therefore comfortable with the Ohio Brass product before LRT construction.
• Support and curve pull insulators (Figure 8). Various manufacturers' products were investigated, but, for the combined low insulation (650 V DC) ann high mechanical (2,000 lb horizontal) requirements, H.K. Porter catalog items were specified.
When equipment was unavailable or sources were unreliable, new products were developed with the help of cooperative manufacturers. Many manufacturers were contacted and at least two were identi-
FIGURE 5 Cable dead end connectors.
FIGURE 6 Dead end insulator,
FIGURE 7 Section insulator.
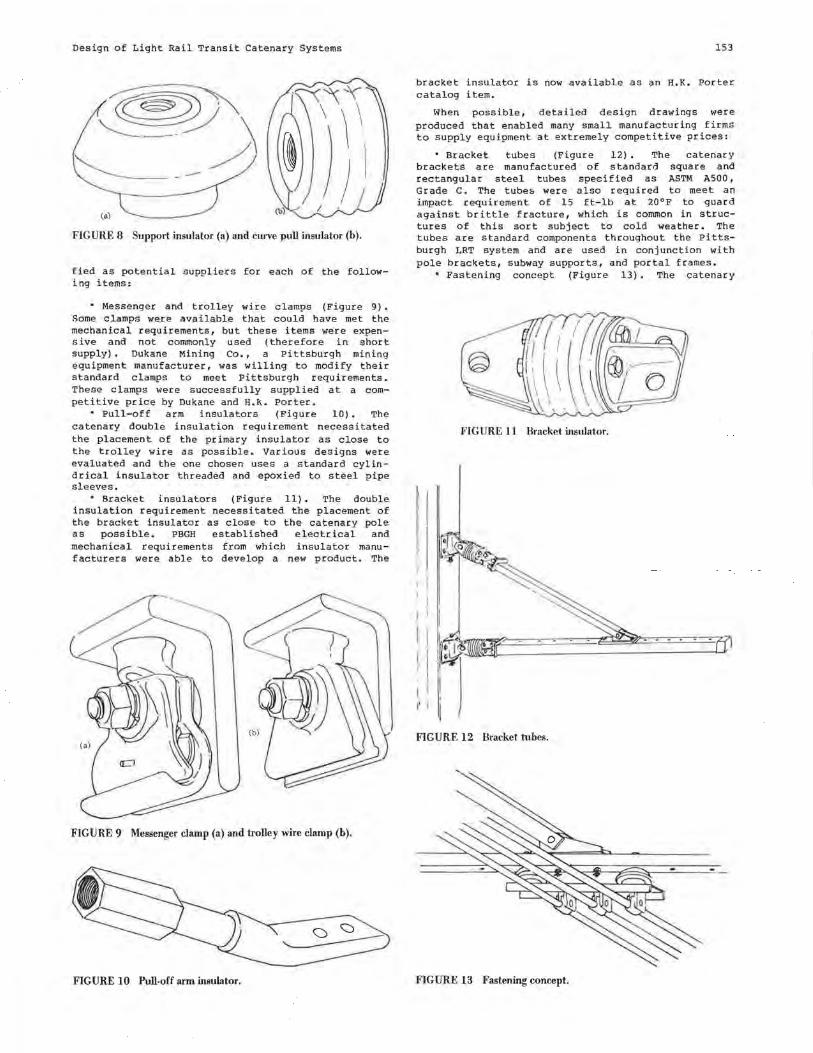
Design of Light Rail Transit Catenary Systems
(a)
FIGURE 8 Support insulator (a) and curve pull insulator (b).
fied as potential suppliers for each of the following i terns:
• Messenger and trolley wire clamps (Figure 9). Some clamps were available that could have met the mechanical requirements, but these items were expensive and not commonly used (therefore in short supply). Dukane Mining Co., a Pittsburgh mining equipment manufacturer, was willing to modify their standard clamps to meet Pittsburgh requirements. These clamps were successfully supplied at a competitive price by Dukane and H.R. Porter.
• Pull-off arm insulators (Figure 10). The catenary double insulation requirement necessitated the placement of the primary insulator as close to the trolley wire as possible. Various designs were evaluated and the one chosen uses a standard cylindrical insulator threaded and epoxied to steel pipe sleeves.
• Bracket insulators (Figure 11). The double insulation requirement necessitated the placement of the bracket insulator as close to the catenary pole as possible. PBGH established electrical and mechanical requirements from which insulator manufacturers were able to develop a new product. The
FIGURE 9 Messenger clamp (a) and trolley wire clamp (b).
FIGURE 10 Pull-off arm insulator.
153
bracket insulator is now available as an H.K. Porter catalog i tern.
When possible, detailed design drawings were produced that enabled many small manufacturing firms to supply equipment at extremely competitive prices:
• Bracket tubes (Figure 12). The catenary brackets are manufactured of standard square and rectangular steel tubes specified as ASTM ASOO, Grade C. The tubes were also required to meet an impact requirement of 15 ft-lb at 20°F to guard against brittle fracture, which is common in structures of this sort subject to cold weather. The tubes are standard components throughout the Pittsburgh LRT system and are used in conjunction with pole brackets, subway supports, and portal frames.
• Fastening concept (Figure 13). The catenary
FIGURE 11 Bracket insulator.
I I ' i I
FIGURE 12 Bracket tubes.
FIGURE 13 Fastening concept.
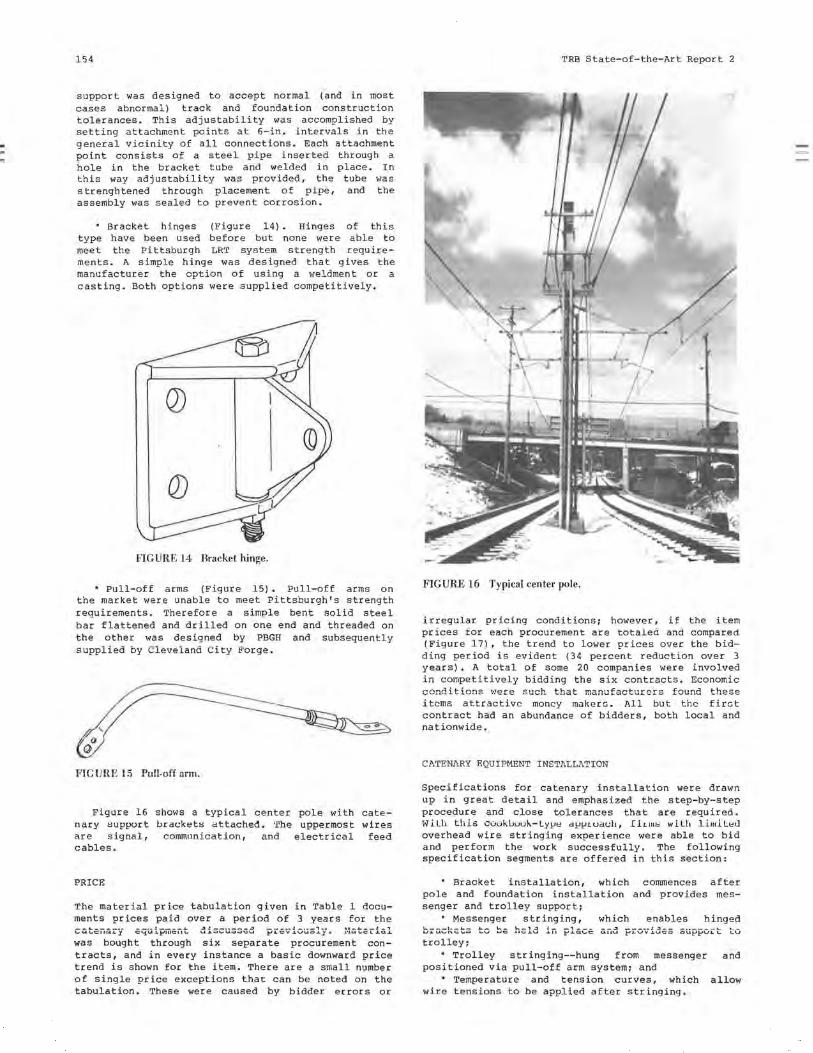
154
support was designed to accept normal (and in most cases abnormal) track and foundation construction tolerances. This adjustability was accomplished by setting attachment points at 6-in. intervals in the general vicinity of all connections. Each attachment point consists of a steel pipe inserted through a hole in the bracket tube and welded in place. In this way adjustability was provided, the tube was strenghtened through placement of pipe, and the assembly was sealed to prevent corrosion.
Bracket hinges (Figure 14). Hinges of this type have been used before but none were able to meet the Pittsburgh LRT system strength requirements. A simple hinge was designed that gives the manufacturer the option of using a weldment or a casting. Both options were supplied competitively.
Q)
FIGURE 14 Bracket hinge.
• Pull-off arms (Figure 15). Pull-off arms on the market were unable to meet Pittsburgh's strength requirements. Therefore a simple bent solid steel bar flattened and drilled on one end and threaded on the other was designed by PBGH and subsequently supplied by Cleveland City Forge.
FIGURE 15 Pull-off arm.
Figure 16 shows a typical center pole with catenary i;upport bracketi; attache~. ·rhe uppermost wires are signal, communication, and electrical feed cables.
PRICE
The material price tabulation given in Table 1 documents prices paid over a period of 3 years for the __ .... _____ _
---- ·----.L -----. ____ , __ •• _.,_ __ ,! - , \,..U.\.'CllQJ.;j 1:;;'-fU ..l..1-'lllo;;::ll\. J:-''-11:;V .LVU.::>..L)' • J.•lu.L,;:;J. .LO...L
was bought through six separate procurement contracts, and in every instance a basic downward price trend is shown for the item. There are a small number of single price exceptions that can be noted on the tabulation. These were caused by bidder errors or
TRB State-of-the-Art Report 2
FIGURE 16 Typical center pole.
irregular pricing conditions; however, if the item prices tor each procurement are totaled and compared (Figure 17), the trend to lower prices over the bidding period is evident (34 percent reduction over 3 years). A total of some 20 companies were involved in competitively bidding the six contracts. Economic r,l"\nrli+-i,-.,,nc t.Joro c11,-.h +-h,:,,+- n1,:,,n.1,.f':::.,-.+-1,rorc:.o .f'n11nrl +-hoe:!o
items attractive money makers. All but the first contract had an abundance of bidders, both local and nationwide.
C/1.TENARY EQUIPMENT INSTALLATION
Specifications for catenary installation were drawn up in great detail and emphasized the step-by-step procedure and close tolerances that are required. Wilh this cuukuuuk-LyJJe dJJJJtuacl1, fl1111i; wlll1 llmlletl overhead wire stringing experience were able to bid and perform the work successfully. The following specification segments are offered in this section:
• Bracket installation, which commences after pole and foundation installation and provides messenger and trolley support;
' Messenger stringing, which enables hinged L.-'1..::1 .!- _, __ _
--..::1 -----.!..::1-- -••-----L 1.-.U,;;:;;.LU .Lil p..La\-.'C 0.11\..1 pl-UV J.Uc;o .::>Ut-J.l:-'VI. \.. LU
trolley; • Trolley stringing--hung from messenger and
positioned via pull-off arm system; and Temperature and tension curves, which allow
wire tensions to be applied after stringing.
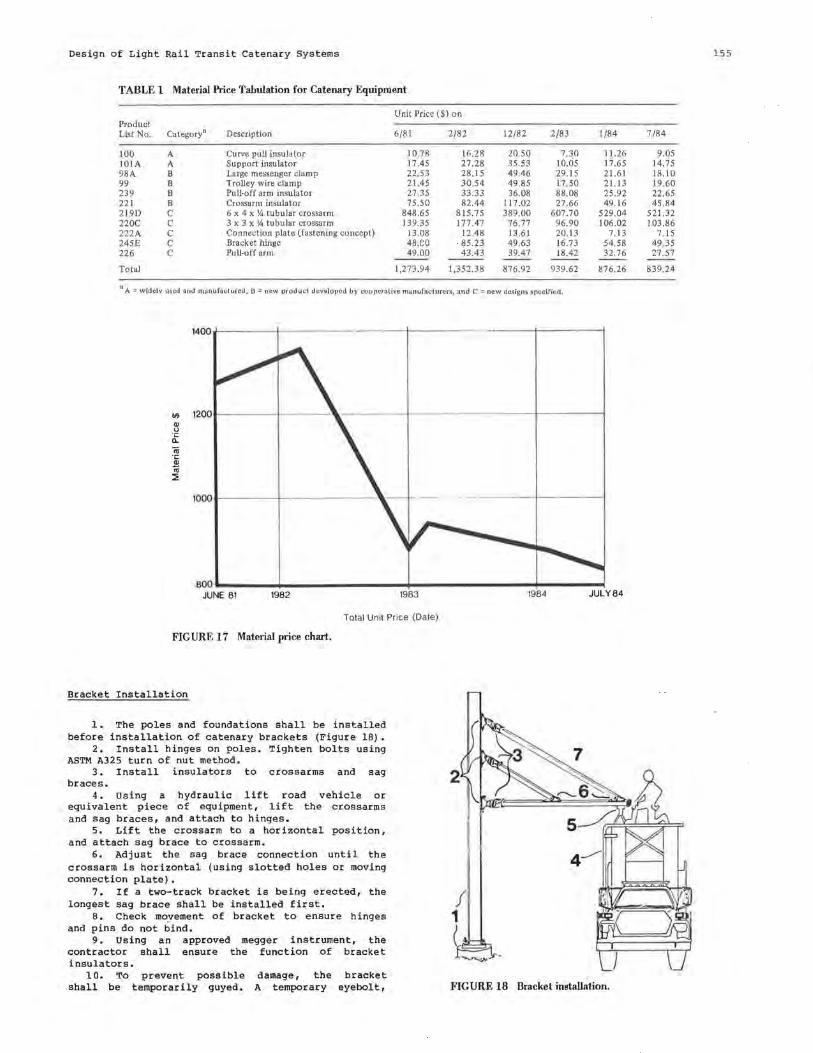
Design of Light Rail Transit Catenary Systems
TABLE 1 Material Price Tabulation for Catenary Equipment
Unit Price($) on Product List No. Category" Description 6/81 2/82 12/82 2/83 1/84
100 A Curve pull insulator 10.78 16 .28 20.50 7.30 11.26 101A A Support insulator 17.45 27.28 35.53 10.05 17.65 98A B Large messenger clamp 22.53 28.15 49.46 29.15 21.61 99 B Trolley wire clamp 21.45 30.54 49.85 17 .50 21.13 239 B Pull-off arm insulator 27.35 33 .33 36.08 88.08 25.92 221 B Crossarm insulator 75.50 82.44 117.02 27.66 49.16 219D C 6 x 4 x !4 tubular crossarm 848.65 815.75 389.00 607.70 529.04 220C C 3 x 3 x !4 tubular crossarm 139.35 177.47 76.77 96.90 106.02 222A C Connection plate (fastening concept) 13.08 12.48 13.61 20.13 7.13 245E C Bracket hinge 48.CO 85.23 49.63 16.73 54.58 226 C Pull-off arm 49.00 43.43 39.47 18.42 32.76
Total 1,273.94 1,352.38 876.92 939.62 876.26
a A = widely used and manufactured, B = new product developed by cooperative manufacturers, and C = new designs specified.
1400.J------+-----------t------- ------l------
aoo.,.-------+-------------------1----------------~~------"'"" JUNE 81 1982 1983 1984 JULY 84
Total Unit Price (Date)
FIGURE 17 Material price chart.
Bracket Installation
1. The poles and foundations shall be installed before installation of catenary brackets (Figure 18).
2. Install hinges on poles. Tighten bolts using ASTM A325 turn of nut method.
3. Install insulators to crossarms and sag braces.
4. using a hydraulic lift road vehicle or equivalent piece of equipment, lift the crossarms and sag braces, and attach to hinges.
5. Lift the crossarm to a horizontal position, and attach sag brace to crossarm.
6. Adjust the sag brace connection until the crossarm is horizontal (using slotted holes or moving connection plate).
7. If a two-track bracket is being erected, the longest sag brace shall be installed first.
8. Check movement of bracket to ensure hinges and pins do not bind.
9. Using an approved megger instrument, the contractor shall ensure the function of bracket insulators.
10. To prevent possible shall be temporarily guyed.
damage, the bracket A temporary eyebolt, FIGURE 18 Bracket installation.
155
7/84
9.05 14.75 18.10 19.60 22.65 45.84
521.32 103 .86
7.15 49.35 27.57
839.24
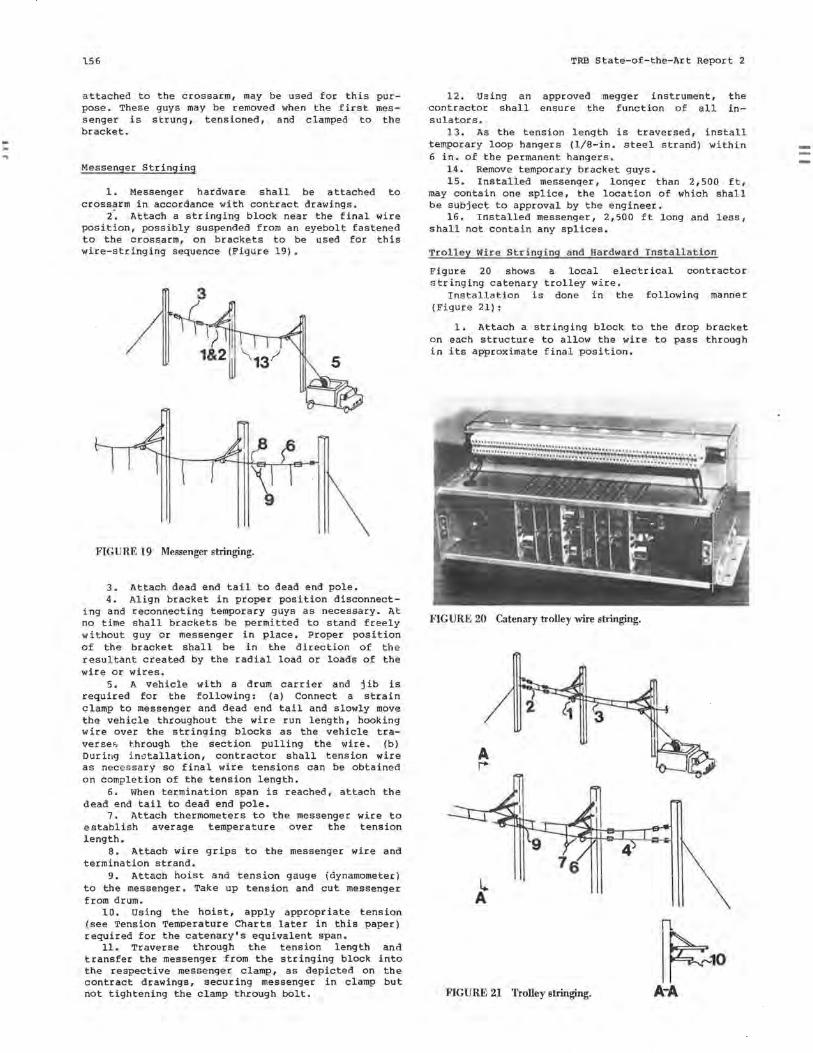
-..
156
attached to the crossarm, may be used for this purpose. These guys may be removed when the first messenger is strung, tensioned, and clamped to the bracket.
Messenger Stringing
1. Messenger hardware shall be attached to crossarm in accordance with contract drawings.
2: Attach a stringing block near the final wire position, possibly suspended from an eyebolt fastened to the crossarm, on brackets to be used for this wire-stringing sequence (Figure 19).
3
FIGURE 19 Messenger stringing.
3. Attach dead end tail to dead end pole. 4. Align bracket in proper position disconnect
ing and reconnecting temporary guys as necessary. At no time shall brackets be permitted to stand freely without guy or messenger in place. Proper position of the bracket shall be in the direction of the resultant created by the radial load or loads of the wire or wires.
5. A vehicle with a drum carrier and jib is required for the following: (a) Connect a strain clamp to messenger and dead end tail and slowly move the vehicle throughout the wire run length, hooking wire over the stringing blocks as the vehicle traverses t-.hrough the section pulling the wire. (b) Durillg in:3tallation, contractor shall tension wire as necessary so final wire tensions can be obtained on completion of the tension length.
6. When termination span is reached, attach the dead end tail to dead end pole.
7. Attach thermometers to the messenger wire to establish average temperature over the tension length.
8. Attach wire grips to the messenger wire and termination strand.
9. Attach hoist and cension gauge (dynamometerj to the messenger. Take up tension and cut messenger from drum.
10. Using the hoist, apply appropriate tension (see Tension Temperature Charts later in this paper) required for the catenary's equivalent span.
11. Traverse through the tension length and transfer the messenger from the stringing block into the respective messenger clamp, as depicted on the contract drawings, securing messenger in clamp but not tightening the clamp through bolt.
TRB State-of-the-Art Report 2
12. Using an contractor shall sulators.
approved megger instrument, ensure the function of all
the in-
13. As the tension length is traversed, install temporary loop hangers (1/8-in. steel strand) within 6 in. of the permanent hangers.
14. Remove temporary bracket guys. 15. Installed messenger, longer than 2,500 ft,
may contain one splice, the location of which shall be subject to approval by the engineer.
16. Installed messenger, 2,500 ft long and less, shall not contain any splices.
Trolley Wire Stringing and Rardward tnstallation
Figure 20 shows a local electrical contractor stringing catenary trolley wire.
Installation is done in the following manner (Figure 21):
1. Attach a stringing block to the drop bracket on each structure to allow the wire to pass through in its approximate final position.
FIGURE 20 Catenary trolley wire stringing.
A ~
k
FIGURE 21 Trolley stringing.
\ n
~10
A-A
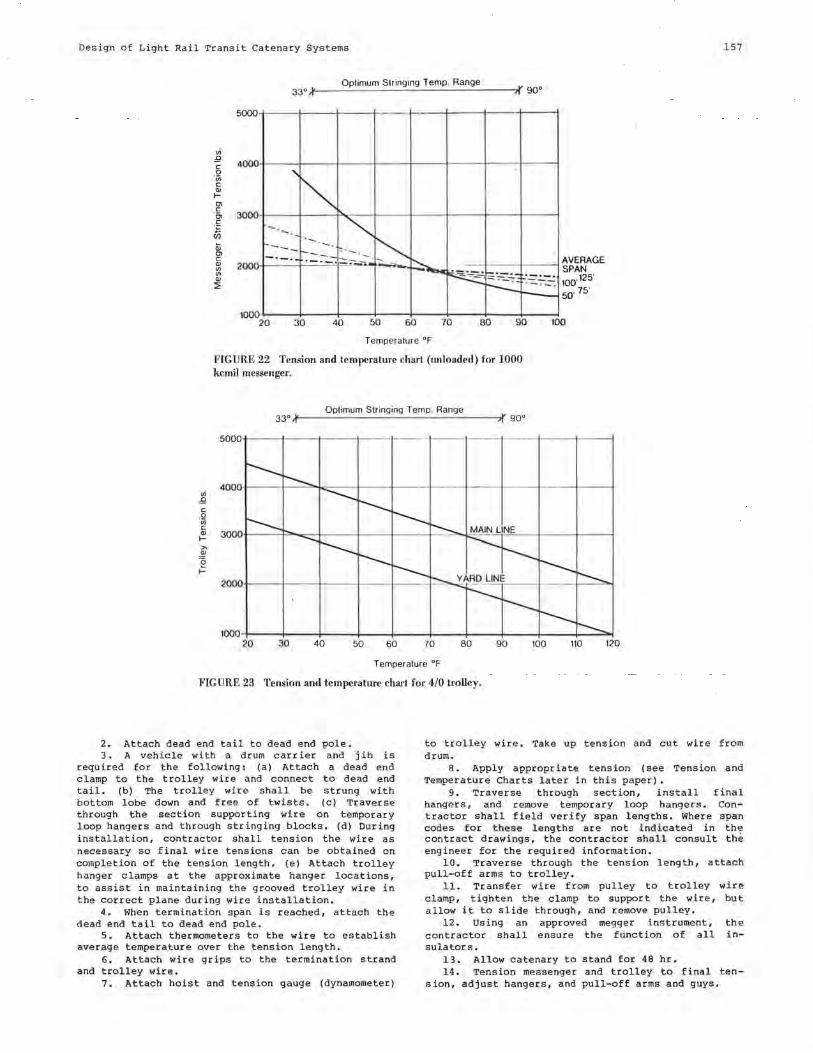
Design of Light Rail Transit Catenary Systems 157
Optimum Stringing Temp. Range 33•..1<--- ----- - -----------;~90°
AVERAGE SPAN 100
.125·
~---' 50' 75'
l0002+0--~3bi----4+0---5t-0--6-i-0--~.,0---8+0--~901-----ltOO
Temperature °F
FIGURE 22 Tension and temperature chart (unloaded) for 1000 kcmil messenger.
Optimum Stringing Temp. Range
5000-t---+---+----+---I·- ----- -------1---1------l
en 4000
fl C 0 'iii C Q) 3000 I->-~ a t
2000
Temperature "F
FIGURE 23 Tension and temperature chart for 4/0 trolley.
2. Attach dead end tail to dead end pole. 3. A vehicle with a drum carrier and jib is
required for the following: (a) Attach a dead end clamp to the trolley wire and connect to dead end tail. (b) The trolley wire shall be strung with bottom lobe down and free of twists. (c) Traverse through the section supporting wire on temporary loop hangers and through stringing blocks. (d) During installation, contractor shall tension the wire as necessary so final wire tensions can be obtained on completion of the tension length. (e) Attach trolley hanger clamps at the approximate hanger locations, to assist in maintaining the grooved trolley wire in the correct plane during wire installation.
4. When termination span is reached, attach the dead end tail to dead end pole.
5. Attach thermometers to the wire to establish average temperature over the tension length.
6. Attach wire grips to the termination strand and trolley wire.
7. Attach hoist and tension gauge (dynamometer)
to trolley wire. Take up tension and cut wire from drum.
8. Apply appropriate tension ( see Tension and Temperature Charts later in this paper).
9. Traverse through section, install final hangers, and remove temporary loop hangers. Contractor shall field verify span lengths. Where span codes for these lengths are not i ndicated in th~ contract drawings, the contractor shall consult the engineer for the required information.
10. Traverse through the tension length, attach pull-off arms to trolley.
11. Transfer wire from pulley to trolley wire clamp, tighten the clamp to support the wire, but allow it to slide through, and remove pulley.
12. Using an approved megger instrument, the contractor shall ensure the function of all insulators.
13. Allow catenary to stand for 48 hr. 14. Tension messenger and trolley to final ten
s ion, adjust hangers, and pull-off arms and guys.
158
15. Tighten messenger and trolley wire clamps after final tensions have been set.
Temperature and Tension Charts
The catenary system installed in Pittsburgh is the variable tension type with fixed dead ends. Therefore tensions vary with the wire's thermal expansion and contraction characteristics and the contractor requires a chart relating tension to temperature. Figures 22 and 23 show charts that were calculated to provide level trolley wire at 60°F. Above 60°F the trolley will sag and below 60°F it will curve upward or hog (unless the system weight is increased due to the formation of ice on the conductors). The temperature and tension charts shown are for both the "main-line" and the "yard" catenary systems used for Pittsburgh.
CONCLUSION
Any transit authority that finds itself in the position that PAT was in before design and construction
TRB State-of-the-Art Report 2
of catenary systems must make a choice. The authority can put time, effort, and money into development of a standardized system that will precisely meet their criteria at the very outset of a project thus ensuring competitive prices, consistency in supply and installation, and future availability of material. Or, an authority can choose the cheapest initial course using available equipment and installation techniques that can easily lead to high material and construction costs. The latter can also lead to an overdependence on limited sourcesi and, should a sole source "dry up" unexpectedly, construction or maintenance, or both, will suffer. The Pittsburgh LRT system is a good argument for the first choice. A standardized catenary system was developed and was made to be easily manufactured and installed. Prices were competitive and equipment was quickly available from any number of sources. In addition, the authority had enough time in the planning stages to modify equipment to suit any requirements specific to the location, and there was sufficient time during the preparation of contract documents to become familiar with the detailed workings of the system. Planning and designing ahead in this manner have benefited the authority on all levels.
Economic Rating and Spacing of LRT Traction Substations Stoil D. Stoilov Parsons Brinckerhoff Quade & Douglas, Inc. Sacramento, California
For propulsion modern light rail vehicles usually use DC power supplied by an external traction electrification system. The traction electrification system (TES) converts available medium-voltage AC power to low-voltage DC power that is then distributed to the trains. A typical TES consists of tract ion power substations connected to an existing utility grid and a DC distribution system. Two major types of DC distribution systems, differentiated by the final element on the power path from the substations to the vehicles, have evolved. They are the overhead contact system and the third rail, each with its own advantages and areas of application.
When a new light rail system is being designed, or an existing one extended, two major objectives become the center of attention:
1. To meet all performance, reliability, and safety er i teria associated with transit operations and
2. To meet technical requirements at a minimum overall system cost.
In a broader sense, these two can be combined into one goal--to design an economically optimum TES under a set of constraints that represent performance, reliability, and safety requirements. This is a broad and far-reaching subject that is beyond the scope of a single paper. In this paper only one aspect of such an economic design objective will be addressed: the selection of substation rating and spacing, which tend to minimize the overall TES cost function.
BASIC CONCEPTS
When the LRT system operating environment becomes known, various TESs could be designed, all of which would meet the set of constraints related to performance, reliability, and safety. The operating environment consists generally of (a) vehicle data, (b) route data, {c) normal and con~ingency operations plan, and (d) reliability and safety requirements refl.ected in the TES configuration, sectionalizing, and protective relaying scheme .
The first step toward minimizing the TES cost function is the selection of the type of all major TES components: type of substations, type of poles, type of overhead contact system (OCS), and so forth. These decisions, however, are often dictated by en-
vironmental rather than economical considerations or represent a compromise between the two.
The second step toward minimizing the TES capital cost is the selection of the three major system parameters: substation rating, substation spacing, and line feeder size. For the purpose of this paper, the line feeder will be regarded as consisting of the contact wire or third rail plus any parallel reinforcing £eeders such as messenger wires or underground insulated cables. Each of these three major system parameters not only affects total system cost but is also related to the other two. Their combination should render a technically sound and feasible solution, and such solutions are numerous. The traction power system load requirements, for example, could be met by using smaller substations spaced closer together and lightweight conductors or by using larger substations, spaced farther apart, in conjunction with heavier conductors.
Finding a feasible TES solution is a complex problem. The load of a typical traction power substation is highly irregular and intermittent. Random factors, such as fluctuations in headways, station dwell times, and passenger load, are also inherent in the system operations. Determination of the substation and feeder load involves consideration of a variety of factors such as vehicle propulsion system data, train size, headways, stop spacing, route horizontal profile, and vertical alignment. Practically the only way to obtain accurate results is through computer simulations using computer programs specially developed for this purpose. Because the technical aspects of TES design are not within the scope of this paper, they will not be dealt with in detail. Emphasis will be placed instead on the economic principles and relationships that can help in selecting TES parameters that result in economic design.
BASE COST FUNCTIONS
The acceptable ranges of the traction power substation rating and the line feeder size can be determined on the basis of technical feasibility, environmental or practical considerations, or a combination thereof. The unit costs of all feeder sizes and substation ratings can also be estimated and can be used to obtain corresponding curves, called base cost functions. They should include the total direct and indirect associated cost, materials, and labor.
159
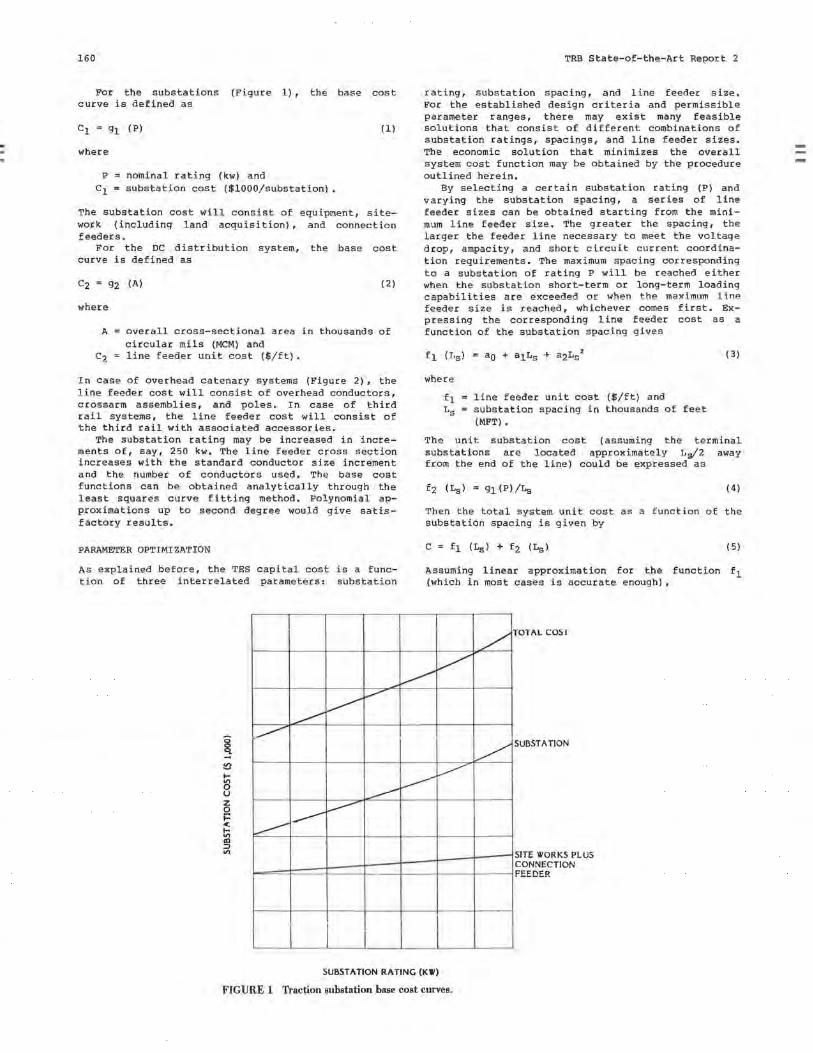
160
For the substations (Figure 1), the base cost curve is defined as
(1)
where
P nominal rating (kw) and c1 substation cost ($1000/substation),
The substation cost will consist of equipment, sitework (including land acquisition), and connection feeders.
For the DC distribution system, the base cost curve is defined as
(2)
where
A overall cross-sectional area in thousands of circular mils (MCM) and
c2 line feeder unit cost ($/ft).
In case of overhead catenary systems (Figure 2), the line feeder cost will consist of overhead conductors, crossarm assemblies, and poles. In case of third rail systems, the line feeder cost will consist of the third rail with associated accessories.
The substation rating may be increased in increments of, say, 250 kw. The line feeder cross section increases with the standard conductor size increment and the number of conductors used. The base cost functions can be obtained analytically through the least squares curve fitting method. Polynomial approximations up to second degree would give satisfactory results.
PARAMETER OPTIMIZATION
As explained before, the TES capital cost is a function of three interrelated parameters: substation
i -~ ... lS u z 0 i= < ... "' IQ ::I "'
------
L.---
.,,----~ ~
---I _ _..-l.--'"'
TRB State-of-the-Art Report 2
rating, substation spacing, and line feeder size. For the established design criteria and permissible parameter ranges, there may exist many feasible solutions that consist of different combinations of substation ratings, spacings, and line feeder sizes. The economic solution that minimizes the overall system cost function may be obtained by the procedure outlined herein.
By selecting a certain substation rating (P) and varying the substation spacing, a series of line feeder sizes can be obtained starting from the minimum line feeder size. The greater the spacing, the larger the feeder line necessary to meet the voltage drop, ampacity, and short circuit current coordination requirements. The maximum spacing corresponding to a substation of rating P will be reached either when the substation short-term or long-term loading capabilities are exceeded or when the maximum line feeder size is reached, whichever comes first. Expressing the corresponding line feeder cost as a function of the substation spacing gives
where
line feeder unit cost ($/ft) and substation spacing in thousands of feet (MFT).
(3)
The unit substation cost (assuming the terminal substations are located approximately Ls/2 away from the end of the line) could be expressed as
(4)
Then the total system unit cost as a function of the substation spacing is given by
(5)
Assuming linear approximation for the function f 1 (which in most cases is accurate enough),
/
~ /
/ ~ ~
TOTAL CO:ST
SUBSTATION
SITE WORKS PLUS CONNECTION FEEDER
SUBSTATION RATING (KW)
FIGURE 1 Traction substation base cost curves.
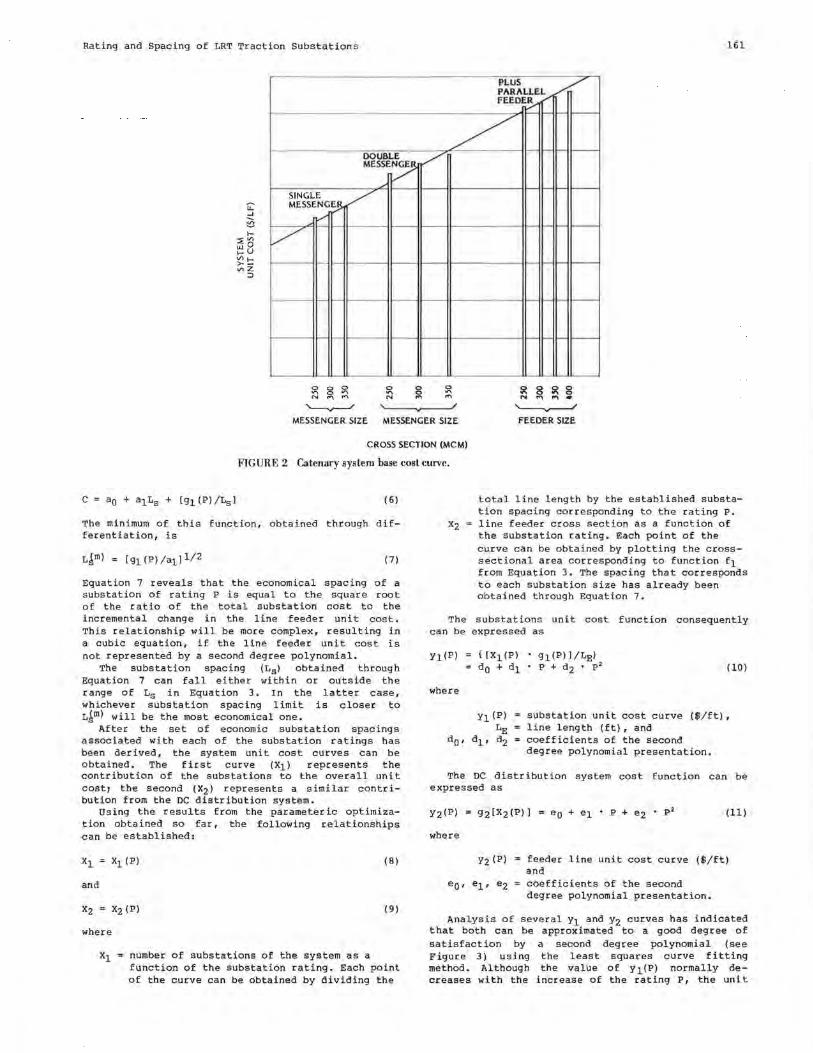
Rating and Spacing of LRT Traction Substations 161
PLUS / PARALLEL / FEEDE~ /
-
/ ,__ -DOUBLE / MESSE/
J ,__ -SINGLE / MESSENC';fS
/ -/
- ,- - -- ,- - -- I- - - ,_ -
~ MESSENGER SIZE MESSENGER SIZE
~ FEEDER SIZE
CROSS SECTION (MCM)
FIGURE 2 Catenary system base cost curve.
(6)
The minimum of this function, obtained through differentiation, is
(7)
Equation 7 reveals that the economical spacing of a substation of rating P is equal to the square root of the ratio of the total substation cost to the incremental change in the line feeder unit cost. This relationship will be more complex, resulting in a cubic equation, if the line feeder unit cost is not represented by a second degree polynomial.
The substation spacing (Lsl obtained through Equation 7 can fall either within or outside the range of Ls in Equation 3. In the latter case, whichever substation spacing limit is closer to L~m) will be the most economical one.
After the set of economic substation spacings associated with each of the substation ratings has been derived, the system unit cost curves can be obtained. The first curve (X1) represents the contribution of the substations to the overall unit cost; the second (X2 ) represents a similar contribution from the DC distribution system.
Using the results from the parameteric optimization obtained so far, the following relationships can be established:
(8)
and
(9)
where
x1 = number of substations of the system as a function of the substation rating. Each point of the curve can be obtained by dividing the
total line length by the established substation spacing corresponding to the rating P. line feeder cross section as a function of the substation rating. Each point of the curve can be obtained by plotting the crosssectional area corresponding to function f 1 from Equation 3. The spacing that corresponds to each substation size has already been obtained through Equation 7.
The substations unit cost function consequently can be expressed as
Y1(P)
where
g1(P) ]/LE} p + d2. p2 (10)
substation unit cost curve ($/ft), line length (ft), and coefficients of the second degree polynomial presentation.
The DC distribution system cost function can be expressed as
where
Y2 (P)
(11)
feeder line unit cost curve ($/ft) and coefficients of the second degree polynomial presentation.
Analysis of several y1 and y2 curves has indicated that both can be approximated to a good degree of satisfaction by a second degree polynomial (see Figure 3) using the least squares curve fitting method. Although the value of Y1(P) normally decreases with the increase of the rating P, the unit
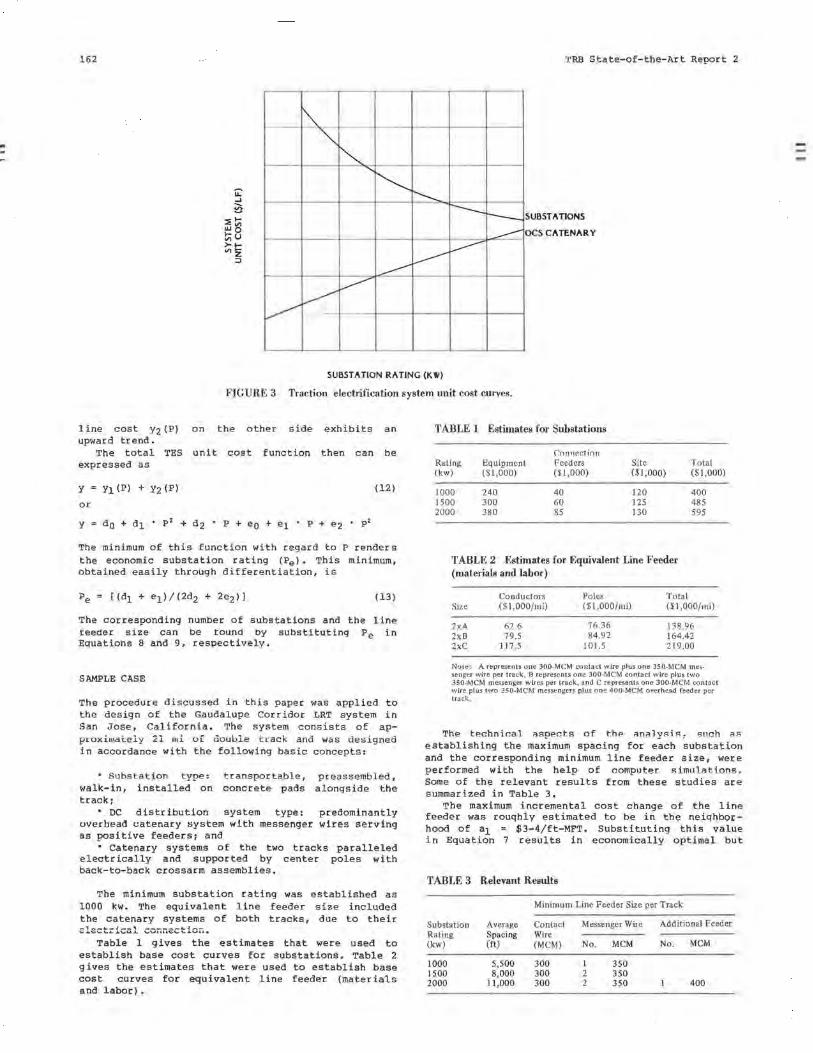
162
~ ~ ~
~ ~
~
--~ ...__ ~
l---"" ~
---:---
---
l 'RB State-of-the-Art Report 2
SUBSTATIONS
OCS CATENARY
SUBSTATION RATING (KW)
FIGURE 3 Traction electrification system unit cost curves.
line cost Y2(P) on the other side exhibits an upward trend.
The total TES unit cost function then can be expressed as
(12)
or
The minimum of this function with regard to P renders the economic substation rating (Pel. This minimum, obtained easily through differentiation, is
(13)
The corresponding number of substations and the line f eeder s i ze can be tound by substituting Pe in Equations 8 and 9, respectively .
SAMPLE CASE
The procedure discussed in this paper was applied to the design of the Gaudalupe Corridor LRT system in San Jose, California. The system consists of approxi111ately 21 1ni of double trac k and was designed in accordance with the following basic concepts:
• Substation type : transportable, walk-in, installed on concrete pads track:
preassembl ed, alongside the
• DC distribution system type: predominantly overhead catenary system with messenger wires serving as positive feeders: and
• Catenary systems of the two tracks paralleled electrically and supported by center poles with back-to-back crossarm assemblies.
The minimum substation rating was established as 1000 kw. The equivalent line feeder size included the catenary systems of both tracks, due to their _, __ ~_J __ , ------~~-,;;;c J.. C. 1..,,1...&.L\.,,c.1...A. v, ... nu,<1:a ... 11....Lv,,.
Table l gives the estimates that were used to establish base cost curves for substations. Table 2 gives the estimates that were used to establish base cost curves for equivalent line feeder (materials and labor).
TABLE 1 Estimates for Substations
r.onnr.r.tinn Rating Equipment Feeders Site Total (kw) ($1,000) ($1,000) ($1,000) ($1 ,000)
1000 240 40 120 400 1500 300 60 125 485 2000 380 85 130 595
TABLE 2 Estimates for Equivalent Line Feeder (materials and labor)
Conductors Poles Total Size ($1,000/mi) ($1 ,000/mi) ($1 ,000/mi)
2xA 62.15 76 .36 !38 .% 2xB 79.5 84.92 164.42 2xC 117 .5 101.5 219.00
Note: A represents one 300-MCM contact wire plus one 350-MCM messenger wire per track, B represents one 300-MCM contact wire plus two 350-MCM messenger wires per track, and C represents one 300-MCM contact wire plus two 350-MCM messengers plus o ne 400-MCM o,•erhead reeder per track.
The technical ;aspec t s of t .he ;an,.lysis , 81JCh a ,; establishing the maximum spacing for each substation and the corresponding minimum line feeder size, were performed with the help of computer s i mulations. Some of the relevant results from these studies are summarized in Table 3.
The maximum incremental cost change of the line feeder was rouqhly estimated to be in the neiqhborhood of a1 $3-4/ft-MFT. Substituting this value in Equation 7 results in economically optimal but
TABLE 3 Relevant Results
Minimum Line Feeder Size per Track
Substation Average Contact Messenger Wire Additional Feeder Rating Spacing Wire (kw) (ft) (MCM) No. MCM No. MCM
1000 5,500 300 1 350 1500 8,000 300 2 350 2000 11,000 300 2 350 400
Rating and Spacing of LRT Traction Substations
unconstrained substation spacing. It happens to be higher than the maximum permissible spacing obtained on the basis of technical requirements such as RMS and peak loads, ampacity, and voltage level constraints. For the 1000-kw substation, for example,
{[g2(P)]/a1}1/2 { [425 ($1000)]/[4 ($/ft-MFT)]}l/2 10.3 MFT
In view of the load pattern, the 1000-kw substations cannot be spaced at such a distance, almost 2 mi, without overloading. Therefore the technically permissible spacing takes precedence over the economically ideal one.
The curves represented by Equations 8 and 9 need not be in analytical form. A table of discrete values related to the substation ratings (P) would be sufficient. Using the substation spacings and equivalent line feeder sizes obtained previously, these two functions can be expressed in tabular form:
P (kw)
1000 1500 2000
x1 (no.)
20 14 10
X2 (MCM)
1500 2000 2800
Finally, the TES unit cost curves can be obtained through Equations 10 tabluar form these are
(Y1 and
and 11.
P (kw)
Tcicio 1500 2000
Y1 ($/lft)
72. 73 61. 72 54.10
Y2 ($/lft)
26 .3 2 34.14 41. 48
The total line length is approximately ~ 110 MFT, including a 1 1/2-mi branch off the main route.
The analytical expressions of these two functions, obtained through the least squares approximation method, are
Y1 = 104.922 - 0.03897P + 6.87 x 10- 6 P2,
dollars per linear foot.
and
Y2 33.24 - 0.01796P + 11.04 x 10- 6 P 2
dollars per linear foot.
Equation 13 will lend the economic substation rating. Substituting, the following is obtained:
Pe -{(-0.03897 - 0.01796)/[2(6.871 X 10- 6
+ 11.04 X 10- 6)]} = 1589 kw
163
The closest substation rating, using 250-kw increments is 1500 kw. To assess the sensitivity of the solution, the system unit cost function (Equation 12) is calculated for all substation ratings of the 1000- to 2000-kw range. The results are as follows:
CONCLUSIONS
P (kw) 1000 1250 1500 1750 2000
y ($/lft) 99. 0 5 94.98 92.85 93.38 95.58
Conflicting views have been expressed with regard to the selection of traction power substation rating and spacing. On one side there is the view that the substations should be frequently spaced and as small as possible, each substation just large enough to withstand its share of the current of two accelerating trains in the vicinity. There are also proponents of the opposing view, that traction power substations should be as large and spaced as far apart as allowed by the line feeder size, technical feasibility, or practicality or by some other considerations of a technical nature such as excessive track potentials. However, neither of these approaches ensures minimum overall system cost.
The method presented herein is an attempt to develop a systematic and analytical procedure for finding a combination of TES parameters that results in the least expensive technically acceptable system. It requires somewhat greater engineering effort in the design stage, but the reward can be a significant reduction of the traction electrification system capital cost. In the sample case, there is $6.2/lft differential between the maximum and the minimum values of the unit cost function. This is equivalent to $682,000 or approximately 8 percent of the actual procurement cost.
More experience with TESs that have various load patterns and with different components of cost structure is needed, however, before generalized assessments of the magnitude of potential savings can be made.
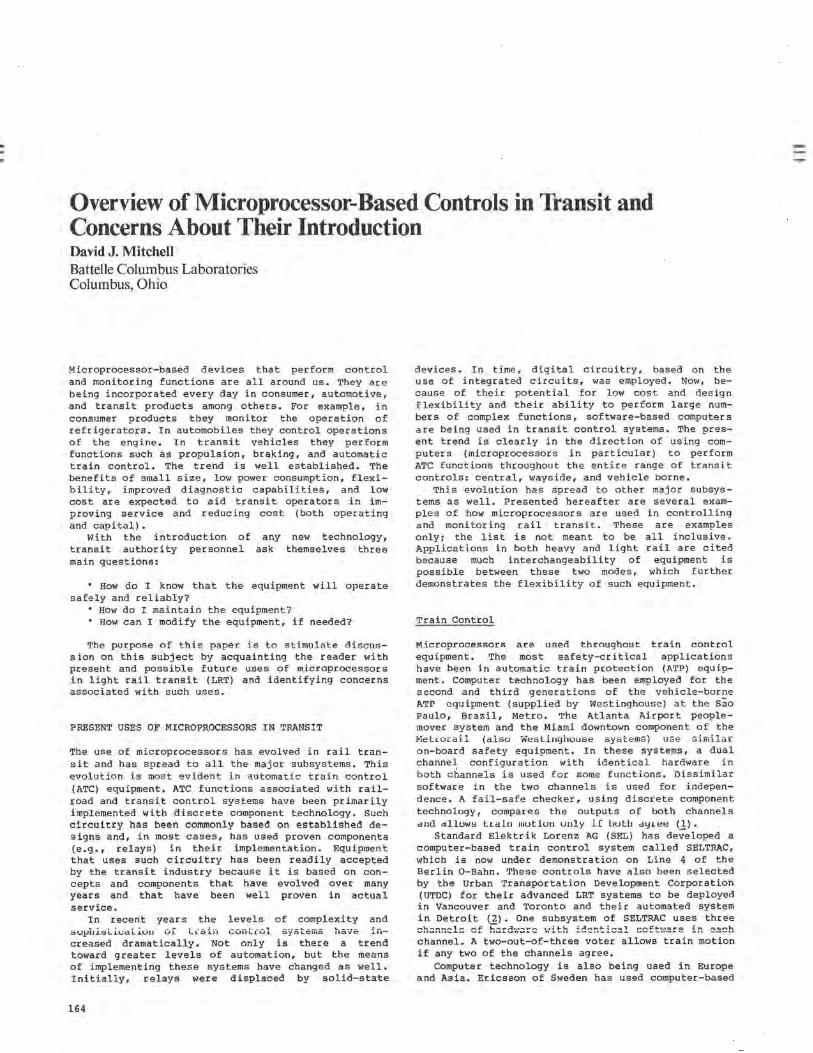
Overview of Microprocessor-Based Controls in Transit and Concerns About Their Introduction David J. Mitchell Battelle Columbus Laboratories Columbus, Ohio
Microprocessor-based devices that perform control and monitoring functions are all around us. They are being incorporated every day in consumer, automotive, and transit products among others. For example, in consumer products they monitor the operation of refrigerators. In automobiles they control operations of the engine. In transit vehicles they perform functions such as propulsion, braking, and automatic train control. The trend is well established. The benefits of small size, low power consumption, flexibility, improved diagnostic capabilities, and low cost are expected to aid transit operators in improving service and reducing cost (both operating and capital).
With the introduction of any new technology, transit authority personnel ask themselves three main questions:
• How do I know that the equipment will operate safely and reliably?
• How do I maintain the equipment? • How can I modify the equipment, if needed?
The purpose of this paper is to stimulate discussion on this subject by acquainting the reader with present and possible future uses of microprocessors in light rail transit (LRT) and identifying concerns associated with such uses.
PRESENT USES OF MICROPROCESSORS IN TRANSIT
The use of microprocessors has evolved in rail transit and has spread to all the major subsystems. This evolution is most evident in automatic train control (ATC) equipment. ATC functions associated with railroad and transit control systems have been primarily implemented with discrete component technology. Such circuitry has been commonly based on established designs and, in most cases, has used proven components (e.g., relays) in their implementation. Equipment that uses such circuitry has been readily accepted by the transit industry because it is based on concepts and components that have evolved over many years and that have been well proven in actual service.
In recent years the levels of complexity and ::SU!,)i1i::s~il.:ctL.iou or Li:aif1 \.,;Ull'-1.U.1. syotcms ua.vc iii
creased dramatically. Not only is there a trend toward greater levels of automation, but the means of implementing these systems have changed as well. Initially, relays were displaced by solid-state
164
devices. In time, digital circuitry, based on the use of integrated circuits, was employed. Now, because of their potential for low cost and design flexibility and their ability to perform large numbers of complex functions, software-based computers are being used in transit control systems. The present trend is clearly in the direction of using computers (microprocessors in particular) to perform ATC functions throughout the entire range of transit controls: central, wayside, and vehicle borne.
This evolution has spread to other major subsystems as well. Presented hereafter are several examples of how microprocessors are used in controlling and monitoring rail transit. These are examples only; the list is not meant to be all inclusive. Applications in both heavy and light rail are cited because much interchangeability of equipment is possible between these two modes, which further demonstrates the flexibility of such equipment.
Train Control
Mi croprocessor s are used throughout train control equipment. The most safety-critical applications have been in automatic train protection (ATP) equipment. Computer technology has been employed for the second and third generations of the vehicle-borne ATP equipment (supplied by Westinghouse) at the Sao Paulo, Brazil, Metro. The Atlanta Airport peoplemover system and the Miami downtown component of the Met.1.orail (also Westinghouse systems) use similar on-board safety equipment. In these systems, a dual channel configuration with identical hardware in both channels is used for some functions. Dissimilar software in the two channels is used for independence. A fail-safe checker, using discrete component technology, compares the outputs of both channels dll<l dlluw8 tt:alu mutlun uuly 1( uuth dYH!t! ( 1).
Standard Elektrik Lorenz AG (SEL) has de;;-eloped a computer-based train control system called SELTRAC, which is now under demonstration on Line 4 of the Berlin 0-Bahn. These controls have also been selected by the Urban Transportation Development Corporation (UTDC) for their advanced LRT systems to be deployed in Vancouver and Toronto and their automated system in Detroit (2). One subsystem of SELTRAC uses three .... ,-. ...... r .... , ... ,,..~ i:"' ...... .-:1 ......... ,.., ... .: ... ,.. .:.:1 .......... .: ..... .,,,, .......... ~ ...... .,,, .. o .:n ,...,..,,, ..... h
channel. A two-out-of-three voter allows train motion if any two of the channels agree.
Computer technology is also being used in Europe and Asia. Ericsson of Sweden has used computer-based
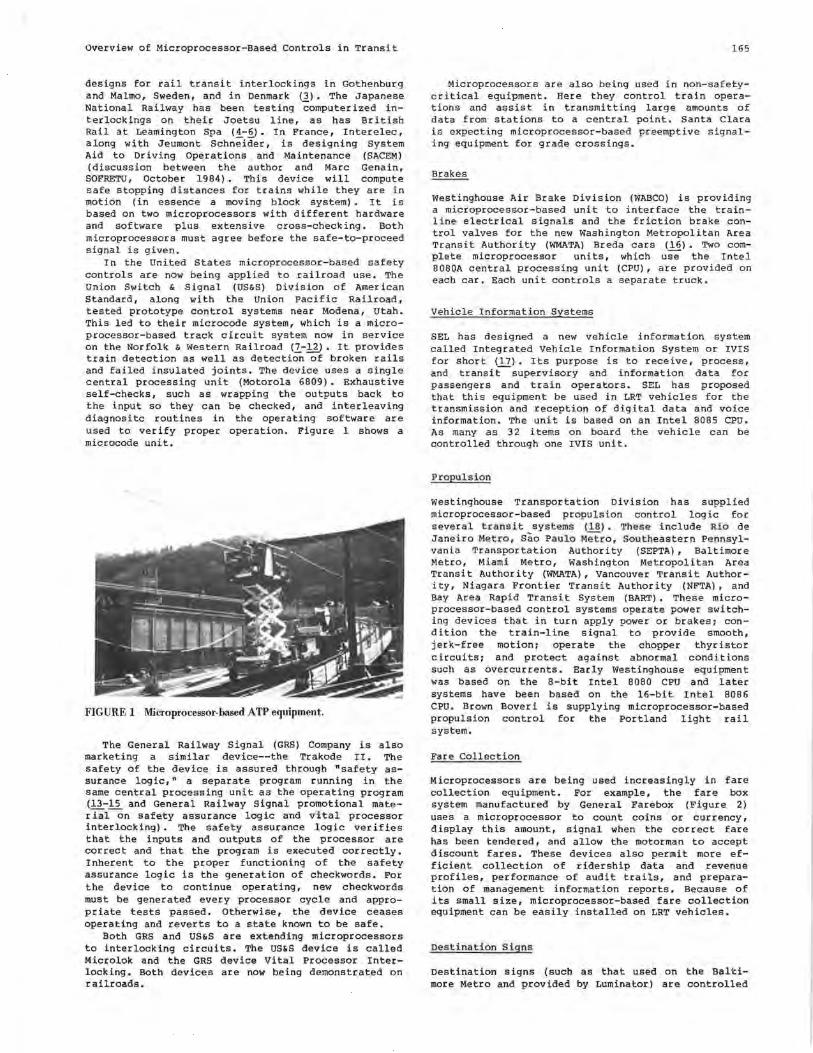
Overview of Microprocessor-Based Controls in Transit
designs for rail transit interlockings in Gothenburg and Malmo, Sweden, and in Denmark (3). The Japanese National Railway has been testing -;ornputer ized inter lockings on their Joetsu line, as has British Rail at Leamington Spa ( 4-6) • In France, Interelec, along with Jeurnont Schn;ider, is designing System Aid to Driving Operations and Maintenance (SACEM) (discussion between the author and Marc Genain, SOFRETU, October 1984). This device will compute safe stopping distances for trains while they are in motion (in essence a moving block system). It is based on two microprocessors with different hardware and software plus extensive cross-checking. Both microprocessors must agree before the safe-to-proceed signal is given.
In the United States microprocessor-based safety controls are now being applied to railroad use. The Union Switch & Signal (US&S) Division of Arner ican Standard, along with the Union Pacific Railroad, tested prototype control systems near Modena, Utah. This led to their microcode system, which is a microprocessor-based track circuit system now in service on the Norfolk & Western Railroad (2.-~. It provides train detection as well as detection of broken rails and failed insulated joints. The device uses a single central processing unit (Motorola 6809). Exhaustive self-checks, such as wrapping the outputs back to the input so they can be checked, and interleaving diagnositc routines in the operating software are used to verify proper operation. Figure 1 shows a microcode unit.
FIGURE 1 Microprocessor-based ATP equipment.
The General Railway Signal (GRS) Company is also marketing a similar device--the Trakode II. The safety of the device is assured through "safety assurance logic," a separate program running in the same central processing unit as the operating program (13-15 and General Railway Signal promotional mater ialon safety assurance logic and vital processor interlocking). The safety assurance logic verifies that the inputs and outputs of the processor are correct and that the program is executed correctly. Inherent to the proper functioning of the safety assurance logic is the generation of checkwords. For the device to continue operating, new checkwords must be generated every processor cycle and appropriate tests passed. Otherwise, the device ceases operating and reverts to a state known to be safe.
Both GRS and US&S are extending microprocessors to interlocking circuits. The US&S device is called Microlok and the GRS device Vital Processor Interlocking. Both devices are now being demonstrated on railroads.
165
Microprocessors are also being used in non-safetycritical equipment. Here they control train operations and assist in transrni tting large amounts of data from stations to a central point. Santa Clara is expecting microprocessor-based preemptive signaling equipment for grade crossings.
Brakes
Westinghouse Air Brake Division (WABCO) is providing a microprocessor-based unit to interface the trainline electrical signals and the friction brake control valves for the new Washington Metropolitan Area Transit Authority (WMATA) Breda cars (16). Two complete microprocessor units, which use the Intel 8080A central processing unit (CPU), are provided on each car. Each unit controls a separate truck.
Vehicle Information Systems
SEL has designed a new vehicle information system called Integrated Vehicle Information System or !VIS for short (17). Its purpose is to receive, process, and transi~supervisory and information data for passengers and train operators. SEL has proposed that this equipment be used in LRT vehicles for the transmission and reception of digital data and voice information. The unit is based on an Intel 8085 CPU. As many as 32 i terns on board the vehicle can be controlled through one !VIS unit.
Propulsio n
Westinghouse Transportation Division has supplied microprocessor-based propulsion control logic for several trans it sys tems (18) . These include Rio de Janeiro Metro, Sao Paulo Metro, So u theastern Penns ylvania Transportation Authority (SEPTA), Baltimore Metro, Miami Metro, Washington Metropolitan Area Transit Authority (WMATA), Vancouver Transit Authority, Niagara Frontier Transit Authority (NFTA), and Bay Area Rapid Transit System (BART) • These microprocessor-based control systems operate power switching devices that in turn apply power or brakes: condition the train-line signal to provide smooth, jerk-free motion, operate the chopper thyristor circuits: and protect against abnormal conditions such as overcurrents. Early Westinghouse equipment was based on the 8-bi t Intel 8080 CPU and later systems have been based on the 16-bit Intel 8086 CPU. Brown Boveri is supplying microprocessor-based propulsion control for the Portland light rail system.
Fare Collection
Microprocessors are being used increasingly in fare collection equipment. For example, the fare box system manufactured by General Farebox (Figure 2) uses a microprocessor to count coins or currency, display this amount, signal when the correct fare has been tendered, and allow the motorman to accept discount fares. These devices also perrni t more efficient collection of ridership data and revenue profiles, performance of audit trails, and preparation of management information reports. Because of its small size, microprocessor-based fare collection equipment can be easily installed on LRT vehicles.
Destina tion S i gns
Destination signs (such as that used on the Baltimore Metro and provided by Lurninator) are controlled
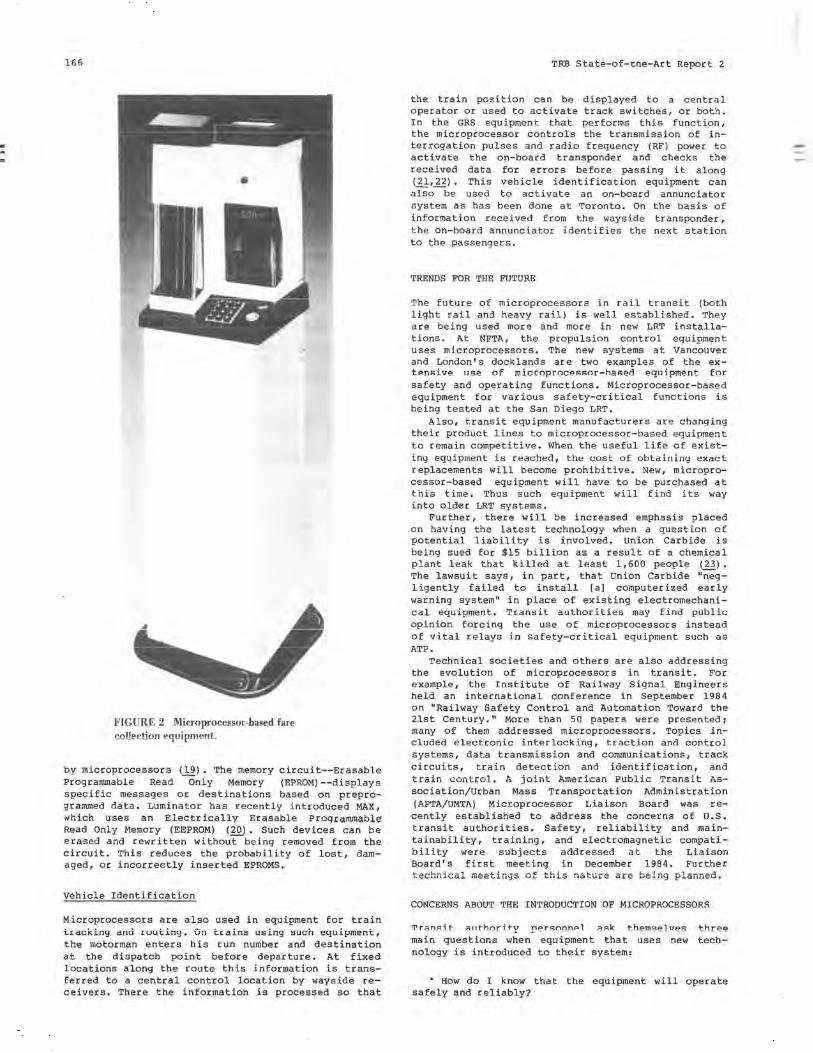
166
FIGURE 2 Microprocessor-based fare 1>nll,:1.,-t-inn P'In-ipm,=,,nt.
by microprocessors (19). The memory circuit--Erasable Programmable Read Only Memory (EPROM) --displays specific messages or destinations based on preprogrammed data. Luminator has recently introduced MAX, which uses an Electrically Erasable Programmable Read Only Memory (EEPROM) (20). Such devices can be erased and rewritten withou~being removed from the circuit. This reduces the probability of lost, damaged, or incorrectly inserted EPROMS.
Vehicle Identification
Microprocessors are also used in equipment for train tracking anci r:uuting. On trains using such equipment, the motorman enters his run number and destination at the dispatch point before departure. At fixed locations along the route this information is transferred to a central control location by wayside receivers. There the information is processed so that
TRB State-of-tne-Art Report 2
the train position can be displayed to a central operator or used to activate track switches, or both. In the GRS equipment that performs this function, the microprocessor controls the transmission of interrogation pulses and radio frequency (RF) power to activate the on-board transponder and checks the received data for errors before passing it along (l1:,El. This vehicle identification equipment can also be used to activate an on-board annunciator system as has been done at Toronto. On the basis of information received from the wayside transponder, the on-board annunciator identifies the next station to the passengers.
TRENDS FOR THE FUTURE
The future of microprocessors in rail transit (both light rail and heavy rail) is well established. They are being used more and more in new LRT installations. At NFTA, the propulsion control equipment uses microprocessors. The new systems at Vancouver and London's docklands are two examples of the extensive use of microprocessor-haRed equipment for safety and operating functions. Microprocessor-based equipment for various safety-critical functions is being tested at the San Diego LRT.
Also, transit equipment manufacturers are changing their product lines to microprocessor-based equipment to remain competitive. When the useful life of existing equipment is reached, the cost of obtaining exact replacements will become prohibitive. New, microprocessor-based equipment will have to be purchased at this time. Thus such equipment will find its way into older LRT systems.
Further, there will be increased emphasis placed on having the latest technology when a question of potential liability is involved. Union Carbide is being sued for $15 billion as a result of a chemical plant leak that killed at least 1,600 people (23). The lawsuit says, in part, that Union Carbide "neg-1 igently failed to install [ a) computerized early warning system" in place of existing electromechanical equipment. Transit authorities may find public opinion forcing the use of microprocessors instead of vital relays in safety-critical equipment such as ATP.
Technical societies and others are also addressing the evolution of microprocessors in transit. For example, the Institute of Railway Signal Engineers held an international conference in September 1984 on "Railway Safety Control and Automation Toward the 21st Century." More than 50 papers were presented i many of them addressed microprocessors. Topics included electronic interlocking, traction and control systems, data transmission and communications, track circuits, train detection and identification, and train control. A joint American Public Transit Association/Urban Mass Transportation Administration (APTA/UMTA) Microprocessor Liaison Board was recently established to address the concerns of u.s. transit authorities. Safety, reliability and maintainability, training, and electromagnetic compatibility were subjects addressed at the Liaison Board's first meeting in December 1984. Further ~--~-!--, ---~~--- -~ ~~!- --~---- --- ~-!-- _, ____ ~ \..l::'\,.;.LUl.L\,.,Q.J.. IIICC'-.1.Uy.::i VJ. LU.LO IIOLU1.C a1.c LIC.J..Jl'j p.1.a1111cu.
CONCERNS ABOUT THE INTRODUCTION OF MICROPROCESSORS
rrrrtnAi_t ~1-1thori_ty p~r~on!'"'Pl rtAk themselves three main questions when equipment that uses new technology is introduced to their system:
• How do I know that the equipment will operate safely and reliably?
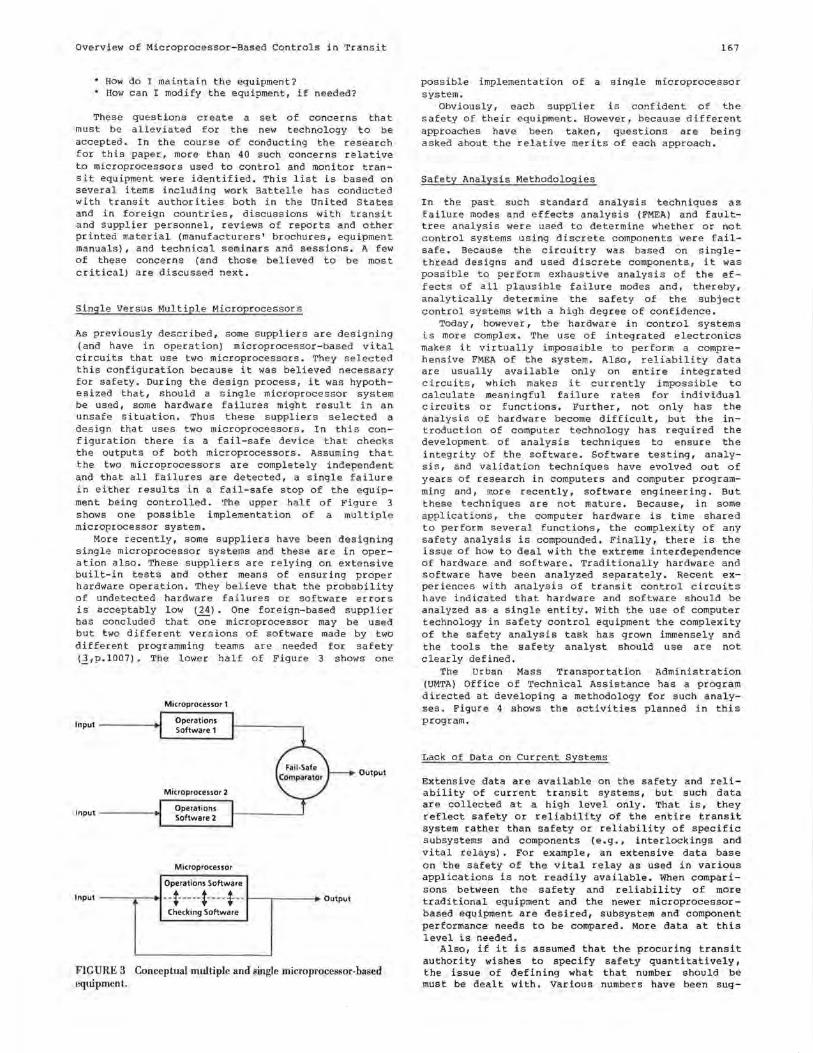
Overview of Microprocessor-Based Controls in Transit
How do I maintain the equipment? How can I modify the equipment, if needed?
These questions create a set of concerns that must be alleviated for the new technology to be accepted. In the course of conducting the research for this paper, more than 40 such concerns relative to microprocessors used to control and monitor transit equipment were identified. This list is based on several items including work Battelle has conducted with transit authorities both in the United States and in foreign countries, discussions with transit and supplier personnel, reviews of reports and other printed material (manufacturers' brochures, equipment manuals), and technical seminars and sessions. A few of these concerns (and those believed to be most critical) are discussed next.
Single Versus Multiple Microprocessors
As previously described, some suppliers are designing ( and have in operation) microprocessor-based vital circuits that use two microprocessors. They selected this configuration because it was believed necessary for safety. During the design process, it was hypothesized that, should a single microprocessor system be used, some hardware failures might result in an unsafe situation. Thus these suppliers selected a design that uses two microprocessors. In this configuration there is a fail-safe device that checks the outputs of both microprocessors. Assuming that the two microprocessors are completely independent and that all failures are detected, a single failure in either results in a fail-safe stop of the equipment being controlled. The upper half of Figure 3 shows one possible implementation of a multiple microprocessor system.
More recently, some suppliers have been designing single microprocessor systems and these are in operation also. These suppliers are relying on extensive built-in tests and other means of ensuring proper hardware operation. They believe that the probability of undetected hardware failures or software errors is acceptably low (24). One foreign-based supplier has concluded that one microprocessor may be used but two different versions of software made by two different programming teams are needed for safety (_l,p.1007). The lower half of Figure 3 shows one
Microprocessor 1
Input Operations Software 1
Output
Microprocessor 2
Input Operations Software 2
Microprocessor
Operations Software
Input --t----+--t--- Output
Checking Software
FIGURE 3 Conceptual multiple and single microprocessor-based equipment_
167
possible implementation of a single microprocessor system.
Obviously, each supplier is confident of the safety of their equipment. However, because different approaches have been taken, questions are being asked about the relative merits of each approach.
Safety Analysis Methodologies
In the past such standard analysis techniques as failure modes and effects analysis (FMEA) and faulttree analysis were used to determine whether or not control systems using discrete components were failsafe. Because the circuitry was based on singlethread designs and used discrete components, it was possible to perform exhaustive analysis of the effects of all plausible failure modes and, thereby, analytically determine the safety of the subject control systems with a high degree of confidence.
Today, however, the hardware in control systems is more complex. The use of integrated electronics makes it virtually impossible to perform a comprehensive FMEA of the system. Also, reliability data are usually available only on entire integrated circuits, which makes it currently impossible to calculate meaningful failure rates for individual circuits or functions. Further, not only has the analysis of hardware become difficult, but the introduction of computer technology has required the development of analysis techniques to ensure the integrity of the software. Software testing, analysis, and validation techniques have evolved out of years of research in computers and computer programming and, more recently, software engineering. But these techniques are not mature. Because, in some applications, the computer hardware is time shared to perform several functions, the complexity of any safety analysis is compounded. Finally, there is the issue of how to deal with the extreme interdependence of hardware and software. Traditionally hardware and software have been analyzed separately. Recent experiences with analysis of transit control circuits have indicated that hardware and software should be analyzed as a single entity. With the use of computer technology in safety control equipment the complexity of the safety analysis task has grown immensely and the tools the safety analyst should use are not clearly defined.
The Urban Mass Transportation Administration (UMTA) Office of Technical Assistance has a program directed at developing a methodology for such analyses. Figure 4 shows the activities planned in this program.
Lack of Data on Current Systems
Extensive data are available on the safety and reliability of current transit systems, but such data are collected at a high level only. That is, they reflect safety or reliability of the entire transit system rather than safety or reliability of specific subsystems and components (e.g., interlockings and vital relays). For example, an extensive data base on the safety of the vital relay as used in various applications is not readily available. When comparisons between the safety and reliability of more traditional equipment and the newer microprocessorbased equipment are desired, subsystem and component performance needs to be compared. More data at this level is needed.
Also, if it is assumed that the procuring transit authority wishes to specify safety quantitatively, the issue of defining what that number should be must be dealt with. Various numbers have been sug-
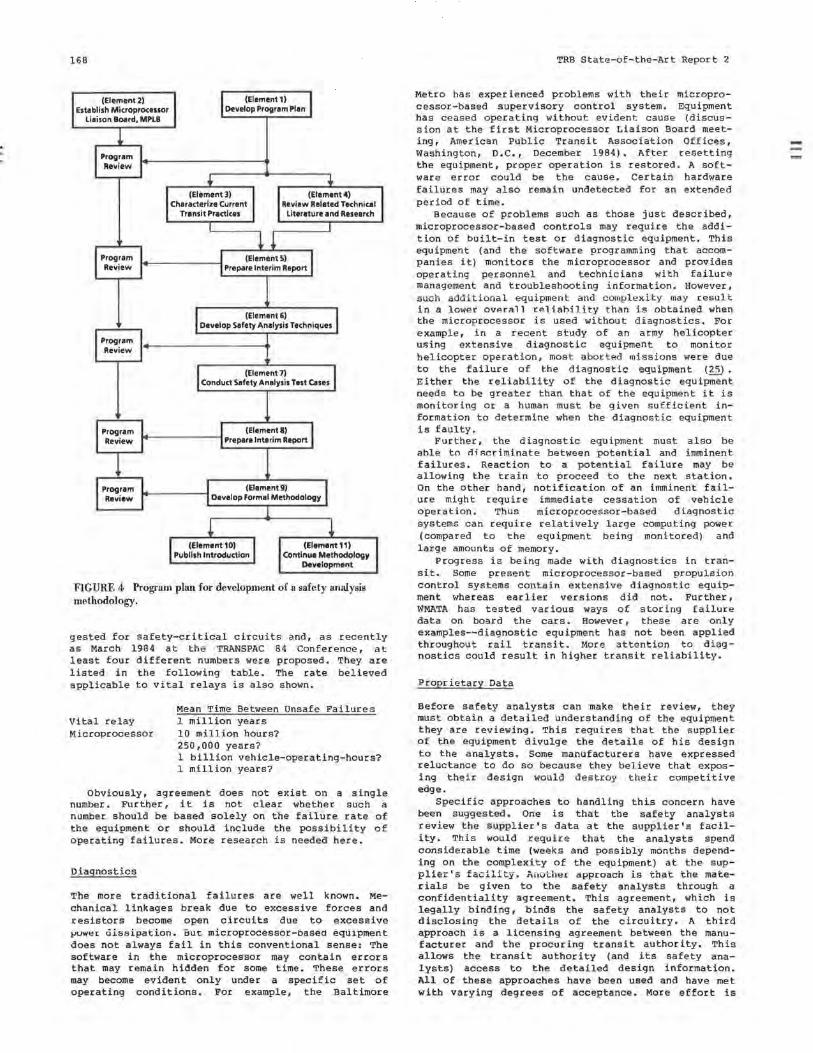
168
(Element2) Establish Microprocessor
Liaison Board, MPLB
Program Review
Program Review
Program Review
Program Review
Program Review
(Element 1) Develop Program Plan
(Element)) Characterize Current
Transit Practices
(Element4) Review Related Technical
Literature and Research
(Element 5) Prepare Interim Report
(Element6) Develop Safety Analysis Techniques
(Element7) Conduct Safety Analysis Test Cases
(Element I) Prepare Interim Report
(Element9) Develop Formal Methodology
(Element 10) Publish Introduction
(Element 11 I Continue Methodology
Development
FIGURE 4 Program plan for development of a safety analysis methodology.
gested for safety-critical circuits and, as recently as March 1984 at the TRANSPAC 84 Conference, at least four different numbers were proposed. They are listed in the following table. The rate believed applicable to vital relays is also shown.
Vital relay Microprocessor
Mean Time Between unsafe Failures 1 million years 10 million hours? 250,000 years? 1 billion vehicle-operating-hours? 1 million years?
Obviously, agreement does not exist on a single number. Further, it is not clear whether such a number should be based solely on the failure rate of the equipment or should include the possibility of operating failures. More research is needed here.
Diagnostics
The more traditional failures are well known. Mechanical linkages break due to excessive forces and resistors become open circuits due to excessive puwer aissipacion. Bue microprocessor-basea equipment does not always fail in this conventional sense: The software in the microprocessor may contain errors that may remain hidden for some time. These errors may become evident only under a specific set of operating conditions. For example, the Baltimore
TRB State-of-the-Art Report 2
Metro has experienced problems with their microprocessor-based supervisory control system. Equipment has ceased operating without evident cause (discussion at the first Microprocessor Liaison Board meeting, American Public Transit Association Offices, Washington, D.C., December 1984). After resetting the equipment, proper operation is restored. A software error could be the cause. Certain hardware failures may also remain undetected for an extended period of time.
Because of problems such as those just described, microprocessor-based controls may require the addition of built-in test or diagnostic equipment. This equipment (and the software programming that accompanies it) monitors the microprocessor and provides operating personnel and technicians with failure management and troubleshooting information. However, such additional equipment and complexity may result in a lower over~ll reliability than is obtained when the microprocessor is used without diagnostics. For example, in a recent study of an army helicopter using extensive diagnostic equipment to monitor helicopter operation, most aborted missions were due to the failure of the diagnostic equipment (~ • Either the reliability of the diagnostic equipment needs to be greater than that of the equipment it is monitoring or a human must be given sufficient information to determine when the diagnostic equipment is faulty.
Further, the diagnostic equipment must also be ahle to cli scdminate between potential and imminent failures. Reaction to a potential failure may be allowing the train to proceed to the next station. On the other hand, notification of an imminent failure might require immediate cessation of vehicle operation. Thus microprocessor-based diagnostic systems can require relatively large computing power (compared to the equipment being monitored) and large amounts of memory.
Progress is being made with diagnostics in transit. Some present microprocessor-based propulsion control systems contain extensive diagnostic equipment whereas earlier versions did not. Further, WMATA has tested various ways of storing failure data on board the cars. However, these are only examples--diagnostic equipment has not been applied throughout rail transit. More attention to diag nostics could result in higher transit reliability.
Proprietary Data
Before safety analysts can make their review, they must obtain a detailed understanding of the equipment they are reviewing. This requires that the supplier of the equipment divulge the details of his design to the analysts. Some manufacturers have expressed reluctance to do so because they believe that exposing their design would destroy their competitive edge.
Specific approaches to handling this concern have been suggested. One is that the safety analysts review the supplier's data at the supplier's facility. This would require that the analysts spend considerable time (weeks and possibly months depending on the complexity of the equipment) at the supplier• s facility. Another approach is that the materials be given to the safety analysts through a confidentiality agreement. This agreement, which is legally binding, binds the safety analysts to not disclosing the details of the circuitry. A third approach is a licensing agreement between the manufacturer and the procuring transit authority. This allows the transit authority (and its safety analysts) access to the detailed design information. All of these approaches have been used and have met with varying degrees of acceptance. More effort is
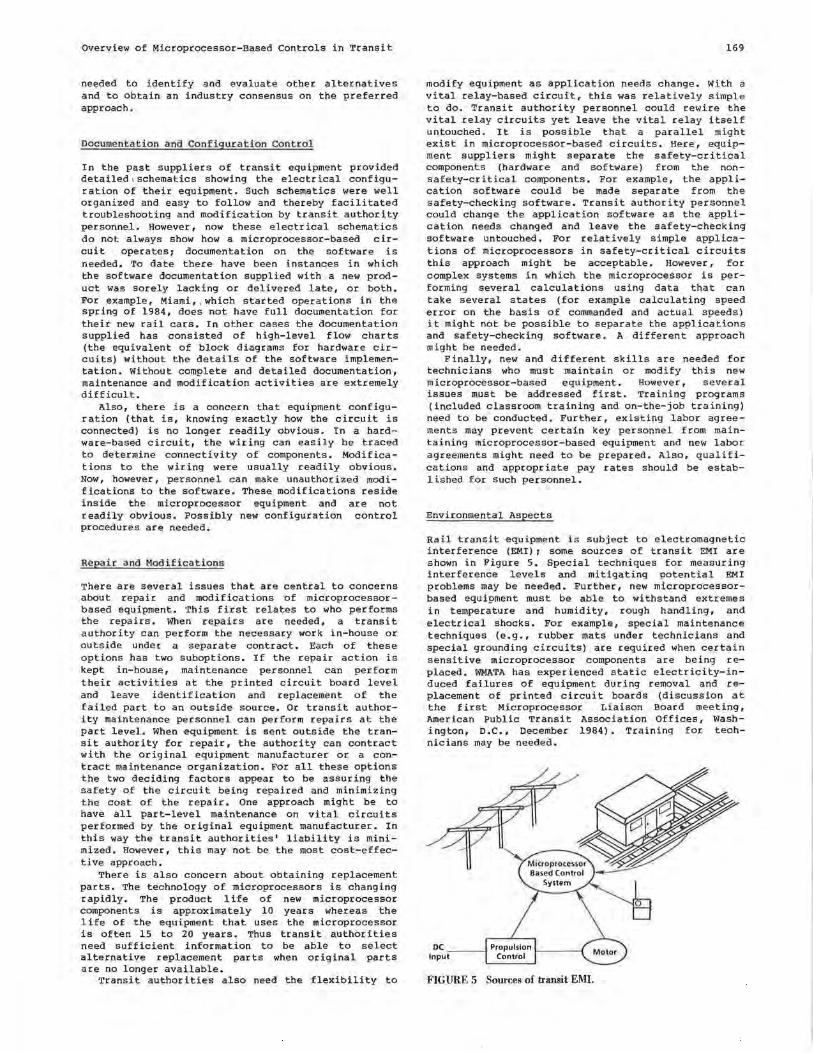
Overview of Microprocessor-Based Controls in Transit
needed to identify and evaluate other alternatives and to obtain an industry consensus on the preferred approach,
Documentation and Co.nfiguration Control
In the past suppliers of transit equipment provided detailed, schematics showing the electrical configuration of their equipment. Such schematics were well organized and easy to follow and thereby facilitated troubleshooting and modification by transit authority personnel. However, now these electrical schematics do not always show how a microprocessor-based circuit operates; documentation on the software is needed, To date there have been instances in which the software documentation supplied with a new product was sorely lacking or delivered late, or both. For example, Miami,,which started operations in the spring of 1984, does not have full documentation for their new rail cars. In other cases the documentation supplied has consisted of high-level flow charts (the equivalent of block diagrams for hardware circuits) without the details of the software implementation. Without complete and detailed documentation, maintenance and modification activities are extremely difficult.
Also, there is a concern that equipment configuration (that is, knowing exactly how the circuit is connected) is no longer readily obvious. In a hardware-based circuit, the wiring can easily be traced to determine connectivity of components. Modifications to the wiring were usually readily obvious. Now, however, personnel can make unauthorized modifications to the software. These modifications reside inside the microprocessor equipment and are not readily obvious. Possibly new configuration control procedures are needed.
Repair and Modif ications
There are several issues that are central to concerns about repair and modifications of microprocessorbased equipment. This first relates to who performs the repairs. When repairs are needed, a transit authority can perform the necessary work in-house or outside under a separate contract. Each of these options has two suboptions. If the repair action is kept in-house, maintenance personnel can perform their activities at the printed circuit board level and leave identification and replacement of the failed part to an outside source. Or transit authority maintenance personnel can perform repairs at the part level. When equipment is sent outside the transit authority for repair, the authority can contract with the original equipment manufacturer or a contract maintenance organization. For all these options the two deciding factors appear to be assuring the safety of the circuit being repaired and minimizing the cost of the repair. One approach might be to have all part-level maintenance on vital circuits performed by the original equipment manufacturer. In this way the transit authorities' liability is minimized. However, this may not be the most cost-effective approach.
There is also concern about obtaining replacement parts. The technology of microprocessors is changing rapidly. The product life of new microprocessor components is approximately 10 years whereas the life of the equipment that uses the microprocessor is often 15 to 20 years. Thus transit authorities need sufficient information to be able to select alternative replacement parts when original parts are no longer available.
Transit authorities also need the flexibility to
169
modify equipment as application needs change. With a vital relay-based circuit, this was relatively simple to do. Transit authority personnel could rewire the vital relay circuits yet leave the vital relay itself untouched. It is possible that a parallel might exist in microprocessor-based circuits. Here, equipment suppliers might separate the safety-critical components (hardware and software) from the nonsafety-critical components. For example, the application software could be made separate from the safety-checking software. Transit authority personnel could change the application software as the application needs changed and leave the safety-checking software untouched. For relatively simple applications of microprocessors in safety-critical circuits this approach might be acceptable. However, for complex systems in which the microprocessor is performing several calculations using data that can take several states (for example calculating speed error on the basis of commanded and actual speeds) it might not be possible to separate the applications and safety-checking software. A different approach might be needed.
Finally, new and different skills are needed for technicians who must maintain or modify this new microprocessor-based equipment. However, several issues must be addressed first. Training programs (included classroom training and on-the-job training) need to be conducted. Further, existing labor agreements may prevent certain key personnel from maintaining microprocessor-based equipment and new labor agreements might need to be prepared. Also, qualifications and appropriate pay rates should be established for such personnel.
Environmental Aspects
Rail transit equipment is subject to electromagnetic interference (EMI); some sources of transit EMI are shown in Figure 5. Special techniques for measuring interference levels and mitigating potential EMI problems may be needed. Further, new microprocessorbased equipment must be able to with stand extremes in temperature and humidity, rough handling, and electrical shocks. For example, special maintenance techniques (e.g., rubber mats under technicians and special grounding circuits) are required when certain sensitive microprocessor components are being replaced. WMATA has experienced static electricity-induced failures of equipment during removal and replacement of printed circuit boards (discussion at the first Microprocessor Liaison Board meeting, American Public Transit Association Offices, Washington, D.C., December 1984). Training for technicians may be needed.
DC ___ _, Input
FIGURE 5 Sources of transit EMI.
170
SUMMARY
The present and future uses of microprocessors in transit have been described and the concerns expressed by transit industry personnel about their introduction have been identified. Further discussions and research on several of these concerns need to be conducted. Microprocessor-based control equipment also needs to be implemented in test settings on operating transit systems and its performance monitored. Such efforts will ease the introduction of this new technology and prove its safety and reliability in operating environments.
ACKNOWLEDGMENTS
The preparation of this paper was based, in part, on work being conducted for UMTA' s Office of Technical Assistance under Contract DOT-UT-90007. The author gratefully acknowledges this support. Questions about this work or the paper can be directed to the author in care of Battelle Columbus Laboratories, 505 King Avenue, Room 1411, Columbus, Ohio, 43201 (telephone: 614-424-4929).
REFERENCES
1. R. Hadden and R. Keyon. Operational Experiences With Microprocessor-Based Train Control. TRANSPAC '84 Conference, Baltimore, Md., March 1984.
2. w. Friesen. Technology Advances in Signalling Systems Utilizing Vital Data Communication. TRANSPAC '84 Conference, Baltimore, Md., March 1984.
3. O.B. Von Lind. Computers Can Now Perform Vital Functions Safely. Railway Gazette International, Nov. 1979, pp. 1004-1007.
4. I. Okumura. Electronic Interlocking To Be Tried in Japan. Railway Gazette International, Dec. 1980, pp. 1043-1046.
5. Automatic Route Setting Eases the Signalman's Load. Railway Gazette International, Oct. 1984, pp. 787-789.
6. Trends in Signalling. Progressive Railroading, Nov. 1984, pp. 57-59.
7. D. Disk. The Role of the Microprocessor and Signalling Systems. A.atterican Public Transit Association Rapid Transit Conference, Pittsburgh, Pa., June 1983.
TRB State-of-the-Art Report 2
8. Microprocessors Make the Difference. Railway Age, Oct. 1983, pp. 46-47.
9. H. Nagel and L. Hay. Microprocessors for Coded Track Circuits. Union Switch and Signal Division, Swissvale, Pa., April 1982.
10. Microprocessors for Vital Relays. Progressive Railroading, Aug. 1984, pp. 66A-68.
11. Bulletin 374. Union Switch and Signal Division, Swissvale, Pa., undated.
12. Service Manuals 6195 and 6196 for Microcode. Union Switch and Signal Division, Swissvale, Pa., undated.
13. R. Roberts. Microprocessor Revolution. Modern Railroads, Oct. 1984, pp. 22-25.
14. H. Sibley. Safety Assurance Logic--Microprocessors in Vital Systems. American Public Transit Association Annual Rapid Transit Conference, Cleveland, Ohio, June 1982.
15. General Railway Signal Folder 268. General Railway Signal, Rochester, N.Y., Aug. 1981.
16. Brochure 9083-6. Westinghouse Air Brake Corporation, Pittsburgh, Pa., Sept. 1984.
17. ITT SEL Advertisement. Mass Transit Magazine, Sept. 1984.
18. H. Wesling. Microprocessor for Chopper Control. American Public Transit Association Rapid Transit Conference, Baltimore, Md., June 1984.
19. L. Sanders. Microprocessor Applications on the Baltimore Metro Vehicle. American Public Transit Association Rapid Transit Conference, Baltimore, Md., June 1984.
20. Advertisement by Gulton Luminator Division. Mass Transit Magazine, Oct. 1984.
21. G. Madder er. Automatic Vehicle Identification. American Public Transit Association Rapid Transit Conference, Pittsburgh, Pa., June 1983.
22. General Railway Signal Folder 272. General Railway Signal, Rochester, N.Y., April 1982.
23. Fifteen Billion Dollar Suit Aimed at Carbide. The Columbus Dispatch, Columbus, Ohio, Dec. 8, 1984.
2 4. Rail Panel One--Microprocessors in Advance Signalling and Control System Design. TRANSPAC '84 Conference, Baltimore, Md., March 1984.
25. C. Locurto. Impact of BIT on Avionics Maintain-- L....:, ..: ........ QU.L.J.-1.\,..f •
n ....... ,... .............. , Ann:..:u.l tainability Symposium, 1983. pp. 333-338.
neli~bility and Main-Orlando, Fla. , Jan.
Specifics of Light Rail Car Design Versus Rapid Car Design Ian G. Hendry Equipment Department, Toronto Transit Commission Toronto, Ontario, Canada
The Toronto Transit Commission has a long history of substantial involvement in rail transit, which complements an equally substantial involvement in both diesel and electric buses. The present rail car fleet now comprises 632 heavy rail subway cars, approximately 150 PCC streetcars 90 of which are available for service albeit soon to be retired, and 196 relatively new streetcars. At this moment, contracts for the supply of 126 new subway cars and 52 new articulated streetcars are in process with deliveries to commence in 1986 and completion expected in 1987. All of the 540 PCC cars purchased new by the commission since 1938, all but 6 of the new streetcars, and all but 176 of the subway cars were produced by the same contractor. That contractor also has the contracts for the new subway cars and the new streetcars.
Perhaps it was the foregoing somewhat unusual history that prompted the session moderator to ask that a representative of the commission investigate designs of light and heavy rail cars to determine if there is any substantial flow of technology or less glamorous design ideas from heavy rail car practice to light.
The investigation took the form of discussions with design staff of the commission's principal contractor, Can Car Rail, Inc., and also with a representative of Bombardier Limited, which has experience building both heavy rail cars for Toronto and light rail cars for Portland, Oregon. The information collected is presented as descriptive narrative because it appeared neither worthwhile nor practical to attempt to produce a reference work.
CAR BODY CONSTRUCTION
The majority of the commission's fleet of subway cars has bodies constructed largely of aluminum. Although it is realized that not all subway car operators favor this material, there are many imitators. Freedom from corrosion with adequate protection; a nonhostile environment (i.e., no road salt); and freedom from structural failure, given adequate design, appear to indicate the possibility of achieving the expected 30-plus-year life.
However, there appears to be no acceptance of aluminum for streetcars, The major reason for this is the use of copious quantities of salt to melt snow and ice on streets in northern cities; this, combined with accumulations of sand and other dirt
in the presence of water, is not conducive to long life.
Although much aluminum is used for transit bus construction, these vehicles are typically not expected to serve as long as rail vehicles. Some bus manufacturers use stainless steel to provide long life and a smooth, welded exterior. Stainless steel is an optional material for rail cars. Toronto Transit has long recognized its merits but could find no solid reason to require it instead of aluminum. Both, therefore, have been acceptable materials for unpainted cars for many years. Pr ice competition, however, always yielded aluminum as the winner to such an extent that the usual contractor no longer considers any alternative.
A problem in aluminum use is repairability. Street vehicles are, subject to collisions to a vastly greater extent than are cars operated on a completely or largely reserved right-of-way. It is much easier to find tradespeople who can repair a steel body than to find those who can do top-quality repair of aluminum. Perhaps repairs could be reasonably easily effected in aluminum if riveted construction were used, but who would wish to have light rail vehicles (LRVs) with riveted sides?
Rail car body framing is typically specified to be able to resist a specified end squeeze load without permanent deformation. Heavy rail cars are required to resist loads in the range of from 200 to 4 00 thousand pounds whereas LRVs may be obliged to meet much lower requirements, perhaps down to empty vehicle weight times two. The reason behind this quite naturally lies in the much shorter train lengths, including single-car operation, used with LRVs,
The venerable PCC car is believed to have been designed to withstand a 100 thousand pound load, considerably greater than "weight times two." However, consultants now appear to be drawing on heavy rail practice and are requiring LRVs to resist greater end loads, (e.g., 177 thousand pounds for both Portland and Pittsburgh cars and, perhaps, Sacramento cars) • The rationale may be to provide greater security for passengers in the event of a collision, but the ability of a car body to "crush" in severe accidents must be considered a limitation on deceleration of the "remainder" of the vehicle.
An LRV operating hazard, not faced by heavy rail, is broadside collisions. It. is believed that no specific requirements are directed toward this eventuality.
171
172
An advantage for designers of platform-levelloading cars, whether heavy rail or LRV, over stepup cars is in the symmetry of the framing compared to designs with cut-outs for stepwells.
BODY INTERIOR
The incidence of serious fires in heavy rail subway cars has brought vast improvements in materials used for interior appurtenances. Such materials now are more nearly nonflammable and produce reduced smoke and toxic fume emissions. Although the special condition of tunnel operation with its obvious need to have fireproof cars does not apply to every light rail transit (LRT) line, the transplanting of the new material requirements to LRVs has been immediate. Included in the list of items affected are seats (both padding and upholstery), interior lining,
window friezes, lighting lenses, floor panels, and floor covering. The drive toward reduced flammability has also included wire and cable insulation in addition to the interior materials.
The introduction of higher strength windshield glass into heavy rail cars has been followed by corresponding trends in LRVs. Cars for Portland have such windshields as will cars for Santa Clara and Hong Kong. LRVs operating at speed on private rights-of-way may be attractive to vandals intent on smashing windshields.
As a minor item, backlighted advertising card light fixtures, developed for heavy rail cars, have gravitated to LRVs and also to transit buses.
VEHICLE EQUIPMENT
In the days before the automobile, the industries that produced the predecessors of today's LRVs were probably both numerous and large in order to produce the numbers of vehicles required by city and interurban operations. In those days heavy rail operators probably benefited from advancements, however rudimentary by today's standards, developed for light rail •,,,•ehiclcs. Indeed, this phant""\monnn ,..,...ri+-i n11ar1
until after World War II as evidenced by the production by the old Transit Research Corporation (TRC) of the rapid transit car specification as an evolution of the PCC car specification.
Several operators, notably Chicago Transit and Massachusetts Bay Transportation Authority, Boston, made great use of the specification in purchasing cars, and the Toronto specification for subway cars is firmly r'ooted i1, th~ TRC ~erk ~lthcugh, ~t this point, it probably bears little resemblance to the original.
Virtual abandonment of LRV operations after World War II spelled the end of the flow of technology from light to heavy rail and the trend has now reversed. Another important factor in the process of idea development in North America is the influx both of hardware and of designs from the European and Japanese scenes. Thus the industry is quite fluid and soon it may be difficult to recall who developed what.
AIR CONDITIONING
lln ;+-o.m n~ Pn1dnm1Pont- i:tppliP~ t .n ,:;nmP. T,RV~ with nesigns rooted in heavy rail is the air conditioning. Systems developed for main-line rail cars, notably the DC motor-driven refrigeration compressor, gravitated to heavy rail transit from which LRV apparatus was developed. An interesting variation in this theme has occurred in Toronto and may be of interest.
TRB State-of-the-Art Report 2
In the application of air conditioning to the Urban Transportation Development Corporation (UTDC) cars for the newly opened Scarborough line, the evaporator-fan unit was placed in a drop-ceiling volume at the noncab end of the car. Early drawings showing this met with disfavor because of encroachment into an already low passenger space. The designers did a masterful job of squeezing the package, using two fan motors and attached blowers mounted at peculiar angles in the roof corner. This too met with disfavor so it was "back to the drawing board."
However generated, the designers brought forth an arrangement in which the apparatus was made to completely disappear into the ceiling. The design includes the evaporator mounted longitudinally in the center of the car roof and ceiling space at the center of the car. The single-motor blower unit is tucked behind the light fixtures and draws air from each end of the car through ducts behind the fixtures. Air is blown directly across the car through the evaporator. Cooled air emanates from the evaporator and enters a baffle arrangement that turns the air flow sharply both ways into longitudinal ducts in the ceiling. This clever design could conceivably be redirected back to heavy rail cars, given sufficient interest in enhancing interior appearance.
TRACTION CONTROLS
Traction and braking controls have undergone much development in recent years. The availability of thyristors with sufficient current-conducting and voltage capacity for electric vehicles soon yielded regenerative chopper controls on several fronts. First applications were to heavy rail cars in the 1960s. It was inevitable that, as this technology matured, there would be applications of it to light rail vehicles.
Inducements to adopt the new controls include not only energy efficiency and promised reduction in maintenance costs but also smoothness of control. The latter is particularly important if on-street "Po .... ~+-; nn i C: nc:orl . T.RV~ wi t-h chopper controls opP.rrJtP.
not only in Toronto but also in Boston, Buffalo, Philadelphia, Pittsburgh, and San Francisco.
The future may bring greater penetration of induction motor drives in LRVs. Although some vehicles with AC traction motors are in operation in Europe and the equipment is being heavily promoted for sale, it is believed that the system must be more complex and surely more expensive, both to buy and to maintain, th2n .ar~ DC chopp~r ~ystews~ Wei']ht is greater than a corresponding regenerative chopper and energy recovery is not as great. AC drive also brings the need to control wheel diameters within close tolerance. It is therefore expected that operators, especially in North America, may react to the added costs with considerable sales resistance if gPt.t.in11 rid of colllJllutators is the only perceived benefit.
TRUCKS
The requirements of trucks for the two general types of car under discussion are considerablj different. A street-operating LRV should have resilient wheels to help control gro~n~ ~i~ratio~~= FP~vy r~il v~hicles, on the other hand, have traditionally used only one-piece rolled or pressure-poured steel wheels. Wheel selection has a profound effect on the choice of friction braking because rubber elements in a wheel preclude the use of wheel-tread braking.
Primary springing design is deeply involved in
Light Rail Car Design Versus Rapid car Design
meeting requirements limiting load shift in a truck as one wheel is raised. Such requirements are being used by some LRV operators to guard against failure to negotiate single moving point track switches of old street railway systems. Soft primaries probably bring a need to stiffen roll stability at the secondaries, perhaps by use of an anti-roll bar.
There can also be similarities between trucks for heavy and light rail vehicles. Maschinenfabrik Augsburg-Nlirnberg (MAN) of the Federal Republic of Germany entered the Toronto scene by producing four car-sets of demonstration trucks for the four subway cars of the most recent car order. Success in the demonstration led to the MAN design being selected for cars of the current order of 126 and to the selection of a derived design for the new LRVs. The truck frames for the HRVs will be made by Can Car, those for the LRVs by MAN.
In the case of the new LRVs for Toronto, a repetition of the design of trucks provided under the most recent streetcars was precluded by the commission requirement for both bi-motor drive and inboard frames. MAN apparently was willing to adapt its HRV design to the new requirements while preserving many of the basic concepts. Major similarities will include frame layout, chevron primary and pneumatic secondary spring design, and anti-roll bars for stability (only one leveling valve will be used per truck). Major differences will include solid steel wheels, tread brakes, right-angle drive, and bolsterless design without a loaded center bearing for HRVs and resilient wheels; spring applied, pneumatically released disc brakes; single reduction, framemounted, three-gear parallel drive; and a loaded bolster with ball-bearing center bearing for the LRVs. The center truck of the articulated vehicle will not be motored.
The Toronto Transit Commission has opted for a braking system in which regenerative electric motor braking is the only retardation up to a prescribed limit of 17 percent adhesion. For brake requirements in excess of that produced by 17 percent adhesion on the motored wheels, friction brake is increased on the nonmotored axles up to a car full-service brake rate of 3. 5 mph per second. As an added technical improvement, there is to be an automatic change from "preferential braking" to equal use of adhesion at all wheels, in the event of detected wheel slide. Change back is also automatic each time the car stops.
An example of design transfer from LRVs to HRVs is force ventilation of traction motors. Al though subway car motors on many properties have typically been self-ventilated, LRVs, starting with post-World War II PCC cars, have had force ventilation to help motors survive in the inhospitable conditions under a streetcar, such as those found in Toronto in winter.
There is now a growing body of opinion in support of force ventilation of subway car motors to produce improved performance by supplying them with relatively clean, dry air, drawn from well above track level. Atlanta (MARTA) has been fortunate in being able to duct air from the roof line; the best that has been achieved for the new Toronto cars is to draw air from just above platform level. It is hoped that Toronto will be able to determine if there are benefits, in the form of reduced motor maintenance,
173
to be derived from the exercise. That the motors to be used will be different from any others will certainly help to cloud the issue.
PASSENGER DOORS
There is no standard practice concerning passenger side doors and there are many variations. Perhaps only HRVs use inside sliding, pocketed doors. They also use outside hung sliding doors (Boston), folding doors (Chicago), and sliding plug doors. LRVs are found with folding doors (Calgary, Edmonton); sliding plug doors (Tyne & Ware); and outward hinged, pneumatically opened, spring-closed exit doors (Toronto). It is interesting that the latter was adopted as a standard in Toronto many years ago as a bus exit door that had been developed originally by Vapor as a push door. This apparatus has an excellent safety record and was selected over folding doors, which were to have been used "out of habit," for the latest Toronto streetcars at a late stage in car development.
CAR COUPLERS
Considerable variety exists in couplers used on various HRVs and LRVs, as might be expected where there is no requirement for standardizing from one property to another. Coupler choice is rather important because when a selection has been made, a property tends to retain the design as standard for obvious reasons. Cases exist in which couplers have been changed for performance reasons but instances of this are rare. In Toronto couplers on the original HRVs provided a relatively small number of electric contacts, which required that cars face the correct direction for coupling. This was of little consequence until line expansion provided several places where trains could turn around. A decision was made to not perpetuate those couplers; they were not changed out but no more cars were purchased with the particular coupler. The cars concerned will be replaced within the next 2 years and the problem will have been resolved.
In general, coupler makers will offer devices that use their own technology but in sizes to suit the application. Some may have been designed for LRVs and upgraded for HRVs; for others, the reverse may be the case. As patents expire, competitors may enter the market with compatible models of another's design.
CONCLUSION
In the transit business where individuals, as specification writers, designers, suppliers, builders, or operators, have had the opportunity to become familiar with the particulars of different types of vehicles and equipment it is inevitable that good ideas will be transferred from one vehicle to others. It is the responsibility of the people involved to ensure that the technology being transferred (or first applied) is indeed a correct application.
It is hoped that this discussion will provoke some reflection about the degree to which new vehicles draw on existing practice.
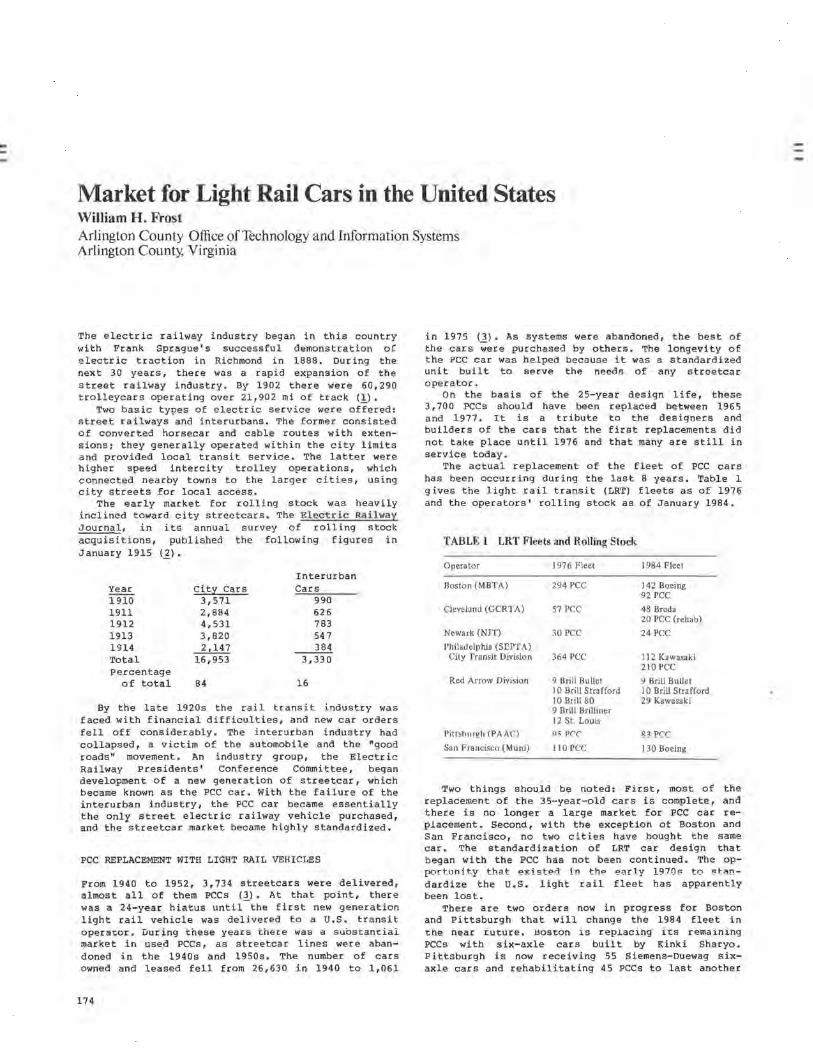
Market for Light Rail Cars in the United States William H. Frost Arlington County Office of Technology and Information Systems Arlington County, Virginia
The electric railway industry began in this country with Frank Sprague's successful demonstration o( e l ectric traction in Richmond in 1888. our ing the next 30 years, there was a rapid expansion of the street railway industry. By 1902 there were 60,290 trolleycars operating over 21,902 mi of track (1).
Two basic types of electric service were offered: street railways and interurbans. The former consisted of converted horsecar and cable routes with extensions i they generally operated within the city limits and provided local transit service. The latter were higher speed intercity trolley operations, which connected nearby towns to the larger cities, using city streets for local access.
The early market for rolling stock was heavily inclined toward city streetcars. The Electric Railwa y Journal, in its annual survey of rolling stock acquisitions, published the following figures in January 1915 (ll•
Interurban
~ City Cars Cars 1910 3,571 990 1911 2,884 626 1912 4,531 783 1913 3,820 54 7 1914 --2L!i2 -----121 Total 16,953 3,330 Percentage
of total 84 16
By the late 1920s the rail transit industry was faced with financial difficulties, and new car orders fell off considerably. The interurban industry had collapsed, a victim of the automobile and the "good roads" movement. An industry group, the Electric Railway Presidents' Conference Committee, began development of a new generation of streetcar, which became known as the PCC car. With the failure of the interurban industry, the PCC car became essentially the only street electric railway vehicle purchased, and the streetcar market became highly standardized.
PCC REPLACEMENT WITH LIGHT RAIL VEHICLES
From 1940 to 1952, 3,734 streetcars were delivered, almost all of them PCCs (~_l. At that point, there was a 24-year hiatus until the first new generation light rail vehicle was delivered to a U.S. transit opera~or. During these years t here was a subs~an~ial market in used PCCs, as streetcar lines were abandoned in the 1940s and 1950s. The number of cars owned and leased fell from 26,630 in 1940 to 1,061
174
in 1975 (]). As systems were abandoned, the best of the cars were purchased by others. '!'he longevity of the PCC car was helped because it was a standardized unit built to serve the needR of any streetcar operator.
On the basis of the 25-year design life, these 3,700 PCCs should have been replaced between 1965 and 1977. It is a tribute to the designers and builders of the cars that the first replacements did not take place until 1976 and that many are still in service today.
The actual replacement of the fleet of PCC cars has been occurring during the last 8 years. Table 1 gives the light rail transit (LRT) fleets as of 1976 and the operators' rolling stock as of January 1984.
TABLE 1 LRT Fleets and Rolling Stock
Operator
Boston (MBTA}
Cleveland (GCRTA}
Newark (NJT} Philadelphia (SEPTA) City Transit Division
Red Arrow Division
Pittsb11r1h (PA AC:)
San Francisco (Muni)
1976 Fleet
294 PCC
57 PCC
30 PCC
364 PCC
9 Brill Bullet IO Brill Strafford 10 Brill 80 9 Brill Brilliner 12 St. Louis <)~ f'('('
110 PCC
1984 Fleet
142 Boeing 92 PCC 48 Breda 20 PCC (rehab) 24 PCC
11 2 Kawasaki 210 PCC 9 Brill Bullet IO Brill Strafford 29 Kawasaki
83 PCC
130 Boeing
Two things should be noted: First, most of the replacement of the 35-year-old cars is complete, and there is no longer a large market for PCC car replacement. Second, with the exception ot Boston and San Francisco, no two cities have bought the same car. The standardization of LRT car design that began with the PCC has not been continued. The opport1.1nity that exis ted in the early 1970s to standardize the u.s. light rail fleet has apparently been lost.
There are two orders now in progress for Boston and Pittsburgh that will change the 1984 fleet in tne near f uture. Hoston i s repLacing its remaining PCCs with six-axle cars built by Kinki Sharyo. Pittsburgh is now receiving 55 Siemens-Duewag sixaxle cars and rehabilitating 45 PCCs to last another
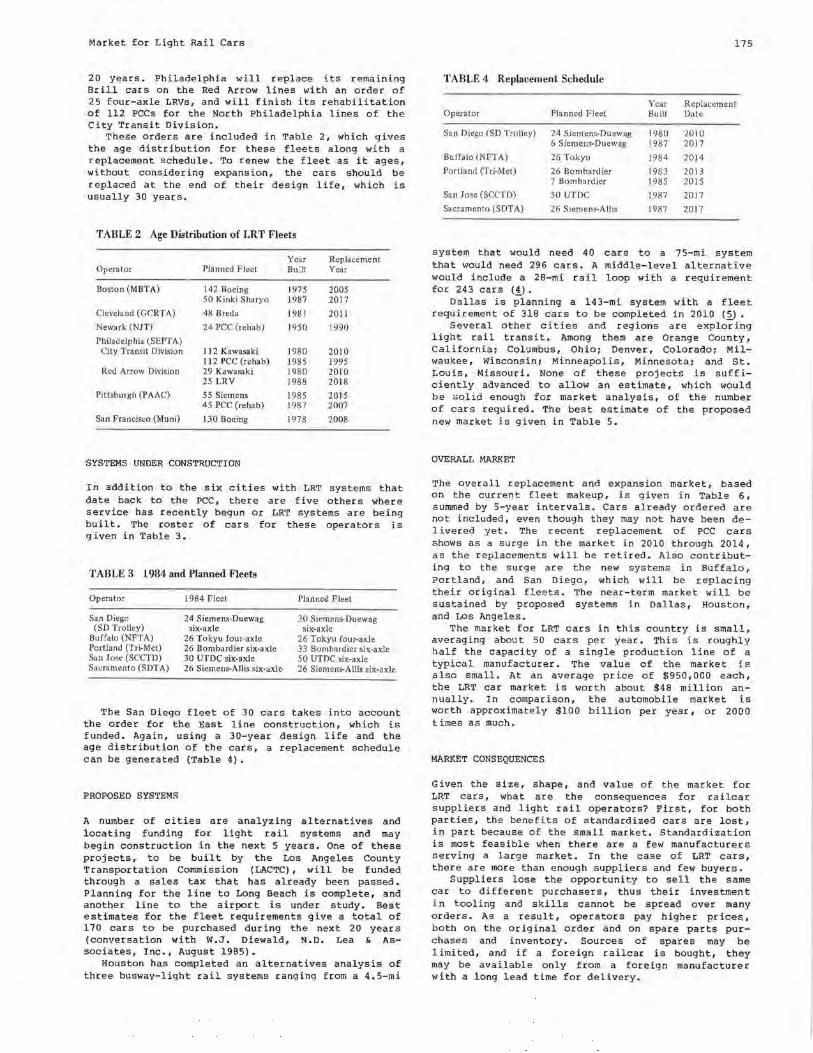
Market for Light Rail Cars
20 years. Philadelphia will replace its remaining Brill cars on the Red Arrow lines with an order of 25 four-axle LRVs, and will finish its rehabilitation of 112 PCCs for the North Philadelphia lines of the City Transit Division.
These orders are included in Table 2, which gives the age distribution for these fleets along with a replacement schedule. To renew the fleet as it ages, without considering expansion, the cars should be replaced at the end of their design life, which is usually 30 years.
TABLE2 Age Distribution of LR T Fleets
Year Replacement Operator Planned Fleet Bu]t Year
Boston (MBTA) 142 Boeing 1975 2005 5 0 Kinki Sharyo 1987 2017
Cleveland (GCRTA) 48 Breda 1981 2011
Newark (NJT) 24 PCC (rehab) 1950 1990
Philadelphia (SEPTA) City Transit Division 112 Kawasaki 1980 2010
112 PCC (rehab) 1985 1995 Red Arrow Division 29 Kawasaki 1980 2010
25 LRV 1988 2018
Pittsburgh (PAAC) 55 Siemens 1985 2015 45 PCC (rehab) 1987 2007
San Francisco (Muni) 130 Boeing 1978 2008
SYSTEMS UNDER CONSTRUCTION
In addition to the six cities with LRT systems that date back to the PCC, there are five others where service has recently begun or LRT systems are being built. The roster of cars for these operators is given in Table 3.
TABLE 3 1984 and Planned Fleets
Operator
San Diego (SD Trolley)
Buffalo (NFTA) Portland (Tri-Met) San Jose (SCCTD) Sacramento (SDTA)
1984 Fleet
24 Siemens-Duewag six-axle
26 Tokyu four-axle 26 Bombardier six-axle 30 UTDC six-axle 26 Siemens-Allis six-axle
Planned Fleet
3 0 Siemens-Duewag six-axle
26 Tokyu four-axle 33 Bombardier six-axle 5 0 UTDC six-axle 26 Siemens-Allis six-axle
The San Diego fleet of 30 cars takes into account the order for the East line construction, which is funded. Again, using a 30-year design life and the age distribution of the cars, a replacement schedule can be generated (Table 4).
PROPOSED SYSTEMS
A number of cities are analyzing alternatives and locating funding for light rail systems and may begin construction in the next 5 years. One of these projects, to be built by the Los Angeles County Transportation Commission (LACTC), will be funded through a sales tax that has already been passed. Planning for the line to Long Beach is complete, and another line to the airport is under study. Best estimates for the fleet requirements give a total of 170 cars to be purchased during the next 20 years (conversation with W.J. Diewald, N.D. Lea & Associates, Inc., August 1985).
Houston has completed an alternatives analysis of three busway-light rail systems ranging from a 4.5-mi
175
TABLE4 Replacement Schedule
Year Replacement Operator Planned Fleet Built Date
San Diego (SD Trolley) 24 Siemens-Duewag 1980 2010 6 Siemens-Duewag 1987 2017
Buffalo (NFTA) 26 Tokyu 1984 2014
Portland (Tri-Met) 26 Bombardier 1983 2013 7 Bombardier 1985 2015
San Jose (SCCTD) 50 UTDC 1987 2017
Sacramento (SDT A) 26 Siemens-Allis 1987 2017
system that would need 40 cars to a 75-mi system that would need 296 cars. A middle-level alternative would include a 28-mi rail loop with a requirement for 243 cars <.i>.
Dallas is planning a 143-mi system with a fleet requirement of 318 cars to be completed in 2010 ( 5) •
Several other cities and regions are exploring light rail transit. Among them are Orange County, California; Columbus, Ohio i Denver, Colorado; Milwaukee, Wisconsin i Minneapolis, Minnesota i and St. Louis, Missouri. None of these projects is sufficiently advanced to allow an estimate, which would be solid enough for market analysis, of the number of cars required. The best estimate of the proposed new market is given in Table 5.
OVERALL MARKET
The overall replacement and expansion market, based on the current fleet makeup, is given in Table 6, summed by 5-year intervals. Cars already ordered are not included, even though they may not have been delivered yet. The recent replacement of PCC cars shows as a surge in the market in 2010 through 2014, as the replacements will be retired. Also contributing to the surge are the new systems in Buffalo, Portland, and San Diego, which will be replacing their original fleets. The near-term market will be sustained by proposed systems in Dallas, Houston, and Los Angeles.
The market for LRT cars in this country is small, averaging about 50 cars per year. This is roughly half the capacity of a single production line of a typical manufacturer. The value of the market is also small. At an average price of $950,000 each, the LRT car market is worth about $48 million annually. In comparison, the automobile market is worth approximately $100 billion per year, or 2000 times as much.
MARKET CONSEQUENCES
Given the size, shape, and value of the market for LRT cars, what are the consequences for railcar suppliers and light rail operators? First, for both parties, the benefits of standardized cars are lost, in part because of the small market. Standardization is most feasible when there are a few manufacturers serving a large market. In the case of LRT cars, there are more than enough suppliers and few buyers.
Suppliers lose the opportunity to sell the same car to different purchasers, thus their investment in tooling and skills cannot be spread over many orders. As a result, operators pay higher prices, both on the original order and on spare parts purchases and inventory. Sources of spares may be limited, and if a foreign railcar is bought, they may be available only from a foreign manufacturer with a long lead time for delivery.
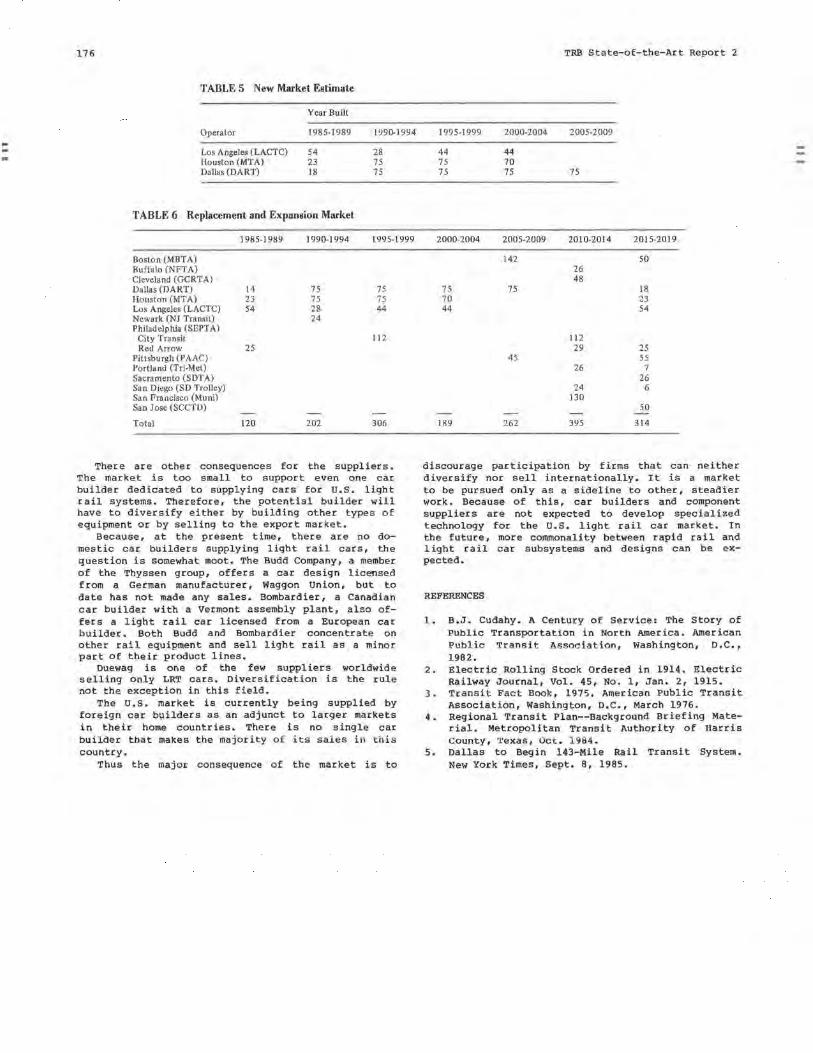
-.. ..
176
TABLE 5 New Market Estimate
Year Built
Operator 1985-1989 1990-1994
Los Angeles (LACTC) 54 28 Houston (MT A) 23 75 Dallas (DART) 18 75
TABLE 6 Replacement and Expansion Market
1985-1989 1990-1994 1995-1999
Boston (MBTA) Buffalo (NFTA) Cleveland (GCRTA) Dallas (DART) 14 75 75 Houston (MTA) 23 75 75 Los Angeles (LACTC) 54 28 44 Newark (NJ Transit) 24 Philadelphia (SEPTA)
City Transit 112 Red Arrow 25
Pittsburgh (PAAC) Portland (Tri-Met) Sacramento (SOTA) San Diego (SD Trolley) San Francisco (Muni) San Jose (SCCTD)
Total 120 202 306
There are other consequences for the suppliers. The market is too small to support even one car builder dedicated to supplying cars for U.S. light rail systems. Therefore, the potential builder will have to diversify either by building other types of equipment or by selling to the export market.
Because, at the present time, there are no domestic car builders supplying light rail cars, the question is somewhat moot. The Budd Company, a member of the Thyssen group, offers a car design licensed from a German manufacturer, Waggon Union, but to date has not made any sales. Bombardier, a Canadian car builder with a Vermont assembly plant, also offers a light rail car licensed from a European car builder. Both Budd and Bombardier concentrate on other rail equipment and sell light rail as a minor part of their product lines.
Duewag is one of the few suppliers worldwide selling only LRT cars. Diversification is the rule not the e xception in this field.
The u. s. market is currently being supplied by foreign car builders as an adjunct to larger markets in their home countries. There is no single car builder that makes the majority o f its sales in t his country.
Thus the major consequence of the market is to
TRB State-of-the-Art Report 2
1995-1999 2000-2004 2005-2009
44 44 75 70 75 75 75
2000-2004 2005-2009 2010-2014 2015-2019
142 50 26 48
75 75 18 70 23 44 54
112 29 25
45 55 26 7
26 24 6
130 50
189 262 395 314
discourage participation by firms that can neither diversify nor sell internationally. It is a market to be pursued only as a sideline to other, steadier work. Because of this, car builders and component suppliers are not expected to develop specialized technology for the u.s. light rail car market. In the future, more commonality between rapid rail and light rail car subsystems and designs can be expected.
REFERENCES
1. B.J. Cudahy. A Century of Service: The Story of Public Transportation in North America. American Public Transit Associat i on, Washington, D.C., 1982.
2. Electric Rolling Stock Ordered in 1914. Electric Railway Journal, Vol. 45, No. 1, Jan. 2, 1915.
3. Transit Fact Book, 1975. American Public Transit Association, Washington, D.C., March 1976.
4. Regional Transit Plan--Background Briefing Material. Metropolitan Transit Authority of Harris County, •.rexas , Oct. l<;,ii4.
5. Dallas to Begin 143-Mile Rail Transit System. New York Times, Sept. 8, 1985.
.--
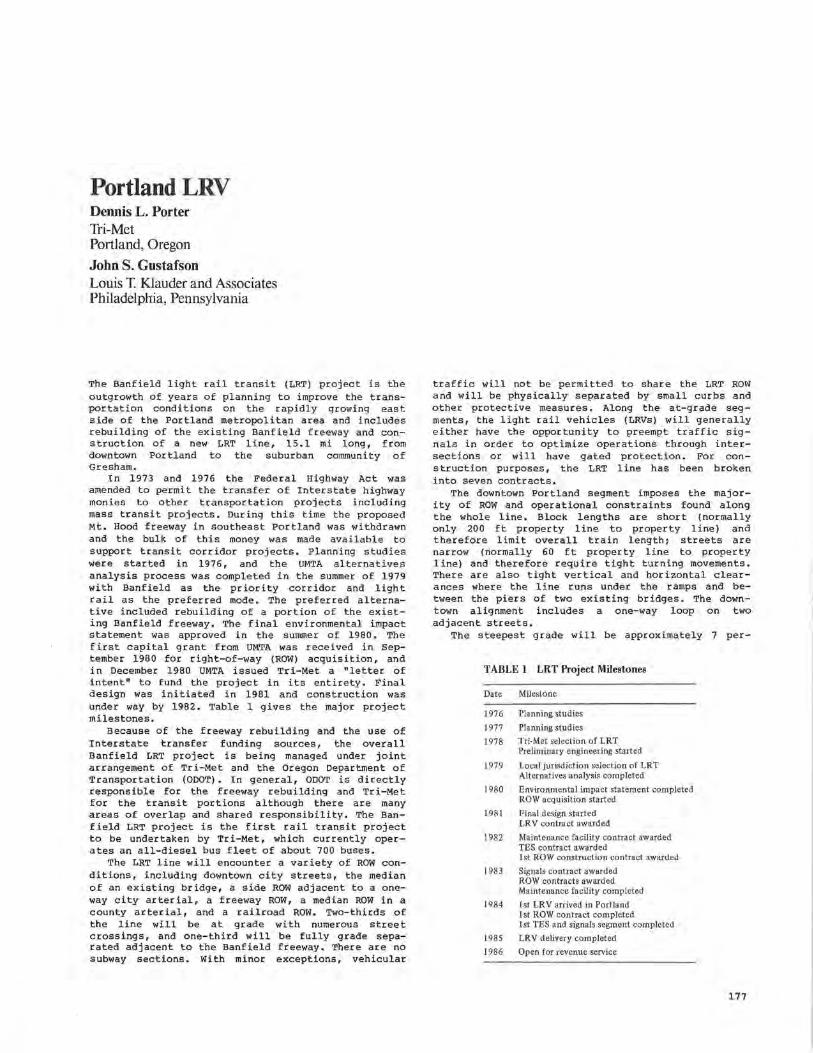
Portland LRV Dennis L. Porter Tri-Met Portland, Oregon
John S. Gustaf son Louis T. Klauder and Associates Philadelphia, Pennsylvania
The Banfield light rail transit (LRT) project is the outgrowth of years of planning to improve the transportation conditions on the rapidly growing east side of the Portland metropolitan area and includes rebuilding of the existing Banfield freeway and construction of a new LRT line, 15.1 mi long, from downtown Portland to the suburban community of Gresham.
In 1973 and 1976 the Federal Highway Act was amended to permit the transfer of Interstate highway monies to other transportation projects including mass transit projects. During this time the proposed Mt. Hood freeway in southeast Portland was withdrawn and the bulk of this money was made available to support transit corridor projects. Planning studies were started in 1976, and the UMTA alternatives analysis process was completed in the summer of 1979 with Banfield as the priority corridor and light rail as the preferred mode. The preferred alternative included rebuilding of a portion of the existing Banfield freeway. The final environmental impact statement was approved in the summer of 1980. The first capital grant from UMTA was received in September 1980 for right-of-way (ROW) acquisition, and in December 1980 UMTA issued Tri-Met a "letter of intent" to fund the project in its entirety. Final design was initiated in 1981 and construction was under way by 1982. Table 1 gives the major project milestones.
Because of the freeway rebuilding and the use of Interstate transfer funding sources, the overall Banfield LRT project is being managed under joint arrangement of Tri-Met and the Oregon Department of Transportation (ODOT). In general, ODOT is directly responsible for the freeway rebuilding and Tri-Met for the transit portions although there are many areas of overlap and shared responsibility. The Banfield LRT project is the first rail transit project to be undertaken by Tri-Met, which currently operates an all-diesel bus fleet of about 700 buses.
The LRT line will encounter a variety of ROW conditions, including downtown city streets, the median of an existing bridge, a side ROW adjacent to a oneway city arterial, a freeway ROW, a median ROW in a county arterial, and a railroad ROW. Two-thirds of the line will be at grade with numerous street crossings, and one-third will be fully grade separated adjacent to the Banfield freeway. There are no subway sections. With minor exceptions, vehicular
traffic will not be permitted to share the LRT ROW and will be physically separated by small curbs and other protective measures. Along the at-grade segments, the light rail vehicles (LRVs) will generally either have the opportunity to preempt traffic signals in order to optimize operations through intersections or will have gated protection. For construction purposes, the LRT line has been broken into seven contracts.
The downtown Portland segment imposes the majority of ROW and operational constraints found along the whole line. Block lengths are short (normally only 200 ft property line to property line) and therefore limit overall train length i streets are narrow (normally 60 ft property line to property line) and therefore require tight turning movements. There are also tight vertical and horizontal clearances where the line runs under the ramps and between the piers of two existing bridges. The downtown alignment includes a one-way loop on two adjacent streets.
The steepest grade will be approximately 7 per-
TABLE I LRT Project Milestones
Date Milestone
1976 Planning studies
1977 Planning studies
1978 Tri-Met selection of LRT Preliminary engineering started
1979 Local jurisdiction selection of LRT Alternatives analysis completed
1980 Environmental impact statement completed ROW acquisition started
1981 Final design started LRV contract awarded
1982 Maintenance facility contract awarded TES contract awarded I st ROW construction contract awarded
1983 Signals contract awarded ROW contracts awarded Maintenance facility completed
1984 !st LRV arrived in Portland I st ROW contract completed I st TES and signals segment completed
1985 LRV delivery completed
1986 Open for revenue service
177
178
cent for 600 ft, and there are several grades of 3 to 5 percent. The minimum horizontal radius is 82 ft.
There will be 25 stations, yielding an average spacing of 0.6 mi. In the downtown segment, station spacing will be only 500 ft to 800 ft, and the longest station spacing throughout the line will be about 1. 7 mi and will occur in the grade-separated segment. Station platform length will be approximately 200 ft, and platform height (for boarding) will be low level, approximately 8 in. from top of rail at all stations. There will be island platforms and left-hand, right-hand, near-side, and far-side platforms depending on ROW conditions. A self-serv ice fare collection system with off-vehicle validation is planned. Accessibility for handicapped persons will be provided by a wayside lift, which will be mounted on each station platform and will raise from platform level to LRV floor level.
The cost estimate for the overall Banfield LRT project is approximately $308 million and the transit portion is approximately $207 million. The vehicle contract represents approximately 12 percent of the total transit portion. As of April 1985, the project is 95 percent committed and nearly 70 percent expended. Opening for revenue service is planned for the fall of 1986.
LRV PROCUREMENT
As the Banfield LRT project began to move from the planning stage to federal project approval, a determination was made by Tri-Met that procurement of the LRVs should receive a high priority in the overall schedule. LRV procurement was expected to be the single largest dollar amount contract in the entire project, and an early execution of that contract was sought in order to serve as a forcing function for the rest of the project.
Predesign studies, wayside conditions, and operational preferences had determined the basic type of vehicle to be procured--a large, articulated, double-sided and double-ended car--and in early 1980 Tri-Met, with the assistance of the consulting firm of Louis T. Klauder and Associates, embarked on a process to procure the LRVs and related equipment and services. Tri-Met sought a procurement that would be competitive, conform to UMTA regulations, and yield an LRV based on proven design. After research of then-existing and planned rail car procurements, Tri-Met elected to use the now familiar two-step procurement process.
The first step of the process included issuance of a performance-oriented request for technical proposal (RFTPl by Tri-Met. submittal of technical proposals by interested proposers, and evaluation of those proposals and determination of acceptable proposals by Tri-Met. The technical proposals contained no prices or references to prices.
The second step included issuance of the invitation for bid (IFB) by Tri-Met only to acceptable proposers, submittal of bids, award of contract by Tri-Met to the lowest bidder, and contract performance.
Before the RFTP was officially released, an extensive industry review was conducted and comments were received from numerous car builders. Four proposals were eventually received, and after a 4-month evaluation two were found acceptable. These were from Bombardier of Canada and Siemens of the Federal Republic of Germany. Proposals were evaluated on two principal bases:
• Management arrangement and qualifications of the proposer, and
• Technical merits, proven design, and suitability of proposed LRV for Tri-Met's requirements.
TRB State-of-the-Art Report 2
In addition to rail car manufacturing experience, a prime consideration in evaluating the proposer was continuity from design to fabrication. Licensing arrangements were permitted, and even encouraged, as long as they offered a sufficient degree of designer review and authority over fabrication and thereby increased conformity to proven design and reduced untested design deviations.
The number of vehicles required by the contract was fixed at 26 for all bidders. This number was based on passenger loading projections, vehicle performance, expected vehicle size, and other factors. It was acknowledged and accepted that there could be small variations in passenger-carrying capabilities among the bidders, but such variations were minor.
Bids were received from Bombardier and Siemens in May 1981, and Bombardier offered the low bid as follows:
Price for 26 LRVs at $775,521 each
Spare parts, tools, training, and technical support
Total bid price
$20,163,546
l ,<198,666 $21,662,212
Contract provisions additionally allowed for escalation according to u.s. Department of Labor indices and specified formulas. Contract award was made in September 1981.
DESIGN AND FABRICATION PLAN
Bombardier, Mass Transit Division, of Quebec, Canada, is Tri-Met's contractor for the supply of the 26 LRVs, specified spare parts, manuals, training, and technical services. One requirement of the RFTP process was that the management arrangement for the contract be unambiguous, and such has been the case. From Tri-Met's point of view, all matters pertaining to the contract--whether design, fabrication, performance of subcontractors, or adherence to contractual terms and conditions--are solely the re~pnnc:d hi l i ry ni= "Anmh::arAic.r.
For the Tri-Met contract, Bombardier is operating under a license from the Belgian firm of Constructions Ferroviaires et Metalliques, conveniently known as BN. BN is the overall designer of the Portland LRV, particularly the car body structure and trucks. In addition, under separate contracts, BN acts as a subcontractor and supplies Bombardier with certain components such as the truck frames, articulation. door panels, and gearbox assemblies. For the Portland car, Bombardier elected to assume certain design responsibilities such as interior finishing and car wiring to a greater degree than it had done before on other contracts.
The Portland LRV is basically a stretched and otherwise modified version of the pre-Metro cars built (partially) by BN for Rio rlf' ;ranPi ro in thf' 1970s. Truck and articulation design are derived from the Rio car and from other BN designs such as those for the Manila LRV.
Propulsion system design and supply of hardware are by the Brown Boveri Company (BBC) of Switzerland through its North American subsidiary. The Portland traction motor is based on the BBC motor for the Breda LRVs in Cleveland, although there are significant differences. The switched resistor propulsion control system is based on that of certain Swiss railways, particularly the Sankt Gallen-Appenzeller (SGA) railway.
Several other components (pantograph, door operators, slewing ring, suspension, and so forth) are French or German in design and manufacture, making
Portland LRV
the Portland LRV overall very much European in orig in. This transfer of European technology to the North American setting has sometimes exposed philosophical differences and otherwise made life interesting.
Major car body subassemblies such as the roof, side walls, and parts of the underframe were fabricated at Bombardier plants in Quebec. Originally, Bombardier proposed to assemble the car shell at its main plant in La Pocatiere, Quebec, before shipment to a new plant in Barre, Vermont, for equipment installation and final assembly. However, early in the contract a.ombardier proposed and Tri-Met agreed to allow underframe and shell assembly also to occur in the Barre plant. Welding capabilities had to be significantly upgraded at Barre and brought to American Welding Society (AWS) standards because significant structural assembly work had never been done in that plant befor e .
All equipment installation, car wiring, interior finishing, painting, final assembly, and static tes ting are accomplished at the Barre plant. Trucks are also assembled and wired there.
However, Bombardier's main engineering forces are located in Quebec, and in the author's opinion this physical separation of engineering and production is at best tolerable and at worst detrimental to the smooth production of such a complicated piece of equipment as a modern LRV.
In the final analysis, design of the Portland LRV has been shown to be less proven than anticipated at the proposal stage and although applicable exper ience of the manufacturer at a corporate level has been adequate, unforeseen learning curve problems have been persistent at the actual production plant. These problems may be due to insufficient transfer of experience from plant to plant.
MAJOR CONTRACT MILESTONES
As previously stated, the contract was awarded in September 1981. Fabrication of the first underframe was started at Barre in the fall of 1982, and the first shell assembly was put together in December 1982. The first car was articulated in the spring of 1983, and the car body strength test was performed in Ontario, Canada, in June 1983. Trucks were set under the first car in the fall of 1983, and Car 101 was first moved under its own powe r in November 1983. Table 2 gives a summary of the major LRV contract milestones.
By mutual agreement between Bombardier and TriMet, two of the first cars (101 and 103) were sent to the Transportation Test Center (TTC) in Pueblo,
TABLE 2 LRV Contract Milestones
Date
September 1980 December 1980 March 1981 May 1981 September 1981 October 1982 December 1982 Spring 1983
June 1983 Fall 1983 November 1983 December 1983 April 1984 August 1984 September 1984 Fall 1985
Milestone
Request for technical proposals issued Technical proposals received Acceptable proposals determined Bid Contract signed 1st underframe fabrication started 1st shell assembled 1st articulation, undercar equipment, and interior
equipment installed Car body compression test performed 1st trucks installed Car IO I moved under its own power Car IO I shipped to TTC for dynamic testing 1st car (103) arrived in Portland via TTC !st car (I 02) arrived directly from Barre LRV testing started Delivery completed
179
Colorado, for proof-of-design testing during the period December 1983 through March 1984. Car 103 continued to Portland and was the first LRV to arrive in April 1984. Car 101 was returned to a newly completed test track at the La Pocatiere plant for further testing. Car 102 was the first LRV shipped directly from Barre and it arrived in August 1984. Testing in Portland has been under way since September 1984.
As of April 1985, thirteen cars (half the order) are on site in Portland, seven cars are substantially assembled in Barre, and all car shells are completed.
Delivery of all 26 cars is now planned for the fall of 1985 or about 1 year behind the original schedule.
LRV DESCRIPTION AND PERFORMANCE
The Portland LRV is a six-axle, single articulated car that is double s ided and double ended. There are four double-wide, low-level doors per side. The car is approximately 89 ft long, 8 ft 8 in. wide, and 90,000 lb in weight (empty). There are 76 seats and room for 90 standees (at 4 people per square meter) for a design capacity of 166 passengers. Crush capacity is 256 passengers total. Table 3 gives a summary of the major LRV system requirements.
TABLE 3 LR V System Requirements
General type of car
Length Width Empty weight Seats Standees Minimum horizontal radius Dynamic clearance Overhead voltage
Track gauge Acceleration
Top speed Normal service deceleration
Dynamic brake failure
Emergency brake Jerk limit Slip/spin efficiency
Noise
Requirement
6-ax!e, single articulated double-sided, double-ended, 4 low-level doors per side
89 .14 ft over coupler faces 8 ft 8 in. 90,000 lb± 3% 76 90 minimum at 4 persons per square meter 82 ft 5 ft 7 in. from track centerline on tangent track 750 V DC nominal 525 to 875 V DC operating range 4 ft BY, in. 3 .0 mph/sec± 5% at A WO to A W2 JO sec to 25 mph 40 sec to 50 mph Constant performance from 600 to 825 V DC 55 mph 3.0 mph/sec± 5% at A WO to A W3 from 45 to
5 mph Complete service run at 30 mph limit with 3.0
mph/sec ± I 0% 4 mph/sec to 6+ mph/sec average 3.0 mph/sec squared maximum 40% in acceleration and 7 5% in deceleration per
specified procedure 70 dB(A) to 7 5 dB(A) per specified conditions
The car is designed for single-unit or multipleunit (MU) operation in consists of up to four LRVs. Tri-Met has tested no more than two-car consists to date.
The track gauge is standard 4 ft 8 1/2 in. and the overhead voltage is 750 V DC nominal. The LRV operating range is 525 to 875 V DC.
The required minimum horizontal curve radius is 82 ft, and the minimum vertical curve radius is from 200 to 300 ft depending on whether crest or sag conditions apply.
The car body is constructed of low-alloy, high tensile strength (Carten) steel. Spot welding is primarily used for fabrication of the side walls and roof; construction of the heavier underframe and the shell assembly uses metal inert gas (MIG) welding techniques.
180
The floor structure includes corrugated sheet metal, treated plywood, and rubber flooring and has successfully passed the flammability requirements of an ASTM-Ell9 test. The seats are cushioned on stainless steel frames, and the interior uses melaminetype panels with some fiberglass sections.
The trucks are welded steel structures from BN with rubber primary and secondary suspensions, inboard bearings, one brake disc per axle, and resilient wheels. The primary suspension is a rubber toroid (doughnut) from Clouth, and the secondary suspension is an inverted chevron with alternately stacked plates of rubber and metal. The resilient wheels are from Penn Machine/Krupp and have a tire and hub separated by rubber blocks in compression to reduce wheel squeal on sharp curves. The center truck is not powered and is freewheeling. The motor truck is a monomotor design with a right-angle drive on each end, and the motor trucks are interchangeable. A flexible coupling from BBC-Secheron (BBC) connects the gearbox to the axle. A single-race ball bearing slewing ring attaches the motor truck bolster to the car body, and the center truck uses a double-race slewing ring to permit both car halves to rotate relative to each other and to the truck.
The BBC traction motor is a four pole series DC motor with a continuous rating of 198 kilowatts and 280 amperes at 750 V DC and 1,780 rpm. The motor is self-ventilated.
The BBC propulsion control system employees a switched resistor arrangement with contactors controlled by an electronic control unit (ECU). There is no mechanical cam. The ECU is located in an underseat compartment in the interior of the car. The operator's handle or master controller has six distinct positions (rates) for motoring, six distinct positions (rates) for braking and coasting, and three positions to set maximum speed particularly for downhill operations. There are a maximum of 54 steps in motoring and 33 in braking, making for a relatively smooth ride without much notice of notching. Parallel operation of the motors is permitt~d in the two highest positions in motoring. Braking and accelerating resistors are roof mounted. A unique feature of the BBC control system is its rate feedback ----L-- ..,., __ ----L-- .L-.!-- .L- --.L.!-~-- .LL- --.L- -------•-::::i,Yt:H~t::llle .l.Ut:: ;oy::H .. t::111 l...L.1.t::b l..U OQl..1.b.LY l.Ut:: l.Ql.t:: 1.t::':1.Ut::l::H ..
from the master controller handle regardless of vehicle load or wayside conditions (e.g., grades). Thus there is no explicit load-weigh input for normal service propulsion control; instead the system uses the measured vehicle acceleration (deceleration) rate in a feedback loop as an implicit indication of passenger load.
Top speed of the LRV is 55 mph with an overspeed control set ~t 58 mph.. ThG m~~imurn acceleration is 3.0 mph per second and the car is required to reach 50 mph in 40 sec. Testing at TTC and Portland has indicated compliance with these requirements.
New York Air Brake (NYAB) provides the friction brake system that features a spring-applied, hydraulically released disc brake on each axle and tr;ir.k hr;ikPR nn e;ir.h tr11c:,k fnr use in 11m11rg11m:y stops. The disc brake system uses one pump and control valve per truck for redundancy and minimization of car plumbing. These three control units are car body-mounted, underfloor, and adjacent to their respective trucks.
Service braking is provided by dynamic braking on the motor trucks and supplemental disc braking on the center truck if necessary (for passenger loadi!!t;,::; :!bt:",!'!I .::.prrnvim;:at-c1u AW2) _ nyn::1mir :!!!d di:~ brakes are also fully blended on the motor trucks both during the initial instant (1 sec) of braking so the faster hydraulic can assist the slower electric brake and during the fade-out of the dynamic brake below approximately 5 mph. The maximum service
TRB State-of-the-Art Report 2
brake rate is 2.5 mph per second from 55 to 45 mph and 3.0 mph per second from 45 to 5 mph for vehicle weights from AWO to AW3 (211 passengers). Testing at TTC and Portland indicate compliance with these requirements. Both motoring and braking are protected by a spin/slide system that slows or reduces notching and dumps sand at the leading motor truck axles if necessary. The friction brake system is required to act as a backup and be able to meet a specified performance in the event of dynamic brake failure with a reduced top speed (30 mph) allowed.
Emergency braking is provided by disc braking on all trucks, track brakes, and automatic sanding. Spin/slide and jerk limit features are not present during emergency braking. A 4.0 mph per second to 6 mph per second rate depending on entry speed is required during emergency braking. Because propulsion ( rate) control is effectively disabled during emergency braking, a separate load-weigh system is used to modulate emergency brake rate as a function of vehicle load.
Safety electric provides a 10 kw DC-to-DC converter which changes the 750 V DC input to a minimal 37.5 V DC output. This solid-state unit acts as a battery charger and in parallel with a McGraw NiCad battery provides the basic low voltage supply for various uses throughout the car. In addition to this 37.5 V DC supply, some systems (e.g., headlights or train radio) use dropping resistors or other converters to step the voltage down to 24 V DC or 12 V DC. The Seleg Corporation provides a solid-state inverter that uses the 37. 5 V DC supply as input to create 120 V AC output to power the interior lighting, heating and ventilation (H&V) fans, and convenience outlets.
The door system is a swing plug design much like that on the General Motors Advance Design Bus and is provided by Faiveley of France, which also provides the pantograph. The door operator design is relatively new and is still under test. The train operator can control (open and close) the doors or "enable" the doors, which allows them to be opened locally by passengers pushing pushbuttons inside or outside the car. Separate control of the doors adjacent to the active cab is provided for use with the wayside lift.
Dellner of Sweden provides the fully automatic coupler that features a cantilever suspension, retractable electric heads, and a self-centering mechanism. Manual coupling, coupling on curves, and electric isolation are also provided.
Passenger compartment heating operates off the 7 50 V DC overhead supply and is protected by air flow switches and over-temperature devices. The H&V unit is mounted on the roof near the front of the car on each body half. A separate 750 V DC heaterblower unit is provided in each cab. Air conditioning was not required.
Each cab has a fully equipped communication system with radio to and from Central Control, public address (interior and exterior), intercom with other cabs, and radio from Central Control to public address. Provisions have been made for a passenger intercom to the train operator if the situation warrants in the future.
Cab controls are hand contLols with the exception of the sander.
Certain portions of the Banfield LRT line will have track circuits and a block signal system with wayside signals protected by an automatic trip stop (ATS) system. The ATS system uses wayside permanent magnets and on-board antennas mounted on the center truck. Violation of a red signal can automatically bring the LRV to a stop at maximum service brake and index a counter.
Portland LRV
The Portland LRV also carries a solid-state data recorder, purchased separately by Tri-Met and installed by Bombardier, that continuously records certain train-line input signals for purposes of testing, operator surveillance, and accident documentation.
IMPORTANCE OF SPECIFICATION
Car design and cost control measures begin at the specification stage, and there are obviously many dimensions to the importance of the effect of the specifications on design and cost of rail transit vehicles. A good specification does not a good car make, nor does a poorly written, weak, ambiguous, or incomplete specification guarantee equipment fraught with problems. However, in the authors' opinion the transit authority, consultant, and eventual customer can exert their greatest influence on the overall costliness of the car as a function of the contract documents developed.
One of the first major decisions to be made in the procurement process is the type of procurement documents or specification to be used. This decision is influenced by the competency of the transit operator or procuring agency, the involvement of consultants, and the transit environment in which the procurement takes place. In the authors' opinion, a basic distinction exists between the conditions present for a "new start" system such as the Banfield LRT project and those for an existing rail transit property involved in rehabilitation or expansion.
For the new start system, historical constraints are not so prevalent. Obviously greater flexibility exists in defining technical requirements because there are no restrictions such as compatibility with existing equipment or need to couple with existing transit cars. To some extent vehicle-wayside interface can even be designed in concert. Thus a twostep, performance-oriented specification is a logical approach for a new start system, and such was Tri-Met's rationale in 1980 when the LRV procurement process was begun.
For an existing rail transit property with considerable experience and, probably, some equipment prejudices, a strictly performance-oriented specification may not be suitable. It may be more desirable and cost-effective in this case to specify hardware preferences in order to reinforce revenue-proven experience, to reduce spare parts inventory, and to promote interchangeability with existing equipment.
There are of course advantages and disadvantages to both the performance-oriented specification and the hardware specification. Too much flexibility could promote a tendency for experimentation and under reliance on proven hardware, and hardware dictates could promote ill effects from monopolies or retard innovation. Determination of the appropriate overall balance is probably best done on a case-bycase basis, and development of guidelines is beyond the scope of this paper except for the major premise that new start properties are probably best served by inclination toward performance-oriented specifications, with the caveats discussed hereafter.
Another major decision to be reached early in the procurement process and one which can obviously be contributory to the high cost of rail transit cars, particularly of LRVs, involves the uniqueness of the requirements, particularly general requirements such as car size, brake equipment, and door type. There has been for several years a tendency on the part of transit authorities to customize their major technical requirements. This tendency has been present not only in North America but also in Europe. For exist-
181
ing properties, this tendency is mostly understandable, but new start properties often make decisions to specify or allow certain types of equipment in combination with certain general car characteristics in lieu of actual proven interfaces. In many cases, virtually identical detailed performance requirements appear throughout several recent specifications, yet general requirements are often relatively widely variant. Whatever the actual reasons, the result, in a broad sense, is that in the last 10 years there has been a proliferation of different kinds and types of LRVs, in the United States and abroad, and little standardization despite the UMTAfunded attempt at such during the late 1970s.
In the spirit of the performance-oriented specification, the RFTP for the Portland LRV was permissive in many areas yet specific in others. For example, for the friction brake system, a hydraulic, an air, or an electric system was permitted with primary emphasis placed on meeting the performance requirements. The auxiliary power supply requirements allowed either rotating or static equipment. On the other hand, only a relatively small range of vehicle sizes was permitted, as opposed to specifying system carrying-capacity without regard for individual vehicle size, with the intention of forcing car builders to a common size and thus a common basis for bid. Also Tri-Met allowed only a switched resistor control system because of cost and complexity considerations.
Contractual terms and conditions are of course important specification-related elements that affect car costs. In the Portland procurement, there was a consistent attempt through the bid stage to inject specificity in the bid requirements and to reduce elements of risk for bidders. Mechanisms for these goals included requirement for the same number of LRVs of approximately the same size, development of a common spare parts list within the umbrella of differing allowable equipment, and inclusion of an escalation clause to compensate for effects of inflation over a multi-year contract. These goals of bid commonality (i.e., car size) and reduction of risk were held paramount even to that of allowing only identically proven equipment.
Although admittedly limited, Tri-Met's experience to date with the performance-oriented specification suggests that a desirable insurance for a transit authority is to include greater not lesser specificity in its requirements. Such specificity should not be limited merely to common performance parameters such as acceleration rate and top speed but should include applicable standards for materials, quality control, test procedures, and measurement techniques. More hardware specificity, not by brand name or manufacturer's name but by generic type, would have been desirable in the Portland specification. Sometimes seemingly minor i terns in a specification, or lack thereof, have ways of becoming important production or maintenance problems in the future. For example, specification of simple fasteners appears to not be exactly consistent with the loftier goals of a purely performance-oriented specification, is tedious to do, and is difficult to enforce. Yet mechanical fasteners and electrical terminations literally hold a car together and their importance should not be overlooked in any type of specification.
The authors do not presume to be able to draw conclusions about the effects on cost control of the level of specificity of technical requirements contained in the procurement documents. Too many factors are involved. As a general rule, however, the more specific and known an item or requirement is, the less controversial it will be and, possibly, the less costly after the fact. Both car builder and
182
customer have less room for preferential interpretation.
SERVICE-PROVEN EQUIPMENT AND FACILITIES
In addition to the need for a clear and concise procurement document, the authors cannot overemphasize the importance of service-proven equipment i proven system interfaces particularly propulsion and brake and trucksi and, where possible, completing the assembly in an experienced and well-equipped facility. Each of these elements has significant impacts on car builder costs and final capital and operating and maintenance costs to the operator.
There is little question that a number of "offthe-shelf" designs, each capable of performing equally and of equal quality, would offer the ideal LRV procurement climate, However, in Portland as well as other current and prospective procurements such as San Jose, Sacramento, and Los Angeles-Long Beach there is not one car that can meet all of the requirements without some modification. This is due in part to local preference, state law (such as California Public Utilities Commission, General Order 143), and federal law (Buy America). Inevitably, it appears that there is almost always a struggle in the beginning of the procurement process between modification to the demand (i.e., the specification) and modification to the supply (i.e., truly service-proven equipment).
Because it is probable that the ideal case or perfect marriage between supply and demand can rarely happen, the operating property should attempt to use, and insist on the use of, a maximum number of service-proven systems while seriously reviewing its site-specific requirements for consistency with the available marketplace. Benefits to the operating property from reliance on service-proven systems include
• Known service history and repair procedures; • Equipment similar or identical to that of
other properties, which increases the possibility of parts availability in the long run;
• Potential for borrowing or sharing hardware if a crisis arises; and
• Lower end cost where new tooling and designs are not required.
The car builder, on the other hand, has a known quantity to integrate into the overall car and thus reduces his risk and cost, provided that such service-proven equipment is not excluded by the specification or provided that less expensive unproven equipment is not allowed.
On the basis of Tri-Met's recent experience, the authors would recommend taking this philosophy one step further, where possible, by insisting that systems with direct interfaces have been previously operated toqether.
As an example, two critical problems occurred in
TRB State-of-the-Art Report 2
Portland as a result of using a new brake design or at least a derivative of an existing design that required substantial modification for the Portland application. The first occurred in the fitting of the brake equipment to the truck where physical interferences caused mounting and, later, operating problems. The other occurred when the propulsion supplier and brake supplier, who had no previous working relationship, experienced some mutual learning curve and coordination problems resulting in some delays to the car builder. The intent in citing these problems is not to point fingers but to illustrate by example the potential pitfalls of unproven interfaces. These problems have been responded to by all parties.
As a result of "Buy America" or local preference, many cars are being partially assembled in one facility with final assembly elsewhere. Although this practice is desirable in some cases and required in others, experience shows that it can be the source of problems and costs both for the car builder and for the operating property. In the Portland case, the car builder was allowed to transfer some of the work intended to be done in a facility with the most experience and know-how to a brand new, inexperienced facility and staff. Two major problems occurred: First, the skills required to do certain functions had to be learned and acceptability verified by test. This comes at the expense of the car builder or the authority, or both. Second, language or differences in standards, or both, create problems that would not have otherwise existed.
Further, the "secondary facility• may not be equipped to provide the testing facilities needed including water test rigs, testing equipment, and test tracks. As previously mentioned, this situation may also move much of the actual assembly away from the engineering design and support group. If anomalies occur, the reaction is slower and may require engineering staff and "expert" laborers to be temporarily transferred to the other site to rectify problems.
Finally, in the case of small orders, when one or two inspectors can handle the complete order, the nuorli:rip in wnrll' in .. wn ,f::i,,-.;li .. iog gonor::iolly roq11iroc
increased staffing. In retrospect, given the time between scheduled
delivery and revenue service of the line and the problems that have occurred, Tri-Met might have been better served had it required a production prototype before commencing the fabrication of the fleet. This approach would have allowed for in situ design review and test, and modification where required, to only cne car T The ::-emai~dcr of the production co~ld be expected to proceed more expediently.
This approach can only be considered when schedule and resources permit and requires a protracted and probably expensive process on the part of the car builder to obtain and assemble single-item units. In theory the prototype car is highly attractive but in practice, in a small procurement such as Tri-Met's, it is an expensive proposition.
Energy Cost Considerations in Light Rail Vehicle Size Specification Steven E. Polzin Dallas Arca Rapid Transit Dallas, Texas
The purpose of this paper is to encourage the consideration of vehicle energy consumption in the specification of light rail vehicle size. Although the prospect of uneconomic operation of large light rail vehicles has been acknowledged in previous writings, this paper documents the situation in Cleveland and postulates a scenario that could provide some advantages (1,2). In a more general sense it is hoped that this - discussion and the empirical evidence it draws on will create a better understanding of the energy use levels and cost associated with light rail operation. Admittedly, several other considerations including labor costs, fleet compatibility, procurement costs, right-of-way geometrics, and aesthetics are the major determinants in vehicle choice decisions. Nevertheless, energy use and energy operating cost should play a role in this important decision. The ability to economize on power bills is premised on the ability to provide more energy efficient vehicle design or to provide adequate service capacities with a smaller, more efficient vehicle. The prospects of a smaller vehicle size providing operating economies will be reviewed.
MOTIVATION
The concern about light rail vehicle energy use is motivated by the empirical data collected in Cleveland, Ohio, that shows substantial deterioration in vehicle miles per kilowatt hour of energy use since light rail vehicles (LRVs) replaced Presidents' Conference Committee (PCC) vehicles. This evidence gives rise to a number of concerns. The rail mode, particularly light rail, has claimed as a virtue its energy efficiency relative to automobiles and buses. This claim has contributed to some strong political and public support for rail system construction and renovation. Failure to accomplish this objective not only results in lost benefits but undermines the credibility of the industry.
It is increasingly difficult to make claims about rail energy efficiency because of changes in both light rail performance and in automobile energy use performance. Energy efficiency of the light rail mode has been dropping as a result of vehicle changes. These changes, such as vehicle weight increases, have provided benefits in terms of ride quality and safety and increased performance capabilities. Likewise, passenger amenities (heating, lighting, and air conditioning) have been improved to attract or hold passengers. One of the trade-offs
of this has been the tendency for energy use per vehicle-mile and per seat-mile to increase. These trends are a reversal of the historic changes in light rail vehicles during the 1920s when weight, riding comfort, and performance were sacrificed for economy.
The automobile, on the other hand, has shown a relatively dramatic energy use performance improvement during the past 10 years. Automobile vehicle weight per passenger seat has come down dramatically, and technological changes have provided significant fuel efficiency gains. These contrary trends have resulted in a situation in which energy use performance of rail vehicles is now subject to far less favorable comparisons with the competing highway and automobile mode. This is particularly true, if the attained operating performance of the light rail mode, not its theoretical performance capabilities, is considered.
Of even greater concern is the prospect that light rail vehicles being procured now will be in competition with automobiles purchased in the next century. The much larger automobile market provides a greater opportunity to develop and implement technologies that improve vehicle operating efficiencies. Furthermore, the shorter vehicle life (compared to rail vehicles) means improvements can be implemented faster.
The Cleveland situation exemplifies the potential problem. The fleet of light rail vehicles put in service in 1982 operates 1,075,000 vehicle-miles per year under the current schedules. With a projected vehicle life of 1.5 million mi and a 48-car fleet, these vehicles could be expected to be operational until the year 2050. The operating performance of automobiles in service at that time is a matter of speculation.
EMPIRICAL PERFORMANCE DATA
This discussion relies on data from the Greater Cleveland Regional Transit Authority's Blue and Green (Shaker) light rail lines. The data contrast the performance of PCC vehicles operated until the early 1980s with that of the articulated light rail vehicles (LRVs) put in service in 1982. It is important to acknowledge several characteristics of the Cleveland operation that may make it inappropriate to broadly generalize these results. However, the general findings indicate that other agencies may
183
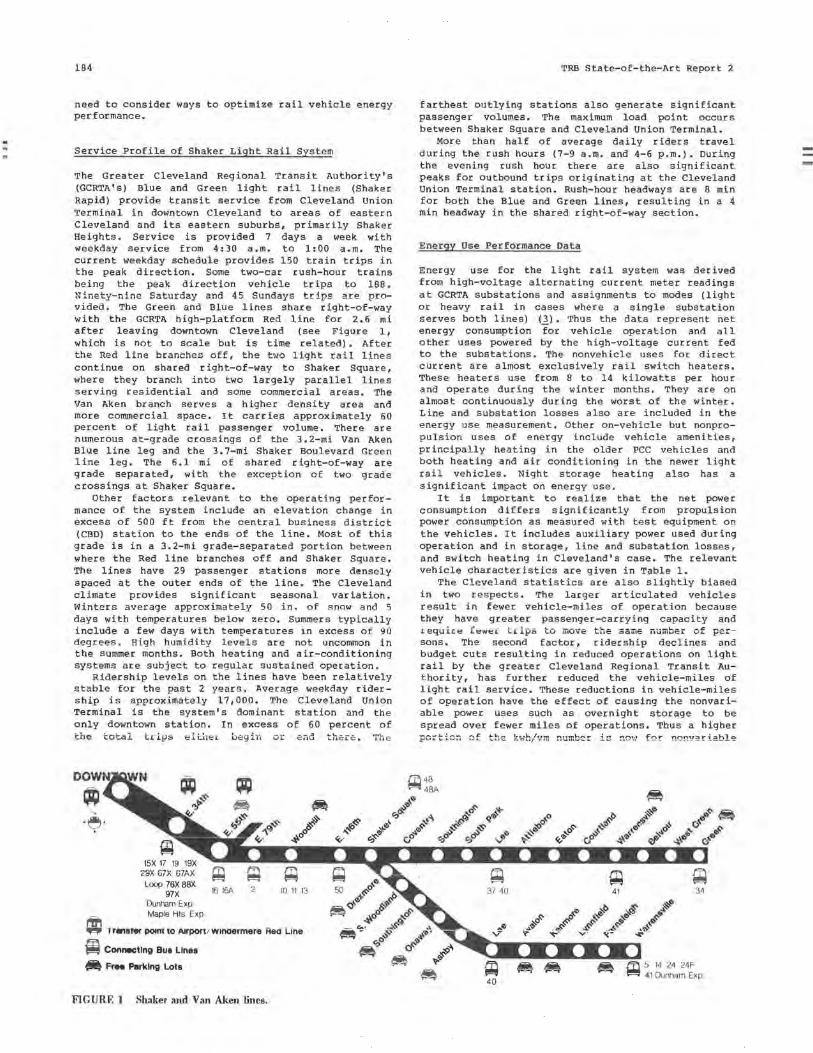
184
need to consider ways to optimize rail vehicle energy performance.
Service Profile of Shaker Light Rail System
The Greater Cleveland Regional Transit Authority's (GCRTA' s) Blue and Green light rail lines (Shaker Rapid) provide transit service from Cleveland Union Terminal in downtown Cleveland to areas of eastern Cleveland and its eastern suburbs, primarily Shaker Heights. Service is provided 7 days a week with weekday service from 4:30 a.m. to 1:00 a.m. The current weekday schedule provides 150 train trips in the peak direction. Some two-car rush-hour trains being the peak direction vehicle trips to 188. Ninety- nine Saturday and 4 5 Sundays trips are provided. The Green and Blue lines share right-of-way with the GCRTA high-platform Red line for 2.6 mi after leaving downtown Cleveland (see Figure 1, which is not to scale but is time related) • After the Red line branches off, the two light rail lines continue on shared right-of-way to Shaker Square, where they branch into two largely parallel lines serving residential and some commercial areas. The Van Aken branch serves a higher density area and more commercial space. It carries approximately 60 percent of light rail passenger volume. There are numerous at-grade crossings of the 3. 2-mi Van Aken Blue line leg and the 3.7-mi Shaker Boulevard Green 1 ine leg. The 6 .1 mi of shared right-of-way are grade separated, with the exception of two grade crossings at Shaker Square.
Other factors relevant to the operating performance of the system include an elevation change in excess of 500 ft from the central business district (CBD) station to the ends of the line. Most of this grade is in a 3.2-mi grade-separated portion between where the Red line branches off and Shaker Square. The lines have 29 passenger stations more densely spaced at the outer ends of the line. The Cleveland climate provides significant seasonal variation. Winters average approximately 50 in. of snow and 5 days with temperatures below zero. Summers typically include a few days with temperatures in excess of 90 degrees. High humidity levels are not uncommon in the summer months. Both heating and air-conditioning systems are subject to regular sustained operation.
Ridership levels on the lines have been relatively stable for the past 2 years. Average weekday ridership is approximately 17,000. The Cleveland Union Terminal is the system's dominant station and the only downtown station. In excess of 60 percent of the total tc.i.ps eii:.her begin or --~ e-uu
15X 17 19 2SX 37X G7AX Loop 76X 8BX
97X Dunham Exp
16 16A 2 10 11 13
Maple Hts Exp
~ I ranarer po1m to Airport! w1naermere Rea Line
~ Connecting Bua Lines .
• FrH Perking Lots
FIGURE I Shaker and Van Aken lines.
.L.1... ---L.il t:Lc::.
~L -.1.U t::
TRB State-of-the-Art Report 2
farthest outlying stations also generate significant passenger volumes. The maximum load point occurs between Shaker Square and Cleveland Union Terminal.
More than half of average daily riders travel during the rush hours (7-9 a.m. and 4-6 p.m.). During the evening rush hour there are also significant peaks for outbound trips originating at the Cleveland Union Terminal station. Rush-hour headways are 8 min for both the Blue and Green lines, resulting in a 4 min headway in the shared right-of-way section.
Energy Use Performance Data
Energy use for the light rail system was derived from high-voltage alternating current meter readings at GCRTA substations and assignments to modes (light or heavy rail in cases where a single substation serves both lines) (J.) • Thus the data represent net energy consumption for vehicle operation and all other uses powered by the high-voltage current fed to the substations. The nonvehicle uses for direct current are almost exclusively rail switch heaters. These heaters use from 8 to 14 kilowatts per hour and operate during the winter months. They are on almost continuously during the worst of the winter. Line and substation losses also are included in the energy use measurement. Other on-vehicle but nonpropulsion uses of energy include vehicle amenities, principally heating in the older PCC vehicles and both heating and air conditioning in the newer light rail vehicles. Night storage heating also has a significant impact on energy use.
It is important to realize that the net power consumption differs significantly from propulsion power consumption as measured with test equipment on the vehicles. It includes auxiliary power used during operation and in storage, line and substation losses, and switch heating in Cleveland's case. The relevant vehicle characteristics are given in Table 1.
The Cleveland statistics are also slightly biased in two respects. The larger articulated vehicles result in fewer vehicle-miles of operation because they have greater passenger-carrying capacity and requir~ f~w~L trips to move the same number cf persons. The second factor, ridership declines and budget cuts resulting in reduced operations on light rail by the greater Cleveland Regional Transit Authority, has further reduced the vehicle-miles of light rail service. These reductions in vehicle-miles of operation have the effect of causing the nonvariable power uses such as overnight storage to be spread over fewer miles of operations. Thus a higher pczticu cf the k~h/vm number is no•,: for nontJ~ri:!.bl~
l 'i"i 48 ~ 4BA
40
34
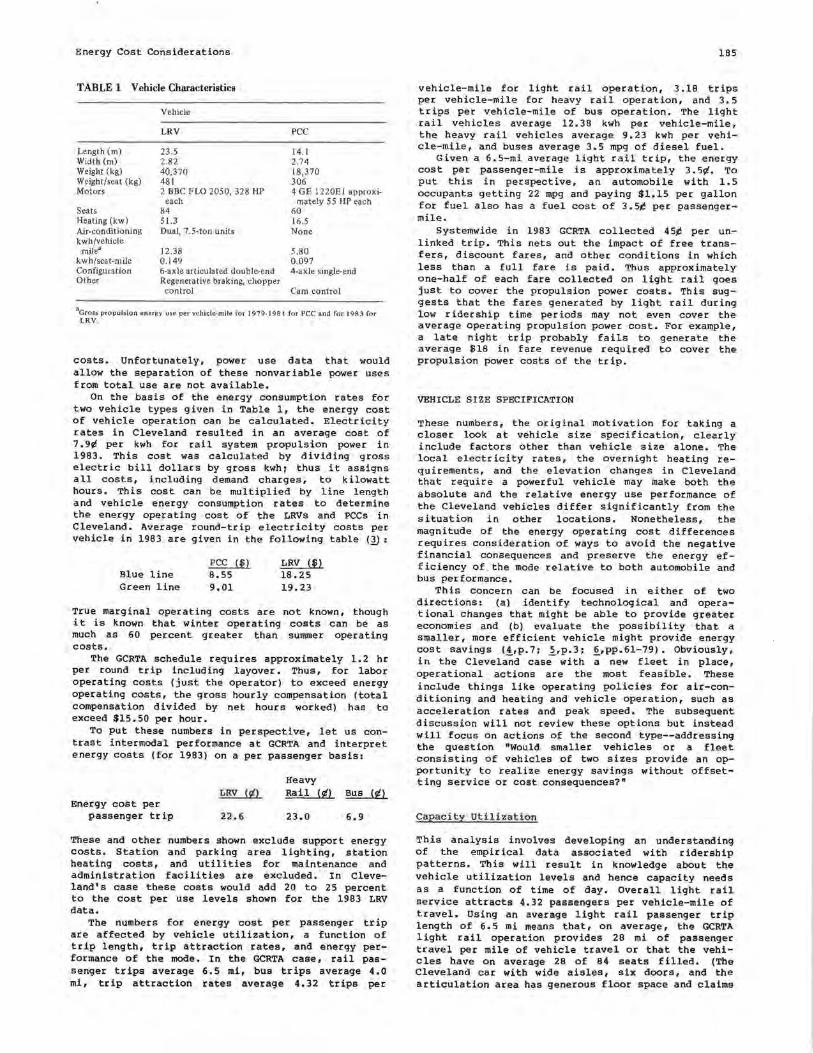
Energy Cost Considerations
TABLE 1 Vehicle Characteristics
Length (m) Width(m) Weight (kg) Weight/seat (kg) Motors
Seats Heating (kw) Air-conditioning kwh/vehicle
mile3
kwh/seat-mile Configuration Other
Vehicle
LRV
23 .5 2.82 40,370 481 2 BBC FLO 2050, 328 HP
each 84 51.3 Dual, 7 .5-ton units
12.38 0.149 6-axle articulated double-end Regenerative braking, chopper
control
PCC
14.1 2.74 18,370 306 4 GE l 220EJ approxi-
mately 5 5 HP each 60 16.5 None
5.80 0.097 4-axle single-end
Cam control
8Gross propulsion energy use per vehicle-mile for 1979-198 l for PCC and for t 983 for LRV.
costs. Unfortunately, power use data that would allow the separation of these nonvariable power uses from total use are not available.
On the basis of the energy consumption rates for two vehicle types given in Table 1, the energy cost of vehicle operation can be calculated. Electricity rates in Cleveland resulted in an average cost of 7. 9¢ per kwh for rail system propulsion power in 1983. This cost was calculated by dividing gross electric bill dollars by gross kwhi thus it assigns all costs, including demand charges, to kilowatt hours. This cost can be multiplied by line length and vehicle energy consumption rates to determine the energy operating cost of the LRVs and PCCs in Cleveland. Average round-trip electricity costs per vehicle in 1983 are given in the following table (l):
Blue line Green line
PCC ($) 8.55 9.01
LRV ($) 18.25 19.23
True marginal operating costs are not known, though it is known that winter operating costs can be as much as 60 percent greater than summer operating costs.
The GCRTA schedule requires approximately 1.2 hr per round trip including layover. Thus, for labor operating costs (just the operator) to exceed energy operating costs, the gross hourly compensation (total compensation divided by net hours worked) has to exceed $15.50 per hour.
To put these numbers in perspective, let us contrast intermodal performance at GCRTA and interpret energy costs (for 1983) on a per passenger basis:
Energy cost per passenger trip
LRV (¢)
22 . 6
Heavy Rail (¢) Bus (¢)
23.0 6.9
These and other numbers shown exclude support energy costs. Station and parking area lighting, station heating costs, and utilities for maintenance and administration facilities are excluded. In Cleveland's case these costs would add 20 to 25 percent to the cost per use levels shown for the 1983 LRV data.
The numbers for energy cost per passenger trip are affected by vehicle utilization, a function of trip length, trip attraction rates, and energy performance of the mode. In the GCRTA case, rail passenger trips average 6.5 mi, bus trips average 4.0 mi, trip attraction rates average 4.32 trips per
185
vehicle-mile for light rail operation, 3 .18 trips per vehicle-mile for heavy rail operation, and 3. 5 trips per vehicle-mile of bus operation, The light rail vehicles average 12, 38 kwh per vehicle-mile, the heavy rail vehicles average 9.23 kwh per vehicle-mile, and buses average 3.5 mpg of diesel fuel.
Given a 6.5-mi average light rail trip, the energy cost per passenger-mile is approximately 3. 5¢. To put this in perspective, an automobile with 1.5 occupants getting 22 mpg and paying $1.15 per gallon for fuel also has a fuel cost of 3.5¢ per passengermile.
Systemwide in 1983 GCRTA collected 4 5¢ per unlinked trip. This nets out the impact of free transfers, discount fares, and other conditions in which less than a full fare is paid. Thus approximately one-half of each fare collected on light rail goes just to cover the propulsion power costs. This suggests that the fares generated by light rail during low ridership time periods may not even cover the average operating propulsion power cost. For example, a late night trip probably fails to generate the average $18 in fare revenue required to cover the propulsion power costs of the trip.
VEHICLE SIZE SPECIFICATION
These numbers, the original motivation for taking a closer look at vehicle size specification, clearly include factors other than vehicle size alone. The local electricity rates, the overnight heating requirements, and the elevation changes in Cleveland that require a powerful vehicle may make both the absolute and the relative energy use performance of the Cleveland vehicles differ significantly from the situation in other locations. Nonetheless, the magnitude of the energy operating cost differences requires consideration of ways to avoid the negative financial consequences and preserve the energy efficiency of.the mode relative to both automobile and bus performance.
Th is concern can be focused in either of two directions: (a) identify technological and operational changes that might be able to provide greater economies and (bl evaluate the possibility that a smaller, more efficient vehicle might provide energy cost savings (_!,p.7; I,p.3; i,pp.61-79). Obviously, in the Cleveland case with a new fleet in place, operational actions are the most feasible. These include things like operating policies for air-conditioning and heating and vehicle operation, such as acceleration rates and peak speed. The subsequent discussion will not review these options but instead will focus on actions of the second type--addressing the question •would smaller vehicles or a fleet consisting of vehicles of two sizes provide an opportunity to realize energy savings without offsetting service or cost consequences?"
Capacity Utilization
This analysis involves developing an understanding of the empirical data associated with ridership patterns. This will result in knowledge about the vehicle utilization levels and hence capacity needs as a function of time of day. Overall light rail service attracts 4.32 passengers per vehicle-mile of travel. Using an average light rail passenger trip length of 6.5 mi means that, on average, the GCRTA light rail operation provides 28 mi of passenger travel per mile of vehicle travel or that the vehicles have on average 28 of 84 seats filled. (The Cleveland car with wide aisles, six doors, and the articulation area has generous floor space and claims
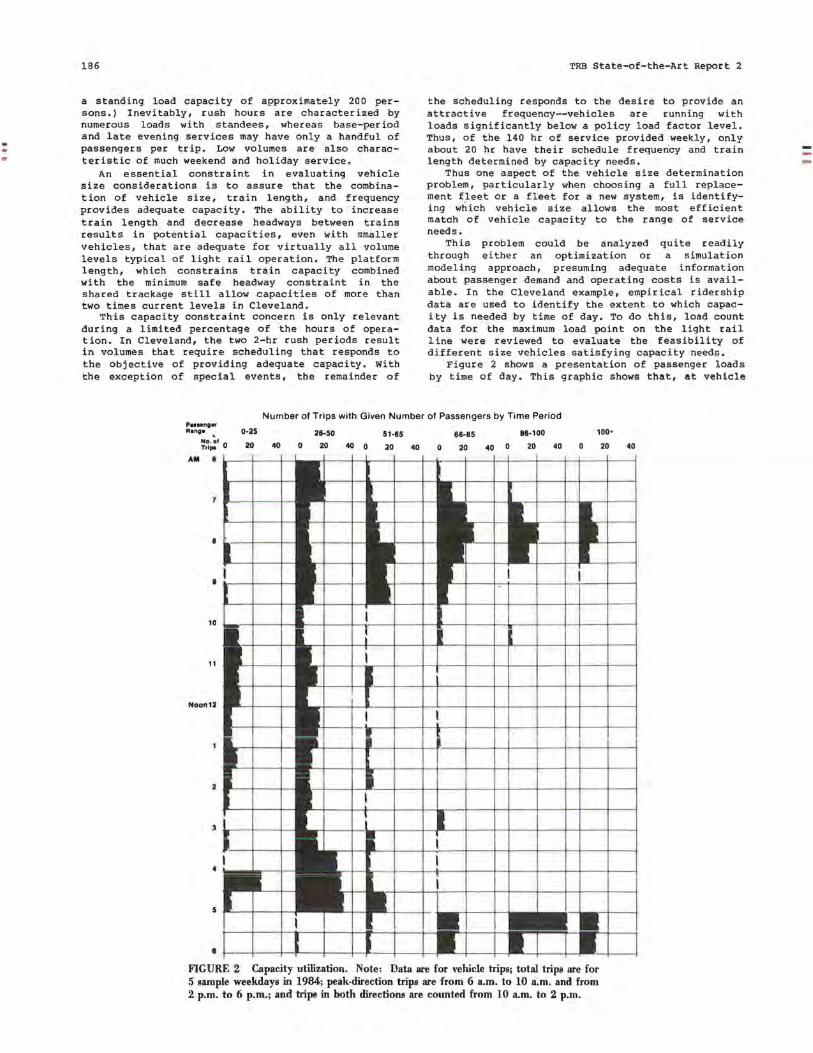
186
a standing load capacity of approximately 200 persons.) Inevitably, rush hours are characterized by numerous loads with standees, whereas base-period and late evening services may have only a handful of passengers per trip. Low volumes are also characteristic of much weekend and holiday serv ice.
An essential constraint in evaluating vehicle size considerations is to assure that the combination of vehicle size, train length, and frequency prov i de s adequate cap acity. The ability to increase train length and d e cre ase headways between trains results in potential capacities, even with smaller vehicles, that are adequate for virtually all volume levels typical of light rail operation. The platform length, which constrains train capacity combined with the m1n1mum safe headway constraint in the shared trackage still allow capacities of more than two times current levels in Cleveland.
This capacity constraint concern is only relevant during a limited percentage of the hours of ope r ation. In Cleveland, the two 2-hr rush periods result in volumes that require scheduling that responds to t he object ive of providing adequate capacity . With the exception of special events, the remainder of
TRB State-of-the-Art Report 2
the scheduling responds to the desire to provide an attractive frequency--vehicles are running with loads significantly below a policy load factor level. Thus, of the 140 hr of service provided weekly, only about 20 hr have their schedule frequency and train leng t h dete r mined by capaci t y needs.
Thus one aspect of the vehicle size determination problem , particularly when choosing a f ull replacement fleet or a fleet for a new system, is identifying which vehicle size allows the most efficient match of vehicle capacity to the range of service needs.
This problem could be analyzed quite readily through either an optimization or a simulation modeling approach, presuming adequate information about passenger demand and operating costs is available. In the Cleveland example, empirical ridership data are used to identify the extent to which capacity is needed by time of day. To do this, load count data for the maximum load point on the light rail line were r eviewed to evaluate the feasibility of different size vehicles satisfying capacity needs.
Figure 2 shows a pre s entation of passenger loads by time of day. This graphic shows that, at vehicle
Number ol Trips with Given Number of Passengers by Time Period Pa11•n1..-Rang• \ 0·25 26-50 51-65 66-85 86-100 100•
~.~;.:' 0 20 40 0 20 40 0 20 40 0 20 40 0 20 40 0 20 40
AM e
•
•
10
11
Noon12
2
3
5
• FlGURE 2 Capacity utilization. Note: Data are for vehicle trips; total trips are for 5 sample weekdays in 1984; peak-direction trips are from 6 a.m. to 10 a.m. and from 2 p.m. to 6 p.m.; and tripe in both directiona are counted from 10 a.m. to 2 p.m.
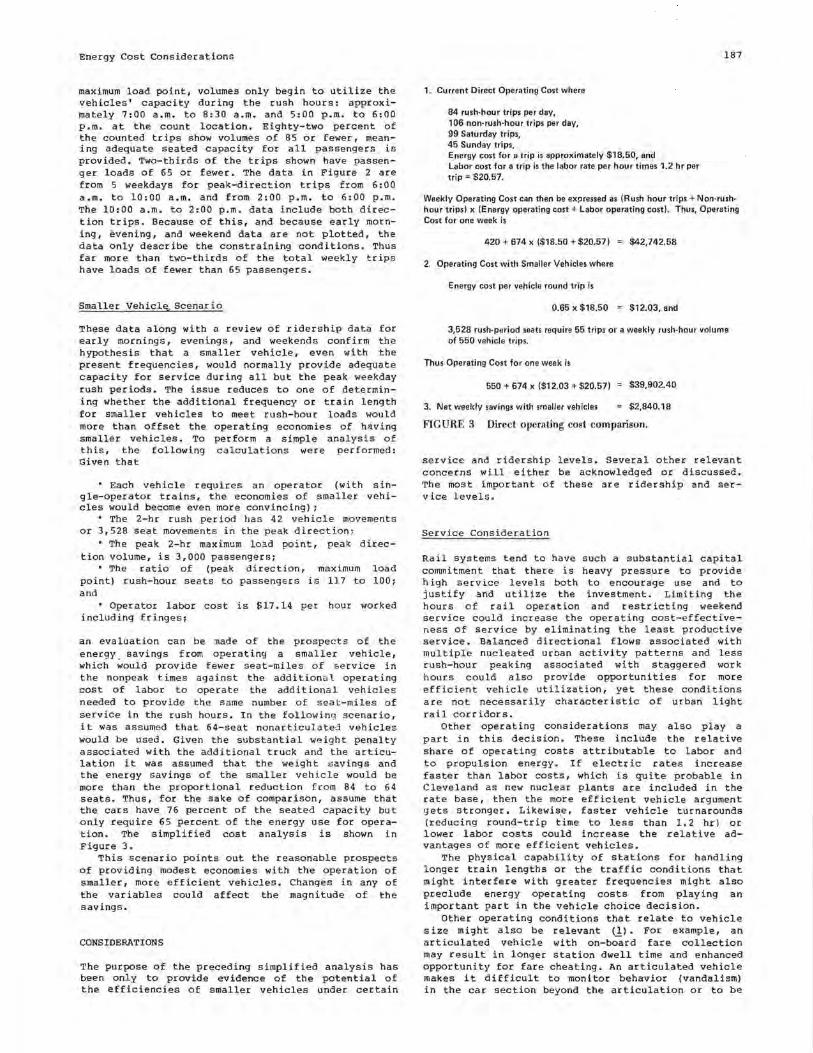
Energy Cost Considerations
maximum load point, volumes only begin to utilize the vehicles' capacity during the rush hours: approximately 7:00 a.m. to 8:30 a.m. and 5:00 p.m. to 6:00 p.m. at the count location. Eighty-two percent of the counted trips show volumes of 85 or fewer, meaning adequate seated capacity for all passengers is provided. Two-thirds of the trips shown have passenger loads of 65 or fewer. The data in Figure 2 are from 5 weekdays for peak-direction trips from 6:00 a.m. to 10:00 a.m. and from 2:00 p.m. to 6:00 p.m. The 10:00 a.m. to 2:00 p.m. data include both direction trips. Because of this, and because early morning, evening, and weekend data are not plotted, the data only describe the constraining conditions. Thus far more than two-thirds of the total weekly trips have loads of fewer than 65 passengers.
Smaller Vehiclit Scenario
These data along with a review of ridership data for early mornings, evenings, and weekends confirm the hypothesis that a smaller vehicle, even with the present frequencies, would normally provide adequate capacity for service during all but the peak weekday rush periods. The issue reduces to one of determining whether the additional frequency or train length for smaller vehicles to meet rush-hour loads would more than offset the operating economies of having smaller vehicles. To perform a simple analysis of this, the following calculations were performed: Given that
• Each vehicle requires an operator (with single-operator trains, the economies of smaller vehicles would become even more convincing);
• The 2-hr rush period has 4 2 vehicle movements or 3,528 seat movements in the peak direction;
• The peak 2-hr maximum load point, peak direction volume, is 3,000 passengers;
• The ratio of (peak direction, maximum load point) rush-hour seats to passengers is 117 to 100; and
• Operator labor cost is Sl7.14 per hour worked including fringes;
an evaluation can be ~ade of the prospects of the energy savings from operating a smaller vehicle, which would provide fewer seat-miles of service in the nonpeak times against the additional operating cost of labor to operate the additional vehicles needed to provide the same number of seat-miles of service in the rush hours. In the following scenario, it was assumed that 64-seat nonarticulated vehicles would be used. Given the substantial weight penalty associated with the additional truck and the articulation it was assumed that the weight savings and the energy savings of the smaller vehicle would be more than the proportional reduction from 84 to 64 seats. Thus, for the sake of comparison, assume that the cars have 76 percent of the seated capacity but only require 65 percent of the energy use for operation. The simplified cost analysis is shown in Figure 3.
This scenario points out. the reasonable P.rospects of providing modest economies with the operation of smaller, more efficient vehicles. Changes in any of the variables could affect the magnitude of the savings.
CONSIDERATIONS
The purpose of the preceding simplified analysis has been only to provide evidence of the potential of the efficiencies of smaller vehicles under certain
1. Current Direct Operating Cost where
84 rush-hour trips per day, 106 non-rush-hour trips per day, 99 Saturday trips, 45 Sunday trips, Energy cost for a trip is approximately $18.50, and Labor cost for a trip is the labor rate per hour times 1.2 hr per trip = $20.57.
187
Weekly Operating Cost can then be expressed as (Rush hour trips+ Non-rushhour trips) x (Energy operating cost+ Labor operating cost). Thus, Operating Cost for one week is
420 + 674 X ($18.50 + $20.57) $42,742.58
2. Operating Cost with Smaller Vehicles where
Energy cost per vehicle round trip is
0.65 x $18.50 = $12.03, and
3,528 rush-period seats require 55 trips or a weekly rush-hour volume of 550 vehicle trips.
Thus Operating Cost for one week is
550 + 674 X ($12.03 + $20.57)
3. Net weekly savings with smaller vehicles
$39,902.40
$2,840.18
FIGURE 3 Direct operating cost comparison.
service and ridership levels. Several other relevant concerns will either be acknowledged or discussed. The most important of these are ridership and service levels.
Service Consideration
Rail systems tend to have such a substantial capital commitment that there is heavy pressure to provide high service levels both to encourage use and to justify and utilize the investment. Limiting the hours of rail operation and restricting weekend service could increase the operating cost-effectiveness of service by eliminating the least productive service. Balanced directional flows associated with multiple nucleated urban activity patterns and less rush-hour peaking associated with staggered work hours could also provide opportunities for more efficient vehicle utilization, yet these conditions are not necessarily characteristic of urban light rail corridors.
Other operating considerations may also play a part in this decision. These include the relative share of operating costs attributable to labor and to propulsion energy. If electric rates increase faster than labor costs, which is quite probable in Cleveland as new nuclear plants are included in the rate base, then the more efficient vehicle argument gets stronger. Likewis,e, faster vehicle turnarounds (reducing round-trip time to less than 1.2 hr) or lower labor costs could increase the relative advantages of more efficient vehicles.
The physical capability of stations for handling longer train lengths or the traffic conditions that might interfere with greater frequencies might also preclude energy operating costs from playing an important part in the vehicle choice decision.
Other operating conditions that relate to vehicle size might also be relevant (_!) • For example, an articulated vehicle with on-board fare collection may result in longer station dwell time and enhanced opportunity for fare cheating. An articulated vehicle makes it difficult to monitor behavior (vandalism) in the car section beyond the articulation or to be
188
sure the doors are clear of passengers when closing. On the other hand, the extra capacity of a large vehicle may provide advantages in unanticipated situations such as early business closings for severe weather or unanticipated crowds from special events (sports events, parades). The larger vehicle is also more likely to provide the comfort of a full double seat per passenger.
Other Considerations
The provision of service is typically driven by policy decisions that dictate a high frequency, whereas vehicle choice decisions are more inclined to be driven by a desire to minimize labor operating costs during rush hours.
Numerous other variables affect the vehicle choice decision. These include the need to be compatible with existing equipment; the physical constraints on design including width, height, turning radius, floor and step h@ight, power supply, door location requirements, performance requirements, and related concerns. Issues like vehicle cost and availability within a given time frame may also affect the vehicle choice decision as might maintenance costs by vehicle type and size.
A quantitative research effort directed at defining conditions of service, ridership, operating policies, and vehicle sizes that result in efficient operations could be useful to the industry. The need for a better understanding of off-peak ridership for making vehicle size decisions is also indicated by the results presented.
Mixed Vehicle Sizes
The preceding text urges more attention to optimizing vehicle size for a given situation. This concept can be expanded to include the prospect of having vehicles of two sizes serve a given property. This possibility might be particularly attractive for large operations with multiple lines. Small single .vehicles could be used for low-volume off-peak services; then trains of these vehicles could be used •with larger a rt iculated or double-articulated vehicles to meet rush-hour demands. If such a fleet were planned concurrently there could be nearly complete component compatibility. A detailed, site-specific analysis could be helpful in evaluating the feasibility and benefits of such an arrangement.
SUMMARY
The objective of this paper has been to communicate thP. r.onr.P.rn that P.nPrgy opP.r~ting costs are not
TRB State-of-the-Art Report 2
given adequate consideration in the vehicle size decision. Energy operating costs have increased to the point where they may be as great as or greater than the labor cost for vehicle operation. This trend, coupled with the expansion of light rail into additional markets, highlights the need to pay more attention to energy costs if the rail mode is to maintain its competitive advantage in the energy efficient transportation of people. The high frequencies necessary to attract riders, the lower trip densities of many corridors under consideration for new systems, and the competitive environment for transit where gasoline is cheap and fares are expected to cover an increasing share of costs can result in a transit system providing many more seatmiles of service than are demanded. Unless these trends are watched closely, with corrective actions taken where necessary, the light rail mode may fail to capture the economies of a "mass" mode of transportation and be increasingly reliant on accessibility and mobility benefits to justify their construction and operation.
REFERENCES
1. R.J. Landgraf. Decisions on Physical Configuration for Light Rail Vehicles. In TRB Special Report 195: Light Rail Transit: Planning, Design and Implementation, TRB, National Research Council, Washington, D.C., 1982, pp. 97-103.
2, E.S. Diamant et al. Light Rail Transit: State of the Art Review. DeLeuw, Cather, and Company; u .s. Department of Transportation, Spring 1976, Chapter five, pp. 117-127 and 156.
3. The Greater Cleveland Regional Transit Authority Energy Report for 1983. Service and Grant Development Department, Greater Cleveland Regional Transit Authority, Cleveland, Ohio, March 1984, pp. 11 and 18-42.
4. S. Polzin. Initiating an Energy Management Program for The Greater Cleveland Regional Transit Authority. Presented at American Public Transit Association 1982 Rapid Transit Conference, r,10.,u::i.l=an~, nhin, .T11n.o lQA? _
5. R.A. Uher, N. Sathi, and A. Sathi. Energy Cost Reduction Study of the Washington Metropolitan Area Transit Authority Metro Rail System, Executive Summary. Mellon Institute, Carnegie-Mellon University, Pittsburgh, Pa., May 1982.
6. R.A. Uher and N. Sathi. Reduction of Peak-Power Demand for Electric Rail Transit Systems. NCTRP Report 3. TRB, National Research Council, Washington. D.C •• Dec. 1983, pp. 61-79.
Main Features of Cleveland's LRV Marcello Pecorini Giancarlo Cheirasco Breda Costruzioni Ferroviarie Pistoia, Italy
When the Greater Cleveland Regional Transit Authority (GCRTA) issued its i nvitat ion to bid on light rail vehicles (LRVs), Breda Costruzioni Ferroviarie (BCF) submitted a bid. The LRV technical specifications were f lexible in that they did not impose any specific type of car nor did they impose a precise number of vehicles; instead the specifications called for 4,000 passenger seats to be supplied within certain weight and dimensiona1 limits. Breda offered 48 vehicles with 84 seats each for a total of 4,032 seats and won the contract .
TECHNICAL DESCRIPTION
The cars consist of two half bodies joined by an articulation section with three trucks. The two end trucks are powered, and the central truck under the articulation section is trailed .
•rhe dimensional, f unct ional, a nd structural requirements guided the designers in producing a car with simple lines and an almost total lack of curved surfaces.
The car is slightly more than 24 m (79 ft 10 in ,) long , is rated AW2 (84 seated passengers and 40 standees), and can travel at a maximum speed of 90 km/hr (55 mph). This speed can be reached in less than 35 sec from a standing start.
The main technical features of the vehicle are summarized in the following table:
Feature Overall length Gauge Width Car body length Tare weight Seats Seats and standees Line voltage Maximum speed Hourly rating Acceleration Service braking Emergency braking
Measurement 79 ft 10 13/16 in. 4 ft 8 1/2 in. 9 ft 2 15/16 in. 77 ft l 11/32 in, 84,000 lb 84 270 600 V
55 mph 2 X 245 kw 3 mph per second 4 mph per second 6 mph per second
The LRV is bidirectional with an operator's cab at either end and th.ree doors per side. The passenger door near the operator I s cab is arranged to allow the operator to control fare collection, The 84 seats are arranged in compliance with the specification requirements. Half the seats face one di-
rection and half the other. Each end of the car is equipped with a n anUclimber device and an automatic coupler with mechanical, electrical, and pneumatic functions so that the cars can operate in trains of up to four vehicles. The couplers were built by the Ohio Brass Company.
The car frame, sides, and external sheathing are made of stainless and semistainless steel. The sides, floors, and steps are made of stain.less steel , and the rest of the car is made of Corten-semistainless.
The underframe has two central members that can transfer car loads to the truck support and distribu·te longitudinal loads to the surroundlng parts of the structure. The two side sills made of bent sheeting and a series of extruded beams and two end ·structures provide support for the coupler and anticlimber on one end and f or the articulation section on the other . The underframe can be considered "classic" e xcept that its height is limited to allow space for underfloor equipment.
A reticular frame made it possible to arrange the sturdy sections of the structure so as to obtain the most uniform distribution of stresses possible and thus, at a parity of strength, an optimal use of the properties of the materials and a considerable weight savings.
The roof is made of a series of carlines and covered with longitudinally co~rugated s heeting.
The entire structure is welded. Cri tica·l portions of the car body were built and subjected to strenuous fatigue tests before assembly of the vehicles, The end of the car body is a structure with differential strength that makes it possible for it to absorb the kinetic energy caused by impact against fixed obstacles at speeds of up to 15 km/hr with controlled def.o.rmation of the car body up to a depth of 600 mm.
The trucks were designed to guarantee a functionally valid product and to ensu.re reliable stress resistance. Finite element calculations were used for the study of stresses , and the results of the calculations were verified by fatigue tests on the completed truck frame (at the University of Pisa) and on the bolster beam (at the University of Milan).
The motor and trailer trucks are practically identical: they have an H-frame and two levels of vertical suspension and one level of tr:ansver:se suspension. The primary suspension consists of helical springs and is controlled by four hydraulic shock absorbers . The transverse and longitudinal loads are transmitted to the journal bear i'ngs by an articulated connecting arm on a silent block.
The secondary suspension consists of air springs
189
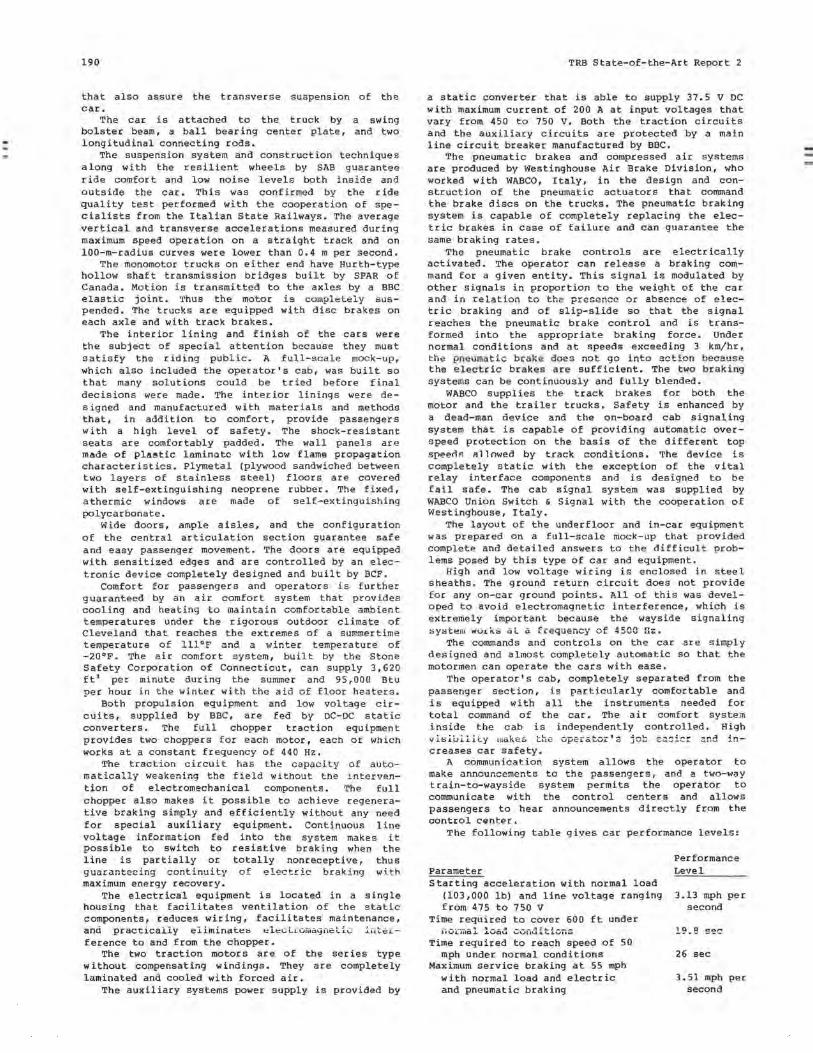
190
that also assure the transverse suspension of the car.
The car is attached to the truck by a swing bolster beam, a ball bearing center plate, and two longitudinal connecting rods.
The suspension system and construction techniques along with the resilient wheels by SAB guarantee ride comfort and low noise levels both inside and outside the car. This was confirmed by the ride quality test performed with the cooperation of specialists from the Italian State Railways. The average vertical and transverse accelerations measured during maximum speed operation on a straight track and on 100-m-radius curves were lower than 0.4 m per second.
The monomotor trucks on either end have Hurth-type hollow shaft transmission bridges built by SPAR of Canada. Motion is transmitted to the axles by a BBC elastic Joint. Thus the motor is completely suspended. The trucks are equipped with disc brakes on each axle and with track brakes.
The interior lining and finish of the cars were the subject of special attention because they must satisfy the riding public. A full-scale mock-up, which also included the operator's cab, was built so that many solutions could be tried before final decisions were made. The interior linings were designed and manufactured with materials and methods that, in addition to comfort, provide passengers with a high level of safety. The shock-resistant seats are comfortably padded. The wall panels are made of pla11tic laminate with low flame propilgiltion characteristics. Plymetal (plywood sandwiched between two layers of stainless steel) floors are covered with self-extinguishing neoprene rubber. The fixed, athermic windows are made of self-extinguishing polycarbonate.
Wide doors, ample aisles, and the configuration of the central articulation section guarantee safe and easy passenger movement. The doors are equipped with sensitized edges and are controlled by an electronic device completely designed and built by BCF.
Comfort for passengers and operators is further guaranteed by an air comfort system that provides cooling and heating to maintain comfortable ambient temperatures under the rigorous outdoor climate of Cleveland that reaches the extremes of a summertime temperature of 111 °P and a winter temperature of -20°F. The air comfort system, built by the Stone Safety Corporation of Connecticut, can supply 3,620 ft' per minute during the summer and 95,000 Btu per hour in the winter with the aid of floor heaters.
Both propulsion equipment and low voltage circuits, supplied by BBC, are fed by DC-DC static converters. The full chopper traction equipment provides two choppers for each motor, each ot which works at a constant frequency of 440 Hz.
The traction circuit has the capacity of automatically weakening the field without the intervention of electromechanical components. The full chopper also makes it possible to achieve regenerative braking simply and efficiently without any need for special auxiliary equipment. Continuous line voltage information fed into the system makes it possible to switch to resistive braking when the line is partially or totally nonreceptive, thus guaranteaing continuit~l of electric hr~k inn with maximum energy recovery.
The electrical equipment is located in a single housing that facilitates ventilation of the static components, reduces wiring, facilitates maintenance, and practica1.1.y eliminate~ t:l~~LLUtt,ag1-1ctic i1itcrference to and from the chopper.
The two traction motors are of the series type without compensating windings. They are completely laminated and cooled with forced air.
The auxiliary systems power supply is provided by
TRB State-of-the-Art Report 2
a static converter that is able to supply 37.5 V DC with maximum current of 200 A at input voltages that vary from 450 to 750 v. Both the traction circuits and the auxiliary circuits are protected by a main line circuit breaker manufactured by BBC.
The pneumatic brakes and compressed air systems are produced by Westinghouse Air Brake Division, who worked with WABCO, Italy, in the design and construction of the pneumatic actuators that command the brake discs on the trucks. The pneumatic braking system is capable of completely replacing the electric brakes in case of failure and can guarantee the same braking rates.
The pneumatic brake controls are electrically activated. The operator can release a braking command for a given entity. This signal is modulated by other signals in proportion to the weight of the car and in relation to the presenc~ or absence of electric braking and of slip-slide so that the signal reaches the pneumatic brake control and is transformed into the appropriate braking force. Under normal conditions and at speeds exceeding 3 km/hr, the pneumatic brake does not go into action because the electric brakes are sufficient. The two braking systems can be continuously and fully blended.
WABCO supplies the track brakes for both the motor and the trailer trucks. Safety is enhanced by a dead-man device and the on-board cab signaling system that is capable of providing automatic overspeed protection on the basis of the different top speenR 111 lowed by track conditions. The device is completely static with the exception of the vital relay interface components and is designed to be fail safe. The cab signal system was supplied by WABCO Union Switch & Signal with the cooperation of Westinghouse, Italy.
The layout of the underfloor and in-car equipment was prepared on a full-scale mock-up that provided complete and detailed answers to the difficult problems posed by this type of car and equipment.
High and low voltage wiring is enclosed in steel sheaths. The ground return circuit does not provide for any on-car ground points. All of this was developed to avoid electromagnetic interference, which is extremely important because the wayside signaling !::iystem wo1-K.s a L a frequency of 4500 Hz.
The commands and controls on the car are simply designed and almost completely automatic so that the motormen can operate the cars with ease.
The operator's cab, completely separated from the passenger section, is particularly comfortable and is equipped with all the instruments needed for total command of the car. The air comfort system inside the cab is independently controlled. High visibility makes the opei:ator':; job GZ.~i~:r z.nd increases car safety.
A communication system allows the operator to make announcements to the passengers, and a two-way train-to-wayside system permits the operator to communicate with the control centers and allows passengers to hear announcements directly from the control c-enter,
The following table gives car performance levels:
Parameter Starting acceleration with normal load
(103,000 lb) and line voltage ranging from 475 to 750 V
Time required to cover 600 ft under
Time required to reach speed of 50 mph under normal conditions
Maximum service braking at 55 mph with normal load and electric and pneumatic braking
Performance Level
3.13 mph per second
19.8 sec
26 sec
3.51 mph per second
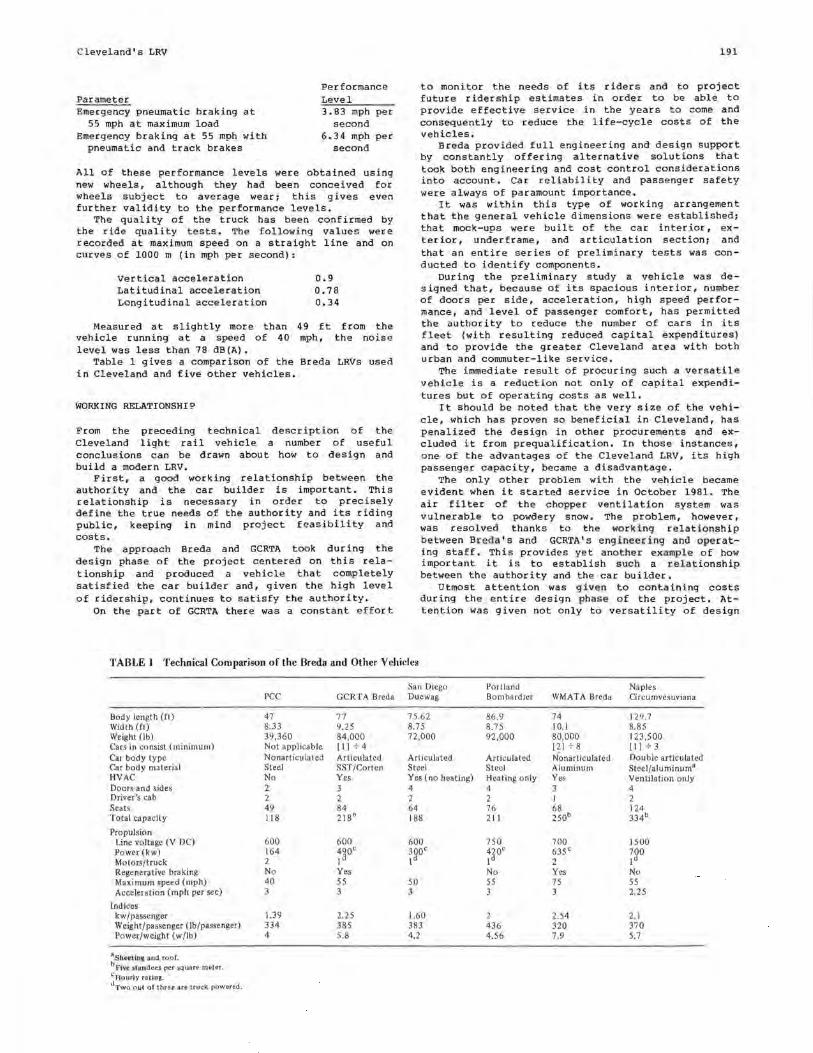
Cleveland's LRV
Parameter Emergency pneumatic braking at
55 mph at maximum load Emergency braking at 55 mph with
pneumatic and track brakes
Performance Level 3.83 mph per
second 6.34 mph per
second
All of these performance levels were obtained using new wheels, although they had been conceived for wheels subject to average wear: this gives even further validity to the performance levels.
The quality of the truck has been confirmed by the ride quality tests. The following values were recorded at maximum speed on a straight line and on curves of 1000 m (in mph per second):
Vertical acceleration Latitudinal acceleration Longitudinal acceleration
0.9 0.78 0.34
Measured at slightly more than 49 ft from the vehicle running at a speed of 40 mph, the noise level was less than 78 dB(A).
Table 1 gives a comparison of the Breda LRVs used in Cleveland and five other vehicles.
WORKING RELATIONSHIP
From the preceding technical description of the Cleveland light rail vehicle a number of useful conclusions can be drawn about how to design and build a modern LRV.
First, a good working relationship between the authority and the car builder is important. This relationship is necessary in order to precisely define the true needs of the authority and its riding public, keeping in mind project feasibility and costs.
The approach Breda and GCRTA took during the design phase of the project centered on this relationship and produced a vehicle that completely satisfied the car builder and, given the high level of ridership, continues to satisfy the authority.
On the part of GCRTA there was a constant effort
191
to monitor the needs of its riders and to project future ridership estimates in order to be able to provide effective service in the years to come and consequently to reduce the life-cycle costs of the vehicles;
Breda provided full engineering and design support by constantly offering alternative solutions that took both engineering and cost control considerations into account. Car reliability and passenger safety were always of paramount importance.
It was within this type of working arrangement that the general vehicle dimensions were establishedi that mock-ups were built of the car inte rior, exterior, underframe, and articulation section: and that an entire series of preliminary tests was conducted to identify components.
During the preliminary study a vehicle was designed that, because of its spacious interior, number of doors per side, acceleration, high speed performance, and level of passenger comfort, has permitted the authority to reduce the number of cars in its fleet (with resulting reduced capital expenditures) and to provide the greater Cleveland area with both urban and commuter-like service.
The immediate result of procuring such a versatile vehicle is a reduction not only of capital expenditures but of operating costs as well.
It should be noted that the very size of the vehicle, which has proven so beneficial in Cleveland, has penalized the design in other procurements and excluded it from prequalification. In those instances, one of the advantages of the Cleveland LRV, its high passenger capacity, became a disadvantage.
The only other problem with the vehicle became evident when it started service in October 1981. The air filter of the chopper ventilation system was vulnerable to powdery snow. The problem, however, was resol ved thanks to the work i ng relat i onship between Breda 's and GCRTA's engi nee r i ng and ope rating staff. This provides yet another example of how important it is to establish s uch a relationship between the authority and the car builder.
Utmost attention was g i ven to containing costs during the entire design phase of the project. Attention was given not only to versatility of design
TABLE I Technical Comparison of the Breda and Other Vehicles
San Diego Portland Naples PCC GCRTA Breda Duewag Bombardier WMATA Breda Circumvesuviana
Body length (ft) 47 77 75.62 86.9 74 129.7 Width (ft) 8.33 9.25 8. 7 5 8.75 10.1 8.85 Weight (lb) 39,360 84,000 72,000 92,000 80,000 I 23,500 Cars in consist (minimum) Not applicable (11.;. 4 [2] c- 8 (1] c- 3 Car body type Nonarticulated Articulated Articulated Articulated N'anarticulated Double articulated Car body material Steel SST/Carten Steel Steel Aluminum Steel/aluminum• HVAC No Yes Yes (no heating) Heating only Yes Ventilation only Doors and sides 2 3 4 4 3 4 Driver's cab 2 2 2 2 I 2 Seats 49 84 64 76 68 124 Total capacity 118 218b 188 211 250b 334b
Propulsion Line voltage (V DC) 600 600 600 750 700 1500 Power (kw) 164 49.0c 300c 420c 635c 700 Motors/truck 2 I a 1 d Id 2 1 d Regenerative braking No Yes No Yes No Maximum speed (mph} 40 55 so 55 75 55 Acceleration (mph per sec) 3 3 3 3 3 2.25
Indices kw /passenger 1.39 2.25 1.60 2 2.54 2. 1 Weight/passenger (lb/passenger) 334 385 383 436 320 370 Power/weight (w/lb) 4 5.8 4.2 4.56 7.9 5.7
aShel:itins and roof. bFh'e t111ndees per square meter.
:Hourly rating. Two out of three are truck powered.
192
but to reliability of parts and materials as well. Furthermore, care was taken in selecting modular components to ensure interchangeability. Preference was always given to those solutions that allowed maintenance to be the least complicated and the least expensive possible.
CONCLUSIONS
Passengers appreciate the Cleveland LRV for its high level of comfort (low noise level, efficient lighting, effective public address system, wide cushioned seats, ample center aisle, wide passenger doors, and efficient air conditioning system).
The public also appreciates the LRV's modern
TRB State-of-the-Art Report 2
exterior design, for the balance of colors, for the image of efficiency that it projects, and for the status it gives to the area it serves.
The transit authority is satisfied with the LRV because of its reliability, its ease of maintainability and operation, and the sense of safety it offers operators.
Elected officials can be proud of the LRV's versatility, its provisions for passenger and traffic safety, its excellent performance, and the measures taken to reduce energy consumption and to recuperate lost energy through regenerative braking.
As a result it can be concluded that the basic objectives were fully reached and that the vehicle as built can be considered one of the most modern and efficient means of mass transit in service today.
Part4 Operations
Considerations for Effective Light Rail Street Operation John D. Wilkins
Joseph F. Boscia New Jersey Transit Bus Operations, Inc. Newark, New Jersey
Mention street operation to designers of new light rail systems, and many of them wince and conjure up visions of slow, rumbling, clanking streetcars edging their way through crowded vehicular traffic. Street operation today, however, can be not only effective, but desirable under certain conditions. When initial consideration is given to street operation, planners and designers should keep in mind that future upgrading is possible. With the availability of future year funding, street operation can be replaced by tunneling (for short or long stretches) or by constructing a median if the street is widened. In this paper, street operation includes mixed traffic, partial segregation, and complete separation on the street. These various treatments will be discussed later.
The primary point of this paper is not to convince the reader to use street operation in a proposed system but to discuss those considerations that should be addressed to maximize overall operation when street operation has been selected as an option for all or part of the system.
INTRODUCTION
Three constraints may make street operation desirable or necessary, or both: funding limitations, especially when they preclude subway construction, the lack of private right-of-way (PROW), and the political need to minimize disruption by avoiding property acquisition.
As opposed to PROW and subway, street operation has the following benefits:
1. Lower initial costs • No right-of-way
streets can be used; acquisition; existing
• No signal system is needed for light rail transit (LRT) car spacing because traffic signals and other controls will limit speeds;
• Simpler and less expensive overhead can be used;
• Extensive grading requirements are unnecessary because, again, existing streets are used; and
• No grade-crossing gates are cause that function will be served signals and stop signs. 2. Easier accessibility for passengers
needed beby traffic
• Closer stop spacing; • More convenient access to the stops,
especially for elderly and handicapped patrons; and
• Passengers can be more closely distributed to more sections of shopping areas.
Conversely, street operation can have the following negative impacts on both LRT and vehicular traffic:
1. Capacity. Through-put may be lower but can be partially offset by train operation;
2. Dwell time. Passenger handling is more time consuming because of the low-level boarding unless self-service fare collection and safety islands are used;
3. Average speeds. Additional running time will be necessary because of traffic and pedestrian interference;
4. Reliability. Because street operation takes place in an environment over which the transit operator has less control, the service provided may be less reliable (delays and accidents); and
5. Track cost. Initial installation cost of the track structure will generally be higher.
DISCUSSION
The following considerations are meant to maximize street operation. All reflect the experiences of the authors and are the result of extensive visits by both authors to many light rail properties worldwide. These considerations are also lessons learned from 10 years' experience in the light rail operations of a major u.s. city system by one author and extensive consulting by the other.
Car Des ign
Performance
An early decision must be made about whether the car will be used only in street running with mixed traffic or also on exclusive right-of-way. If the latter is the case, the car must incorporate features for both environments, but this will of necessity involve compromise.
195
196
Performance requirements must be based on the type of environment in which the car will predominantly operate. High balancing speeds are not as valuable for predominantly street operation because of the relatively frequent stops for either passengers or cross streets and traffic lights. Here it is operationally desirable to have the highest possible acceleration and braking rates consistent with safety and comfort. Over the life of the car this will translate into considerable operational savings, both in terms of running time and operators and cars required. The PCC car set a high standard for acceleration and braking, which has not been met by many of the recent light rail vehicles (LRVs).
Stopping
Mixed traffic requires more frequent use of emergency braking, and track brakes and truck mounted sanders are essential. A slip/spin detector will prevent excessive wheel spinning or locked wheel sliding during acceleration and nonemergency braking. This not only reduces wheel wear but keeps the car under control.
Car Shape
A square-ended car ma:y not be feasible in mixed traffic, especially on short-radius turns. Articulation may also be necessary. Tapered ends will present design problems for front door on-board fare collection because of the location of the doors in reference to the operator and fare box. Tapering will also result in the loss of some passenger seating capacity. Installation in older cities with narrow streets requires clearance considerations not only for passing other light rail cars, but curbs, other fixed obstructions, and possible sidewalk overhang.
Passenger Stops
If front door fare collection is required, low-level steps may have to be incorporated in the taper. Safety islands built up to the first step height (as in The Hague) can help speed boarding and alighting but may present a gap (and safety problem) at the front taper. Boarding and alighting from street level may also require high or low steps and an on-board lift for elderly and handicapped patrons. Lifts should be avoided wherever possible because of the high incidence of maintenance problems. Floorlevel loading platforms with ramps are preferable if sufficient space is available.
Visibility
The presence of pedestrians, especially children, means the operator's view to the front and sides is critical. His seat position and the height of the console top must give him a view as close to the car as possible to guard against people crossing directly in front cf the car. Corner post widths must be narrow enough to minimize blind spots. Windshield glare reduction is also important because of the short reaction time in mixed traffic at night.
Mirrors are needed in mixed traffic operation, but the car taper may result in left and right mirrors that provide vision only as far as the clearance points on the car side. An alternative is to have the bottom edge of side windows low enough to give some view of small cars traveling alongside through use of a cab-mounted inside rearview mirror. As a
TRB State-of-the-Art Report 2
minimum, an outside mirror is needed when the front doors are open to spot passengers running for the car from the side rear.
Outward folding doors will also hinder the operator from seeing any clearance points on the car side while edging past parked automobiles or other close clearance obstacles.
Warning Devices
A car operated in mixed traffic has a much greater need for both audible and visual warning devices. Audible devices should include an automatic repeating gong in addition to a horn because the latter may not be allowed in city operation. A rear gong is also helpful as a warning for car overhang during turning movements. An alarm and a light for reverse movements are advisable.
Visual warnings should include side, rear, and front turn signals, preferably the attention-getting alternately flashing type. Front marker lights should be a color iblue?; distinctive from those used by general automotive traffic. Rear tail and marker lights are needed in addition to brake lights, and brake lights that alternately flash will help reduce rear-end accidents. Flashing red lights on the car side behind the passenger doors that are activated whenever doors are unlocked or open will enhance safety for middle-of-the-street boarding or alighting where automobiles might pass. Four-way hazard lights are necessary for cars disabled in traffic. A warning sign on the rear of the car aimed at alerting motorists to car swing during turning movements should be placed at the motorist's eye level.
Door Operation
Passenger-activated doors (from outside and inside) are useful in street operation, especially with self-service fare collection. The operator unlocks the doors, and the passenger simply pushes a button to open them. In both hot and cold weather, only the doors that need to be opened are opened, thus conserving both heat and air-conditioning.
Wheels
Because of the greater track bed rigidity involved with street laid rails, resilient wheels are highly desirable to reduce the impact of vibration on the track and through the street to wayside structures.
water Protection
Street-running cars are much more susceptible to water damage to underfloor components from water splash, slush, salt, and snow. Component protection and air intake positions must be examined in this light.
rd~:;::;e:=nyt=L Concer11s
Along the Wayside
Safety and security are important at transit stops. Considerations include access to the stop, crosswalk protection, lighting for night boarding and alighting, and pavement markings and signs alerting motorists to the stop. These signs, when hung from the overhead facing motorists, will alert them to curbside stops. Red stop lights supported from the over-
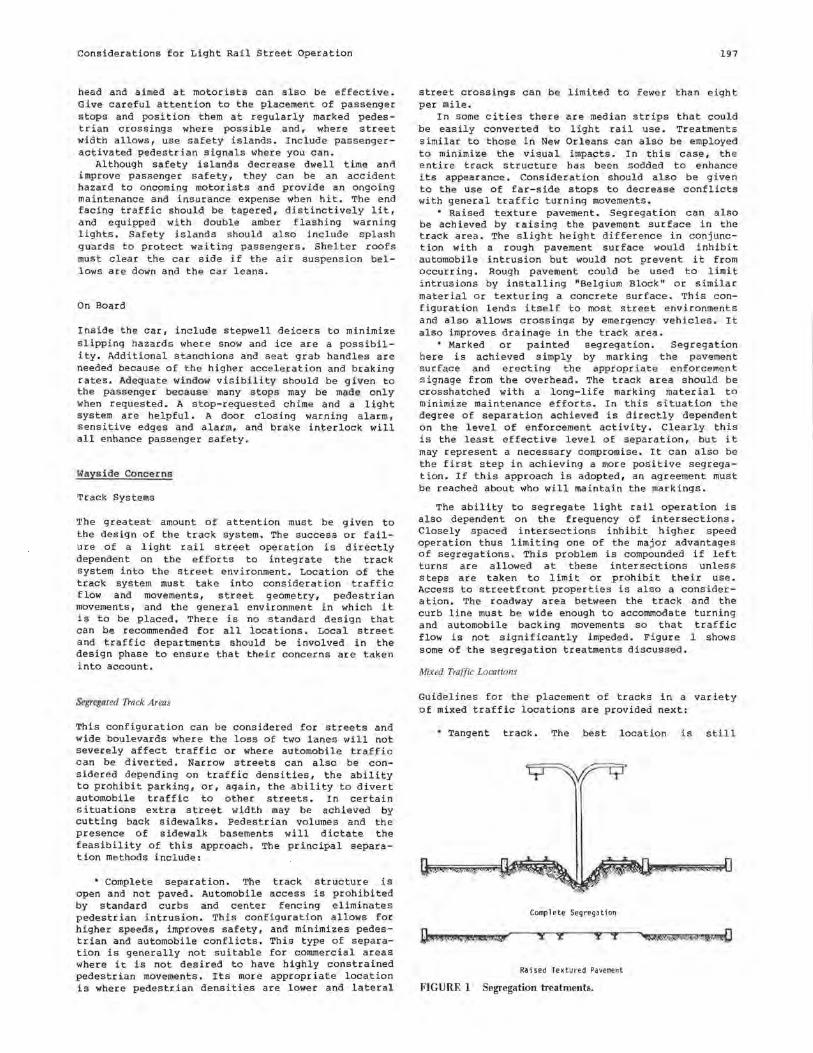
Considerations for Light Rail Street Operation
head and aimed at motorists can also be effective. Give careful attention to the placement of passenger stops and position them at regularly marked pedestrian crossings where possible and, where street width allows, use safety islands. Include passengeractivated pedestrian signals where you can.
Although safety islands decrease dwell time anr1 improve passenger safety, they can be an accident hazard to oncoming motorists and provide an ongoing maintenance and insurance expense when hit. The end facing traffic should be tapered, distinctively lit, and equipped with double amber flashing warning lights. Safety islands should also include splash guards to protect waiting passengers. Shelter roofs must clear the car side if the air suspension bellows are down and the car leans.
On Board
Inside the car, include stepwell deicers to minimize slipping hazards where snow and ice are a possibility. Additional stanchions and seat grab handles are needed because of the higher acceleration and braking rates. Adequate window visibility should be given to the passenger because many s tops may be made only when requested. A stop-requested chime and a light system are helpful. A door closing warning alarm, sensitive edges and alarm, and brake interlock will all enhance passenger safety.
Wayside Concerns
Track Systems
The greatest amount of attention must be given to the design of the track system. The success or failure of a light rail street operation is directly dependent on the efforts to integrate the track system into the street environment. Location of the track system must take into consideration traffic flow and movements, street geometry, pedestrian movements, and the general environment in which it is to be placed. There is no standard design that can be recommended for all locations. Local street and traffic departments should be involved in the design phase to ensure that their concerns are taken into account.
Segregnted Track Areas
This configuration can be considered for streets and wide boulevards where the loss of two lanes will not severely affect traffic or where automobile traffic can be diverted. Narrow streets can also be considered depending on traffic densities, the ability to prohibit parking, or, again, the ability to divert automobile traffic to other streets. In certain situations extra street width may be achieved by cutting back sidewalks. Pedestrian volumes and the presence of sidewalk basements will dictate the feasibility of this approach. The principal separation methods include:
• Complete separation. The track structure is open and not paved. Automobile access is prohibited by standard curbs and center fencing eliminates pedestrian intrusion. This configuration allows for higher speeds, improves safety, and minimizes pedestrian and automobile conflicts. This type of separation is generally not suitable for commercial areas where it is not desired to have highly constrained pedestrian movements. Its more appropriate location is where pedestrian densities are lower and lateral
197
street crossings can be limited to fewer than eight per mile.
In some cities there are median strips that could be easily converted to light rail use. Treatments similar to those in New Orleans can also be employed to minimize the visual impacts. In this case, the entire track structure has been sodded to enhance its appearance. Consideration should also be given to the use of far-side stops to decrease conflicts with general traffic turning movements.
• Raised texture pavement. Segregation can also be achieved by raising the pavement surface in the track area. The slight height difference in conjunct ion with a rough pavement surface would inhibit automobile intrusion but would not prevent it from occurring. Rough pavement could be used to limit intrusions by installing "Belgium Block" or similar material or texturing a concrete surface. This configuration lends itself to most street environments and also allows crossings by emergency vehicles. It also improves drainage in the track area.
• Marked or painted segregation. Segregation here is achieved simply by marking the pavement surface and erecting the appropriate enforcement signage from the overhead. The track area should be crosshatched with a long-life marking material to minimize maintenance efforts. In this situation the degree of separation achieved is directly dependent on the level of enforcement activity. Clearly this is the least effective level of separation, but it may represent a necessary compromise. It can also be the first step in achieving a more positive segregation. If this approach is adopted, an agreement must be reached about who will maintain the markings.
The ability to segregate light rail operation is also dependent on the frequency of intersections. Closely spaced intersections inhibit higher speed operation thus limiting one of the major advantages of segregations. This problem is compounded if left turns are allowed at these intersections unless steps are taken to limit or prohibit their use. Access to streetfront properties is also a consideration. The roadway area between the track and the curb line must be wide enough to accommodate turning and automobile backing movements so that traffic flow is not significantly impeded. Figure 1 shows some of the segregation treatments discussed.
Mixed Traffic Locations
Guidelines for the placement of tracks in a variety of mixed traffic locations are provided next:
• Tangent track. The best location is still
Complete Segregation
\I 't
Raised Textured Pavement
FIGURE 1 Segregation treatments.
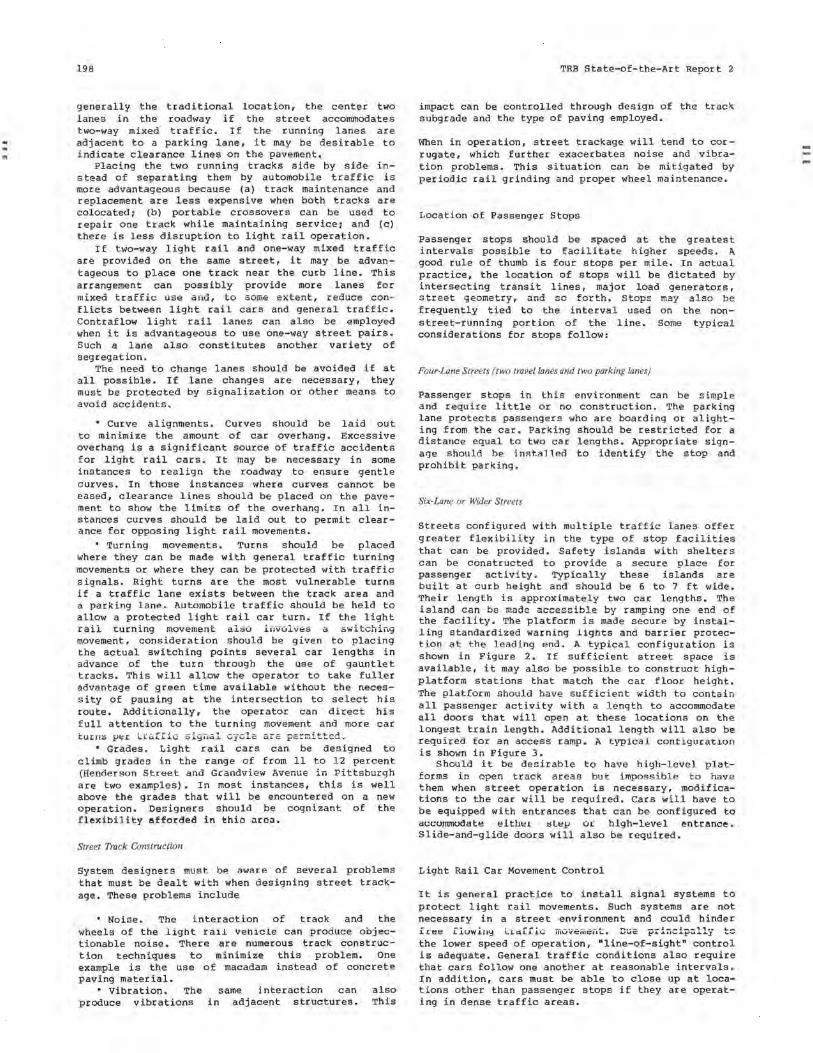
198
generally the traditional location, the center two lanes in the roadway if the street accommodates two-way mixed traffic. If the running lanes are adjacent to a parking lane, it may be desirable to indicate clearance lines on the pavement.
Placing the two running tracks side by side instead of separating them by automobile traffic is more advantageous because (a) track maintenance and replacement are less expensive when both tracks are colocated: (b) portable crossovers can be used to repair one track while maintaining service: and (c) there is less disruption to light rail operation.
If two-way light rail and one-way mixed traffic are provided on the same street, it may be advantageous to place one track near the curb line. This arrangement can possibly provide more lanes for mixed traffic use and, to some exte nt, reduce conflicts between light rail cars and general traffic. Contraflow light rail lanes can also be employed when it is advantageous to use one-way street pairs. Such a lane also constitutes another variety of segregation .
The need to change lanes should be avoided if at all possible. If lane changes are necessary, they must be protected by signalization or other means to avoid accidents.
• Curve alignments. Curves should be laid out to minimize the amount of car overhang. Excessive overhang is a significant source of traffic accidents for light rail cars. It may be necessary in some instances to realign the roadway to ensure gentle curves. In those instances where curves cannot be eased, clearance lines should be placed on the pavement to show the limits of the overhang. In all instances curves should be laid out to permit clearance for opposing light rail movements.
• Turning movements. Turns should be placed where they can be made with general traffic turning movements or where they can be protected with traffic signals. Right turns are the most vulnerable turns if a traffic lane exists between the track area and a park i ng l a ne. Automobile traffic should be held to allow a protected light rail car turn. If the light rail turning movement also .l.11vu.Lv~~ a sw.i.tch.i.ng movement, consideration should be given to placing the actual switching points several car lengths in advance of the turn through the use of gauntlet tracks. This will allow the operator to take fuller advantage o f green time available without the necessity of pausing at the intersection to select his route. Additionally, the operator can direct his full attention to the turning movement and more car tuc n5 pee Lt: affic siy1 .. al c ycle aze perrni ttGd.
• Grades. Light rail cars can be designed to climb grades i n t he range of from 11 to 12 percent (Hender son Street a nd Grandview Avenue in Pittsburgh are two examples). In most instances, this is well above the grades that will be encountered on a new operation. Designers should be cognizant of the flexibility afforded in thio area.
Street Track Construction
System designers must be aware of several problems that must be dealt with when designing street trackage. These problems include
• Noise. The interaction of track and the wheels of the light rail venicle can produce objectionable noise. There are numerous track construct ion techniques to minimize this problem. One example is the use of macadam instead of concrete paving material.
• Vibration. The produce vibrations
same interaction can in adjacent structures.
also This
TRB State-of-the-Art Report 2
impact can be controlled through design of the track subgrade and the type of paving employed.
When in operation, street trackage will tend to corrugate, which further exacerbates noise and vibration problems. This situation can be mitigated by periodic rail grinding and proper wheel maintenance.
Location of Passenger Stops
Passenger stops should be spaced at the greatest intervals possible to facilitate higher speeds. A good rule of thumb is four stops per mile. In actual practice, the location of stops will be dictated by intersecting transit lines, major load generators, street geometry, and s o forth. Stops may also be frequently tied to the interval used on the nonstreet-running portion of the line. Some typical considerations for stops follow:
Four-Lane Streets (two travel lanes and two parking lanes)
Passenger stops in this environment can be simple and require little or no construction. The parking lane protects passengers who are boarding or alighting from the car. Parking should be restricted for a distance equal to two car lengths. Appropriate signage should be i nst:al led to identify the stop and prohibit parking.
Six-Lane or Wider Streets
Streets configured with multiple traffic lanes offer greater flexibility in the type of stop facilities that can be provided. Safety islands with shelters can be constructed to provide a secure place for passenger activity. Typically these islands are built at curb height and should be 6 to 7 ft wide. Their length is approximately two car lengths. The island can be ma d e access ible by ramping one end of the facility. The platform is made secure by installing standardized warning lignts and barr i er protection at t he lead i ng end. A typical configuration is shown in Figure 2. If sufficient street space is available, it may also be possible to construct highplatform stations that match the car floor height. The p latf o r m should have suffic i ent width to contain all passenger activity with a length to accommodate all doors that will open at thes e locations on the longest train length. Additional length will also be required for an access ramp. A typical cont i gurati o n is shown in Figure 3.
Should it be desirable to have high-level platforms in open track areas but imposs i bl e t o hav e them when street operation is necessary, modifications to the car will be required. Cars will have to be equipped with entrances that can be configured to accununudate elthe1 icsle1J or hlgh-level entrance. Slide-and-glide doors will also be required.
Light Rail Car Movement Control
It is general practice to install signal systems to protect light rail movements. Such systems are not necessary in a street environment and could hinder free fluwiuy L1.a.L[ii.:; ff1CiVE:mt::1,t. D~e p.:-iucipully tc the lower speed of operation, "line-of-sight" control is adequate. General traffic conditions also require that cars follow one another at reasonable intervals. In addition, cars must be able to close up at locations other than passenger stops if they are operating in dense traffic areas.
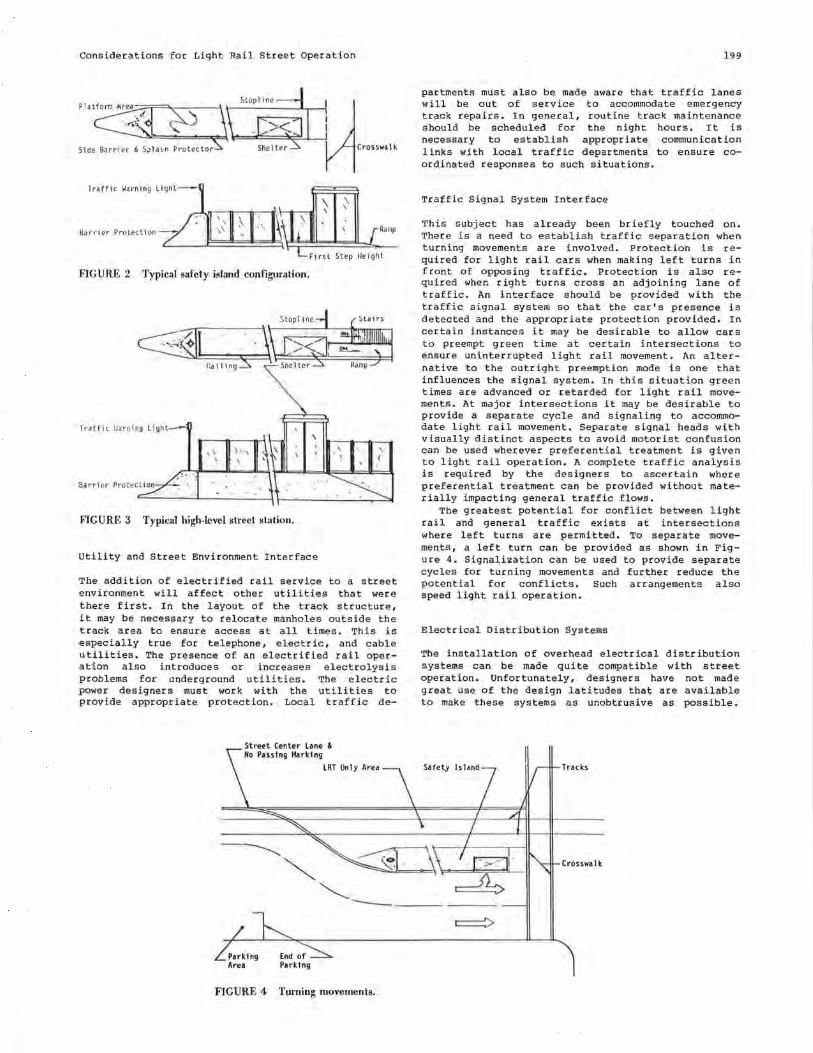
Considerations for Light Rail Street Operation
\ \
Barri er Protection
\ \
Ramp
Step Height
FIGURE 2 Typical safety island configuration.
Traffic \larning Ligh t---
FIGURE 3 Typical hlgh-level street station.
Utility and Street Environment Interface
The addition of electrified rail service to a street environment will affect other utilities that were there first. In the layout of the track structure, it may be necessary to relocate manholes outside the track area to ensure access at all times. This is especially true for telephone, electric, and cable utilities. The presence of an electrified rail operation also introduces or increases electrolysis problems for underground utilities. The electric power designers must work with the utilities to provide appropriate protection. Local traffic de-
Street Center Lane & No Passing !<larking
LRT Only Area
---.. ~
199
partments must also be made aware that traffic lanes will be out of service to accommodate emergency track repairs. In general, routine track maintenance should be scheduled for the night hours. It is necessary to establish appropriate communication 1 inks with local traffic departments to ensure coordinated responses to such situations.
Traffic Signal System Interface
This subject has already been briefly touched on. There is a need to establish traffic separation when turning movements are involved. Protection is required for light rail cars when making left turns in front of opposing traffic. Protection is also required when right turns cross an adjoining lane of traffic. An interface should be provided with the traffic signal system so that the car's presence is detected and the appropriate protection provided. In certain instances it may be desirable to allow cars to preempt green time at certain intersections to ensure uninterrupted light rail movement. An alternative to the outright preemption mode is one that influences the signal system. In this situation green times are advanced or retarded for light rail movements. At major intersections it may be desirable to provide a separate cycle and signaling to accommodate light rail movement. Separate signal heads with visually distinct aspects to avoid motorist confusion can be used wherever preferential treatment is given to light rail operation. A complete traffic analysis is required by the designers to ascertain where preferential treatment can be provided without materially impacting general traffic flows.
The greatest potential for conflict between light rail and general traffic exists at intersections where left turns are permitted. To separate movements, a left turn can be provided as shown in Figure 4. Signalization can be used to provide separate cycles for turning movements and further reduce the potential for conflicts. Such arrangements also speed light rail operation.
Electrical Distribution Systems
The installation of overhead electrical distribution systems can be made quite compatible with street operation. Unfortunately, designers have not made great use of the design latitudes that are available to make these systems as unobtrusive as possible.
Tracks
Crosswa 1 k
"--------
FIGURE 4 Turning movements.
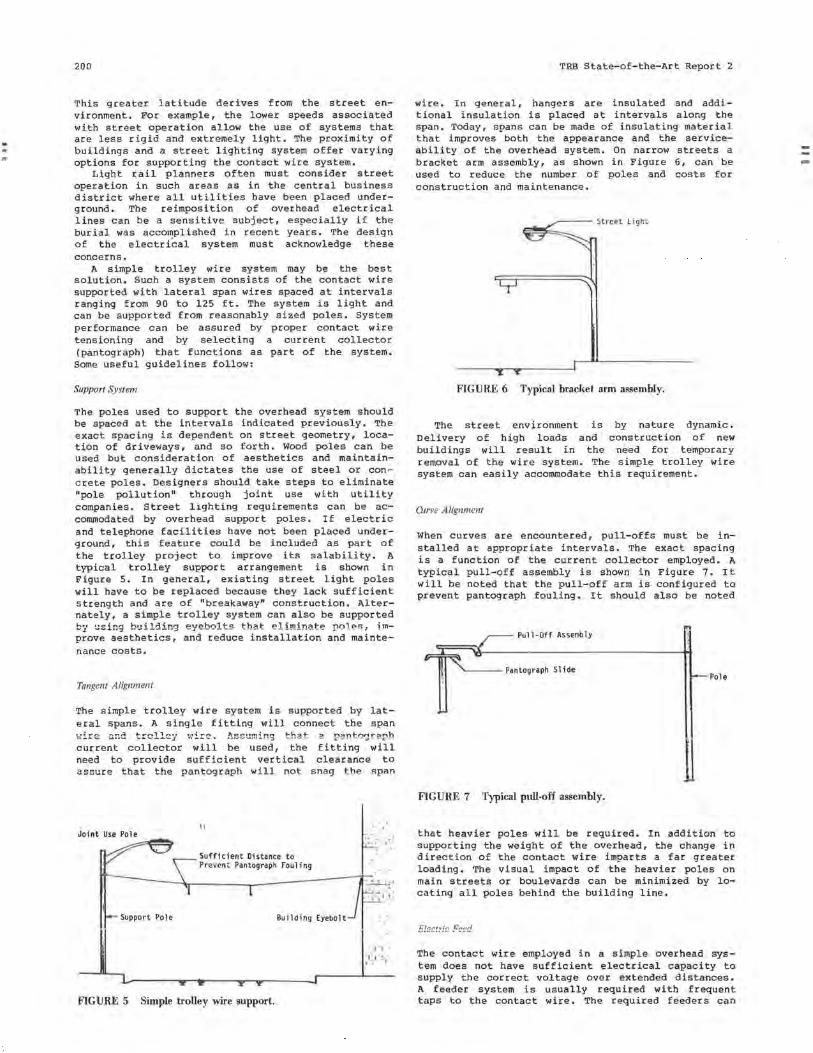
200
This greater latitude derives from the street environment. For example, the lower speeds associated with street operation allow the use of systems that are less rigid and extremely light. The proximity of buildings and a street lighting system offer varying options for supporting the contact wire system.
Light rail planners often must consider street operation in such areas as in the central business district where all utilities have been placed underground. The reimposition of overhead electrical lines can be a sensitive subject, especially if the burial was accomplished in recent years. The design of the electrical system must acknowledge these concerns.
A simple trolley wire system may be the best solution . Such a system consists of the contact wire supported with lateral span wires spaced at intervals ranging from 90 to 125 ft. The system is light and can be supported from reasonably sized poles. System performance can be assured by proper contact wire tensioning and by selecting a current collector (pantograph) that functions as part of the system.
Some useful guidelines follow:
Support System
The poles used to support the overhead system should be spaced at the intervals indicated previously. The exact spacing is dependent on street geometry, location of driveways, and so forth. Wood poles can be used but consideration of aesthetics and maintainability generally dictates the use of steel or concrete poles. Designers should take steps to eliminate "pole pollution" through joint use with utility companies. Street lighting requirements can be accommodated by overhead support poles. If electric and telephone facilities have not been placed underground, this feature could be included as part of the trolley project to improve its salability. A typical trolley support arrangement is shown in Figure 5. In general, existing street light poles will have to be replaced because they lack sufficient strength and are of "breakaway" construction. Alternately, a simple trolley system can also be supported b~l using building eyebolts that eliminate poleB: improve aesthetics, and reduce installation and maintenance costs.
Tangent Alignment
The simple trolley wire system is supported by lateral spans. A single fitting will connect the span
current collector will be used, the fitting will need to provide sufficient vertical clearance to assure that the pantograph will not snag t he s pan
I \
Suffic ient Distance to Prevent Pantograph Fouling k·
ir- ----\.----..------- r::-.. l · :.
_i:;, ~ ' :
Support Pole Bu i lding Eyebolt
, • 1 ' 1
I ..
FIGURE 5
.':··=, - ---.. yr-'11.r----.y..--.'l'r-- ---.Jr----'----
Simple trolley wire support.
TRB State-of-the-Art Report 2
wire. In general, hangers are insulated and additional insulation is placed at intervals along the span. Today, spans can be made of insulating material that improves both the appearance and the serviceability of the overhead system. On narrow streets a bracket arm assembly, as shown in Figure 6, can be used to reduce the number of poles and costs for construction and maintenance.
FIGURE 6 Typical bracket arm assembly.
The street environment is by nature dynamic. Delivery of high loads and construction of new buildings will result in the need for temporary removal of the wire system. The simple trolley wire system can easily accommodate this requirement.
Oirve Alignment
When curves are encountered, pull-offs must be installed at appropriate intervals. The exact spacing is a function of the current collector employed. A typical pull-off assembly is shown in Figure 7. It will be noted that the pull-off arm is configured to prevent pantograph fouling. It should also be noted
Pull-Off Assembly
'---- Pantograph Slide Pole
FIGURE 7 Typical pull-off assembly.
that heavier poles will be required. In addition to supporting the weight of the overhead, the change in direction of the contact wire imparts a far greater loading. The visual impact of the heavier poles on main streets or boulevards can be minimized by locating all poles behind the building line.
The contact wire employed in a simple overhead system does not have sufficient electrical capacity to supply the correct voltage over extended distances. A feeder system is usually required with frequent taps to the contact wire. The required feeders can
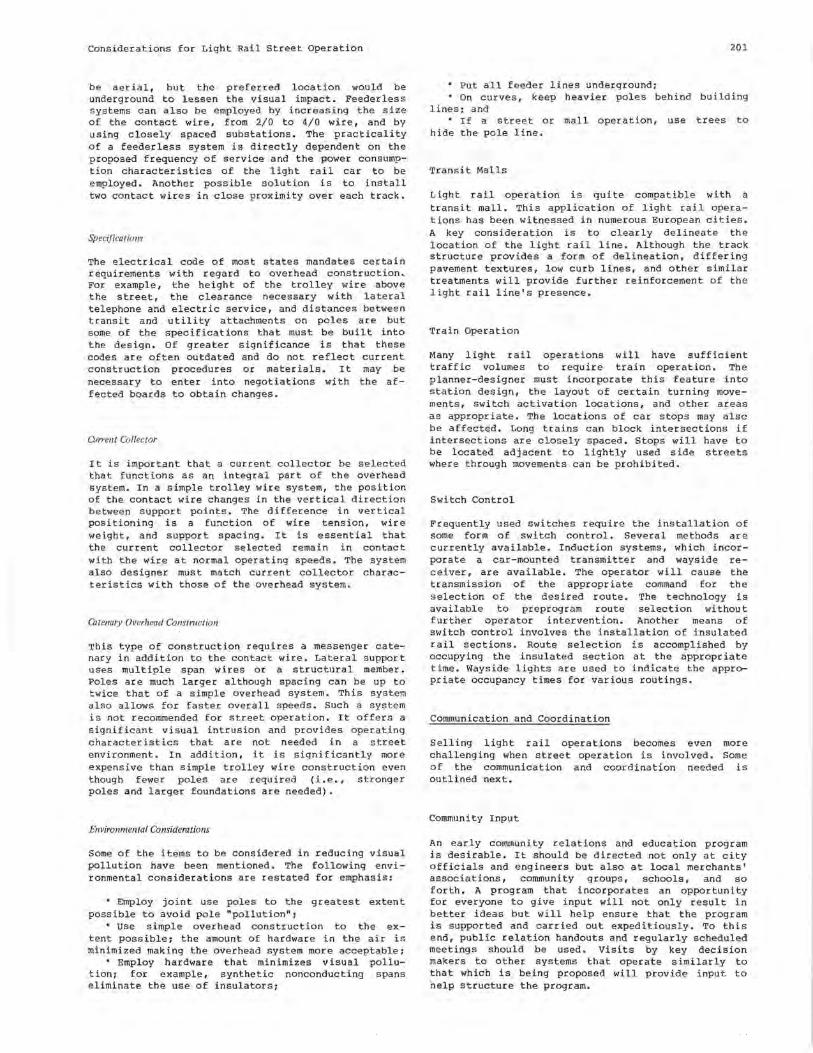
Considerations for Light Rail Street Operation
be aerial, but the preferred location would be underground to lessen the visual impact. Feederless systems can also be employed by increasing the size of the contact wire, from 2/0 to 4/0 wire, and by using closely spaced substations. The practicality of a feederless system is directly dependent on the proposed frequency of service and the power consumption characteristics of the light rail car to be employed. Another possible solution is to install two contact wires in close proximity over each track.
Specifications
The electrical code of most states mandates certain requirements with regard to overhead construction. For example, the height of the trolley wire above the street, the clearance necessary with lateral telephone and electric service, and distances between transit and utility attachments on poles are but some of the specifications that must be built into the design. Of greater significance is that these codes are often outdated and do not reflect current construction procedures or materials. It may be necessary to enter into negotiations with the affected boards to obtain changes.
01rrent Collector
It is important that a current collector be selected that functions as an integral part of the overhead system. In a simple trolley wire system, the position of the contact wire changes in the vertical direction between support points. The difference in vertical positioning is a function of wire tension, wire weight, and support spacing. It is essential that the current collector selected remain in contact with the wire at normal operating speeds. The system also designer must match current collector characteristics with those of the overhead system.
Catenary Overhead Constmction
This type of construction requires a messenger catenary in addition to the contact wire. Lateral support uses multiple span wires or a structural member. Poles are much larger although spacing can be up to twice that of a simple overhead system. This system also allows for faster overall speeds. Such a system is not recommended for street operation. It offers a significant visual intrusion and provides operating characteristics that are not needed in a street environment. In addition, it is significantly more expensive than simple trolley wire construction even though fewer poles are required (i.e., stronger poles and larger foundations are needed).
Environmental Considerations
Some of the items to be considered in reducing visual pollution have been mentioned. The following environmental considerations are restated for emphasis:
• Employ joint use poles to the greatest extent possible to avoid pole "pollution":
• use simple overhead construction to the extent possible: the amount of hardware in the air is minimized making the overhead system more acceptable:
• Employ hardware that minimizes visual pollution: for example, synthetic nonconducting spans eliminate the use of insulators:
201
• Put all feeder lines underground: • On curves, keep heavier poles behind building
lines: and If a street or mall operation, use trees to
hide the pole line.
Transit Malls
Light rail operation is quite compatible with a transit mall. This application of light rail operations has been witnessed in numerous European cities. A key consideration is to clearly delineate the location of the light rail line. Although the track structure provides a form of delineation, differing pavement textures, low curb lines, and other similar treatments will provide further reinforcement of the light rail line's presence.
Train Operation
Many light rail operations will have sufficient traffic volumes to require train operation. The planner-designer must incorporate this feature into station design, the layout of certain turning movements, switch activation locations, and other areas as appropriate. The locations of car stops may also be affected. Long trains can block intersections if intersections are closely spaced. Stops will have to be located adjacent to lightly used side streets where through movements can be prohibited.
Switch Control
Frequently used switches require the installation of some form of switch control. Several methods are currently available. Induction systems, which incorporate a car-mounted transmitter and wayside receiver, are available. The operator will cause the transmission of the appropriate command for the selection of the desired route. The technology is available to preprogram route selection without further operator intervention. Another means of switch control involves the installation of insulated rail sections. Route selection is accomplished by occupying the insulated section at the appropriate time. Wayside lights are used to indicate the appropriate occupancy times for various routings.
Communication and Coordination
Selling light rail operations becomes even more challenging when street operation is involved. Some of the communication and coordination needed is outlined next.
Community Input
An early community relations and education program is desirable. It should be directed not only at city officials and engineers but also at local merchants' associations, community groups, schools, and so forth. A program that incorporates an opportunity for everyone to give input will not only result in better ideas but will help ensure that the program is supported and carried out expeditiously. To this end, public relation handouts and regularly scheduled meetings should be used. Visits by key decision makers to other systems that operate similarly to that which is being proposed will provide input to help structure the program.
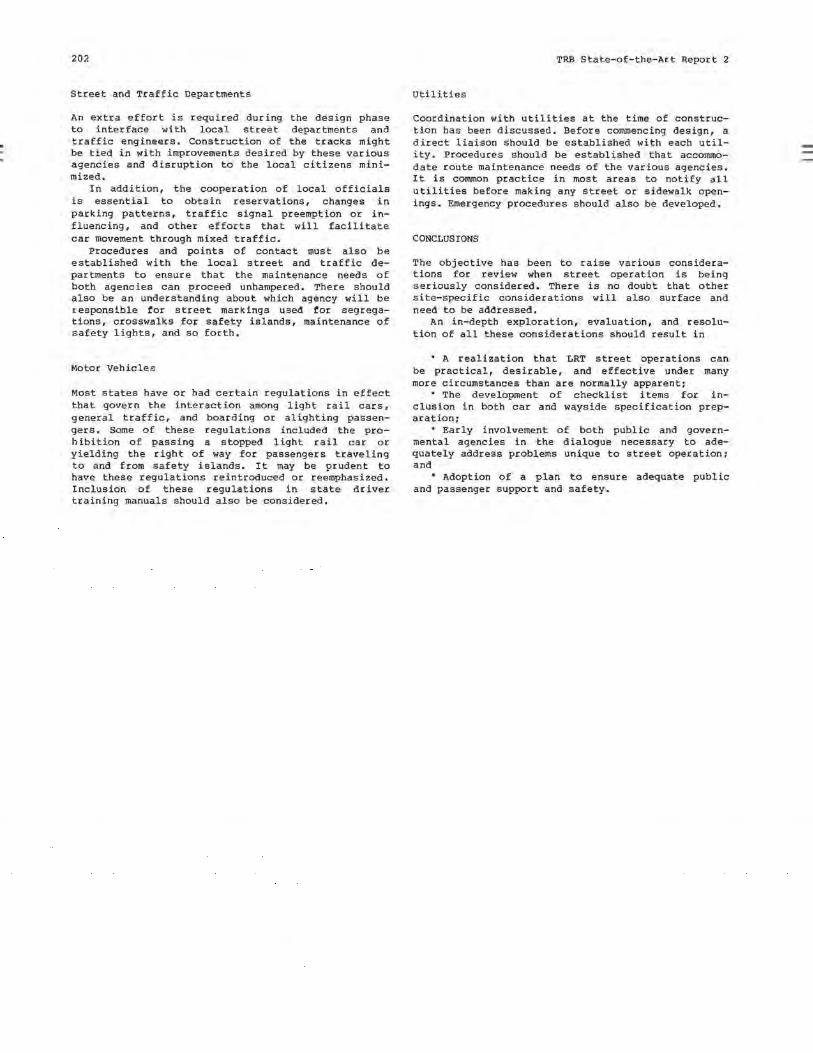
202
Street and Traffic Departments
An extra effort is required during the design phase to interface with local street departments and traffic engineers. Construction of the tracks might be tied in with improvements desired by these various agencies and disruption to the local citizens minimized.
In addition, the cooperation of local officials is essential to obtain reservations, changes in parking patterns, traffic signal preemption or influencing, and other efforts that will facilitate car movement through mixed traffic.
Procedures and points of contact must also be established with the local street and traffic departments to ensure that the maintenance needs of both agencies can proceed unhampered. There should also be an understanding about which agency will be responsible for street markings used for segregations, crosswalks for safety islands, maintenance of safety lights, and so forth.
Motor Vehicles
Most states have or had certain regulations in effect that govern the interaction among light rail cars, general traffic, and boarding or alighting passengers. Some of these regulations included the prohibition of passing a stopped light rail car or yielding the right of way for passengers traveling to and from safety islands. It may be prudent to have these regulations reintroduced or reemphasized. Inclusion of these regulations in state driver training manuals should also be considered.
TRB State-of-the-Art Report 2
Utilities
Coordination with utilities at the time of construction has been discussed. Before commencing design, a direct liaison should be established with each utility. Procedures should be established that accommodate route maintenance needs of the various agencies. It is common practice in most areas to notify all utilities before making any street or sidewalk openings. Emergency procedures should also be developed.
CONCLUSIONS
The objective has been to raise various considerations for review when street operation is being seriously considered. There is no doubt that other site-specific considerations will also surface and need to be addressed.
An in-depth exploration, evaluation, and resolution of all these considerations should result in
• A realization that LRT street operations can be practical, desirable, and effective under many more circumstances than are normally apparent;
• The development of checklist items for inclusion in both car and wayside specification preparation;
• Early involvement of both public and governmental agencies in the dialogue necessary to adequately address problems unique to street operation; and
• Adoption of a plan to ensure adequate public and passenger support and safety.
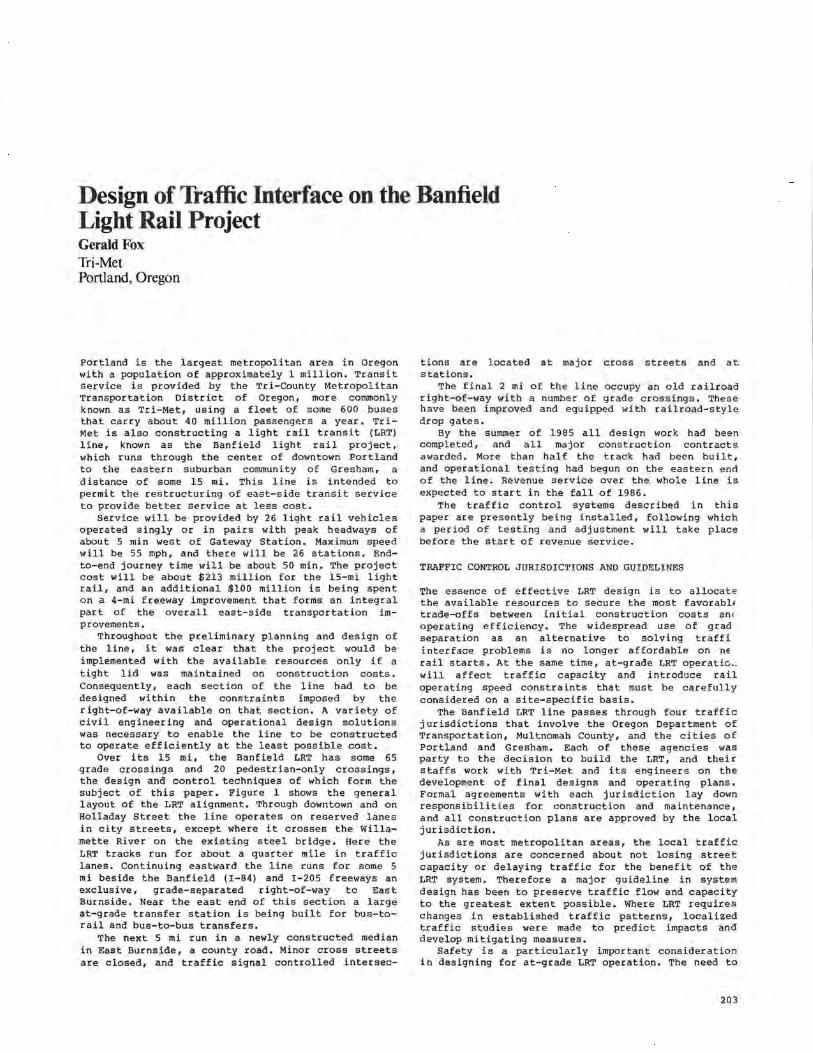
Design of Traffic Interface on the Banfield Light Rail Project Gerald Fox Tri-Met Portland, Oregon
Portland is the largest metropolitan area in Oregon with a population of approximately 1 million. Transit service is provided by the Tri-County Metropolitan Transportation District of Oregon, more commonly known as Tri-Met, using a fleet of some 600 buses that carry about 40 million passengers a year. TriMet is also constructing a light rail transit (LRT) line, known as the Banfield light rail project, which runs through the center of downtown Portland to the eastern suburban community of Gresham, a distance of some 15 mi. This line is intended to permit the restructuring of east-side transit service to provide better service at less cost.
Service will be provided by 26 light rail vehicles operated singly or in pairs with peak headways of about 5 min west of Gateway Station. Maximum speed will be 55 mph, and there will be 26 stations. Endto-end journey time will be about 50 min. The project cost will be about $213 million for the 15-mi light rail, and an additional $100 million is being spent on a 4-mi freeway improvement that forms an integral part of the overall east-side transportation improvements.
Throughout the preliminary planning and design of the line, it was clear that the project would be implemented with the available resources only if a tight lid was maintained on construction costs. Consequently, each section of the line had to be designed within the constraints imposed by the right-of-way available on that section. A variety of civil engineering and operational design solutions was necessary to enable the line to be constructed to operate efficiently at the least possible cost.
Over its 15 mi, the Banfield LRT has some 65 grade crossings and 20 pedestrian-only crossings, the design and control techniques of which form the subject of this paper. Figure 1 shows the general layout of the LRT alignment. Through downtown and on Holladay Street the line operates on reserved lanes in city streets, except where it crosses the Willamette River on the existing steel bridge. Here the LRT tracks run for about a quarter mile in traffic lanes. Continuing eastward the line runs for some 5 mi beside the Banfield (I-84) and I-205 freeways an exclusive, grade-separated right-of-way to East Burnside. Near the east end of this section a large !lt-grade transfer 'station is being built for bus-torail and bus-to-bus transfers.
The next 5 mi run in a newly constructed median in East Burnside, a county road. Minor cross streets are closed, and traffic signal controlled intersec-
tions are located at major cross streets and at stations.
The final 2 mi of the line occupy an old railroad right-of-way with a number of grade crossings. These have been improved and equipped with railroad-style drop gates.
By the summer of 1985 all design work had been completed, and all major construction contracts awarded. More than half the track had been built, and operational testing had begun on the eastern end of the line. Revenue service over the whole line is expected to start in the fall of 1986.
The traffic control systems described in this paper are presently being installed, following which a period of testing and adjustment will take place before the start of revenue service.
TRAFFIC CONTROL JURISDICTIONS AND GUIDELINES
The essence of effective LRT design is to allocate the available resources to secure the most favorabli trade-offs between initial construction costs ani operating efficiency. The widespread use of grad separation as an alternative to solving traffi interface problems is no longer affordable on ne rail starts. At the same time, at-grade LRT operati0 .. will affect traffic capacity and introduce rail operating speed constraints that must be carefully considered on a site-specific basis.
The Banfield LRT line passes through four traffic jurisdictions that involve the Oregon Department of Transportation, Multnomah County, and the cities of Portland and Gresham. Each of these agencies was party to the decision to build the LRT, and their staffs work with Tri-Met and its engineers on the development of final designs and operating plans. Formal agreements with each jurisdiction lay down responsibilities for construction and maintenance, and all construction plans are approved by the local jurisdiction.
As are most metropolitan areas, the local traffic jurisdictions are concerned about not losing street capacity or delaying traffic for the benefit of the LRT system. Therefore a major guideline in system design has been to preserve traffic flow and capacity to the greatest extent possible. Where LRT requires changes in established traffic patterns, localized traffic studies were made to predict impacts and develop mitigating measures.
Safety is a particularly important consideration in designing for at-grade LRT operation. The need to
203
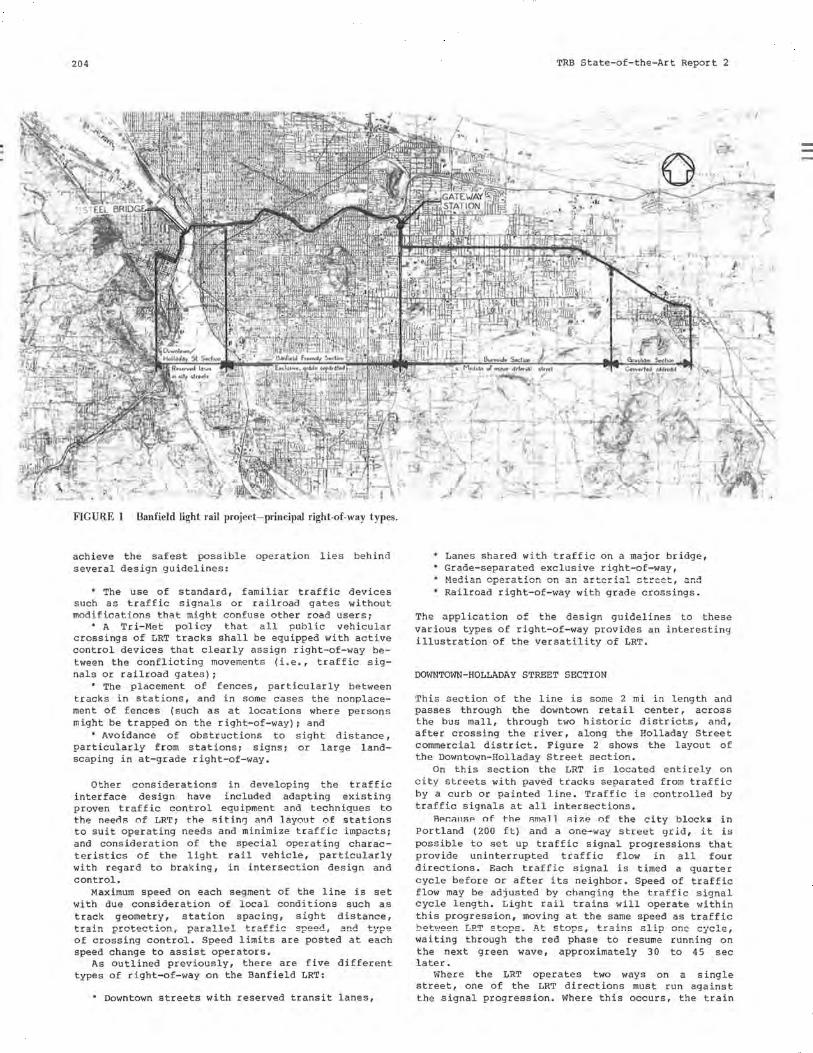
204 TRB State-of-the-Art Report 2
FIGURE 1 Banfield light rail project-principal right-of-way types.
achieve the safest possible operation lies behind several design guidelines:
• The use of standard, familiar traffic devices such as traffic signals or railroad gates without modifications that might confuse other road users,
• A Tri-Met policy that all public vehicular crossings of LRT tracks shall be equipped with active control devices that clearly assign right-of-way between the conflicting movements (i.e., traffic signals or railroad gates);
• The placement of fences, particularly between tracks in stations, and in some cases the nonplacement of fences (such as at locations where persons might be trapped on the right-of-way); and
'Avoidance of obstructions to sight distance, particularly from stations; signs; or large landscaping in at-grade right-of-way.
Other t""nnsinol'":::d·inns in developing the traffic interface design have included adapting existing proven traffic control equipment and techniques to the neer:ls of LRT; the sitinl) anr:1 layout of 5tations to suit operating needs and minimize traffic impacts ; and consideration of the special operating characteristics of the light rail vehicle, particularly with regard to braking, in intersection design and control.
Maximum speed on each segment of the line is set with due consideration of local conditions such a s track geometry, station spacing, sight distance, +-r~;n prnt-ot""'t-inn, parallel t-r~F-Fi,... c:!poon, and type of crossing control. Speed limits are posted at each speed change to assist operators.
As outlined previously, there are five different types of right-of-way on the Banfield LRT:
• Downtown streets with reserved transit lanes,
• Lanes shared with traffic on a major bridge, Grade-separated exclusive right-of-way,
• Railroad right-of-way with grade crossings.
Th e application of the design guidelines to these various types of right-of-way provides an interesting illustration of the versatility of LRT.
DOWNTOWN-HOLLADAY STREET SECTION
This section of the line is some 2 mi in length and passes through the downtown retail center, across the bus mall, through two historic districts, and, after crossing the river, along the Holladay Street commercial district. Figure 2 shows the layout of the Downtown-Holladay Street section.
On this section the LRT is located entirely on c i t y streets with paved tracks separated from traffic by a curb or painted line. Traffic is controlled by traffic signals at all intersections.
flpr.;rnsP nf thP sma 11 size of the city blocks;; in Portland (200 ft) and a one-way s t reet grid, it is possible to set up traffic signal progressions that provide uninterrupted traffic flow in all four directions. Each traffic signal is timed a quarter cycle before or after its neighbor. Speed of traffic flow may be adjusted by chang i ng the t raffic signa l cycle length. Light rail trains will operate within this progression, moving at the same speed as traffic between ~RT stops. At stops, ~~~;"~ ~1 ~p one cycle , waiting through the red phase to resume running on the next green wave, approximately 30 to 45 sec later.
Where the LRT operates two ways on a single street, one of the LRT directions must run against the signal progression. Where this occurs, the train
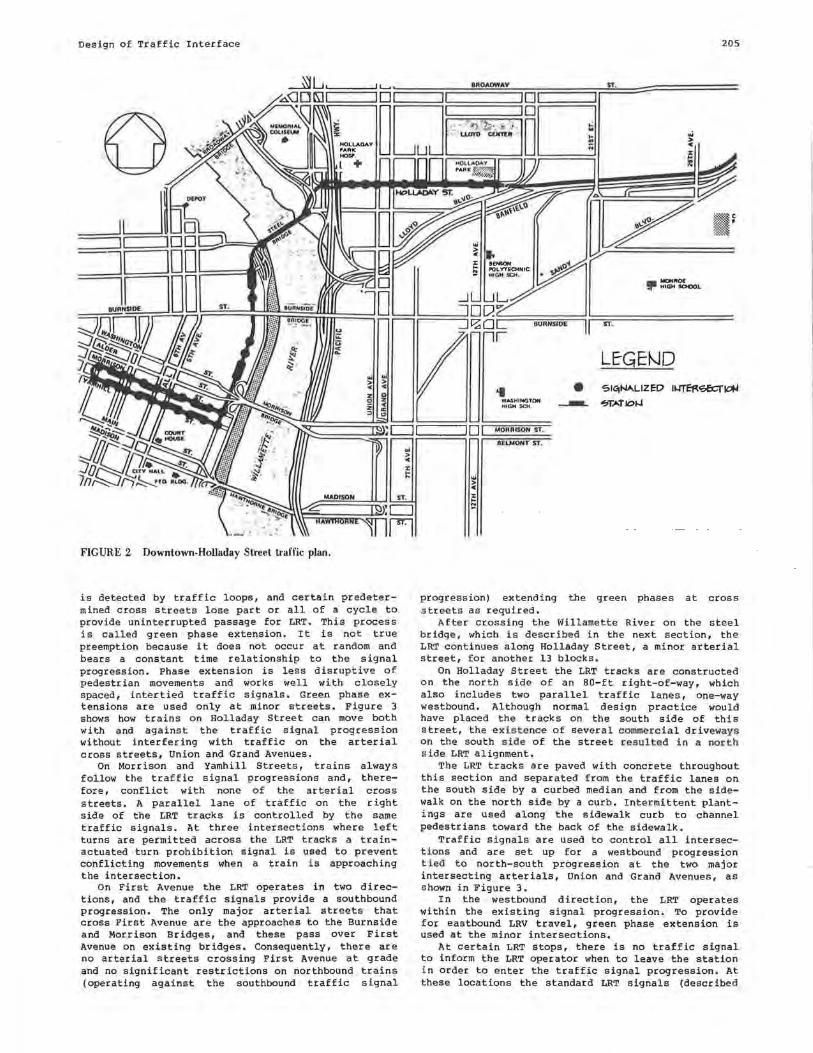
Design of Traffic Interface
FIGURE 2 Downtown-Holladay Street traffic plan.
is detected by traffic loops, and certain predetermined cross streets lose part or all of a cycle to provide uninterrupted passage for LRT. This process is called green phase extension. It is not true preemption because it does not occur at random and bears a constant time relationship to the signal progression. Phase extension is less disruptive of pedestrian movements and works well with closely spaced, inter tied traffic signals. Green phase extensions are used only at minor streets. Figure 3 shows how trains on Holladay Street can move both with and against the traffic signal progression without interfering with traffic on the arterial cross streets, Union and Grand Avenues.
On Morrison and Yamhill Streets, trains always follow the traffic signal progressions and, therefore, conflict with none of the arterial cross streets. A parallel lane of traffic on the right side of the LRT tracks is controlled by the same traffic signals. At three intersections where left turns are permitted across the LRT tracks a trainactuated turn prohibition signal is used to prevent conflicting movements when a train is approaching the intersection.
On First Avenue the LRT operates in two directions, and the traffic signals provide a southbound progression. The only major arterial streets that cross First Avenue are the approaches to the Burnside and Morrison Bridges, and these pass over First Avenue on existing bridges. Consequently, there are no arterial streets crossing First Avenue at grade and no significant restrictions on northbound trains (operating against the southbound traffic signal
... > " :c s
... WASH INGTON HIGM SCH.
,_.OR RISON ST.
8UMONT ST •
205
ST.
ST.
LE-GEt-JD • SIG(IJ.I.LIZl:D II-IT'eR'5b:::riotJ
--. ~T,a,.TIOIJ
progression) extending the green phases at cross streets as required.
After crossing the Willamette River on the steel bridge, which is described in the next section, the LRT continues along Holladay Street, a minor arterial street, for another 13 blocks.
On Holladay Street the LRT tracks are constructed on the north side of an 80-ft right-of-way, which also includes two parallel traffic lanes, one-way westbound. Although normal design practice would have placed the tracks on the south side of this street, the existence of several commercial driveway s on the south sid e of the street resulted in a north side LRT alignment,
The LRT tracks are paved with concrete throughout this section and separated from the traffic lanes on the south side by a curbed median and from the sidewalk on the north side by a curb. Intermittent plantings are used along the sidewalk curb to channel pedestrians toward the back of the sidewalk.
Traffic signals are used to control all intersect i ons and are set up for a westbound progression t ied to north-south progression at the two major intersecting arterials, Union and Grand Avenues, as shown in Figure 3.
In the westbound direction, the LRT operates within the existing signal progression. To provide for eastbound LRV travel, green phase extension is used at the minor intersections.
At certain LRT stops, there is no traffic signal to inform the LRT operator when to leave the station in order to enter the traffic signal progression. At these locations the standard LRT signals (described
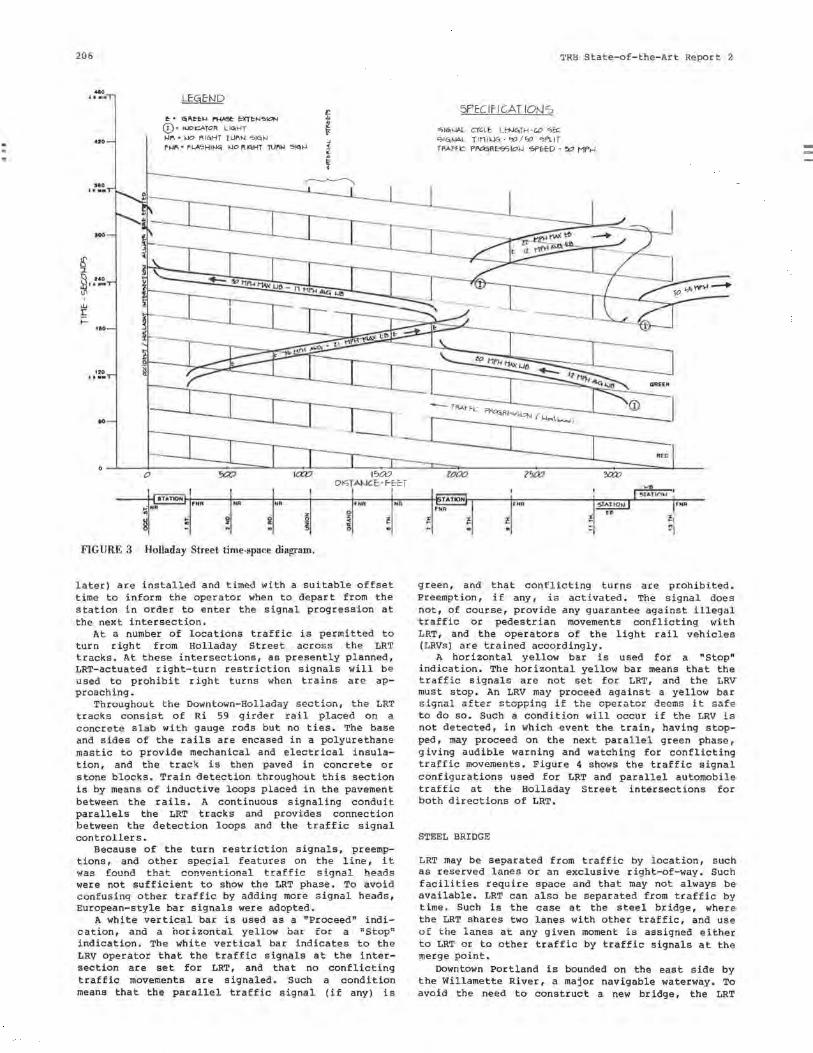
206
.. o j • • • •
••o
HO , ...
...
100
120 It••
••
0 0
LE:GE:ND
~ • a."~1=t.J f'"HA"5l:' txr~...ie:,\Ol"t,j 0 • lt.JPk:ATOR UGiHT
1-11'1 • >JO f'l<iHT TL.il'lt-1 51<;1-l ft-11'1" f LA5HI~ t-10 l'.l<oHT TUl'IM e.1<1t-J
~ fa'.V l':><'.X) DISTAI-.ICE:-F-EcE:T
HR H" '"" ~ i
0
0 z Ii " .
~ l'i
F1GURE 3 Holladay Street time-space diagram.
later) are installed and timed with a suitable offset time to inform the operator when to depart from the station in order to enter the signal progression at the next intersection.
At a number of locations traffic is permitted to turn right from Holladay Street across the LRT tracks. At these intersections, as presently planned, LRT-actuated right-turn restriction signals will be used to prohibit right turns when trains are approaching.
Throughou t t he Downt own-Holladay section, the LRT tracks consist of Ri 59 girder rail placed on a concrete slab with gauge rods but no ties. The base and sides of the rails are encased in a polyurethane mastic to provide mechanical and electrical insulation, and the track is then paved in concrete or stone blocks. Train detection throughout this section is by means of inductive loops p l aced in the pavement between the rails. A continuous signaling conduit parallels the LRT tracks and provides connection between the detection loops and the traffic signal controllers.
Because of the turn restriction signals, preemptions, and other special features on the line, it was found that con•,entional traffic signal heads were not sufficient to show the LRT phase. To avoid confus i ng other traffic by adding more signal heads, European-style bar signals were adopted.
HR
A white vertical bar is used as a "Proceed" indication, and a horizontal yellow bar for a "Stop" indication. The white vertical bar indicates to the LRV operator that the traffic sign_als at the intersection are set for LRT, and that no conflicting traffic movements are signaled. Such a condition means that the parallel traffic signal (if any) is
5PE:Clf1CAT IO~S
">l<'ai-lAL Cl'GL t Ltt-JO,TH -W ">E:c <;10,""'"- TIMl'-10, - ':0/':0 'c>PLIT
·rRB State- of- t he-Art Report 2
TAAffk: Pl'a,;R-lof..l 'SPE±D - !110 Mf'h
t(JCJO Z!itl? 3lU:>
.... f Hn
t
green, and that conflicting turns are prohibited. Preemption, if any, is activated. The signal does not, of course, provide any guarantee against illegal traffic or pedestrian movements conflicting with LRT, and the operators of the light rail vehicles (LRVs) are trained accordingly .
A horizontal yellow bar is used for a "Stop" indication. The horizontal yellow bar means that the traffic signals are not set for LRT, and the LRV must stop. An LRV may proceed against a yellow bar s ignal after stopping if the operator deems it s afe to do so. Such a condition will occur if the LRV is not detected, in which event the train , having stopped, may proceed on the next parallel green phase, giving audible warning and watching for conflicting traffic movements. Figure 4 shows the traffic signal configurations used for LRT and parallel automobile traffic at the Holladay Street intersections for both directions of LRT.
STEEL BRIDGE
LRT may be separated from traffic by location, such as reserved lanes or an exclusive right-of-way . Such facilities require space and that may not always be available. LRT can also be separated from traffic by time . Such is the case at the s t eel br i dge, where the LRT shares two lanes with other traffic, and use of the lanes at any given moment is assigned either to LRT or to other traffic by traffic signals at the merge point.
Downtown Portland is bounded on the east side by the Willamette River, a major navigable waterway. To avoid the need to construct a new bridge, the LRT
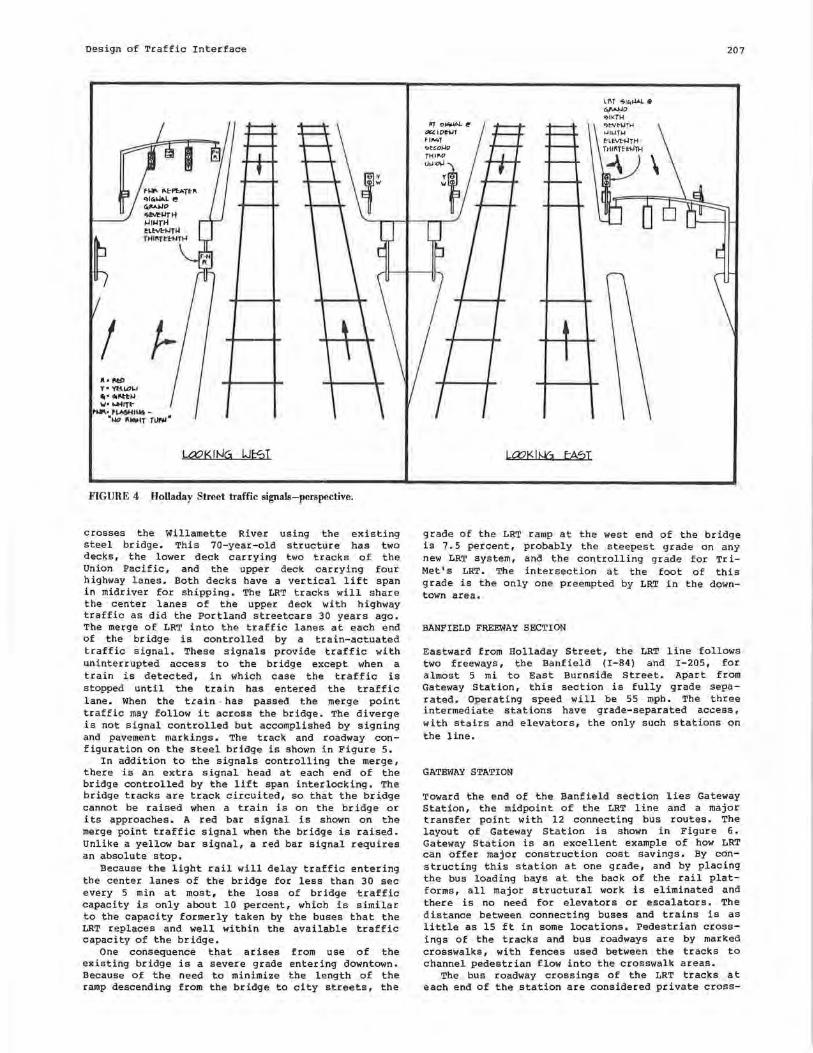
Design of Traffic Interface
... l'tD Y• 'l'liLDU ..... _IJ w•....i1Tt-
~ .... ~~1uo."IJl>' "~T TLJl'Ol 0
L?QKING 1.JtsT
FIGURE 4 Holladay Street traffic signals-perspective.
crosses the Willamette River using the existing steel bridge. This 70-year-old structure has two decks, the lower deck carrying two tracks of the Union Pacific, and the upper deck carrying four highway lanes. Both decks have a vertical lift span in midriver for shipping. The LRT tracks will share the center lanes of the upper deck with highway traffic as did the Portland streetcars 30 years ago. The merge of LRT into the traffic lanes at each end of the bridge is controlled by a train-actuated traffic signal. These signals provide traffic with uninterrupted access to the bridge except when a train is detected, in which case the traffic is stopped until the train has entered the traffic lane. When the t.ain . has passed the merge point traffic may follow it across the bridge. The diverge is not signal controlled but accomplished by signing and pavement markings. The track and roadway configuration on the steel bridge is shown in Figure 5.
In addition to the signals controlling the merge, there is an extra signal head at each end of the bridge controlled by the lift span interlocking. The bridge tracks are track circuited, so that the bridge cannot be raised when a train is on the bridge or its approaches. A red bar signal is shown on the merge point traffic signal when the bridge is raised. Unlike a yellow bar signal, a red bar signal requires an absolute stop.
Because the light rail will delay traffic entering the center lanes of the bridge for less than 30 sec every 5 min at most, the loss of bridge traffic capacity is only about 10 percent, which is similar to the capacity formerly taken by the buses that the LRT replaces and well within the available traffic capacity of the bridge.
One consequence that arises from use of the existing bridge is a severe grade entering downtown. Because of the need to m1n1m1ze the length of the ramp descending from the bridge to city streets, the
207
grade of the LRT ramp at the west end of the bridge is 7. 5 percent, probably the steepest grade on any new LRT system, and the controlling grade for TriMet' s LRT. The intersection at the foot of this grade is the only one preempted by LRT in the downtown area.
BANFIELD FREEWAY SECTION
Eastward from Holladay Street, the LRT line follows two freeways, the Banfield (I-84) and I-205, for almost 5 mi to East Burnside Street. Apart from Gateway Station, this section is fully grade separated. Operating speed will be 55 mph. The three intermediate stations have grade-separated access, with stairs and elevators, the only such stations on the line.
GATEWAY STATION
Toward the end of the Banfield section lies Gateway Station, the midpoint of the LRT line and a major transfer point with 12 connecting bus routes. The layout of Gateway Station is shown in Figure 6. Gateway Station is an excellent example of how LRT can offer major construction cost savings. By constructing this station at one grade, and by placing the bus loading bays at the back of the rail platforms, all major structural work is eliminated and there is no need for elevators or escalators. The distance between connecting buses and trains is as little as 15 ft in some locations. Pedestrian crossings of the tracks and bus roadways are by marked crosswalks, with fences used between the tracks to channel pedestrian flow into the crosswalk areas.
The bus roadway crossings of the LRT tracks at each end of the station are considered private cross-
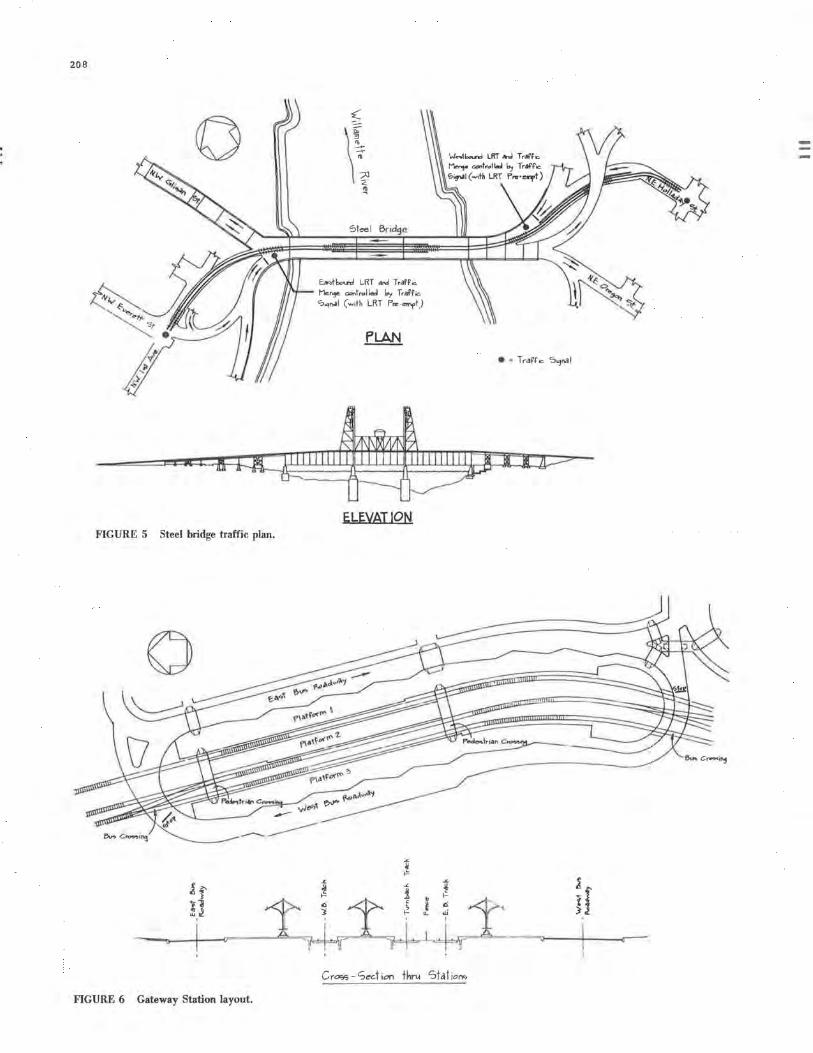
208
0
FIGURE 5 Steel bridge traffic plan.
A" 3
~ "'il ~.e!
FIGURE 6 Gateway Station layout.
Steel 6r,°':le
E.oo.tbou-d LRT •na T,aH~ Moe,'3" control led ~ T,aff;c ":>"ln.11 (-;th LRT p.., . ....,,t)
ELEVATION
... ~ ,= ... ...
!
~ i
"' E "j ~
C ro;,s - s~ct ion thn.1
! • ~\
t "' .. .u '
Stilt ion-;
Design of Traffic Interface
ings and are controlled by stop signs on the bus roadways, because these roadways are used only by Tri-Met drivers and are not open to public traffic.
BURNSIDE SECTION
South from Gateway Station, the LRT passes under the only new grade separation on the whole line and then turns east entering the median of Burnside, which it follows for the next 5 mi.
Burnside has an interesting history. From 1912 until 1928 Burnside was a railroad, which accounts for its unusually wide (100-ft) right-of-way. It then became a minor arterial street with two traffic lanes with shoulders over most of its length. After its most recent reconstruction, Burnside has one lane with a shoulder for each direction and a 28-ft median for the LRT. Extra traffic lanes are provided at intersections and east of 181st Avenue where Burnside is designated as US-26. Figure 7 shows the LRT layout on Burnside.
Construction of the LRT median in Burnside resulted in the closure of many minor side streets to traffic crossing Burnside and the concentration of cross traffic at major intersections.
There are 17 intersections along Burnside at which traffic can cross the tracks and make left turns and U-turns, all controlled by traffic signals. All the traffic signals are preempted by the LRT (!). There are also eight stations, all of them at intersections and all with far-side platforms. Farside platforms provide the least traffic delay because the train arrival time is accurately predictable, and they have the best geometrics because the platforms balance the left-turn pockets. In addition, if a train overruns a platform, it does not enter a crossing.
Because Burnside has no train protection signals or track circuits, the preemption is accomplished by means of loop detectors that activate the preempt phase in the traffic signal controllers. When a train is detected, the controller goes to the clearance phase for conflicting movements and then enters the preempt phase while the train is still at least stopping distance plus 2 sec away from the intersection. The LRV operator is informed that the signal has entered the preempt phase by a preempt signal that uses the white vertical bar to indicate the preempt phase and a yellow horizontal bar to indicate all other phases. These signals are similar to those described previously. The Burnside version is shown in Figure 8. Four hundred feet short of the intersection stop line is a mark known as the decision point. An LRV moving at the design speed of 35 mph will reach the decision point 2 sec after the preempt signal indicates the traffic signal is in the preempt phase. When the preempt phase has been selected, it will remain until the train has cleared the intersection thereby releasing it or a preset time of about 30 sec has elapsed. Traffic parallel to the LRT is permitted to move on the same phase so that little overall intersection capacity is lost.
In the event an LRV is traveling faster than 3 5 mph, or the detector fails to detect the train, it will arrive at the decision point and not get the preempt signal. When this occurs, the train operator will apply brakes and stop at the traffic signal. After having stopped, the operator may then proceed when safe. In practice, this means on the next green phase of the parallel traffic.
This preempt system achieves three important design goals:
• It is simple with the minimum of special signals and no special signals for highway traffic
209
(note that the train operator is not informed of detection but only of the preempt phase when it has begun);
• When the system fails to operate as intended, it creates nu unsafe cornll tlon and does not require the LRV to make an emergency stop; and
• Failure of the traffic signal or preempt system shall not delay LRT operations for more than a minute or so.
At locations where a station interferes with the predicted arrival time at a downstream intersection, the LRV is detected twice. The first detection is used to hold the conflicting pedestrian phase at the downstream intersection and hence reduce the required clearance interval. The second detection, which occurs after the train leaves the station, calls for the preempt phase to be initiated for which the shorter vehicle clearance interval is now required. Using this system, Tri-Met expects to get 100 percent preemption whenever required at all 17 intersections except for two where, in one direction, when a preemption is called for at the least favorable phase of the traffic signal cycle, a delay of up to 5 sec may occur. With the design adopted for Burnside, no additional signals or hardware are required at these two intersections.
In addition to the signalized vehicle intersections, there are also some 14 pedestrian crossings on Burnside that occur remote from an intersection. These crossings are all unsignalized "Z" crossings based on a design widely used in Europe. Figure 9 shows a typical "Z" crossing layout. This simple design provides a pedestrian refuge between the traffic and the LRT lanes and forces pedestrians to turn toward oncoming trains before they can cross the tracks. As an additional safety precaution, LRV operators will slow down when pedestrians are observed waiting in the "Z" crossing refuges.
The issue of whether to install fencing along the Burnside median was and continues to be the subject of much discussion. Tri-Met decided not to fence the median for several reasons:
• Additional right-of-way would be required to provide clearance for LRVs on one side and traffic on the other.
• If the fence were damaged it could cause an accident by fouling LRV clearance.
• Fencing would interfere with maintenanLe access.
• Fencing could trap people within the trackway. • Fencing could reduce sight distance for both
traffic and LRT. • Fencing would create a physical and visual
barrier through the neighborhood not justified by sufficient public benefit.
• Fencing or partial fencing can be added in the future if needed, perhaps between tracks. Because pedestrians will sometimes cross the trackway, operators will be instructed to slow the train where necessary for pedestrian safety. With the construct ion of street lighting and sidewalks throughout Burnside as part of the project, and taking account of the time it takes to access the trackway across the parallel street, pedestrians on the trackway are not expected to be a major problem.
PORTLAND TRACTION
The last 2 mi of the Banfield LRT line use the right-of-way of the former Portland Traction Company Interurban. This section of line uses single track with passing tracks at two of the three stations and has 9 grade crossings. Traffic signal control is not
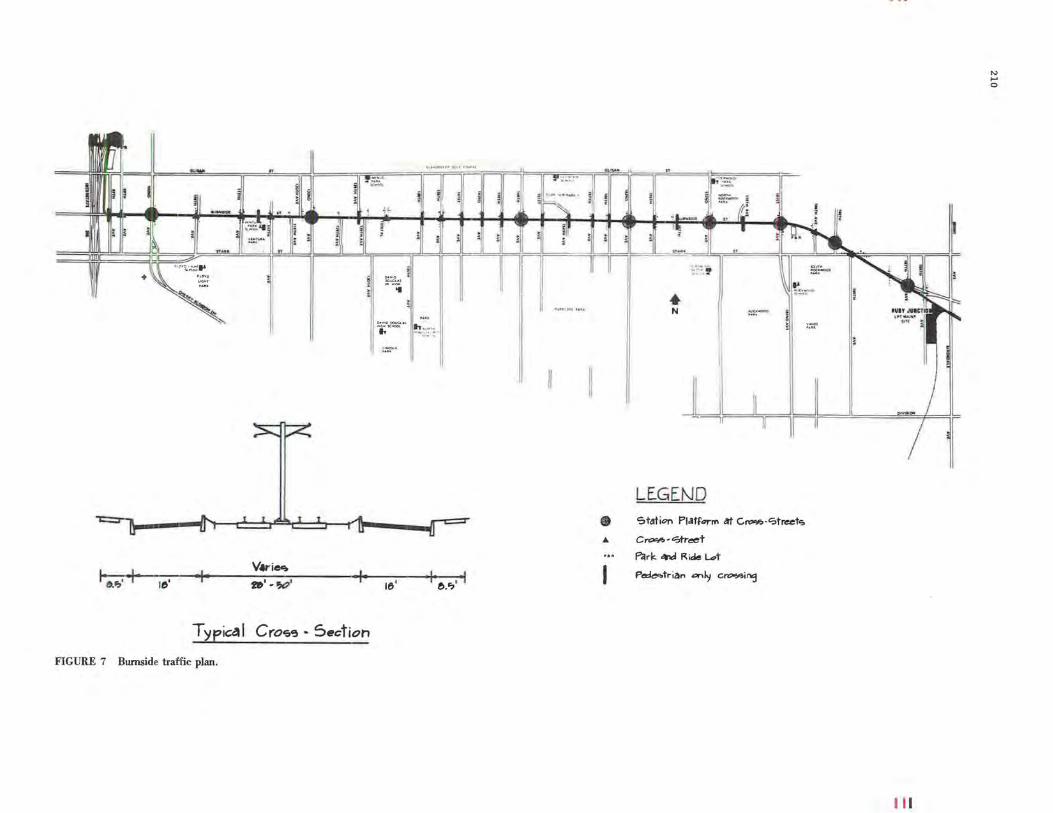
....... ~
~
~+
Ii , _i :~~ · 11 0""'0
i ..
°'"'"-"'' ,, ·~. ' .,.,K><OQI. !Li•,:-•:
1e' + V.-iec; I-~ -·-~·
Typical Cros'3 - Section
FIGURE 7 Burnside traffic plan.
1e' ~
I
'.l fl
L_JL-.J'---_JLJLJL_JL,,,,~I II JI_J~' I --,-,~1"1n,-~, n ~:«:.::::l ~nn
II ·-·- ....
II II
• ...
• t N , •. ,.
11. ::::•
J~LLil_[ -- I I
--,, 1"~ I f
LE.GENO Stlltion Plafforrn at c..--<:itre.et.,,
C ro<o'!> - ":>treet
Parl:. ~ Ride L..t
P~tr ia .. <>nly c..-i"';j
1 11
"' ,_. 0
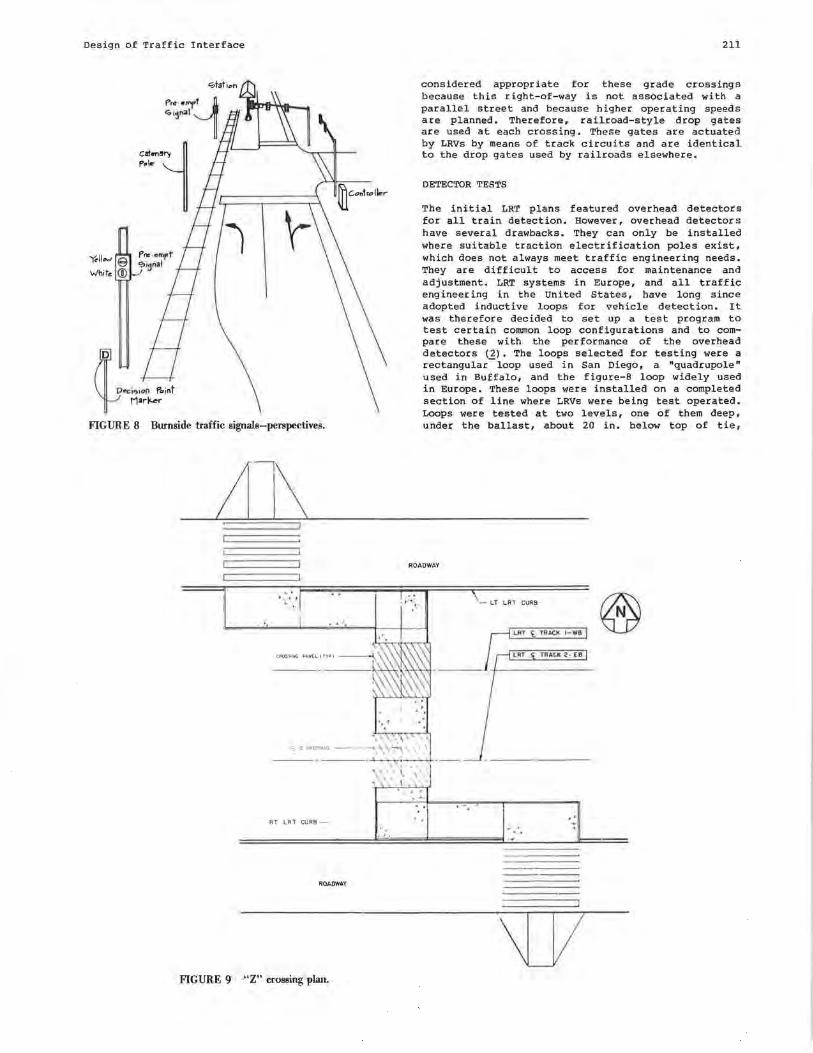
Design of Traffic Interface
;r ~~;•~ ~;oj ~ Mar~r
F1GURE 8 Burnside traffic signals-perspectives.
;[J\
•. ,'
0:ROS$1'fGPANELlTYPl---
't_ Z CROSSING
RT LRT CURB -
ROADWAY
F1GURE 9 "Z" crossing plan.
211
considered appropriate for these grade crossings because this right-of-way is not associated with a parallel street and because higher operating speeds are planned. Therefore, railroad-style drop gates are used at each crossing. These gates are actuated by LRVs by means of track circuits and are identical to the drop gates used by railroads elsewhere.
DETECTOR TESTS
The initial LRT plans featured overhead detectors for all train detection. However, overhead detectors have several drawbacks. They can only be installed where suitable traction electrification poles exist, which does not always meet traffic engineering needs. They are difficult to access for maintenance and adjustment. LRT systems in Europe, and all traffic engineering in the United States, have long since adopted inductive loops for vehicle detection. It was therefore decided to set up a test program to test certain common loop configurations and to compare these with the performance of the overhead detectors (2). The loops selected for testing were a rectangular -loop used in San Diego, a "quadrupole" used in Buffalo, and the figure-8 loop widely used in Europe. These loops were installed on a completed section of line where LRVs were being test operated. Loops were tested at two levels, one of them deep, under the ballast, about 20 in. below top of tie,
ROADWAY
- LT LRT CURB
LRT T9,L\CK 1-we
LRf TRAti< l· EO
\I_J/
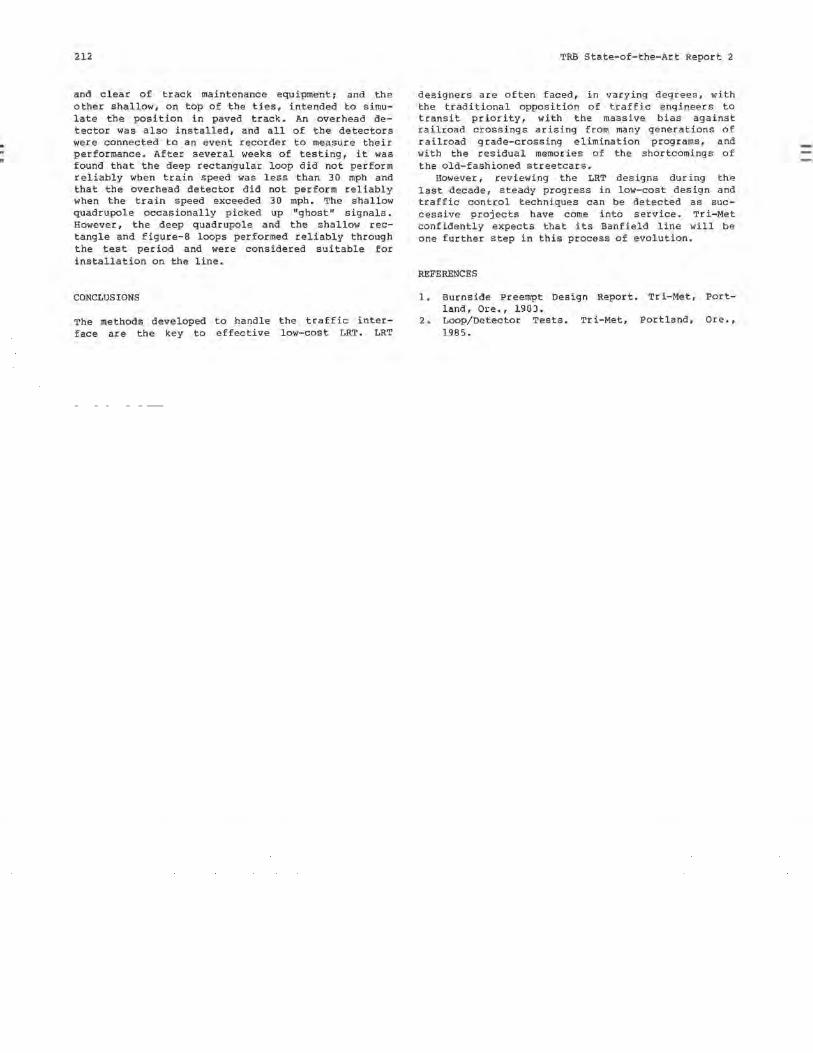
. .
212
and clear of track maintenance equipment; and the other shallow, on top of the ties, intended to simulate the position in paved track. An overhead detector was also installed, and all of the detectors were connected to an event recorder to measure their performance. After several weeks of testing, it was found that the deep rectangular loop did not perform reliably when train speed was less than 30 mph and that the overhead detector did not perform reliably when the train speed exceeded 30 mph. The shallow quadrupole occasionally picked up "ghost" signals. However, the deep quadrupole and the shallow rectangle and figure-8 loops performed reliably through the test period and were considered suitable for installation on the line.
CONCLUSIONS
The methods developed to handle the traffic interface are the key to effective low-cost LRT. LRT
TRB State-of-the-Art Report 2
designers are often faced, in varying degrees, with the traditional opposition of traffic engineers to transit priority, with the massive bias against railroad crossings arising from many generations of railroad grade-crossing elimination programs, and with the residual memories of the shortcomings of the old-fashioned streetcars.
However, reviewing the LRT designs during the last decade, steady progress in low-cost design and traffic control techniques can be detected as successive projects have come into service. Tri-Met confidently expects that its Banfield line will be one further step in this process of evolution.
REFERENCES
1. Burnside Preempt Design Report. Tri-Met, Portland, Oce., 1903.
2. Loop/Detector Tests. Tri-Met, Portland, Ore., 1985.
Integrating LRT into Flexible Traffic Control Systems Warren A. Tighe
Larry A. Patterson DKS Associates Oakland, California
Street medians can be an attractive location for an at-grade light rail transit (LRT) line. Medians offer major advantages such as existing right-of-way and proximity to existing patronage generators located along or adjacent to the street. Medians also at least partially retain lateral separation from street traffic. However, these benefits can be outweighed by delays to either light rail vehicles (LRVs) or street traffic, or both, at intersections that the LRT line crosses at grade. In this paper are describe the planned solutions to this problem for the proposed Woodward Corridor line in and adjacent to Detr0i t, Michigan, and for the Guadalupe Corridor line presently (1985) under construction in Santa Clara County, California. These two systems demonstrate how a similar approach to the problem can be used in quite different settings.
DESIGN CONSTRAINTS AND OPPORTUNITIES
The designers of an LRT system inevitably have two conflicting demands placed on them when it comes to at-grade operations through street intersections. It is usually expected that LRVs will have priority at intersections in order that total travel time be consistent and kept to a minimum. Yet it is also expected that normal intersection operation will be maintained so that peak-hour traffic delays are not worsened. The extent to which both objectives can be simultaneously met depends on the design constraints and opportunities.
The following i terns are some of the major constraints and opportunities that face the designer of an at-grade LRT line in a street median:
1. LRV speed, 2. LRT station location, 3. Platform location relative to the inter
section, 4. Station dwell time and variability, 5. LRV consists (number of cars trained to
gether), 6. LRV headways, 7. Reverse running policy (emergency two-way
operation on one track), 8. LRV acceleration and deceleration per
formance, 9. Intersection spacing,
10. Street traffic volumes, 11. Street closures,
12. Turning movement restrictions, 13. Traffic signal coordination on this street
and crossing streets, 14. Street right-of-way width, 15. Number of traffic lanes, 16. Parking restrictions, 17. Street speed limit and average travel speed, 18. Type of traffic control at intersections, and 19. Traffic and LRT control and operating regu
lations.
Many of the items in this list are variables, and many are interdependent. The design process ideally involves choosing the optimum combination of all such variables. In practice many of the variables will be predetermined or restricted to small ranges by considerations other than traffic and LRT operational efficiency. For example, the location of stations is usually largely determined by factors such as proximity to major patronage generators.
Not only is it impractical for all of these factors to be optimized for traffic and LRT operations, but some of them are continually changing in a cyclical pattern and may permanently change in unpredictable ways during the life of the LRT system. This is especially true of traffic volumes and LRT headways. What is needed, therefore, is a flexible traffic and LRT control system that can optimize performance for any given set of conditions. Before discussing such control systems designed for use in the Woodward and Guadalupe Corridors, some explanation of the choices available for intersection traffic control devices in the presence of LRT is needed.
INTERSECTION TRAFFIC CONTROL OPTIONS
The safe operation of LRVs through intersections requires that the LRV approach speed be restricted to a level consistent with the type of traffic control provided at the crossing. If the LRT tracks are fully protected by railroad-type gates, then, subject to other safety considerations such as speed differential between automobiles and LRVs and adequate queue clearance, it can be safe to operate LRVs through intersections at speeds as high as 55 mph (88 km/hr). This type of operation requires railroad-type preemption of any traffic signals at the intersection in order to operate the gates in advance of the LRV's arrival. The combination of signal preemption and time lost in operation of the
213
. .
214
=ailroad gates can be disruptive to street traffic at the intersection. It is also usually physically impractical to construct an adequately gated crossing in the middle of an intersection because of the physical space requirements of the control hardware.
At signalized intersections LRVs in the median can be provided with a separate traffic signal display and required to stop or proceed in accordance with that signal, in exactly the same way as automobile traffic. All traffic movements that cross the tracks, including left turns, should be protected by a separate traffic signal phase or other means such as illuminated turn restriction signs. Because an LRV may have to stop on short 11otice when its signal display changes to yellow, the LRV approach speed at signalized intersections must be restricted to a speed from which the vehicle can be stopped in a reasonable time and distance. The deceleration capabilities of LRVs and consideration of the comfort and safety of standing passengers require that LRV speeds be restricted to a maximum of approximately 35 mph (56 km/hr) for this type of control at signalized intersections.
LRVs can also operate safely through intersections that have only stop sign control for opposing traffic. These intersections require careful design to ensure that sight distances are adequate and that points of conflict are clearly defined. This can be an efficient control method where opposing traffic volumes are suitably light. However, it is subject to the capacity limitation of stop sign controlled intersections·.
Traffic signals are perhaps the most practical form of traffic control at most high-volume intersections to be shared with LRT. They allow a reasonable LRV operating speed without the disruptive effects of gated crossings and do not require additional space within the intersection. Signals also offer a degree of flexibility not available with alternatives. Any degree of priority, from none to total preemption, can be qiven to LRT. Furthermore, the level of priority can be varied during the day or week and can be provided to only selected LRVs such as only those in the peak direction of travel or those that are disadvantaged by the current signal coordination plan. Traffic signal coordination can also be used to provide consistent and predictable LRV travel times without the need for full LRV priority. By providing the same control over LRVs as they do over automobiles, traffic signals allow the total integration of LRT and street traffic operations.
TRAFFIC SIGNAL PHASING AND TIMING
The LRV' s unique performance character is tics, size, and location in the street right-of-way require that it be provided with a separate signal phase and special phase timing if it is to operate safely and effir.iPnt:ly t.hrough signalized intersections at speeds of up to 35 mph (56 km/hr). The LRV phase can usually operate concurrently with selected automobile phases or phase combinations. However, it must be timed separately in order to efficiently implement the additional clearance times required for LRT.
The service deceleration rate of LRVs is typically restricted to approximately 3 mph/sec (4.4 ft/sec2 or 1.34 m/sec2
) out of consideration for standing passenqers. The rate of ierk at initiation of braking is als~ normally limited to approximately 3 mph/sec2
(4.4 ft/sec' or 1.34 m/sec'). It therefore takes approximately 325 ft (93 m) to stop an LRV from 35 mph (56 km/hr) without use of emergency braking provisions. This distance will be referred to as the safe stopping distance. The LRV takes approximately 6 sec
TRB State-of-the-Art Report 2
to travel this distance at a constant 35 mph (56 km/hr).
The operator of an LRV approaching a red traffic signal, with the expectation that a green signal may be displayed at any moment, can be expected to maintain full speed until shortly before the LRV arrives at the safe stopping distance from the intersection. Assuming that the operator does not begin slowing the vehicle until 2 sec before reaching the safe stopping distance, it follows that the earliest that an LRV traveling at a constant 35 mph (56 km/hr) can arrive at the intersection is 8 sec after the start of the LRV green signal. Another way of explaining the same phenomenon is to say that the green signal must begin at least 8 sec before a full-speed LRV would arrive at the crossing if that vehicle is to continue through the intersection undelayed.
On the other hand, consider an LRV approaching during the LRV green signal display. The LRV green signal can be terminated, and a yellow display begun, while the LRV is still approaching the intersection. In this case the LRV operator will take some time to recognize the change in display from green to yellow, to make a decision whether to stop or continue through the intersection, and to apply the vehicle's brakes if the decision is to stop. There may also be a short delay in the transition from power mode to braking mode after the control lever is placed in the braking position.
Assuming the total operator and vehicle reaction time is 2 sec, a "stop or go decision point" can be located, on the basis of the safe stopping distance plus the distance traveled in 2 sec at the approach speed before the intersection. For a JS mph (5G km/hr) approach speed and these vehicle performance assumptions, the stop or go decision point is 427 ft (130 m) before the intersection. If the LRV is beyond the stop or go decision point when the signal changes from green to yellow, it will continue into the intersection, and the timing of signal change intervals must take into account the time it takes to reach the intersection from the stop or go decision point.
An LRV traveling at 35 mph (56 km/hr) takes 10 sec to travel from its stop or go decision point to the far side of a 100-ft (30-m) intersection. The total of LRV yellow plus LRV red clearance time therefore needs to also be approximately 10 sec. Then a worst case LRV, one that is traveling at the 35-mph (56-km/hr) maximum speed and has just passed the stop or go decision point when the signal changes from green to yellow, will have the front of the vehicle across the intersection when a conflicting movement first receives a green signal, as shown in Figure 1. Although the rear of the vehicle will not be clear of the intersection until as much as 5 sec later (for a three-car LRV) , motorists having just received a green signal will always be able to clearly see the conflicting LRV still across the intersection, even at night.
To avoid delaying the LRV, the LRV phase green time needs to be displayed for approximately 10 sec to ensure LRVs traveling at somewhat less than the maximum speed are beyond the stop or go decision point when the signal changes to yellow. Adding 6 sec of LRV yellow and 4 sec of red clearance gives a total required LRV phase length of as much as 20 sec. Concurrently running automobile phases can be timed independently so that their change intervals always end at the same time as, or later than, the LRV phase change interval. Thus concurrent automobile phases would continue to show green at least throughout most of the LRV yellow interval.
The use of a 10-sec change interval for LRV phases is conservative compared to the operation of other vehicles at traffic signals, especially buses. Buses also have standing passengers and therefore cannot
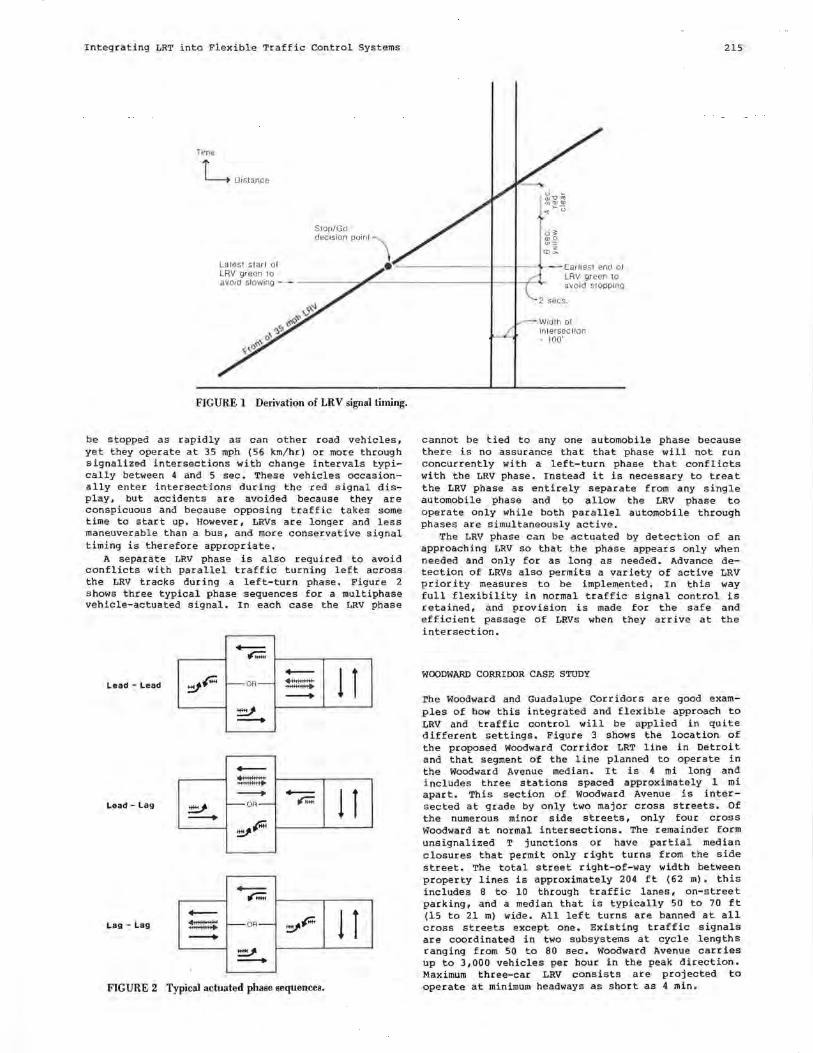
Integrating LRT into Flexible Traffic Control Systems
Time
L Distance
Latest start or LRV green to
Stop/Go decision point
,--------- -+--•- - - -Earliest end or
215
avoid stowing - ------~,i:;...----------1-- ,1--r-~ LRV green to avoid stopping
FIGURE 1 Derivation of LRV signal timing.
be stopped as rapidly as can other road vehicles, yet they operate at 35 mph (56 km/hr) or more through signalized intersections with change intervals typically between 4 and 5 sec. These vehicles occasionally enter intersections during the red signal display, but accidents are avoided because they are conspicuous and because opposing traffic takes some time to start up. However, LRVs are longer and less maneuverable than a bus, and more conservative signal timing is therefore appropriate.
A separate LRV phase is also required to avoid conflicts with parallel traffic turning left across the LRV tracks during a left-turn phase. Figure 2 shows three typical phase sequences for a multiphase vehicle-actuated signal. In each case the LRV phase
-r-
Lead - Lead - 1 l '9r- -OR- ---~ --~::::::::.
Lead - Lag - - 1 l ~ t---OA- .r.;;; - .,_(i+i<
-r.;;;;
Lag - Lag - l l ~' ':::,,:~ t--- OR - , .... - ~ -FIGURE 2 Typical actuated phase sequences.
cannot be tied to any one automobile phase because there is no assurance that that phase will not run concurrently with a left-turn phase that conflicts with the LRV phase. Instead it is necessary to treat the LRV phase as entirely separate from any single automobile phase and to allow the LRV phase to operate only while both parallel automobile through phases are simultaneously active.
The LRV phase can be actuated by detection of an approaching LRV so that the phase appears only when needed and only for as long as needed. Advance detection of LRVs also permits a variety of active LRV priority measures to be implemented. In this way full flexibility in normal traffic signal control is retained, and provision is made for the safe and efficient passage of LRVs when they arrive at the intersection.
WOODWARD CORRIDOR CASE STUDY
rhe Woodward and Guadalupe Corridors are good examples of how this integrated and flexible approach to LRV and traffic control will be applied in quite different settings. Figure 3 shows the location of the proposed Woodward Corridor LRT line in Detroit and that segment of the line planned to operate in the Woodward Avenue median. It is 4 mi long and includes three stations spaced approximately l mi apart. This section of Woodward Avenue is intersected at grade by only two major cross streets. Of the numerous minor side streets, only four cross Woodward at normal intersections. The remainder form unsignalized T junctions or have partial median closures that permit only right turns from the side street. The total street right-of-way width between property lines is approximately 204 ft (62 m). this includes 8 to 10 through traffic lanes, on-street parking, and a median that is typically 50 to 70 ft (15 to 21 m) wide. All left turns are banned at all cross streets except one. Existing traffic signals are coordinated in two subsystems at cycle lengths ranging from 50 to 80 sec. Woodward Avenue carries up to 3,000 vehicles per hour in the peak direction. Maximum three-car LRV consists are projected to operate at minimum headways as short as 4 min,
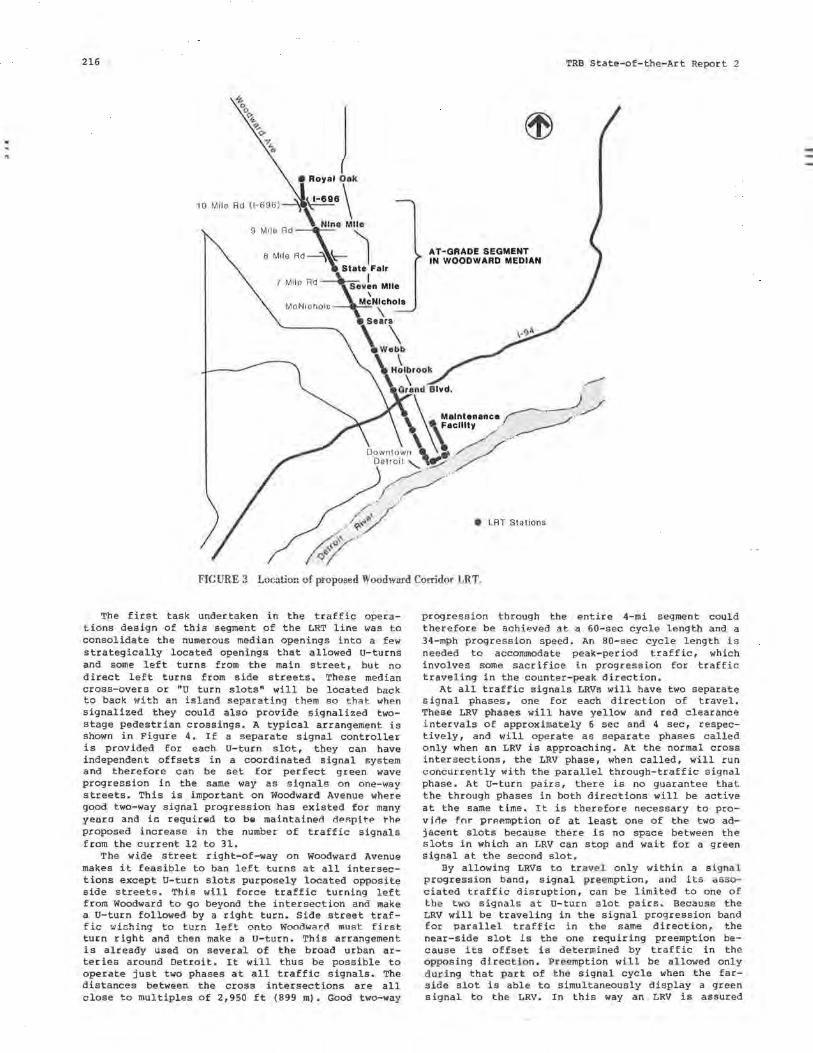
216
10 Mile
! • Royal Ook
~t696 \
9 Mile Rd :;Nino M~
8 Mile Rd~ k- I State Fair
TRB State-of-the-Art Report 2
AT-GRADE SEGMENT IN WOODWARD MEDIAN
' "''" aa \+ "'" MoNioholc McNlchola
• Sears
\wi \ H~lbrook
\ -~ tJGrand Blvd. .
•\Facility ./ __--\~
M. alntenance ,.,----..~/
\ ,\ / ... Downto_wn .. '-el / ./ Detroit,~/
Y,/ ' /~.'
~,; • LRT Stations
FICURE 3 Location of proposed Woodward Corridor LRT.
The first task undertaken in the traffic operations design of this segment of the LRT line was to consolidate the numerous median openings into a few strategically located openings that allowed u-turns and some left turns from the main street, but no direct left turns from side streets. These median cross-overs or "U turn slots" will be located back to back with an island separating them so that when signalized they could also provide signalized twostage pedestrian crossings. A typical arrangement is shown in Figure 4. If a separate signal controller is provided for each u-turn slot, they can have independent offsets in a coordinated signal system and therefore can be set for perfect green wave progression in the same way as signals on one-way streets. This is important on Woodward Avenue where good two-way signal progression has existed for many yenro and io required to be maintained despite thP proposed increase in the number of traffic signals from the current 12 to 31.
The wide street right-of-way on Woodward Avenue makes it feasible to ban left turns at all intersections except U-turn slots purposely located opposite side streets. This will force traffic turning left from Woodward to go beyond the intersection and make a U-turn followed by a right turn. Side street traffic wishing to turn left onto Woodward must first turn right and then make au-turn. This arrangement is already used on several of the broad urban arteries around Detroit. It will thus be possible to operate just two phases at all traffic signals. The distances between the cross intersections are all close to multiples of 2,950 ft (899 m). Good two-way
progression through the entire 4-mi segment could therefore be achieved at a 60-sec cycle length and a 34-mph progression speed. An 80-sec cycle length is needed to accommodate peak-period traffic, which involves some sacrifice in progression for traffic traveling in the counter-peak direction.
At all traffic signals LRVs will have two separate signal phases, one for each direction of travel. These LRV phases will have yellow and red clearance intervals of approximately 6 sec and 4 sec, respectively, and will operate as separate phases called only when an LRV is approaching. At the normal cross intersections, the LRV phase, when called, will run concurrently with the parallel through-traffic signal phase. At u-turn pairs, there is no guarantee that the through phases in both directions will be active at the same time. It is therefore necessary to provide fnr prP.P.mption of at least one of the two adjacent slots because there is no space between the slots in which an LRV can stop and wait for a green signal at the second slot.
By allowing LRVs to travel only within a signal progression band, signal preemption, and its associated traffic disruption, can be limited to one of the two signals at u-turn slot pairs. Because the LRV will be traveling in the signal progression band for parallel traffic in the same direction, the near-side slot is the one requiring preemption because its offset is determined by traffic in the opposing direction. Preemption will be allowed only during that part of the signal cycle when the farside slot is able to simultaneously display a green signal to the LRV. In this way an LRV is assured
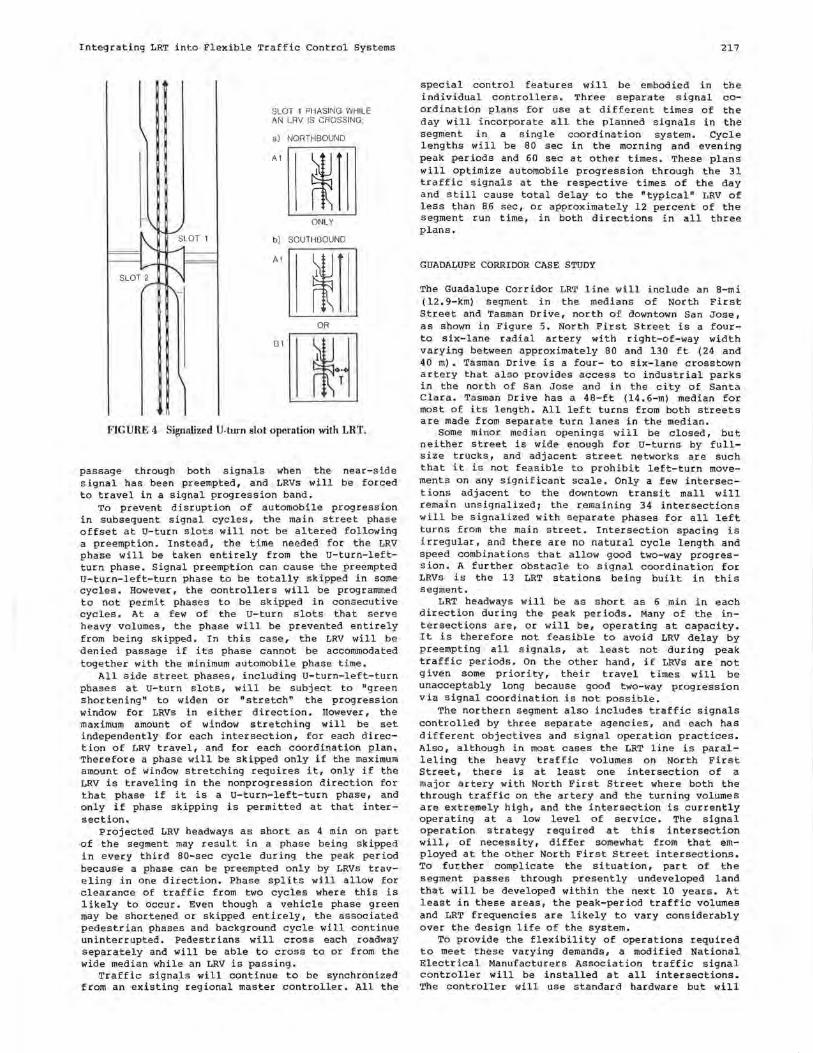
Integrating LRT into Flexible Traffic Control Systems
SLOT 1 PHASING WHILE AN LAV IS CROSSING:
al NORTHBOUND
Al [I ONLY
b) SOUTHBOUND
Al [I OR
Bl
m FIGURE 4 Signalized U-turn slot operation with LRT.
passage through both signals when the near-side signal has been preempted, and LRVs will be forced to travel in a signal progression band.
To prevent disruption of automobile progression in subsequent signal cycles, the main street phase offset at U-turn slots will not be altered following a preemption. Instead, the time needed for the LRV phase will be taken entirely from the u-turn-leftturn phase. Signal preemption can cause the preempted u-turn-left-turn phase to be totally skipped in some cycles. However, the controllers will be programmed to not permit phases to be skipped in consecutive cycles . At a few of the U-turn slots that se rve heavy volumes, the phase will be prevented entirely from being skipped. In this case, the LRV will be denied passage if its phase cannot be accommodated together with the minimum automobile phase time.
All side street phases, including u-turn-left-turn phases at u-turn slots, will be subject to "green shortening" to widen or "stretch" the progression window for LRVs in either direction. However, the maximum amount of window stretching will be set independently for each intersection, for each direction of LRV travel, and for each coordination plan. Therefore a phase will be skipped only if the maximum amount of window stretching requires it, only if the LRV is traveling in the nonprogression direction for that phase if it is a u-turn-left-turn phase, and only if phase skipping is permitted at that intersection.
Projected LRV headways as short as 4 min on part of the segment may result in a phase being skipped in every third 80-sec cycle during the peak period because a phase can be preempted only by LRVs traveling in one direction. Phase splits will allow for clearance of traffic from two cycles where this is likely to occur. Even though a vehicle phase green may be shortened or skipped entirely, the associated pedestrian phases and background cycle will continue uninterrupted. Pedestrians will cross each roadway separately and will be able to cross to or from the wide median while an LRV is passing.
Traffic signals will continue to be synchronized from an existing regional master controller. All the
217
special control features will be embodied in the individual controllers. Three separate signal coordination plans for use at different times of the day will incorporate all the planned signa ls in the segment in a s ingle coordination system. Cycle lengths will be 80 sec in the morning and evening peak periods and 60 sec at other times. These plans will optimize automobile progression through the 31 traffic signals at the respective times of the day and still cause total delay to the "typical" LRV of less than 86 sec, or approximately 12 percent of the segment run time, in both directions in all three plans.
GUADALUPE CORRIDOR CASE STUDY
The Guadalupe Corridor LRT line will include an 8-mi (12.9-km) segment in the medians of North First Street and Tasman Drive, north of downtown San Jose, as shown in Figure 5. North First Street is a fourto six-lane radial artery with right-of-way width varying between approximately 80 and 130 ft (24 and 40 m). Tasman Drive is a four- to six-lane crosstown artery that also provides access to industrial parks in the north of San Jose and in the city of Santa Clara. Tasman Drive has a 48-ft (14.6-m) median for most of its length. All left turns from both streets are made from separate turn lanes in the median.
Some minor median openings will be closed, but neither street is wide enough for u-turns by fullsize trucks, and adjacent street networks are such that it is not feasible to prohibit left-turn movements on any significant scale. Only a few intersections adjacent to the downtown transit mall will remain unsignalizedi the remaining 34 intersections will be signalized with separate phases for all left turns from the ma in street. Intersection spacing is irregular, and there are no natural cycle length and speed combinations that allow good two-way progress ion . A further obstacle to signal coordination for LRVs is the 13 LRT stations being built in this segment.
LRT headways will be as short as 6 min in each direction during the peak periods. Many of the intersections are, or will be, operating at capacity. It is therefore not feasible to avoid LRV delay by preempting all signals, at least not during peak traffic periods. On the other hand, if LRVs are not given some priority, their travel times will be unacceptably long because good two-way progression via signal coordination is not possible.
The northern segment also includes traffic signals controlled by three separate agencies, and each has different objectives and signal operation practices. Also, although in most cases the LRT line is paralleling the heavy traffic volumes on North First Street, there is at least one intersection of a major artery with North First Street where both the through traffic on the artery and the turning volumes are extremely high, and the intersection is currently operating at a low level of service. The signal operation strategy required at this intersection will, of necessity, differ somewhat from that employed at the other North First Street intersections. To further complicate the situation, part of the segment passes through presently undeveloped land that will be developed within the next 10 years. At least in these areas, the peak-period traffic volumes and LRT frequencies are likely to vary considerably over the design life of the system.
To provide the flexibility of operations required to meet these varying demands, a modified National Electrical Manufacturers Association traffic signal controller will be installed at all intersections. The controller will use standard hardware but will
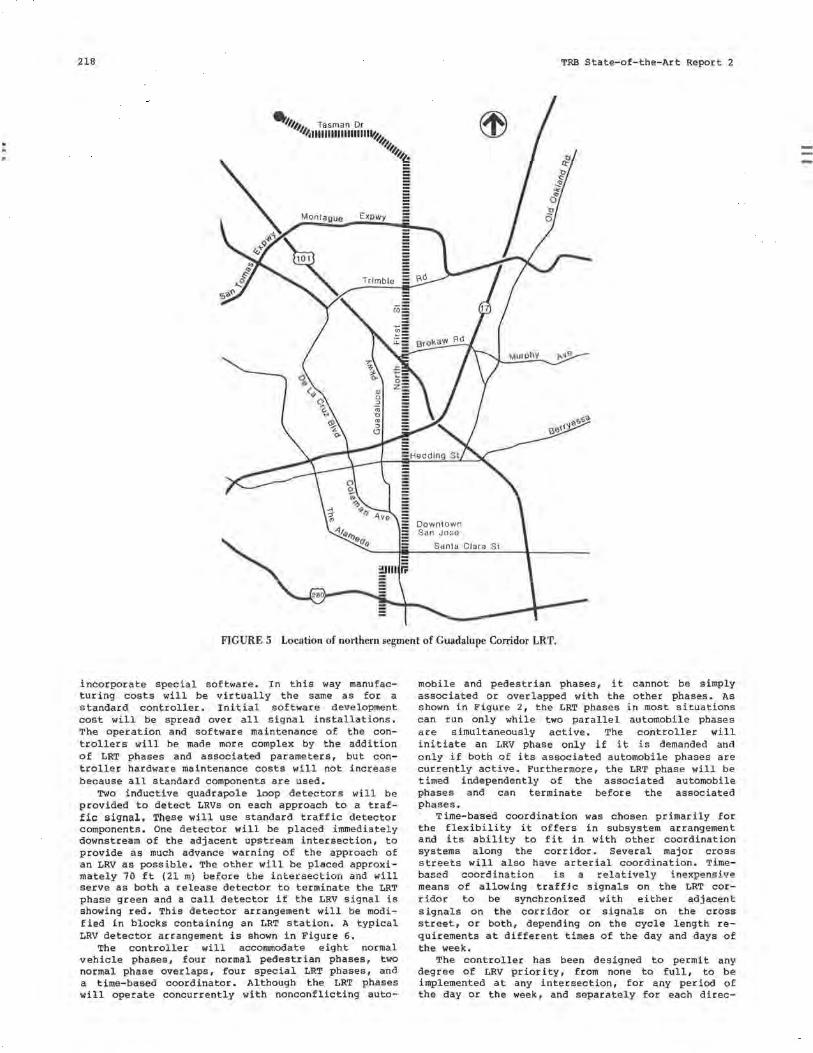
218
.. ,,,,. Tasman Dr 11
'~111111111111111111ll*.-i 1~,. ~1
Expwy §
Downtown San Jose
TRB State-of-the-Art Report 2
FIGURE 5 Location of northern segment of Guadalupe Corridor LRT.
incorporate special software. In this way manufacturing costs will be virtually the same as for a standard controller. Initial software development cost will be spread over all signal installations. The operation and software maintenance of the controllers will be made more complex by the addition of LRT phases and associated parameters, but controller hardware maintenance costs will not increase because all standard components are used.
TWo inductive quadrapole loop detectors will be provided to detect LRVs on each approach to a traffic signal, These will use standard traffic detector components. One detector will be placed immediately downstream of the adjacent upstream intersection, to provide as much advance warning of the approach of an LRV as possible. The other will be placed approximately 70 ft (21 m) before the intersection and will serve as both a release detector to terminate the LRT phase green and a call detector if the LRV signal is showing red. This detector arrangement will be modi£ ied in blocks containing an LRT station. A typical LRV detector arrangement is shown in Figure 6.
The controller will accommodate eight normal vehicle phases, four normal pedestrian phases, two normal phase overlaps, four special LRT phases, and a time-based coordinator. Although the LRT phases will operate concurrently with nonconflicting auto-
mobile and pedestrian phases, it cannot be simply associated or overlapped with the other phases. As shown in Figure 2, the LRT phases in most situations can run only while two parallel automobile phases are simultaneously active. The controller will initiate an LRV phase only if it is demanded and only if both of its associated automobile phases are currently active. Furthermore, the LRT phase will be timed independently of the associated automobile phases and can terminate before the associated phases.
Time-based coordination was chosen primarily for the flexibility it offers in subsystem arrangement and its ability to fit in with other coordination systems along the corridor. Several major cross streets will also have arterial coordination. Timebased coordination is a relatively inexpensive means of allowing traffic signals on the LRT corridor to be synchronized with either adjacent signals on the corridor or signals on the cross street, or both, depending on the cycle length requirements at different times of the day and days of the week.
The controller has been designed to permit any degree of LRV priority, from none to full, to be implemented at any intersection, for any period of the day or the week, and separately for each direc-
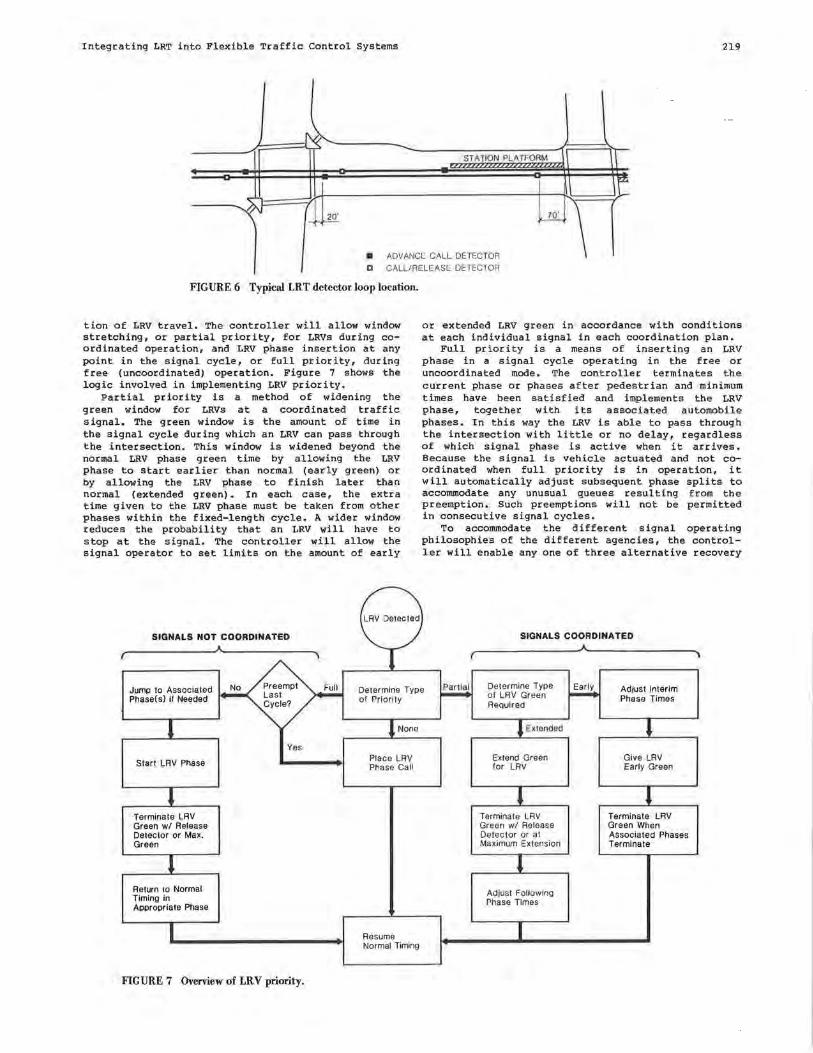
Integrating LRT into Flexible Traffic Control Systems 219
~ -ST A TION PLATFORM .,.
- IZ I L
-+ - 20· P'--
• ADVANCE CALL DETECTOR
~\ D CALL/RELEASE DETECTOR
FIGURE 6 Typical LRT detector loop location.
tion of LRV travel. The controller will allow window stretching, or partial priority, for LRVs during coordinated operation, and LRV phase insertion at any point in the signal cycle, or full priority, during free (uncoordinated) operation. Figure 7 shows the logic involved in implementing LRV priority.
Partial priority is a method of widening the green window for LRVs at a coordinated traffic signal. The green window is the amount of time in the signal cycle during which an LRV can pass through the intersection. This window is widened beyond the normal LRV phase green time by allowing the LRV phase to start earlier than normal (early green) or by allowing the LRV phase to finish later than normal (extended green). In each case, the extra time given to the LRV phase must be taken from other phases within the fixed-length cycle. A wider window reduces the probability that an LRV will have to stop at the signal. The controller will allow the signal operator to set limits on the amount of early
SIGNALS NOT COORDINATED
or extended LRV green in accordance with conditions at each individual signal in each coordination plan.
Full priority is a means of inserting an LRV phase in a signal cycle operating in the free or uncoordinated mode. The controller terminates the current phase or phases after pedestrian and minimum times have been satisfied and implements the LRV phase, together with its associated automobile phases. In this way the LRV is able to pass through the intersection with little or no delay, regardless of which signal phase is active when it arrives. Because the signal is vehicle actuated and not coordinated when full priority is in operation, it will automatically adjust subsequent phase splits to accommodate any unusual queues resulting from the preemption. Such preemptions will not be permitted in consecutive signal cycles.
To accommodate the different signal operating philosophies of the different agencies, the controller will enable any one of three alternative recovery
SIGNALS COORDINATED
Jump to Associated Determine Type Partial Determine Type Early Adjust Interim of LAV Green Phase(s) if Needed
Start LRV Phase
Terminate LAV Green w/ Release Detector or Max. Green
Return to Normal Timing in Appropriate Phase
FIGURE 7 Overview of LRV priority.
of Priority
None
Place LRV Phase Call
Resume Normal Timing
Required
Ex tended
Extend Green for LRV
Terminate LAV Green w/ Release Detector or at Maximum Extension
Adjust Following Phase Times
Phase Times
Give LAV Early Green
Terminate LAV Green When Associated Phases Terminate
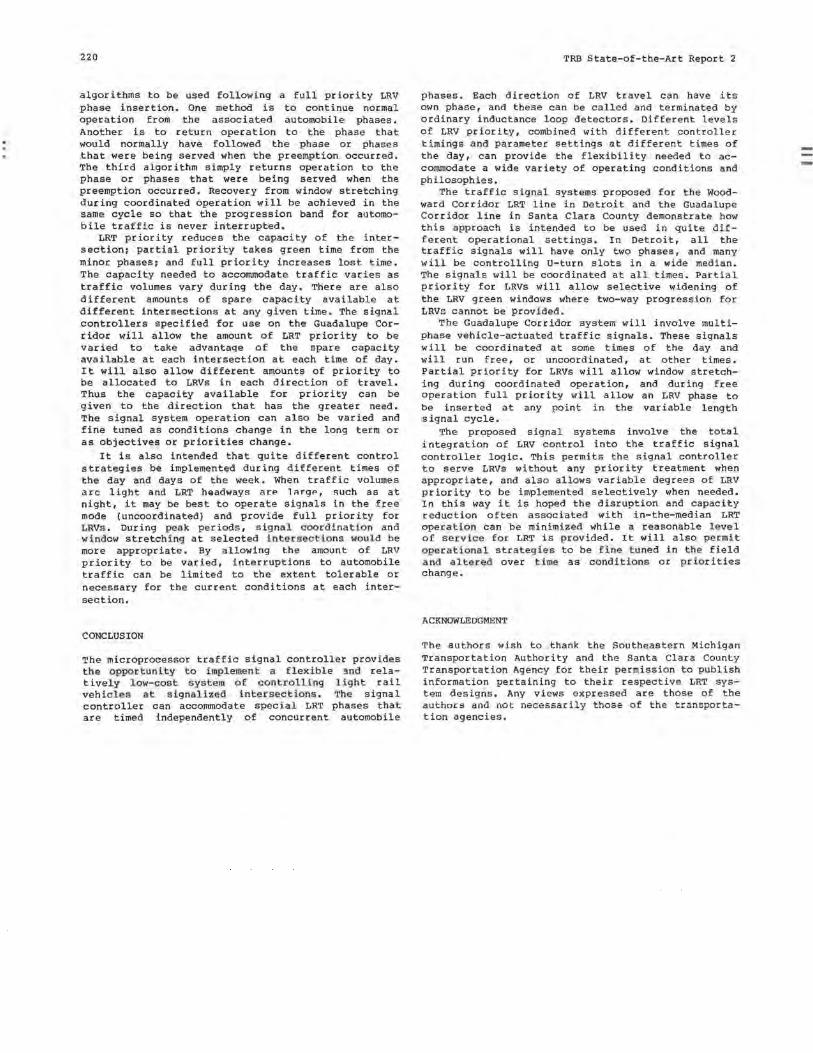
220
algorithms to be used following a full priority LRV phase insertion. One method is to continue normal operation from the associated automobile phases. Another is to return operation to the phase that would normally have followed the phase or phases that were being served when the preemption occurred. The third algorithm simply returns operation to the phase or phases that were being served when the preemption occurred. Recovery from window stretching during coordinated operation will be achieved in the same cycle so that the progression band for automobile traffic is never interrupted.
LRT priority reduces the capacity of the intersection: partial priority takes green time from the minor phases: and full priority increases lost time. The capacity needed to accommodate traffic varies as traffic volumes vary during the day. There are also different amounts of spare capacity available at different intersections at any given time. The signal controllers specified for use on the Guadalupe Corridor will allow the amount of LRT priority to be varied to take advantage of the spare capacity available at each intersection at each time of day. It will also allow different amounts of priority to be allocated to LRVs in each direction of travel. Thus the capacity available for priority can be given to the direction that has the greater need. The signal system operation can also be varied and fine tuned as conditions change in the long term or as objectives or priorities change.
It is also intended that quite different control strategies be implemented during different times of the day and days of the week. When traffic volumes arc light and LRT hQadways are li'lrge, such as at night, it may be best to operate signals in the free mode (uncoordinated) and provide full priority for LRVs. During peak periods, signal coordinati on and window stretching at selected intersections would be more appropriate. By allowing the amount of LRV priority to be varied, interruptions to automobile traffic can be limited to the extent tolerable or necessary for the current conditions at each intersection.
CONCLUSION
The microprocessor traffic signal controller provides the opportunity to implement a flexible !Ind relatively low-cost system of controlling light rail vehicles at signalized intersections. The signal controller can accommodate special LRT phases that are timed independently of concurrent automobile
TRB State-of-the-Art Report 2
phases. Each direction of LRV travel can have its own phase, and these can be called and terminated by ordinary inductance loop detectors. Different levels of LRV priority, combined with different controller timings and parameter settings at different times of the day, can provide the flexibility needed to accommodate a wide variety of operating conditions and philosophies.
The traffic signal systems proposed for the Woodward Corridor LRT line in Detroit and the Guadalupe Corridor line in Santa Clara County demonstrate how this approach is intended to be used in quite different operational settings. In Detroit, all the traffic signals will have only two phases, and many will be controlling u-turn slots in a wide median. The signals will be coordinated at all times. Partial priority for LRVs will allow selective widening of the LRV green windows where two-way progression for LRVs cannot be provided.
The Guadalupe Corridor system will involve multiphase vehicle-actuated traffic signals. These signals will be coordinated at some times of the day and will run free, or uncoordinated, at other times. Partial priority for LRVs will allow window stretching during coordinated operation, and during free operation full priority will allow an LRV phase to be inserted at any point in the variable length signal cycle.
The proposed signal systems involve the total integration of LRV control into the traffic signal controller logic. This permits the signal controller to serve LRVs without any priority treatment when appropriate, and also allows variable degrees of LRV priority to be implemented selectively when needed. In this way it is hoped the disruption and capacity reduction often associated with in-the-median LRT oper;;ition can be minimized while a reasonable level of service for LRT is provided. It will also pei:.mit operational strategies to be fine tuned in the field and altered over time as conditions or priorities change.
ACKNOWLEDGMENT
The authors wish to thank the Southeastern Michigan Transportation Authority and the Santa Clara County Transportation Agency for their permission to publish information pertaining to their respective LRT system designs. Any views expressed are those of the authors and not necessarily those of the transportation agencies.
LRT On-Street Operations: The Calgary Experience J. R. Walshaw Transportation Department City of Calgary, Alberta, Canada
On May 25, 1981, light rail transit (LRT) returned to Calgary with the opening of the 11-km South line. This project represented a major commitment on the part of the city of Calgary and the province of Alberta to provide a convenient alternative to the private automobile. The South line is the first of a network of routes radiating from the city center (Figure 1). Construction of the Northeast line started in 1982, with a scheduled completion date of May 1985 , and work wi l l s tart on the Northwest line i n · 1985 . Othe r legs a re planned but are not yet committe d to construct i on.
The southernmost 6. 5 km of the South line were cons tructed parall el to the Canadian Pac ific (CP) Ra ilr oad seco ndary main l i ne through s u burba n ne ighbor hooos. Th e LRT l ea ves t he CP line a t 42nd Ave nue and proceeds to the downtown core on an exclusive right-of-way. For the final 1. 8 km in the downtown core the LRT runs along 7th Avenue at grade (Figure 2).
The 9-km section of the line outside the core is equipped with an automatic block signal system, and the six at-gr ade road crossings are p rotect ed by flash i ng light signals and gates . The 1. 8-km s e gment on 7 t h Ave nue has 12 inte r secti ons, and trains must obey traffic signals located at each intersection.
The light rail vehicles (LRVs) are S i emens- oue wa g U2 articulated cars, similar to those us e d in Edmonton and San Diego. Their design standards are as follows:
• Car length= 23 150 mm, • Car Width= 2650 mm, • Car height= 3620 mm,
Passenger seats= 64, • Standees (at 4/m 2
) = 98, • Passenger capacity= 162 to 260 per vehicle, • Vehicle weight (empty) = 32 500 kg,
Contact wire height= 4000 to 6880 mm, • Service acceleration= l.O m/sec 2
,
• Maximum acceleration= 1.3 m/sec 2,
• Service deceleration= 1.2 m/sec 2,
• Maximum deceleration= 2.7 m/sec 2,
• Maximum speed= 80 km/hr, Interior noise level= 65 to 75 dB(A),
• Wayside noise level (at 15 m) 65 to 80 dB (A), and
• Train size= 1 to 5 cars.
Ultimately they will be run in five-car tr a ins, but for the present the peak-period demands are met with three-car trains. Off-peak service is provided with two-car trains and, occasionally, single units.
Stations have been constructed with platforms for three-car trains but can be lengthened in the future. The LRVs are fitted for high-platform loading only.
The LRT operates on a basic 10-min schedule with peak-period service at 5-min intervals. When the Northeast line becomes operational, the same schedule will be ma i ntained resulting in 2.5-min headways on 7th Avenue dur i ng peak per i o ds.
7th Avenue has been designa ted as a t r a ns it mall, reserved f o r LRT a nd bus ope r ation. Eme rgency vehicles are permitted , of course, and service vehicle entry is controlled by a permit system because some business operations have no alternative access. Automobiles and taxis are completely prohibited. Althoug h the t ransi t veh icl e usat;Je in peak periods is q u ite impressive (176 trai ns and buses per hour), compared with the parallel streets, 7th Avenue is relatively underused.
The transit mall is 48 ft wide with the LRT tracks in the center. Station platforms are provided every three blocks in each direction, staggered so that there is only one station in any block (Figure 3) • LRT operating rules on 7th Avenue require that trains obey the traffic signals located at each intersection; buses must not pass LRT trains.
The challenge to the traffic engineers was to devise a signal timing system that would minimize delay to trains, avoid blocking of intersections, and accommodate cross street traffic.
THE SETTING
The downtown core of Calgary can be considered to be bounded by 4th Avenue to the north, 9th Avenue to the south, 9th Street West on the west, and 3rd Street East on the east (Figure 4).
Because 7th Avenue is designated as the transit mall and 8th Avenue is a pedestrian mall for much of its length, the main east-west traffic flows are accommodated on 4th, 5th, 6th, and 9th Avenues. These roads operate as one-way couplets. Peak-period flows are as high as 2,300 vehicles per hour.
The north-south streets, though more numerous, are generally less useful as through traffic carriers. No streets cross both the Bow River and the CP rail line to the north and south of the downtown core, respectively. The streets do funnel traffic from parking areas to the avenues and the two major north-south routes: Centre Street and Macleod Trail. Most but not all of the streets are one way. Blocks are relatively short averaging 570 ft east to west and 340 ft north to south. All intersections within
221
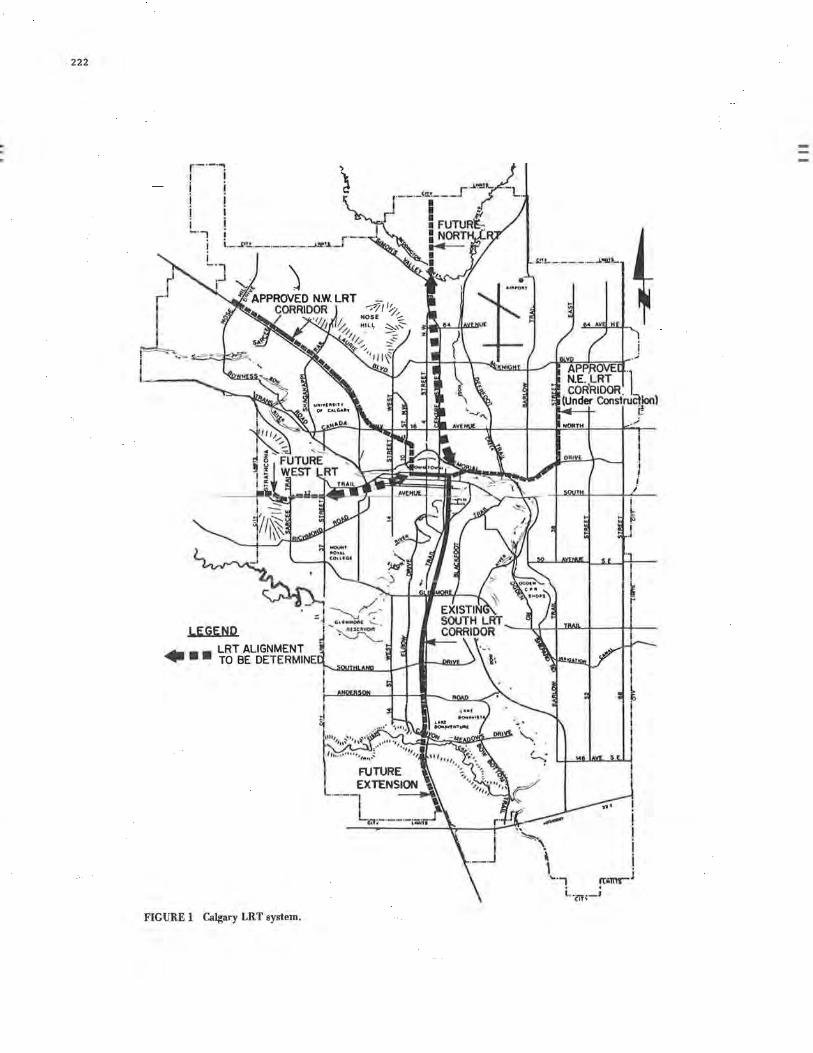
222
r r·
rl. I L----..
FIGURE I Calgary LRT system.
I I
I i
! !
--~ I \ i \.., rti.mrj
i_ ____ j Clh
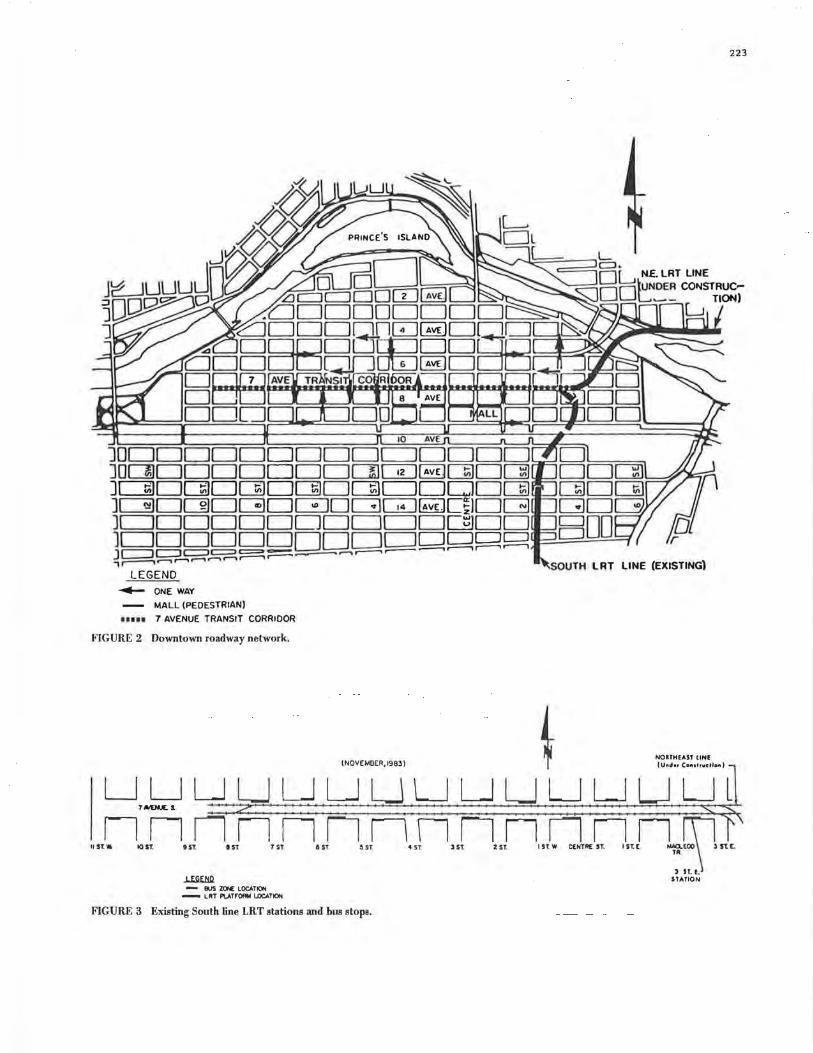
JODDDDDDDDDCJDDDD JOOJDDDDDDDDluJ~DJDOl J~DDJDQJDOJOC])CJDDDQJ J~DOJDGJDG.JDGGu~C~IDG Jc=JDDDDDDDDc=JDGJDD 1[::=JDDDDDODDCJD~~~ r J (:=::::JC=> (=:>c::=J c= ~ .-. ,---. ,---. .---, , ----- ....... ,........ ,........ ,....., ..--. r--, }
' . OUTH LRT LINE (EXISTING LEGEND
.,._ ONE WAY
- MALL (PEDESTRIAN)
11 n1 7 AVENUE TRANSIT CORRIDOR
FIGURE 2 Downtown roadway network.
NORTHEAST llNE
223
11ST.[l~Sfl9STn1Stn7STneJ1~5rn~J'35flz5JilST.CJTA£[lST.Cn_Jfl3nc.\ TR:~.\ ' 3 ST, E.
J..f.liE.lil2 UATION - BUS ZOI€ LOCATION
- LRT P\.ATFORN LOCATION
FIGURE 3 Existing South line LRT stations and bus stops.
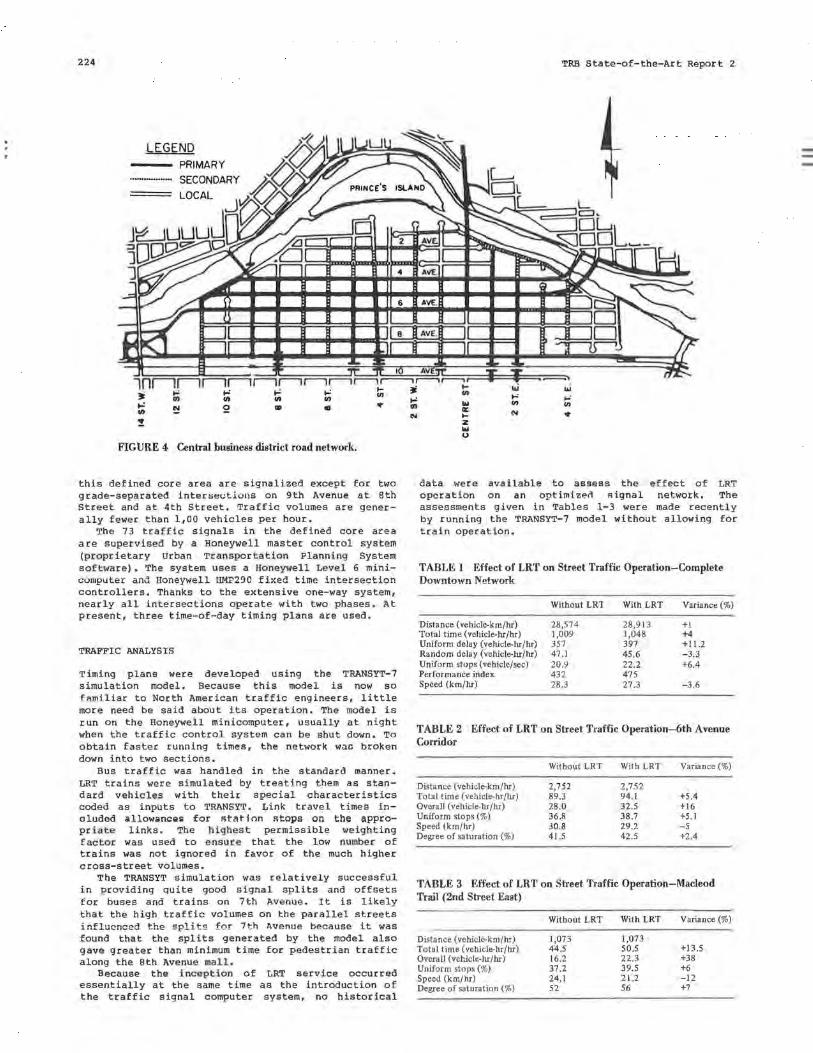
224
LEGEND PRIMARY
FIGURE 4 Central business district road network.
this defined core area are signalized except for two grade-separated interse<.:tlons on 9th Avenue at 8th Street and at 4th Street. Traffic volumes are generally fewer than 1,00 vehicles per hour.
The 73 traffic signals in the defined core area are supervised by a Honeywell master control system (proprietary Urban Transpor t a t ion Planni ng System sof tware). The system use s a Honeywell Level 6 minicomputer and Honeywell HMP290 fixed time intersection controllers. Thanks to the extensive one-way system, nearly all intersections operate with two phases. At present, three time- of- day timing plans are used.
TRAFFIC ANALYSIS
Timing plans were developed using the TRANSYT-7 simulation model. Because this model is now so f~miliar to North American traffic engineers, little more need be said about its operation. The model is run on the Honeywell minicomputer, usually at night when the traffic control system can be shut down. To obtain faster running times, the network wao broken down into two sections,
Bus traffic was handled in the standard manner. LRT trains were simulated by treating t hem as standard vehicles with their special characteristics coded as inputs to TRANSYT. Link travel times included allowances; for stat-ion Rtops on the appropr iate links. The highes t permissible weighting factor was used to e ns ure that the low number of trains was not ignored in favor of the much higher cross-street volumes.
The TRANSYT simulation was relatively successful in providing quite good signal splits and offsets for buses and trains on 7th Avenue. It i s likely that the high traffic volumes on the parallel streets influenced the splits for 7th Avenue because it was found that the splits generated by the model also gave greater than minimum time for pedestrian traffic along the 8th Ave nue ma l l .
Because the inception of LRT service occurred essentially at the same time as the introduction of the traffic signal computer system, no historical
... .., "' N
TRB State-of-the-Art Report 2
data were available to assess the effect of LRT operation on an optimize~ i,ignal network, The assessments given in Tables 1-3 were made recently by running the TRANSYT-7 model without allowing for train operation.
TABLE 1 Effect of LRT on Street Traffic Operation-Complete Downtown Network
Without LRl With LRT Variance (%)
Distance (vehicle-km/hr) 28,574 28,913 +l Total tim e (vehicle-hr/hr) 1,009 1,048 +4 Uniform delay (vehicle-hr/hr) 357 397 +11.2 Random delay (vehicle-hr/hr) 47.1 45.6 -3.3 Uniform stops (vehicle/sec) 20 .9 22 .2 +6.4 Performance index 432 47 5 Speed (km/hr) 28.3 27 .3 -3 .6
TABLE 2 Effect of LRT on Street Traffic Operation-6th Avenue Corridor
Distance (vehicle-km/hr) Total time (vehicle-hr/hr) Overall (vehicle-hr/hr) Uniform stops (%) Speed (km/hr) Degree of saturation (%)
Without LRT
2,752 89 .3 28.0 36.8 30.8 41.5
With LRT Variance(%)
2,7 52 94.1 +5.4 32.5 +16 38.7 +5.1 29. 2 -5 42.5 +2.4
TABLE 3 Effect of LRT on Street Traffic Operation-Macleod Trail (2nd Street East)
Without LRT With LRT Varia nce(%)
Distance (vehicle-km/hr) 1,073 1,073 Total time (vehicle-hr/hr) 44.5 50 .5 +13.5 Overall (vehicle-hr/hr) 16.2 22.3 +38 Uniform stops(%) 37.2 39.5 +6 Speed (km/hr) 24.1 21.2 -1 2 Degree of saturation (%) 52 56 +7
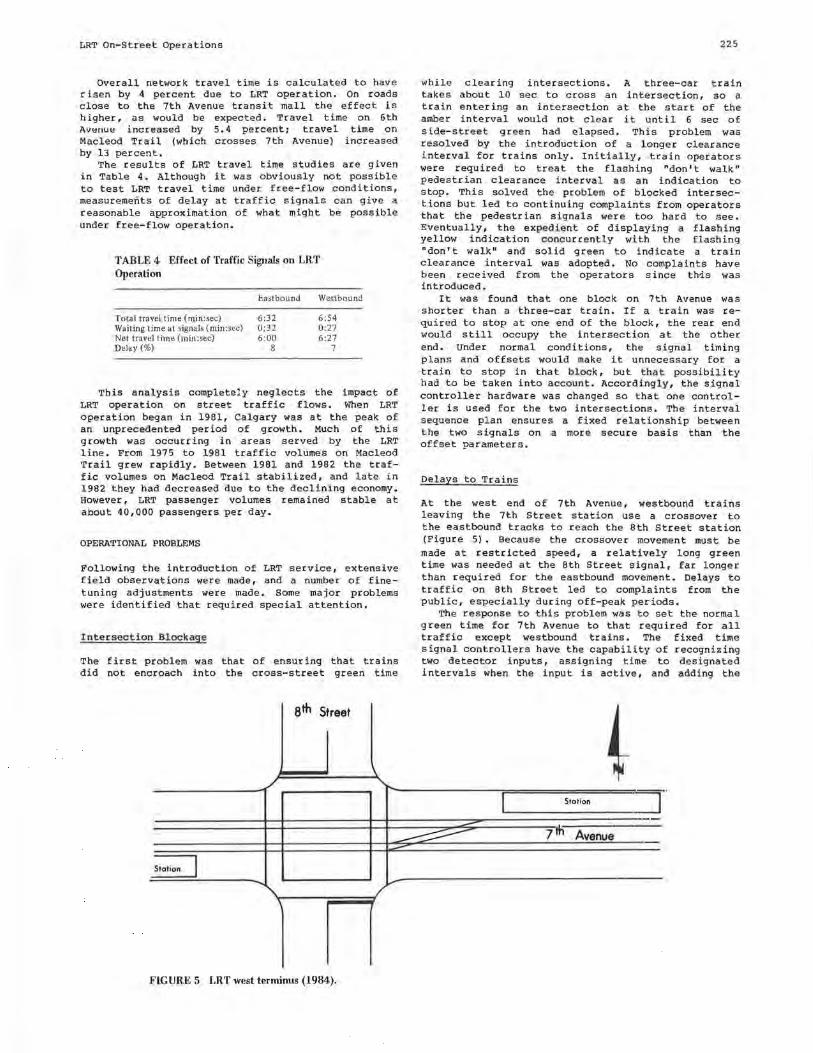
LRT On-Street Operations
Overall network travel time is calculated to have risen by 4 percent due to LRT operation. On roads close to the 7th Avenue transit mall the effect is higher, as would be expected. Travel time on 6th Avenue increased by 5. 4 percent; travel time on Macleod Trail (which crosses 7th Avenue) increased by 13 percent.
The results of LRT travel time studies are given in Table 4. Although it was obviously not possible to test LRT travel time under free-flow conditions, measurements of delay at traffic signals can give a reasonable approximation of what might be possible under free-flow operation.
TABLE 4 Effect of Traffic Signals on LRT Operation
Total travel time (min:sec) Waiting time at signals (min:sec) Net travel time (min:sec) Delay(%)
Eastbound
6:32 0:32 6:00
8
Westbound
6:54 0:27 6:27
7
This analysis completely neglects the impact of LRT operation on street traffic flows. When LRT operation began in 1981, Calgary was at the peak of an unprecedented period of growth. Much of this growth was occurring in areas served by the LRT line. From 1975 to 1981 traffic volumes on Macleod Trail grew rapidly. Between 1981 and 1982 the traffic volumes on Macleod Trail stabilized, and late in 1982 they had decreased due to the declining economy. However, LRT passenger volumes remained stable at about 40,000 passengers per day.
OPERATIONAL PROBLEMS
Following the introduction of LRT service, extensive field observations were made, and a number of finetuning adjustments were made. Some major problems were identified that required special attention.
i ntersection Blockage
The first problem was that of ensuring that trains did not encroach into the cross-street green time
sth Street
\
"
~ .... i...--
'
FIGURE 5 LRTwest terminus (1984).
225
while clearing intersections. A three-car train takes about 10 sec to cross an intersection, so a train entering an intersection at the start of the amber interval would not clear it until 6 sec of side-street green had elapsed. This problem was resolved by the introduction of a longer clearance interval for trains only. Initially, train operators were required to treat the flashing "don't walk" pedestrian clearance interval as an indication to stop. This solved the problem of blocked intersections but led to continuing complaints from operators that the pedestrian signals were too hard to see. Eventually, the expedient of displaying a flashing yellow indication concurrently with the flashing "don't walk" and solid green to indicate a train clearance interval was adopted. No complaints have been received from the operators since this was introduced.
It was found that one block on 7th Avenue was shorter than a three-car train. If a train was required to stop at one end of the block, the rear end would still occupy the intersection at the other end. Under normal conditions, the signal timing plans and offsets would make it unnecessary for a train to stop in that block, but that possibility had to be taken into account. Accordingly, the signal controller hardware was changed so that one controller is used for the two intersections. The interval sequence plan ensures a fixed relationship between the two signals on a more secure basis than the offset parameters.
Delays to Trains
At the west end of 7th Avenue, westbound trains leaving the 7th Street station use a crossover to the eastbound tracks to reach the 8th Street station (Figure 5). Because the crossover movement must be made at restricted speed, a relatively long green time was needed at the 8th Street signal, far longer than required for the eastbound movement. Delays to traffic on 8th Street led to complaints from the public, especially during off-peak periods.
The response to this problem was to set the normal green time for 7th Avenue to that required for all traffic except westbound trains. The fixed time signal controllers have the capability of recognizing two detector inputs, assigning time to designated intervals when the input is active, and adding the
! I Station ·~
---.
~ 7t+i Avenue
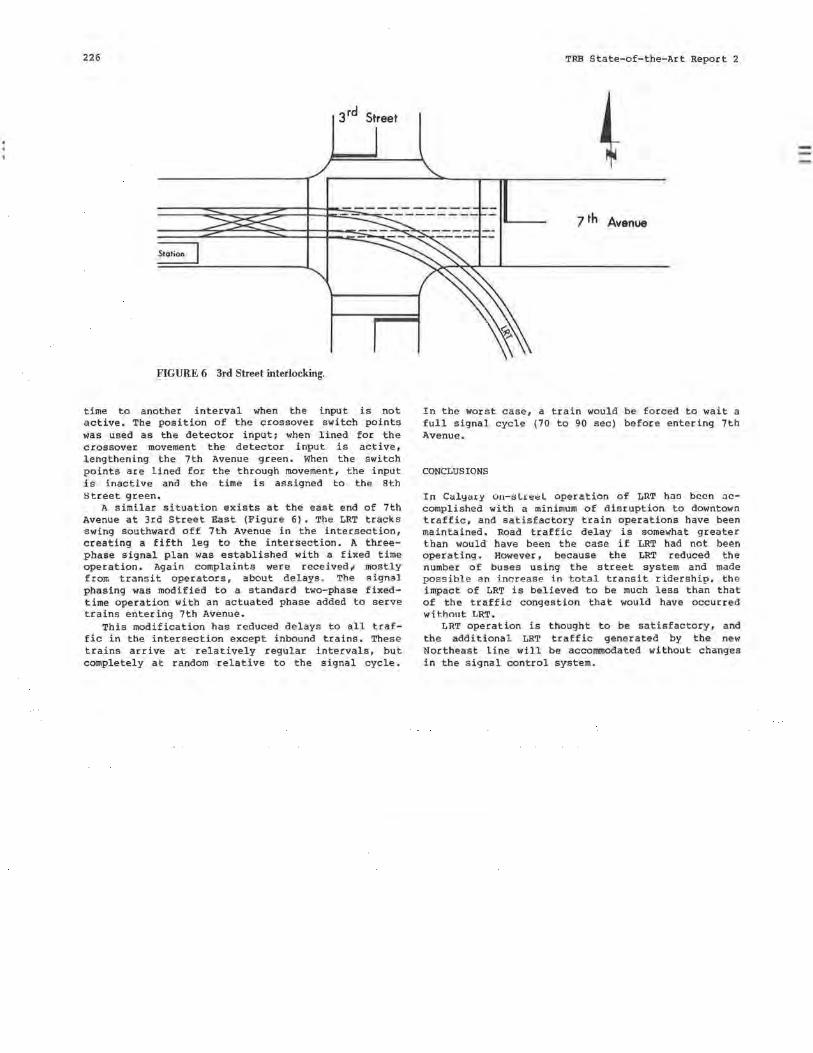
226
3rd Street
FIGURE 6 3rd Street interlocking.
time to another interval when the input is not active. The position of the crossover switch points was used as the detector input i when lined for the crossover movement the detector input is active, lengthening the 7th Avenue green. When the switch points are lined for the through movement, the input is inactive and the time is assigned to the 8th street green.
A similar situation exists at the east end of 7th Avenue at 3rd Street East (Figure 6). The LRT tracks swing southward off 7th Avenue in the intersection, creating a fifth leg to the intersection. A threephase signal plan was established with a fixed time operation. Again complaints were received, mostly from transit operators, about delays. The $ignal phasing was modified to a standard two-phase fixedtime operation with an actuated phase added to serve trains entering 7th Avenue.
This modification has reduced delays to all traffic in the intersection except inbound trains. These trains arrive at relatively regular intervals, but completely at random relative to the signal cycle.
TRB State-of-the-Art Report 2
7th Avenue
In the worst case, a train would be forced to wait a full signal cycle (70 to 90 sec) before entering 7th Avenue.
CONCLUSIONS
In Calyary 011-slreel operation of LRT has been accomplished with a minimum of disruption to downtown traffic, and satisfactory train operations have been maintained. Road traffic delay is somewhat greater than would have been the case if LRT had not been operating. However, because the LRT reduced the number of buses using the street system and made possible an increase in total transit ridership. the impact of LRT is believed to be much less than that of the traffic congestion that would have occurred wit.hont LRT.
LRT operation is thought to be satisfactory, and the additional LRT traffic generated by the new Northeast line will be accommodated without changes in the signal control system.
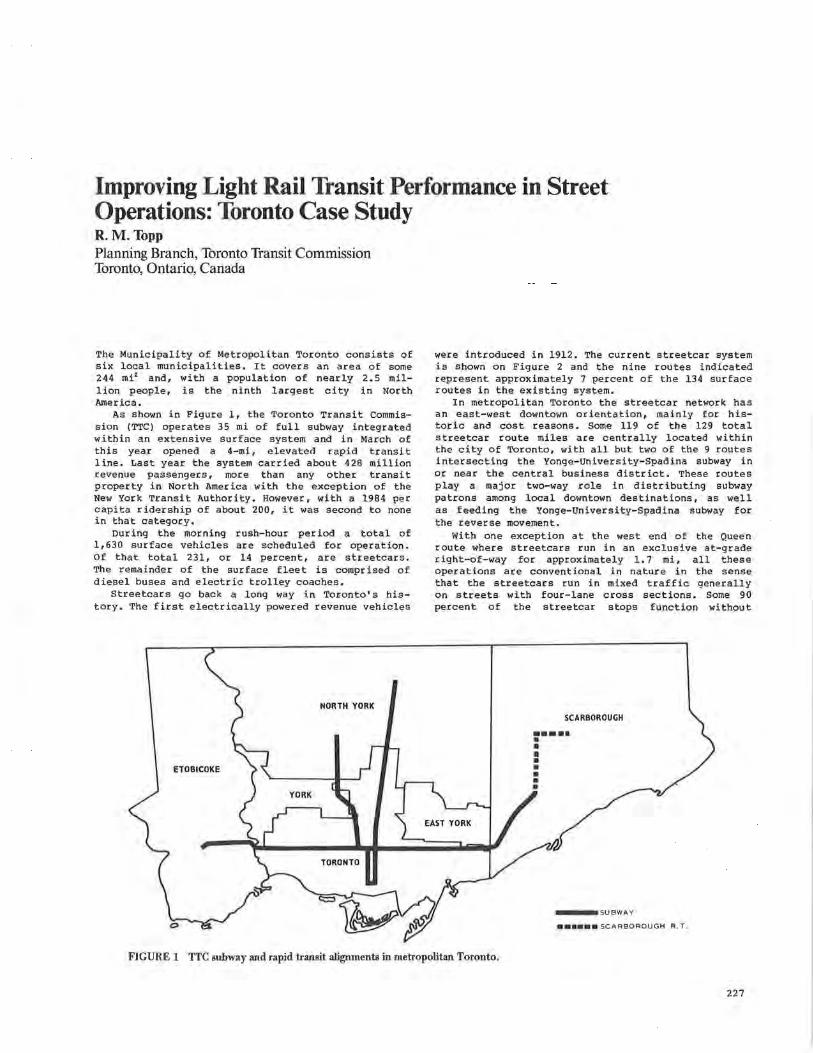
Improving Light Rail Transit Performance in Street Operations: Toronto Case Study R.M. Topp Planning Branch, Toronto Transit Commission Toronto, Ontario, Canada
The Municipality of Metropolitan Toronto consists of six local municipalities. It covers an area of some 244 mi2 and, with a population of nearly 2.5 million people, is the ninth largest city in North America.
As shown in Figure 1, the Toronto Transit Commission (TTC) operates 35 mi of full subway integrated within an extensive surface system and in March of this year opened a 4-mi, elevated rapid transit line. Last year the system carried about 428 million revenue passengers, more than any other transit property in North America with the exception of the New York Transit Authority. However, with a 1984 per capita rid~rship of about 200, it was second to none in that category.
During the morning rush-hour period a total of 1,630 surface vehicles are scheduled for operation. Of that total 231, or 14 percent, are streetcars. The remainder of the surface fleet is comprised of diesel buses and electric trolley coaches.
Streetcars go back a long way in Toi;onto' s history. The first electrically powered revenue vehicles
NORTH YORK
ETOBICOKE
were introduced in 1912. The current streetcar system is shown on Figure 2 and the nine routes indicated represent approximately 7 percent of the 134 surface routes in the existing system.
In metropolitan Toronto the streetcar network has an east-west downtown orientation, mainly for historic and cost reasons. Some 119 of the 129 total streetcar route miles are centrally located within the city of Toronto, with all but two of the 9 routes intersecting the Yonge-University-Spadina subway in or near the central business district. These routes play a major two-way role in distributing subway patrons among local downtown destinations, as well as feeding the Yonge-University-Spadina subway for the reverse movement.
With one exception at the west end of the Queen route where streetcars run in an exclusive at-grade right-of-way for approximately 1.7 mi, all these operations are conventional in nature in the sense that the streetcars run in mixed traffic generally on streets with four-lane cross sections. Some 90 percent of the streetcar stops function without
SCARBOROUGH
---·SUBWAY
•••••• SCARBOROUGH R. T .
FIGURE 1 TTC subway and rapid transit alignments in metropolitan Toronto.
227
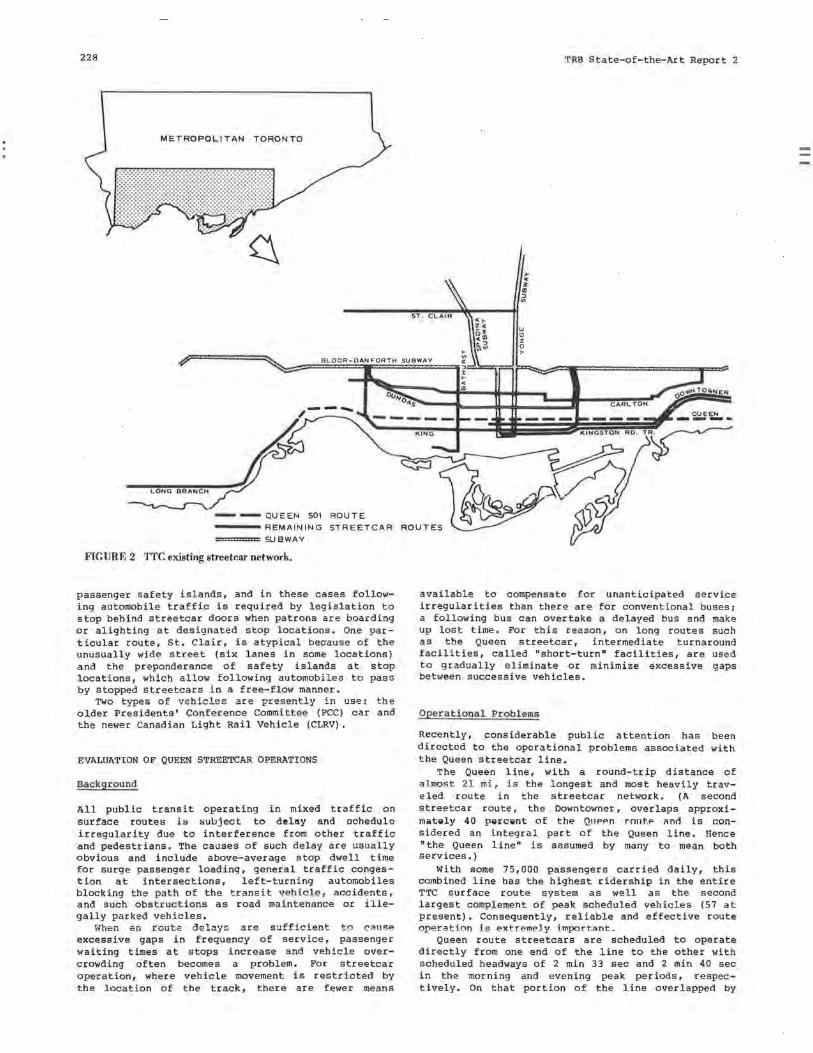
228
METROPOLITAN TORONTO
L ON G OF\AN CH
- - QUEEN 501 ROUTE
---- REMAINING STREETCAR
==== SUBWAY
FlGURE 2 TTC existing streetcar network.
passenger safety islands, and in these cases following automobile traffic is required by legislation to stop behind streetcar doors when patrons are boarding or alighting at designated stop locations. One particular route, St. Clair, is atypical because of the unusually wide street (six lanes in some locations) and the preponderance of safety islands at stop locations, which allow following automobiles to pass by stopped streetcars in a fre e-flow manner.
~wo ty-pes of vehicle s are pr~sently in use: t he older Presidents' Confe r e nce Commi ttee (PCC) car and the newer Canadian Light Rail Vehicle (CLRV).
EVALUATION OF QUEEN STREETCAR OPERATIONS
Background
All public transit operating in mixed traffic on surface routes ls subject to delay and oohedule irregularity due to interference from other traffic and pedestrians. The causes of such delay are usually obvious and include above-average stop dwell time for surge passenger loading, general traffic congestion at intersections, left-turning automobiles blocking the path of the transit veh cle, accidents, and such obs truc t ions as road maintenanc e or illegally parked vehicles.
When en routa delays are cn-F-F ~ rd ant- to cause excessive gaps in frequency of service, passenger waiting times at stops increase and vehicle overcrowding often becomes a problem. For streetcar operation, where vehicie movement is restricted by the location of the track, there are fewer means
TRB State-of-the-Art Report 2
available to compensate for unanticipated service irregularities than there are for conventional buses; a following bus can overtake a delayed bus and make up lost time. For this reason, on long routes such as the Queen streetcar, intermediate turnaround facilities, called "short-turn" facilities, are used to gradually eliminate or minimize excessive gaps between successive vehicles.
Ope rational Pr oblems
Recently, considerable public attention has been directed to the operational problems associated with the Queen streetcar line.
The Queen line, with a round-trip distance of almos t 21 mi, is the longest and most heavily traveled route in the streetcar network. (A second streetcar route, the Downtowner, overlaps approximilt&ly 40 parc1mt of the QllPPn rnnt.P 11n<'I is r:onsidered an integral part of the Queen line. Hence "the Queen line" is assumed by many to mean both services.)
With some 75,000 passengers carried daily, this combined line has the highest ridership in the entire TTC surface route s y stem as well as the second l argest complement of peak scheduled vehicles (57 at present) . Consequently, reliable and effective route operation is e xt re~e l y impor t ant~
Queen route streetcars are scheduled to operate directly from one end of the line to the other with scheduled headways of 2 min 33 sec and 2 min 40 sec in the morning and evening peak periods, respectively. On that portion of the line overlapped by
Improving Light Rail Transit Performance
the Downtowner, the combined headway decreases to 1 min 56 sec in both peak periods.
For many years, however, transit patrons using the Queen otrcetcar route have complained abouL irregular service and, in particular, unscheduled short-turning of streetcars, especially during the evening peak period. When the direction of a streetcar is reversed at a location away from the end of the line, passengers on the vehicle must alight and wait for a following streetcar. Although it goes without saying that this procedure is unpopular with affected passengers, it is employed to close gaps in service that, if left unchecked, would continually worsen.
Short-turns are generally initiated only at the judgment and instruction of a route inspector, whose decision is based on the need to restore regular and evenly spaced service over the entire route, in response to any number of possible emergency or delay situations. Short-turns require inconveniencing a few for the general benefit of riders as a whole but, not surprisingly, this "general benefit" is seldom the subject of consumer comments.
Until the completion of a recent study, the precise reasons for the deterioration of headway regularity on Queen Street were not fully understood. However, it was suspected that there was no single cause but instead an interaction of factors that compounded to the point where a significant gap was created on the line. The traditional strategy used to counter this problem has been short-turning streetcars to fill gaps.
Evaluation of Queen Streetcar Service
The TTC is looking into the Queen Street operational problems in considerable depth and has undertaken two special studies, both of which are intended to develop methods to improve the situation on Queen Street and are expected to allow greater insight into similar operational problems on other routes.
The first, a "Transit Priority Study," is a municipal interagency long-range project involving transit and traffic engineering officials. This detailed study is concerned strictly with those areas that are beyond the control of the TTC and involves the investigation of traffic signal optimization measures and, alternatively, transit-actuated signal priorities as ways of easing transit congestion on Queen Street.
The second study has been conducted by an independent consultant retained by TTC. In this study the emphasis is placed on investigating corrective transit operating strategies as opposed to traffic engineering measures. Because this consultant study has recently been completed, it is discussed first and a general overview of the major findings and recommendations is included.
EVALUATION OF QUEEN STREETCAR OPERATIONS--CONSULTANT'S STUDY
In August 1984 TTC retained the University of Toronto/York University Joint Program in Transportation to serve as consultant for this project. The role of the consultant in this project, as defined in the project terms of reference (1), was to provide a fresh and independent assessment of the overall operation of the Queen streetcar line. Through extensive data collection and a passenger attitudinal survey the consultant was expected to evaluate the existing quality of service on Queen Street and to diagnose the cause or causes of short-turning streetcars on Queen Street as well as comment on the
appropriateness of the currently being applied. eralized, solutions to were to be identi!ied.
229
short-turning strategies Specific, as well as gen
the short-turning problems
This project was initiated to provide TTC management with a clearer understanding of the reasons behind service irregularity problems and the need to short-turn streetcars. This independent opinion was intended to assist TTC in pursuing the most effective ways of minimizing unscheduled short-turning.
Principal Objectives of the Study
The first objective of the study was to measure the quality of streetcar service currently available on the Queen streetcar service and determine
• Major causes of the need for short-turns, Magnitude of inconvenience to passengers
affected by short-turns, and ' Effectiveness of current procedures used to
exercise short-turn options.
The second objective was to recommend changes or modifications to existing procedures that might be implemented over the short term and be likely to
• Reduce the degree of passenger inconvenience and dissatisfaction associated with short-turns and
' Improve the effectiveness of short-turn operations from the standpoint of TTC and its operating labor.
The third and final objective of the study was to address longer term options for reducing service irregularity on the Queen streetcar route.
It was emphasized that the final project report was to present a practical picture of the situation, formed around a comprehensive information base. The consultant was requested to provide a clear presentation of the operating conditions on Queen Street and to present a creative yet practical approach to remedying the short-turning problem.
The consultant completed most of the work on this study during the fall of 1984 and presented an interim staff report in January 1985 and the final report (~) to the Toronto Transit Commission in March 1985.
Study Approach
The consultant's task centered primarily around the evaluation of the trade-off between the inconvenience to passengers forced to leave a short-turning vehicle and the improvements in service regularity for downstream passengers. Also, with this trade-off in mind, changes were to be formulated that would improve the effectiveness of the short-turn procedures. This involved a process of observation, field measurement, diagnosis of primary problem sources, and assessment of the effectiveness of current procedures.
The project was approached with a four-phase work program:
Phase 1. Documentation of procedures and performance, diagnosis of primary problem sources:
' Review existing data and establish additional data requirements and
• Satisfy data requirements through passenger attitude survey, various operational field studies, and interviews with key operational personnel (TTC management, route inspectors, and operators),
230
Phase 2. Diagnosis of problem sources, assessment of current performance;
Phase 3. Formulation of alternate methods for improving performance and development of methods of analysis to evaluate the range of alternatives; and
Phase 4. Evaluation of the range of alternatives identified in Phase 3.
The project was based on a firm foundation of operating data reflecting current procedures and operating performance on the Queen line. Combined with this was a grass-roots understanding of the "subtleties" that affect service on Queen Stree.t, gained from various interviews with TTC staff as well as the consultant's own field observations.
The study approach thus led to final conclusions aml n,commendations with respect to 1,hnrt-t.Prm changes to existing methods and procedures that will provide interim solutions until longer term, more extensive modifications can be implemented.
Major Study Findings
The consultant concluded that "on a long route, characterized by heavy passenger volumes and congested traffic conditions, short-turns represent the only effective means of compensating for large itregularities in streetcar service that result from factors beyond the control of the TTC," and that "overall service on Queen Street would clearly deteriorate significantly if short-turns were to be discontinued." Some specitic results of the cu11-sultant' s investigation are summarized in the following sections.
Current Short-Turn Characteristics
• During the period September: 1983 to September 1984 there were approximately 2,000 reported shortturns per month but there was, surprisingly, no clear seasonal variation.
• There was a wide variation in the number of short-turns by day of the week with a daily average of 63, a weekday average of 71, and a maximum of 95 on the average Friday.
• On weekdays the highly concentrated in 6 p.m. with 50 to 60 made during that time.
number of short-turns is the period between 3 p.m. and percent of daily short-turns
• Analysis of vehicle riding data shows an average of 7 .1 persons per vehicle are required to leave a short-turning car and the criterion of a maximum of 15 persons is exceeded about 15 to 20 percent of the time.
• It is estimated that approximately 300 persons daily are unexpectedly off-loaded from shortturned cars in the evening peak period and about 2,700 peroonc wait ;lightly longer times at the end of the line.
• Approximately 5,000 persons share directly in substantial waiting time and vehicle load distribution benefits from short-turning in the evening peak period.
Service Delays
• Passenger service time is ponent of delay (i.e., reduction time) and comprises approximately of total travel time.
the largest comin actual running 12 to 18 percent
• Signal plus queue delays are also significant, comprising about 13 to 15 percent of total travel time.
TRB State-of-the-Art Report 2
• Time running free (total time less all delays) is remarkably consistent by location, direction, and time, as is signal plus qu.eue delay.
• Variations by time and direction are primarily the result of inconsistencies in passenger service time.
Passenger Attitudes
A passenger attitude survey, conducted to gain some insight into the passengers' perceptions of the Queen streetcar service in general and the shortturning issue in particular, was conducted from September 10 to September 12, 1984. Sampling was based on passenger boarding counts by time period so as to be representative of the entire route ridership • . A total of 654 interviews were conducted and therefore the overall survey results can be viewed as accurate within ±5 percent, or 19 times out of 20.
Some specific findings were
• Approximately 25 percent of those surveyed were dissatisfied with the Queen service; 15 percent of the respondents stated they were dissatisfied with TTC service in general.
• Twenty-eight percent of the passengers perceived ·their morning wait time to be greater than 5 mini 55 percent estimated their afternoon wait time at greater than 5 min.
' Of those passengers who estimated their wait time to be less than 5 min, approximately 17 percent were dissatisfied with the Queen streetcar service, and 34 percent of those with time estimates of more than 5 min expressed dissatisfaction.
• Approximately 80 percent indicated that they checked to see if the vehicle was signed for a short-turn and 90 percent stated it would be helpful if short-turn vehicles were signed.
' During the week before the survey (four-day week), 32 percent of the passengers experienced at least one short-turn, and approximately 30 percent of these passengers expressed dissatisfaction with the Queen service.
• Of passengers experiencing short-turning, 28 percent estimated their wait time for the next car at less than 2 min, and 30 percent estimated their wait at more than 5 min.
Development and Evaluation of Alternatives
A number of alternative improvements were developed that would increase the effectiveness with which short-turns can be accomplished while reducing the degree of inconvenience to passengers required to alight and wait or wait initially for a following vehicle. These improvements were in the areas of route structure, scheduling of short-turns, use of articulated light rai vehicles (ALRVs), benefits derived from the Communications and Information System (CIS), and alternate forms of transit priorities.
A word about CIS is in order here. Since 1972 TTC has been developing and testing its Communications and Information System, a centralized communications, monitoring, and control system for surface transit vehicles. CIS can automatically and continuously advise of all schedule deviations over an entire route. Also, it enables the controller supervising the route to observe conditions over the whole route and make service adjustments accordingly. Hence, CIS permits a rapid and coordinated reaction to small disruptions in service. These reactions can keep small disruptions from growing into large gaps that
Improving Light Rail Transit Performance
require major corrective actions such as short-turning. In addition, CIS can be used to assist in optimizing the time at which a short-turned vehicle reenters the traffic stream.
A detailed discussion of the relative merits of each alternative is beyond the scope of this paper, but they involved a trade-off among three key factors:
1. The number of persons off-loaded due to unscheduled short-turns,
2. The level of service provided to other passengers, and
3. Operating costs.
~here were additional considerations that influenced the evaluation of alternatives. For example, those schemes that fall entirely within TTC's jurisdiction are more easily implemented than are alternatives that require assessment and approval from external agencies.
Major Findings and Conclusions
The study's major findings and conclusions include
1. The short-turning procedure practiced by TTC is an integral component in controlling present streetcar service on Queen Street. When service irregularities have reached a certain point, shortturning is the only reasonable means of restoring service promptly. These procedures are generally well executed by supervisory staff.
2. The sources of irregularities in service that necessitate short-turns vary widely and usually arise from random occurrences that are beyond TTC's control. The largest and most variable source of delays is time required to load and unload passengers at stops.
3. Overall, passenger service levels on the Queen line are good and most passengers are satisfied with the service. A significant proportion (25 percent) has expressed dissatisfaction, and the principal cause for concern is the waiting time in the evening peak period.
4. Improvements that are intended to reduce the frequency of short-turns, improve the effectiveness of procedures, and improve the information that passengers receive can be made in the short term.
5. Benefits could be derived by the longer term strategies of deployment of articulated light rail vehicles, implementation of CIS on the Queen route, and continuation of the pursuit of transit priori ties on Queen Street, which is currently the subject of a second major study.
Major Recommendations
The consultant's principal findings led to seven key recommendations:
1. During the evening peak period, the scheduled round-trip time over the entire route should be increased from 120 to 125 min.
2. The minimum gap size required to initiate a short-turn decision should be increased from the present value of twice the scheduled headway to three times the scheduled headway.
3. Short-turn signs should be modified to provide consistency throughout the vehicles and among different types of vehicles in service. Signs should indicate where passengers will be requested to leave the car as opposed to where the car will be turned.
4. Modifications should be made to the existing
231
route structure so that approximately one-third of the vehicles operate only between the Sunnyside and the Woodbine loops during the evening peak period.
5. ALRVs shoulcl, when c1vc1ilable, be used on the Queen route.
6. CIS should be expanded to encompass all operations on Queen Street.
7. Opportunities for achieving higher priority for streetcars, particularly in the downtown area, through turn prohibitions and preemptive signals, should be pursued aggressively by TTC.
The first recommendation was implemented in late March of this year. The change will be assessed for impact before any more scheduling or route structuring changes are made such as the scheduled short-turn service proposed under Recommendation 4.
The second recommendation, which concerns shortturn criteria, is being adopted in a more general manner. However, route inspectors will still be expected to make individual judgments on the basis of the conditions in specific instances.
The commission's staff has been studying vehicle signing for some time. These studies will continue to be actively pursued in accordance with the consultant's third recommendation.
Recommendations 5 and 6 are long-range matters. The Toronto Transit Commission has already placed an order for 52 ALRVs for delivery in 1986 and 1987. These vehicles are planned for use on the Queen route. One vehicle is on the property for the purpose of checking physical limitations such as loop turning radii, lengths of existing safety islands, and subway station surface platforms.
The deployment of CLRVs and the possible future use of ALRVs will certainly be fully considered in the future as will possible expansion of CIS to cover the Queen route.
Recommendation 7, that the TTC pursue preemption for transit vehicles at traffic signals, has already been made the subject of extensive investigation as explained in an earlier section and as detailed in the next section.
STUDY OF TRANSIT-ACTUATED SIGNAL PRIORITY MEASURES
One key recommendation of the consultant's study was to aggressively pursue transit preemption at traffic signals. A study of preemption had already been initiated by TTC and, although still ongoing, is described.
In response to mounting public complaints about the Queen Street streetcar service, a study was launched early in 1984, before the Queen Streetcar Operations Study, involving staff from the Toronto Transit Commission, the Metropolitan Toronto Department of Roads and Traffic, and the Ontario Ministry of Transportation and Communications. A two-level steering and working committee structure was adopted with appropriate management and technical staff sitting on the respective committees.
This project was first conceived in May 1983, and the terms of reference were approved by the participating agencies in January 1984. The stated objectives of the project were to improve the efficiency and the quality of transit service afforded transit patrons and to improve the total person-movement function of the arterial street as a whole. It was agreed that the improvements in transit performance would be assessed relative to the overall passenger flow in the study corridor for all modes of transport. A pair of test routes was selected in order to study the introduction of traffic signal priority measures, namely an arterial bus route and a central
232
area streetcar route. In view of the practical needs that TTC was facing on Queen Street, that route was the obvious choice for the latter category.
The project has been divided into three distinct phases:
Phase 1. preliminary review;
Route selection, analysis, and
base data collection, preemption technology
Phase 2. Optimized signal timings and follow-up analysis (if warranted); and
Phase 3. Transit preemption technology and follow-up analysis.
These three separate study phases have been selected in order to show the incremental improvements gained over the base-case situation by applying the two levels of tr.incit priority indicated in Phases 2 a nd 3. Phase 2 represents the classical transportation systems management (TSM) approach whereby straightforward and low-cost fine tuning is applied to maximize the efficiency of the existing system. Phase 3 involves a more sophisticated transit-based signal preemption system that requires capital expenditure.
The specific steps in the study design are
Phase 1 Step A--Conduct a comprehensive state-of-the-art
technology review of transit-based signal preemption systems throughout the world.
Step B--Select two test routes, one arterial bus route and one central streetcar route.
Step c--Collect pertinent data to determine the signal stopped time for both transit and private vehicles.
Step D--Evaluate preliminary benefit-cost relative to Phase 3, based on anticipated potential travel time savings versus probable costs for different available preemption systems
Phase 2 step E--Optimize signal timings, on the bas is of
the data collected in Step C. Step F--Collect follow-up data measuring the
effects of the new signal coordi.na tion and timing patterns .
S tep G--Evaluate Phase 2 and decide whether to pursue a t r ans it- based signal preemption system in Phase 3.
Phase 3 (if warranted) Step H--Implement a transit-based preemption
system on a sign i f ican t stretch of the study r ou te s to reduce t raf.fic s i gnal delay to transit veh icl e s to the fullest extent possible (beyond improvements achieved in Step E).
s t ep I--Col.lec t f ollow-up data to measur e the incremental improvements achieved over signal optimization.
The before-and-after data collection exercise, for comparison of Phase 1 and Phase 2 and of Phase 2 and Phase 3, is a substantial component of this project. The effects of the modified signal operations are being measured by automobile and transit speed and d e lay surveys on a corridor basi s for each p hase of t he project. Queue length a nd vehicular delay studies are also required on the cross streets that are affected by any signal timing changes or p r i o rity or preemption measures .
To dat e , the study on Queen Street bas progressed to s t ep E unde r Phase 2 . Step F, f o l low- up studies, is planned for the s pring of 1 98 5 i n o r der to determine the extent of improvements to streetcar operations that are directly attributable to improved
TRB State-of-the-Art Report 2
signal timings. The majority of traffic signal changes that were implemented under Phase 2 took the form of flashing advanced green phases as well as revised signal off-sets to improve progression on Queen Street for the overall movement of traffic.
SUMMARY
An extensive study of Queen streetca r operations was r ece ntly conducted to address the operational problems being experienced on the line and, specifically, to determine whether the inconvenience caused to passengers by the resulting short-turning procedures could be reduced.
The key short-term recommendations resulting from this study are to increase the scheduled round-trip time from 120 to 125 min, implement scheduled shortturns on the route, and increase the minimum gap size required to initiate a short-turn decision from twice the scheduled headway to three times the scheduled headway.
Although it will take time to implement and test these modifications, it is doubtful whether any improvements that may result will be "revolutionary" enough to significantly alter the public's perception of the operational problems inherent in mixedtraffic operation.
If this does prove to be the case, it will merely confirm the suspicion that, where sound planning principles are already being adhered to, significant service improvement,c: can only be achieved by expe di ting the implementation of state-o f - t he-art technology , such as CIC .ind transit preemption at tr,tffir. signals. The extension of CIS control throughout TTC is an ongoing development project. TTC has already initiated, and is currently conducting, an extensive study of the application of transit-actuated signal priority measures.
DIRECTION FOR THE FUTURE
There .,,re definite frustrations that arise when the public becomes i'ncreasing l y aware of sign if ican t operationa l p roblems s uch a s t hos e on Queen Stre et, but i nvest i gation c o nfirm;; t hat the cause of th e problem and its solution are gene r al ly beyond the control of the tra nsit agency involved. One posi tive result of such a problem is that the municipalities and politicians are also becoming increasingly aware that operating streetcars in mixed traffic in the downtown area of a large city is in a sense "asking for trouble. "
Harborfront LRT
Recently, an LRT line operating in an exclusive right-of-way was proposed as the most efficient way of servinq extensive development planned for Toronto's waterfront. This proposal is for LRT operation in the center median of the roadway with a high priority at traffic signals. Left-turning automobiles would not be permitted to share the right-of-way but would make the il'.: turn from th e right side of the LRT line on a special signal phas e. Even though such a facility would further reduce the capacity of a road system, which would experience significant congestion even if the LRT could be removed from the roadway entirely, the proposal has received strong support.
The LRT line, shown in Figure 3, would have a subgrade connection to Union Station, the primary subway and interregional rail terminal facility in downtown metropolitan Toronto. Although the line
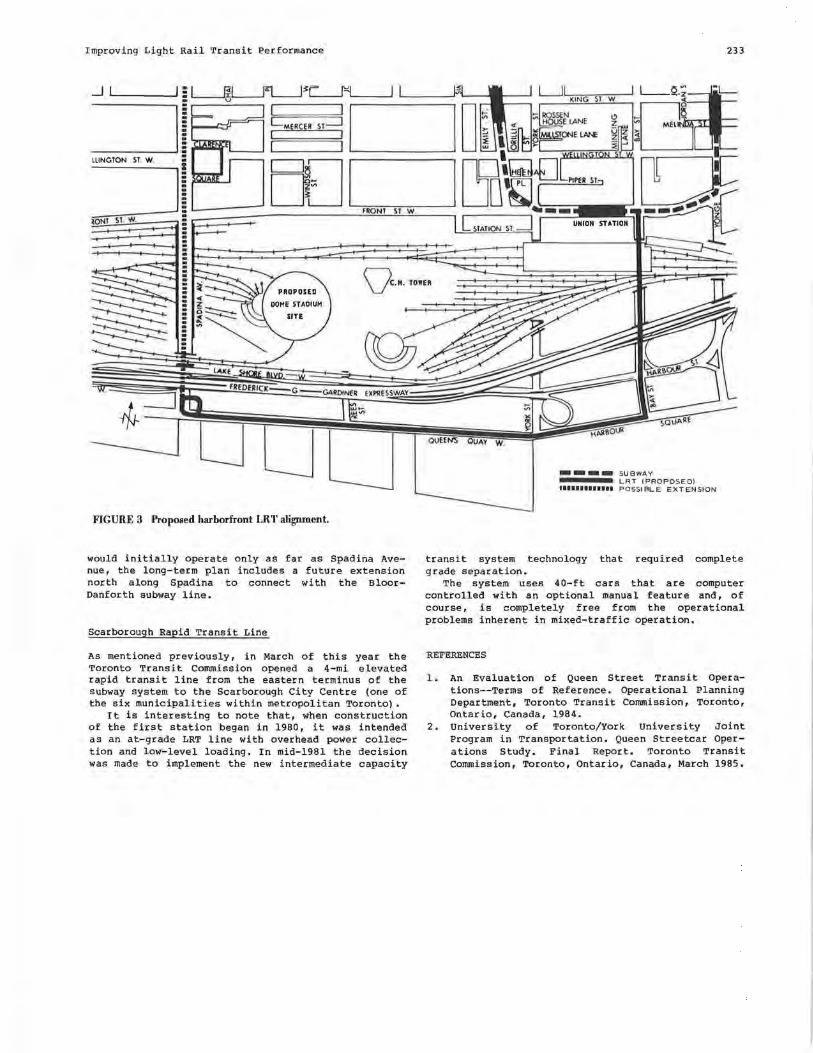
Improving Light Rail Transit Performance 233
_JI....._ ___ _, ~lNG SI , W.
________ ....., LLINGION ST. W
~ ElJI ~~f"'~o==cN'"'"1,-s""1"'". "'w,----'
lONI ST. W.
Qc.N. TOWER
EXP1\E$SWAY
FIGURE 3 Proposed harborfront LRT alignment.
would initially operate only as far as Spadina Avenue, the long-term plan includes a future extension north along Spadina to connect with the BloorDanforth subway line.
Scarborough Rapid Transit Line
As mentioned previously, in March of this year the Toronto Transit Commission opened a 4-mi elevated rapid transit line from the eastern terminus of the subway system to the Scarborough City Centre (one of the six municipalities within metropolitan Toronto).
It is interesting to note that, when construction of the first station began in 1980, it was intended as an at-grade LRT line with overhead power collection and low-level loading. In mid-1981 the decision was made to implement the new intermediate capacity
OUEEN:5 OLIAY W.
---- SUBWAY LRT (PROPOSED) 1111111111111 POSSIBLE EXTENSION
transit system technology that required complete grade separation.
The system uses 40-ft cars that are computer controlled with an optional manual feature and, of course, is completely free from the operational problems inherent in mixed-traffic operation.
REFERENCES
1. An Evaluation of Queen Street Transit Operations--Terms of Reference. Operational Planning Department, Toronto Transit Commission, Toronto, Ontario, Canada, 1984.
2. University of Toronto/York University Joint Program in Transportation. Queen Streetcar Operations Study. Final Report. Toronto Transit Commission, Toronto, Ontario, Canada, March 1985.
Preferential Control Warrants of Light Rail 'Iransit Movements A. Essam Radwan Department of Civil Engineering, Arizona State University Tempe, Arizona
Kuo-Ping Hwang Department of Civil Engineering, Virginia Polytechnic Institute and State University Blacksburg, Virginia
Light rail transit (LRT) is catching the attention 'of people in numerous cities across North America today. New LRT operations were initiated in Edmonton and Calgary, Alberta, in 1978 and 1981, respectively (1,2). New systems are in an advanced stage of construction in Buffalo, and others are being considered for upgrading in Pittsburgh, San Diego, and San Francisco.
LRT, as defined by the Transportation Research Board Committee on Light Rail Transit, is a mode of urban transportation that uses predominantly reserved but not necessarily grade-separated rights-of-way. Electrically propelled rail vehicles operate singly or in trains. Most of the LRT operating environment is at grade but with predominantly controlled rightsof-way. Separated right-of-way, on-street ope~ation, and transit-pedestrian malls are the most common forms of at-grade operating environments. Median LRT treatment is a special design in which the light rail line is accommodated in an existing wide median :>f a multilane arterial. Such designs may be used for heavily traveled arterials where signal timings ,hould be carefully studied to maximize the passenger :hroughput of the system. A common preferential ~antral technique for LRT is traffic signal preemp:ion in favor of the LRT; however, this technique ~ay adversely affect the overall performance of the ;ystem. The major objective of this study is to cnvestigate preferential control of LRT, using dif'erent signal preemption strategies, and to attempt :o develop control warrants for these strategies.
~ACK GROUND
rhe use of unconditional traffic signal preemption 1enerally results in some loss in intersection capacity. This loss is proportional to the LRT frequency and the particular preemption strategy us ed. In a recent study (3) the impact of signal preemption on intersection capacity was evaluated. It was concluded that at a standard intersection where all other traffic must stop to allow the LRT vehicle to pass , around 10 pe rcent of the available signal time would be lost if preemption occurred every 3 min. Furthermore, for a multilane arterial with far-side transit stops, a constant main-street traffic volume
234
of 20,000 vehicles per day and cross-street volume range of from 10,000 to 20,000 vehicles per day, it was found that a multiphase traffic signal makes LRT preemption feasible in every third cycle. If simple two-phase signals are used and left turns are prohibited, LRT preemption in every second cycle is feasible. Similar capacity analyses performed for a midblock crossing of four-lane arterials showed that preemption is feasible as often as every 2 min for traffic volumes as high as 25,000 vehicles per day.
In another study (4) the use of the level-of-service criterion to evaluate LRT impacts on traffic flow over arterials was criticized because it significantly favors the automobile mode over the LRT mode and does not consider the volume of people carried by transit. A factor that indicates the percentage of theoretical capacity of the intersection that is being used (intersection utilization factor) was used to evaluate the impact on street traffic performance of operating LRT within the same vehicular right-of-way. Utilization factors were calculated for three alternative operational strategies:
• Left turns from the arterial onto the cross street ( across the LRT tracks) controlled with a special signal phase,
• Left turns prohibited from the arterial onto the cross street, and
• All traffic stopped during LRT passage.
The utilization factors without LRT preemption were also included for comparison. Analysis of these results pointed out a key conceptual difficulty with the use of the traditional level-of-service approach. The results imply that, as the frequency of the LRT operation increases, the feasibility of preemption decreases; it causes an "unacceptable" impact on cross traffic. However, higher frequency LRT operation actually may mean that greater numbers of transit passengers are traversing the intersection. Thus the true situation may be the opposite from that implied by the utilization facto. results.
A parametric analysis was conducted in the same study, using a delay model developed by May and Pratt (5), to alleviate the problems wi t h the levelof-service approach. Two major concl usions were
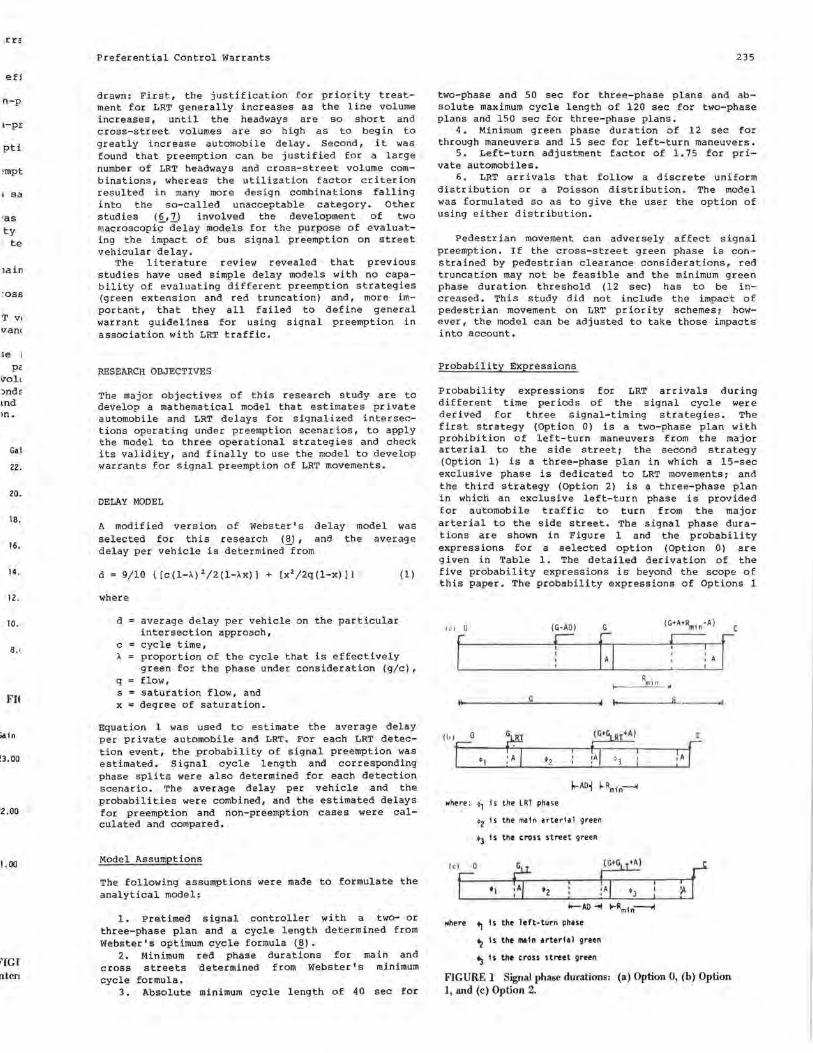
.rrc'
ef/
n-p
1-pr
pti
!mpt
1 sa
·as ty • te
aain
:oss
T VI
van<
Se I
pa IJOll
:JndE tnd m.
Ga1
22.
20.
18.
16.
14.
12.
10. ·
8.1
FH
'.lain
13.00
!2.00
'1.00
FIGl nten
Preferential Control Warrants
drawn: First, the justification for priority treatment for LRT generally increases as the line volume increases, until the headways are so short and cross-street volumes are so high as to begin to greatly increase automobile delay. Second, it was found that preemption can be justified for a large number of LRT headways and cross-street volume combinations, whereas the utilization factor criterion resulted in many more design combinations falling into the so-called unacceptable category. Other studies (6,7) invo lve d the development of two macroscopic delay models for the purpose of evaluating the impact of bus signal preemption on street vehicular delay.
The literature review revealed that previous studies have used simple delay models with no capability of evaluating different preemption strategies (green extension and red truncation) and, more important, that they all failed to define general warrant guidelines for using signal preemption in association with LRT traffic.
RESEARCH OBJECTI VES
The major objectives of this research study are to develop a mathematical model that estimates private automobile and LRT delays for signalized intersections operating under preemption scenarios, to apply the model to three operational strategies and check its validity, and finally to use the model to develop warrants for signal preemption of LRT movements.
DELAY MODEL
A modified version of Webster's delay model was selected for this research (~), and the average delay per vehicle is determined from
d = 9/ 10 { [c(l-A) 2 /2(1-Ax)] + [x 2 /2q(l-x)]}
where
d average delay per vehicle on the particular intersection approach,
c cycle time, A proportion of the cycle that is effectively
(1)
green for the phase under consideration (g/c), q flow, s = saturation flow, and x = degree of saturation.
Equation 1 was used to estimate the average delay per private automobile and LRT. For each LRT detection event, the probability of signal preemption was estimated. Signal cycle length and corresponding phase splits were also determined for each detection scenario. The average delay per vehicle and the probabilities were combined, and the estimated delays for preemption and non-preemption cases were calculated and compared.
Model Assumptions
The following assumptions were made to formulate the analytical model:
1. Pretimed signal controller with a two- or three-phase plan and a cycle length determined from Webster's optimum cycle formula {_!!).
2. Minimum red phase durations for main and cross streets determined from Webster's minimum cycle formula.
3. Absolute minimum cycle length of 40 sec for
235
two-phase and 50 sec for three-phase plans and absolute maximum cycle length of 120 sec for two-phase plans and 150 sec for three-phase plans.
4. Minimum green phase duration of 12 sec for through maneuvers and 15 sec for left-turn maneuvers.
5. Left-turn adjustment factor of 1.75 for private automobiles.
6. LRT arrivals that follow a discrete uniform distribution or a Poisson distribution. The model was formulated so as to give the user the option of using either distribution.
Pedestrian movement can adversely affect signal preemption. If the cross-street green phase is constrained by pedestrian clearance considerations, red truncation may not be feasible and the minimum green phase duration threshold ( 12 sec) has to be increased. This study did not include the impact of pedestrian movement on LRT priority schemes; however, the model can be adjusted to take those impacts into account.
Probability Expressions
Probability expressions for LRT arrivals during different time periods of the signal cycle were derived for three signal-timing strategies. The first strategy {Option 0) is a two-phase plan with prohibition of left-turn maneuvers from the major arterial to the side street; the second strategy (Option 1) is a three-phase plan in which a 15-sec exclusive phase is dedicated to LRT movements; and the third strategy (Option 2) is a three-phase plan in which an exclusive left-turn phase is provided for automobile traffic to turn from the major arterial to the side street. The signal phase durations are shown in Figure 1 and the probability expressions for a selected option (Option 0) are given in Table 1. The detailed derivation of the five probability expressions is beyond the scope of this paper. The probability expressions of Options 1
(.ol 0 (G-AO) G
f r= [1 G
(G•GLgf'A)
tA, f3
where: ,1
1 s the LRT phase
(c) D
E
~2 is the ma 1 n a rter1a 1 green
,3
1s the cross street green
~ ~
(G+A+Rmin -A )
R min ..,
lo--AO -of i,-Rm1n--,j
where +i 1s the left-turn phase
~ Is the n,a.1n arterial green
fo.3 1s the cross street green
FIGURE 1 Signal phase durations: (a) Option O, (h) Option 1, and (c) Option 2.
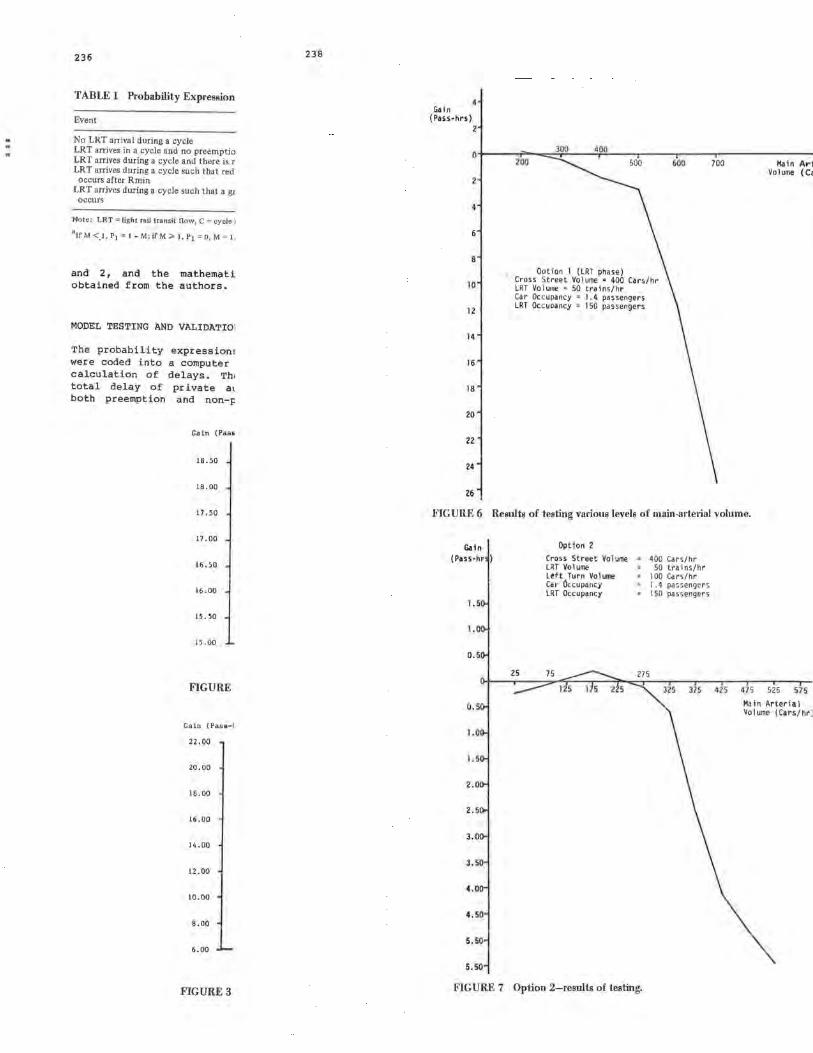
236
TABLE 1 Probability Expression
Event
No LRT arrival during a cycle LRT arrives in a cycle and no preemptio LRT arrives during a cycle and there is r LR T arrives during a cycle such that red
occurs after Rmin LRT arrives during a cycle such that a gr
occurs
Note: LRT:::: light rail transit flow, C = cycle I
81[ M <.J, P1 = I - M; iF M ;, I, P1 = 0, M = I ,
and 2, and the mathemati obtained from the authors.
MODEL TESTING AND VALIDATIOi
The probability were coded into calculation of total delay of both preemption
expression! a computer delays. Th, private at and non-i:
Gain (Pasi
18.50
18.00
17 .so
17 .oo
16. 50
16.00
15. 50
15.00
FIGURE
Gain (Pasa-1
22 .oo
20 .00
18.00
16.00
14 .00
12.00
10.00
8.00
6.00 L FIGURE 3
238
Gain ( Pass-hrs)
2
o~---.,..-=-~~-_.:4~0~0"----.---....-----,,----------
2
4
8
10
12
14
16
18
20
22
24
26
200 500 600 700 Main Arte,
Ootion l (LRT phase) Cross Street Volume • 400 Cars/hr LRT Vo 1 ume • 50 trains/ hr Car Occupancy • 1. 4 passengers LRT Occuoancy • 150 passengers
Volume (Car
FIGURE 6 Results of testing various levels of main-arterial volume.
Gain ( Pass -hr
J. 50
4.00
4.50
5.50
5.50
Option 2
Cross Street Vo 1 ume ~ 400 Cars/hr LRT Volume Left Turn Volume Car Occupancy LRT Occupancy
50 trains/hr • 100 Cars/hr .11 l .4 pa~sengers • 150 passengers
FIGURE 7 Option 2-results of testing.
425 475 525 57S Main Arterial Volume (Cars/hr ]
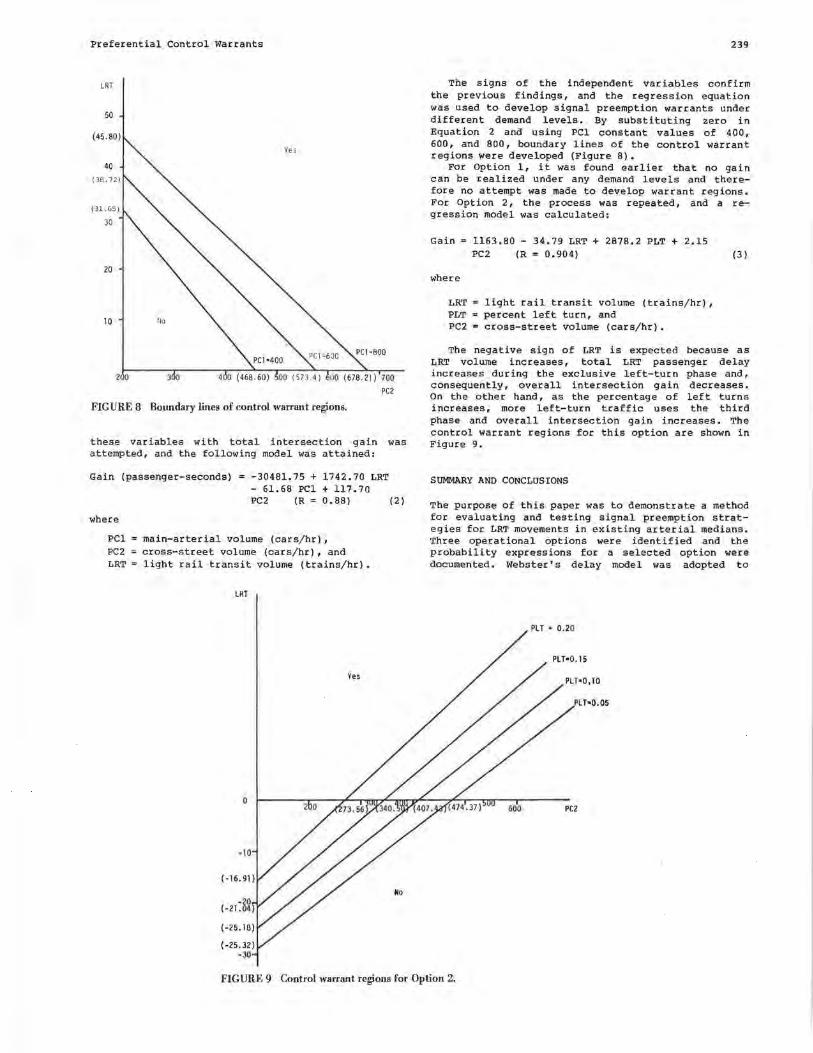
Preferential Control Warrants
LRT
50
(45.80)
40
(38. 72)
(31.65)
30
20
10
FIGURE 8 Boundary lines of control warrant regions.
PC2
these variables with total intersection gain was attempted, and the following model was attained:
Gain (passenger-seconds) = -30481.75 + 1742.70 LRT - 61.68 PCl + 117.70 PC2 (R = 0.88)
where
PCl main-arterial volume (cars/hr), PC2 cross-street volume (cars/hr), and LRT = light rail transit volume (trains/hr).
LRT
0
-10
(-21 Jg
(-25. 32) ·30
Yes
(2)
No
239
The signs of the independent variables confirm the previous findings, and the regression equation was used to develop signal preemption warrants under different demand levels. By substituting zero in Equation 2 and using PCl constant values of 400, 600, and 800, boundary lines of the control warrant regions were developed (Figure 8).
For Option 1, it was found earlier that no gain can be realized under any demand levels and therefore no attempt was made to develop warrant regions. For Option 2, the process was repeated, and a regression model was calculated:
Gain= 1163.80 - 34.79 LRT + 2878.2 PLT + 2.15
where
LRT PLT PC2
PC2 (R = 0.904) (3)
light rail transit volume (trains/hr), percent left turn, and cross-street volume (cars/hr).
The negative sign of LRT is expected because as LRT volume increases, total LRT passenger delay increases during the exclusive left-turn phase and, consequently, overall intersection gain decreases. On the other hand, as the percentage of left turns increases, more left-turn traffic uses the third phase and overall intersection gain increases. The control warrant regions for this option are shown in Figure 9.
SUMMARY AND CONCLUSIONS
The purpose of this paper was to demonstrate a method for evaluating and testing signal preemption strategies for LRT movements in existing arterial medians. Three operational options were identified and the probability express ions for a selected option were documented. Webster's delay model was adopted to
PLT • 0.20
PLT•0.15
LT•0.05
600 PC2
FIGURE 9 Control warrant regions for Option 2.
240
estimate the average delay per vehicle per approach. The model was tested using a set of hypothetical demand parameters. The results of the model testing proved that the model parameters consistently produce reasonable results and that the model is sensitive to variations in main-arterial and cross-street volumes.
Further~ore, it was concluded that, for the twophase signal plan (Option 0), the overall intersection gain due to signal preemption is linearly proportional to LRT volume, and that there wac no impaot of advance detection duration on intersection gain.
For the three-phase signal plan with a separate LRT phase (Option 1) , no intersection gain was observed for almost all main-arterial volume levels. ='~~ 4:~~ t~!'~~-!,:'~?;~~ ~i~!"!~l t.drh ;:u, PYrln~iuP 1Pft
turn phase (Option 2), it was found that there exists an optimum main-arterial volume at which the overall intersection gain is maximum fut: a y lveu consLa1-.L left-turn volume. Finally, boundary lines of the control warrant regions for Options O and 2 were developed.
REFERENCES
1. Light-Rail Transit in North America: What's Going On? !TE Journal, March 1980.
TRB State-of-the-Art Report 2
2. E. Guillot. LRT Design Choices: Edmonton and Calgary. Transportation Quarterly, July 1983.
3. H. Korve. Traffic Engineering for Light-Rail Transit. In TRB Special Report 182: Light-Rail Transit: Planning and Technology, TRB, National Research Council, Washington, D.C., 1978, pp. 107-115.
4. T. Stone and W. Wild. Design Consideration for LRT in Existing Medians: Developing Warrants for Priority Treatments. In TRB Special Report 195: Light Rail Trancit1 Planning, Design, and Implementation, TRB, National Research council, Washington, D.C., 1982, pp. 170-175.
5. A. May, Jr., and D. Pratt. A Simulation Study of Load Factor at Signalized Intersection. Traffic Q--~----~-- ~-h ,nco ...... '='.._ •• .._.._.._ .&.••-=:, r .._ ._.,,. .,_,..,u.
6. A. Radwan and J. Hurley. Analytical Model of Bus Preemption Signal System: A Macroscopic Approach. 'l'ransportation Quarterly, Jan. 1982.
7. A. Radwan and J. Hurley. Macroscopic Traffic Delay Model of Bus Signal Preemption. In Transportation Research Record 881, TRB, Nallum,l Research Council, Washington, D.C., 1982, pp. 59-65.
8. F. Webster. Traffic Signal Settings. Road Research Technical Paper 39. Road Research Laboratory, London, England, 1958.


