L.M. Burke, G. Slater, E.M. Broad, and S. Modulon are with the Department of SportsNutrition in the Australian Institute of Sport, Belconnen 2616, Australia. J. Haukka is withthe School of Health Sciences at Deakin University, Burwood, Victoria 3125, Australia.W.G. Hopkins is with Health Science at the Auckland University of Technology, Auckland1020, New Zealand.
521
Eating Patterns and Meal Frequencyof Elite Australian Athletes
Louise M. Burke, Gary Slater, Elizabeth M. Broad,Jasmina Haukka, Sofie Modulon, and William G. Hopkins
We undertook a dietary survey of 167 Australian Olympic team athletes (80females and 87 males) competing in endurance sports (n = 41), team sports (n =31), sprint- or skill-based sports (n = 67), and sports in which athletes areweight-conscious (n = 28). Analysis of their 7-day food diaries provided meanenergy intakes, nutrient intakes, and eating patterns. Higher energy intakesrelative to body mass were reported by male athletes compared with females,and by endurance athletes compared with other athletes. Endurance athletesreported substantially higher intakes of carbohydrate (CHO) than other ath-letes, and were among the athletes most likely to consume CHO during and aftertraining sessions. Athletes undertaking weight-conscious sports reported rela-tively low energy intakes and were least likely to consume CHO during atraining session or in the first hour of recovery. On average, athletes reportedeating on ~5 separate occasions each day, with a moderate relationship betweenthe number of daily eating occasions and total energy intake. Snacks, defined asfood or drink consumed between main meals, provided 23% of daily energyintake and were chosen from sources higher in CHO and lower in fat and proteinthan foods chosen at meals. The dietary behaviors of these elite athletes weregenerally consistent with guidelines for sports nutrition, but intakes during andafter training sessions were often sub-optimal. Although it is of interest to studythe periodicity of fluid and food intake by athletes, it is difficult to compareacross studies due to a lack of standardized terminology.
Key Words: dietary survey, energy intakes, CHO intakes, dietary practices
Introduction
There is a number of dietary surveys of Olympic and other elite-level athletes (10,16, 19, 24, 34, 35) that present the intakes of energy and nutrients reported by theirsubjects in comparison to recommended dietary intakes for populations or to spe-cific nutrient and dietary guidelines for athletes. To date, however, there has beenlittle interest in the meal frequencies and eating patterns that underpin this nutri-tional intake. This information is important for a number of reasons.
First, the spacing or periodicity of meals may play a role in meeting variousgoals of sports nutrition. The timing and frequency of energy or nutrient intake hasimplications for metabolism or nutrient availability, and can be manipulated toachieve specific nutrition goals. For example, nutritional guidelines for athletesalready make specific recommendations about optimal timing of carbohydrate (CHO)intake before, during, and after exercise in order to enhance CHO availability (9).Therefore, it is of interest to see if athletes meet specific guidelines for the timing ofnutrient intake within their total daily consumption.
Second, the elite athlete faces a number of unusual practical challenges to theachievement of their nutritional requirements. Issues such as a busy lifestyle, fear ofgastrointestinal discomfort during exercise, or suppressed appetite after trainingmay dictate opportunities for food and fluid intake over the day. The traditionaleating pattern of “three square meals per day” may not be suitable for, or availableto, the athlete. Indeed, a number of dietary surveys have commented on the “graz-ing” food patterns or high frequency of separate eating occasions in groups ofathletes who report large energy intakes (10, 11, 14, 23, 28, 29, 31, 35). In thesestudies, the estimated contribution of “between meal snacks” to total daily energyintake was high, 25–37% of the total daily energy intake (11, 14, 28, 35). However,the existing data are limited in number and, in these studies, the definition of aneating occasion and the distinction between “meals” and “snacks” were not alwaysmade clear. Therefore, a more systematic investigation of the way that athletesschedule food intake into their daily timetables is needed.
The aim of this study was to undertake a dietary survey of a large group of eliteathletes, who were part of the 1996 Australian Olympic team. We were interested toinvestigate the reported intakes of energy and macronutrients by these athletes andhow these nutrients were spread into separate eating occasions each day. We de-vised a system of time-based cues to define meals and snacks eaten over the day,with a separate definition for energy consumed during training sessions. Sincesports nutrition guidelines make recommendations for CHO and fluid intake duringand after exercise, we also assessed how these nutrients were consumed in relationto training sessions. We considered whether gender or type of exercise / sportingactivity affected the reported frequency and spread of energy and macronutrientsover the day, and their eating/drinking behavior related to training.
Methods
Subject Recruitment
Approval for this study was obtained from the Australian Olympic Committee andthe Ethics Committee of the Australian Institute of Sport. Data were collected fromathletes during the 3–6 month preparation period before the 1996 Olympic Games,while they followed their typical training and eating patterns. We recruited subjectsvia a mailing, coordinated by the section manager representing each national sport-ing organization within the Australian Olympic Games team, and sent to each of theapproximately 1000 athletes identified as potential members of the final Olympicteam. This mailing contained a sheet summarizing the purpose of the study and thebenefits to participants, detailed instructions on how to complete the survey, and asurvey form comprising a brief questionnaire and a 7-day food and activity record.Once the mailing was completed, we attempted to telephone each potential team
Eating Patterns and Meal Frequency / 523
member using the contact details provided by their national sporting organization.Subjects were invited to participate in the study if they were currently undertaking afull training program and living in their normal eating environment. We offered thefollowing incentives to encourage athletes to participate in the study: We committedto provide each athlete with immediate feedback about their reported intake ofenergy and nutrients, and we offered prizes of nutrition education resources to 1 inevery 25 athletes who returned a completed questionnaire and food record. Stampedself-addressed envelopes were provided in the survey kit.
Athletes undertaking interstate or overseas travel were eligible to participateonly if this travel schedule represented their typical training routine and lifestyle. Inour final sample, we only included athletes who were chosen to be on the AustralianOlympic Team. In total we were able to contact 287 athletes who were eligible toparticipate in the study. We received usable data from 167 athletes, which repre-sented 39% of the 424 athletes who competed on the Australian Team at the 1996Olympic Games and 58% of the sample pool who could be contacted.
Classification of Athletes
We devised four major categories a priori to define sports activities, classifying eachathlete who completed the survey with the category that best described the charac-teristics of their training and competition. The categories, similar to those used inother surveys of athletic groups (35), were endurance sports (ENDURANCE);sports requiring mainly sprint power, explosive power, or skill (SPRINT/SKILL);team sports (TEAM); and sports in which athletes are concerned about weight gain(WEIGHT). Subjects in our final sample were divided into the following groups:
• SPRINT/SKILL: 4 archery, 3 modern pentathlon, 6 table-tennis, and 4 sprinttrack or field athletes; 18 baseball and 8 softball players, 2 hockey goal keep-ers, and 9 shooters
During our initial phone contact, we provided subjects who agreed to participate inthe study with detailed verbal instructions to support the written material included inthe mailing. Each researcher read these instructions from a prepared script to ensurethat a standardized message was given to each athlete. The verbal and writteninstructions provided information to standardize the collection of demographicinformation from subjects and the completion of a 7-day food record during a periodof typical training. The following protocol for completing a 7-day food record waschosen and enforced:
• We asked subjects to record their intake of all fluid and foods, and all trainingsessions undertaken over the 7-day period. We asked them to make an entry intheir food record sheets at the time of each activity, noting the time at whichthe activity was undertaken.
524 / L.M. Burke et al.
• We advised subjects of the benefits of keeping accurate and reliable records toensure valuable personal feedback. Common issues leading to the alterationof usual eating patterns were discussed (e.g., omitting or changing foods thatare hard to record, or that the subject feels they shouldn’t be eating), withexplanations of how to avoid or minimize these problems.
• We asked subjects to provide full descriptions of foods and fluids consumedaccording to features specified in the record. Specified features included thecommercial brand names of packaged food, cooking or preparation methods,and food items added in preparation. In the case of composite foods and mixeddishes (e.g., pizzas, stir-fries, sandwiches), recipes or a full description ofingredients were requested.
• We asked subjects to quantify the portion of foods or fluids consumed, byreferring to the weight or volume information provided on food packages orby using standardized household measures (e.g., standard teaspoons, table-spoons, cups). Foods that could not fit into a standard measure—for example,foods served in a single piece—were described by the dimensions of theirshape, with a grid measured in centimeters being provided to allow thesemeasurements to be done accurately.
During the instruction process, we offered subjects the opportunity to discussspecific methods for recording foods and drinks that they were likely to consumeand considered “troublesome” (i.e., hard to describe or quantify). We documentedany individual instructions given to subjects about troublesome and unusual foods,and prepared our own coding information for handling the analysis of these products.
Coding of Completed Food Records
All food records were coded and entered for computer dietary analysis by the sameresearcher (G.S.). On receipt of a completed questionnaire and food record, thisresearcher marked any ambiguous information on the sheets and immediately calledthe athlete to clarify the meaning of the entries. The number and type of trainingsessions undertaken during the 7 days of the diary were counted to ascertain thetypical weekly training program.
The coding and quantification of food and fluid intake reported on each fooddiary was undertaken with reference to a manual specially prepared for this project.Our research team collated the manual prior to the commencement of the coding offood records in order to provide information on all foods likely to be consumed byour athlete population. This information included translations of quantitative de-scriptions of foods and drinks from household measures, dimensions, or commer-cial portions into gram amounts. It also summarized coding decisions that wouldneed to be made for foods not appearing in the database of the computerized dietaryanalysis program, and provided details of the nutrient composition of foods that wehad added to this database. In this way, the researcher coding the food records wasable to standardize the descriptive and quantitative decisions made for each itemrecorded in the food diaries.
Periods of eating were broken into the following categories, based principallyon time cues:
• Breakfast: 0500–0959• Morning tea: 1000–1159
Eating Patterns and Meal Frequency / 525
• Lunch: 1200–1459• Afternoon tea: 1500–1759• Dinner: 1800–2059• Evening snack: 2100–0459• Training: all energy-containing foods and fluid consumed during a workout
To distinguish the number of eating occasions reported each day, we experi-mented with 2 classification systems. First, we considered the intake of food orenergy-containing drinks (defined as providing > 200 kJ) reported within the same60-min period in the same location to constitute a single eating occasion. We thenrecoded the diaries to consider a single eating occasion as food or energy-containingdrinks consumed within a 30-min period. Since each system produced a similarnumber of eating occasions recorded in a day, we decided only to report data basedon the 30-min classification protocol.
We examined each training session for the reported intake of fluid or CHO.For each athlete, we calculated the percentage of the total number of training ses-sions in which they reported consuming both fluid and CHO (FLUID/CHO), thosein which fluid only was reported (FLUID), and those in which the athlete did notreport any intake (NIL). Recovery after each training session was assessed accord-ing to the guideline that the athlete should consume at least 0.8 g CHO/kg body mass(BM) within the first hour after a workout (27). Recovery after each training sessionwas assessed as being fully achieved if the athlete had reported consuming a CHOintake > 0.8 g/kg BM during the hour after the session (RECOVERY), whereas wedefined some attempt at recovery if reported CHO intake was 0.4–0.8 g/kg (AT-TEMPT) and no recovery achieved if reported CHO intake was < 0.4 g/kg (NIL).
Dietary Analysis
The researcher first coded the food diary before entering the data into the dietaryanalysis program. A random check of data entries for each day of each record wascompleted to check for entry errors. The computerized dietary analysis packageused in this survey was SERVE Nutritional Management System (v. 2.0, St. Ives,Australia) and was updated with information for composite dishes (recipes involv-ing a combination of foods such as lasagna, casseroles, and sandwiches), commer-cial foods, and sports foods, where reliable nutritional composition data could beobtained. Data relating to reported intake of energy and macronutrients were exam-ined from the dietary analysis sheets.
Statistical Analyses and Interpretation of Data
Although this survey of dietary behaviors of elite athletes is among the most com-prehensive in the literature, the sample size is still not large enough to characterizesmall but clinically important differences between sex and sporting groups withacceptable precision. We have therefore not reported tests of statistical significance,lest readers reach erroneous conclusions about lack of differences between subgroups.Readers who wish to perform such tests or other analyses will be provided with thesedata as a tab-delimited text file on request.
We have used the mean and standard deviation (SD) to represent centralityand dispersion for subject characteristics and dietary behaviors of all athletes and ofathletes in each sex and sport group. Uncertainties in the estimates of the means and
526 / L.M. Burke et al.
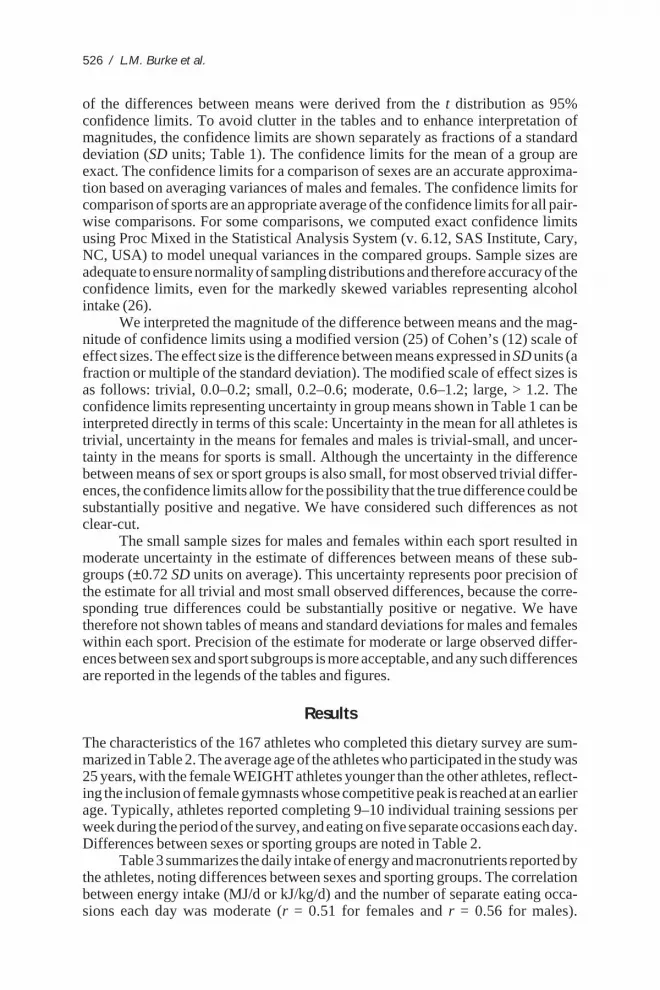
of the differences between means were derived from the t distribution as 95%confidence limits. To avoid clutter in the tables and to enhance interpretation ofmagnitudes, the confidence limits are shown separately as fractions of a standarddeviation (SD units; Table 1). The confidence limits for the mean of a group areexact. The confidence limits for a comparison of sexes are an accurate approxima-tion based on averaging variances of males and females. The confidence limits forcomparison of sports are an appropriate average of the confidence limits for all pair-wise comparisons. For some comparisons, we computed exact confidence limitsusing Proc Mixed in the Statistical Analysis System (v. 6.12, SAS Institute, Cary,NC, USA) to model unequal variances in the compared groups. Sample sizes areadequate to ensure normality of sampling distributions and therefore accuracy of theconfidence limits, even for the markedly skewed variables representing alcoholintake (26).
We interpreted the magnitude of the difference between means and the mag-nitude of confidence limits using a modified version (25) of Cohen’s (12) scale ofeffect sizes. The effect size is the difference between means expressed in SD units (afraction or multiple of the standard deviation). The modified scale of effect sizes isas follows: trivial, 0.0–0.2; small, 0.2–0.6; moderate, 0.6–1.2; large, > 1.2. Theconfidence limits representing uncertainty in group means shown in Table 1 can beinterpreted directly in terms of this scale: Uncertainty in the mean for all athletes istrivial, uncertainty in the means for females and males is trivial-small, and uncer-tainty in the means for sports is small. Although the uncertainty in the differencebetween means of sex or sport groups is also small, for most observed trivial differ-ences, the confidence limits allow for the possibility that the true difference could besubstantially positive and negative. We have considered such differences as notclear-cut.
The small sample sizes for males and females within each sport resulted inmoderate uncertainty in the estimate of differences between means of these sub-groups (±0.72 SD units on average). This uncertainty represents poor precision ofthe estimate for all trivial and most small observed differences, because the corre-sponding true differences could be substantially positive or negative. We havetherefore not shown tables of means and standard deviations for males and femaleswithin each sport. Precision of the estimate for moderate or large observed differ-ences between sex and sport subgroups is more acceptable, and any such differencesare reported in the legends of the tables and figures.
Results
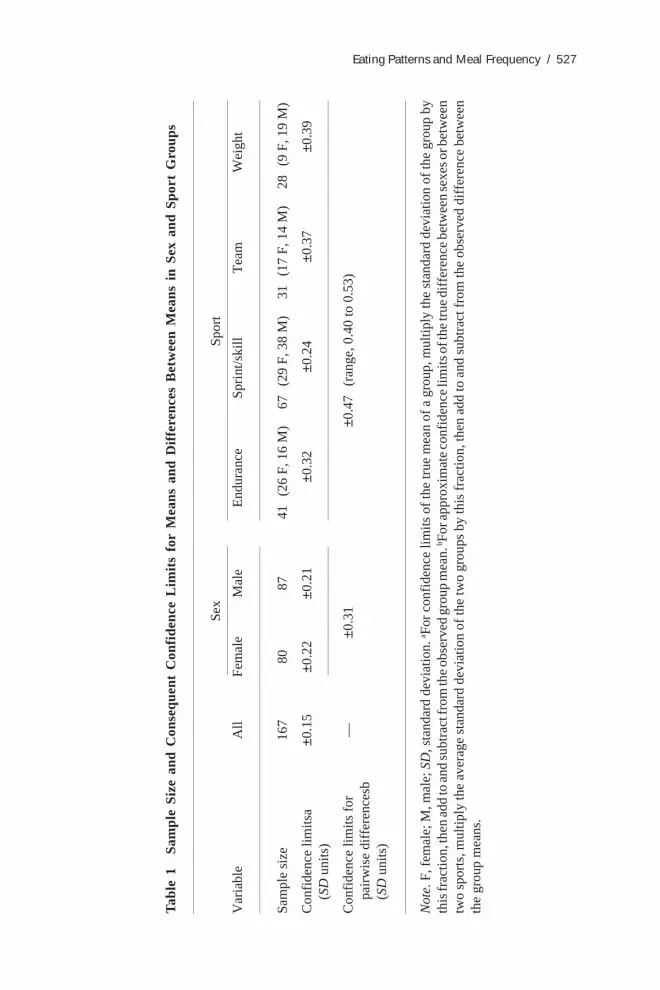
The characteristics of the 167 athletes who completed this dietary survey are sum-marized in Table 2. The average age of the athletes who participated in the study was25 years, with the female WEIGHT athletes younger than the other athletes, reflect-ing the inclusion of female gymnasts whose competitive peak is reached at an earlierage. Typically, athletes reported completing 9–10 individual training sessions perweek during the period of the survey, and eating on five separate occasions each day.Differences between sexes or sporting groups are noted in Table 2.
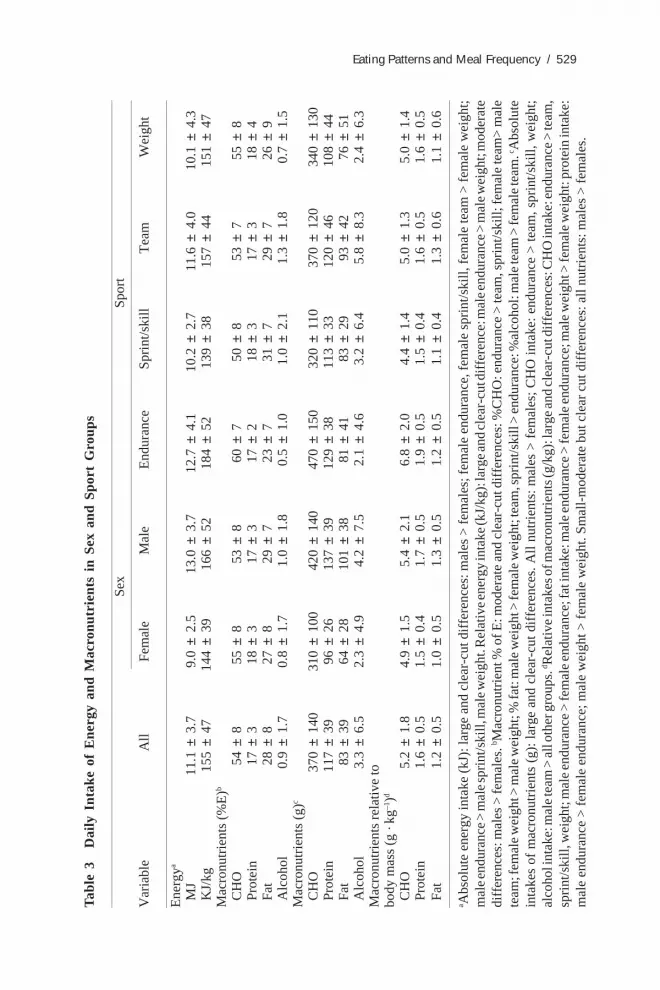
Table 3 summarizes the daily intake of energy and macronutrients reported bythe athletes, noting differences between sexes and sporting groups. The correlationbetween energy intake (MJ/d or kJ/kg/d) and the number of separate eating occa-sions each day was moderate (r = 0.51 for females and r = 0.56 for males).
Eating Patterns and Meal Frequency / 527
Tab
le 1
Sam
ple
Size
and
Con
sequ
ent
Con
fide
nce
Lim
its
for
Mea
ns a
nd D
iffe
renc
es B
etw
een
Mea
ns i
n Se
x an
d Sp
ort
Gro
ups
Sex
Spor
t
Var
iabl
eA
llFe
mal
eM
ale
End
uran
ceSp
rint
/ski
llT
eam
Wei
ght
Sam
ple
size
167
8087
41(2
6 F,
16
M)
67(2
9 F,
38
M)
31(1
7 F,
14
M)
28(9
F, 1
9 M
)
Con
fide
nce
limits
a±0
.15
±0.2
2±0
.21
±0.3
2±0
.24
±0.3
7±0
.39
(SD
uni
ts)
Con
fide
nce
limits
for
—±0
.31
±0.4
7(r
ange
, 0.4
0 to
0.5
3)pa
irw
ise
diff
eren
cesb
(SD
uni
ts)
Not
e. F
, fem
ale;
M, m
ale;
SD
, sta
ndar
d de
viat
ion.
a For
con
fide
nce
limits
of
the
true
mea
n of
a g
roup
, mul
tiply
the
stan
dard
dev
iatio
n of
the
grou
p by
this
frac
tion,
then
add
to a
nd su
btra
ct fr
om th
e ob
serv
ed g
roup
mea
n. b F
or a
ppro
xim
ate
conf
iden
ce li
mits
of t
he tr
ue d
iffe
renc
e be
twee
n se
xes o
r bet
wee
ntw
o sp
orts
, mul
tiply
the
aver
age
stan
dard
dev
iatio
n of
the
two
grou
ps b
y th
is f
ract
ion,
then
add
to a
nd s
ubtr
act f
rom
the
obse
rved
dif
fere
nce
betw
een
the
grou
p m
eans
.
528 / L.M. Burke et al.
Macronutrient intakes reported by athletes were expressed as absolute intakes,intakes relative to BM, and the contribution provided by the macronutrient to totalenergy intake. Typically, the eating patterns reported by both male and femaleathletes provided a macronutrient to energy ratio of 55% CHO, 28% fat, 17%protein, and 1% alcohol.
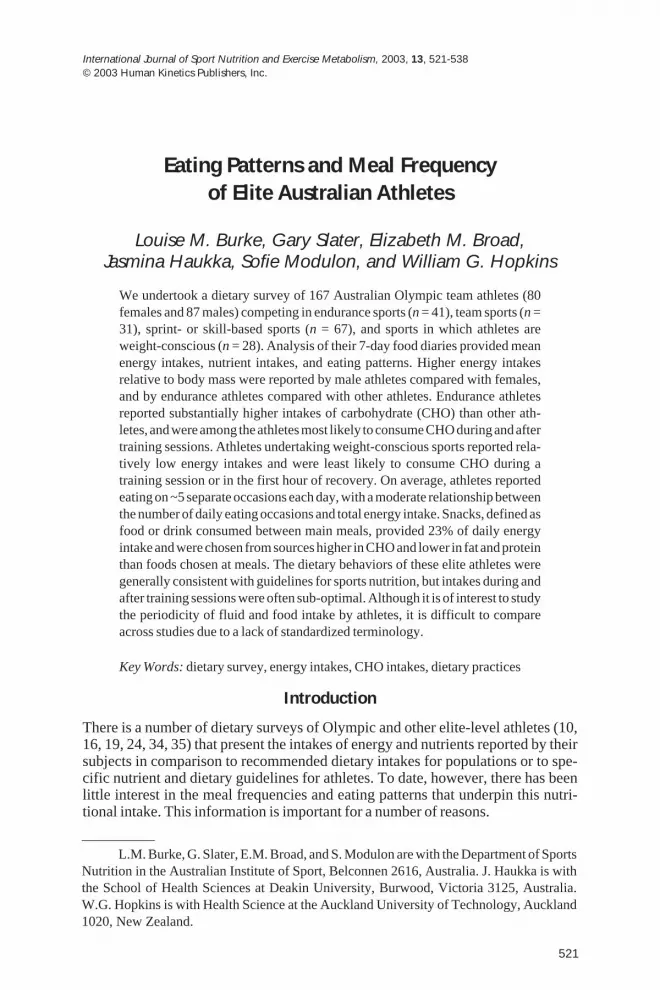
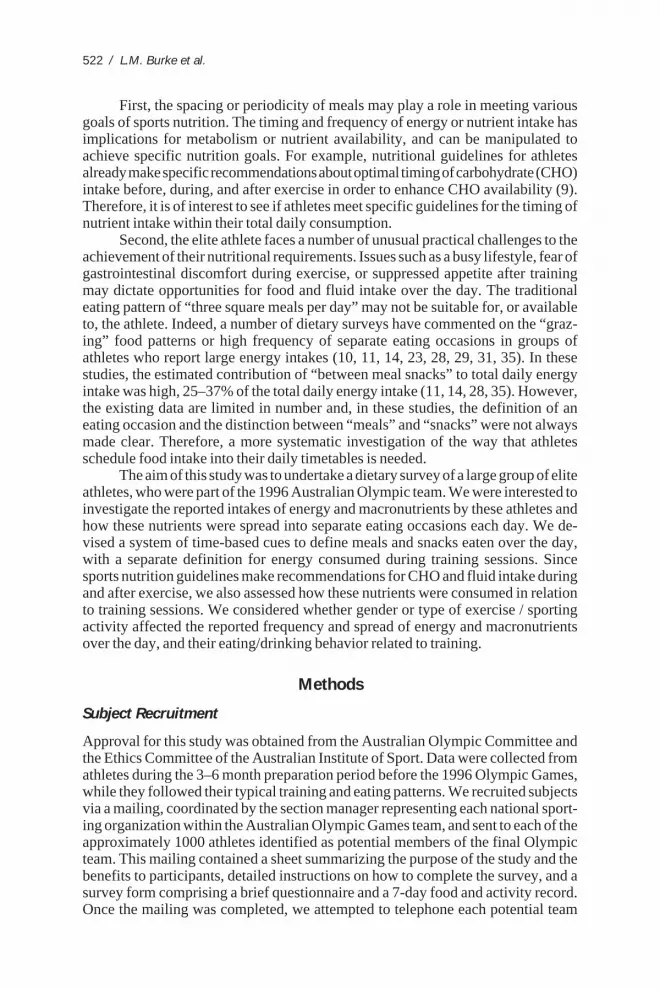
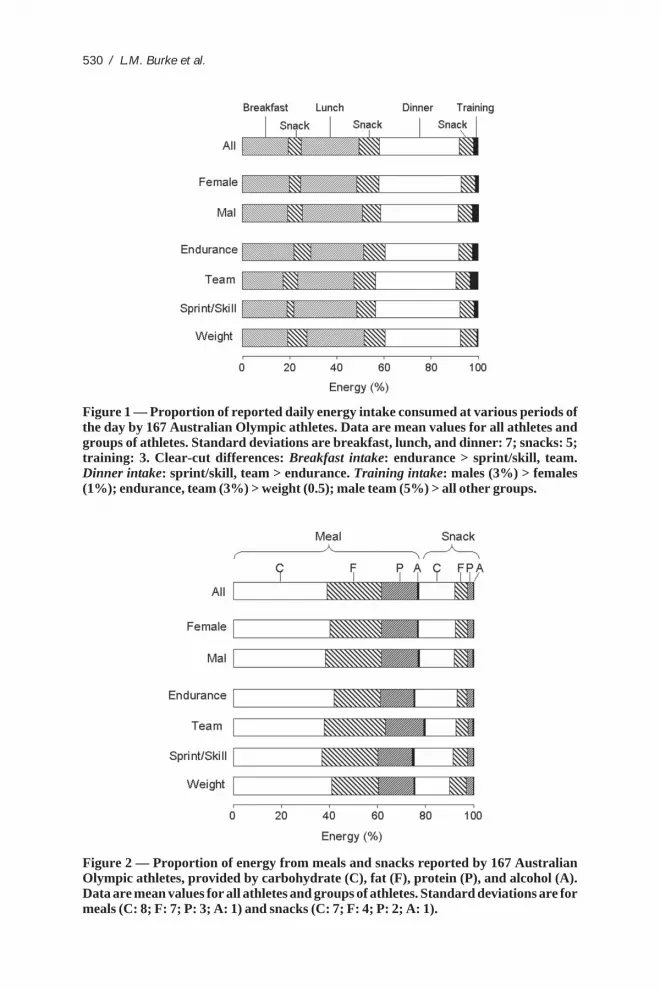
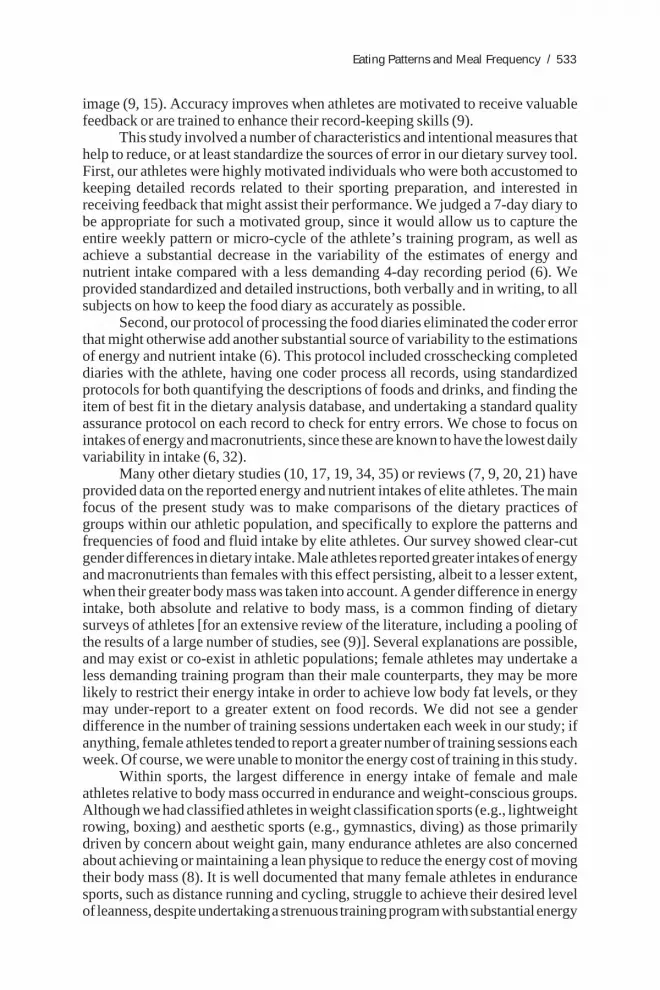
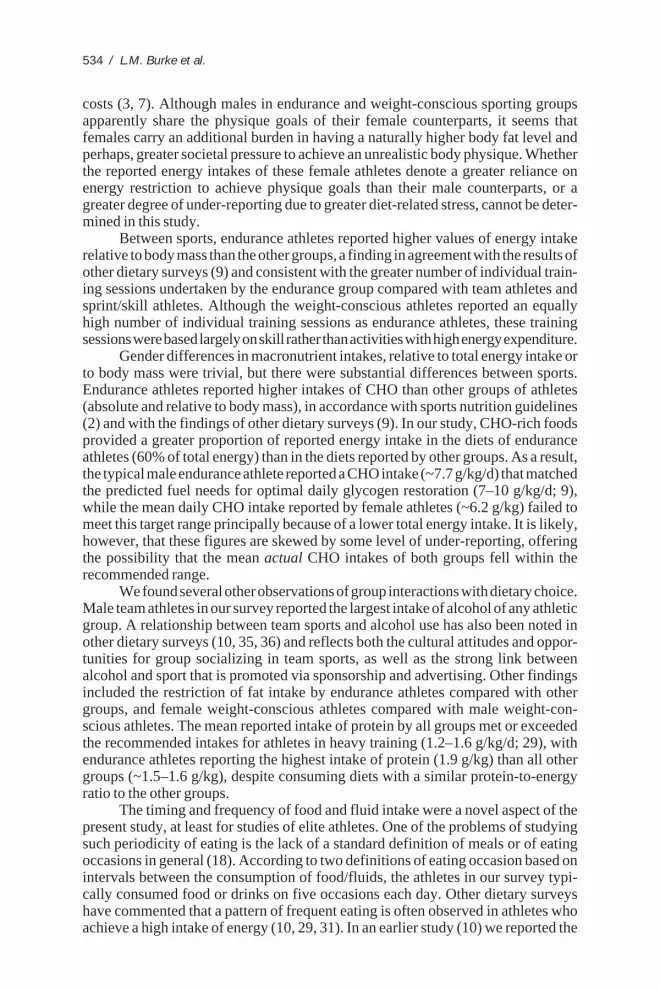
The spread of reported energy intake over various meals and snack times isshown in Figure 1. Overall, the majority of energy was consumed at meals (break-fast: 19% of total reported intake of energy; lunch: 24%; dinner: 34%), with snackscontributing 21% of daily energy intake and 2% of energy being consumed duringtraining sessions. Because of the large variances, differences in the daily spread ofenergy intake between sexes or groups were typically trivial; however, clear-cutdifferences are indicated in Figure 1. Figure 2 shows a comparison of the energy andmacronutrient intake reported from meals and snacks (including training intake).Meals provided most (>70%) of the daily intake of energy, protein, fat, and CHO,and differences in the relative contribution of these eating occasions to nutrientintake between sports or sexes were trivial due to large variances. There appeared tobe large and clear cut differences in the types of foods eaten at meals versus snacks;overall, the foods eaten by athletes at meals provided an energy-to-macronutrientratio of 50% CHO, 20% protein, and 29% fat, whereas the food consumed as snacksprovided an energy-to-macronutrient ratio of 65% CHO, 10% protein, and 22% fat.
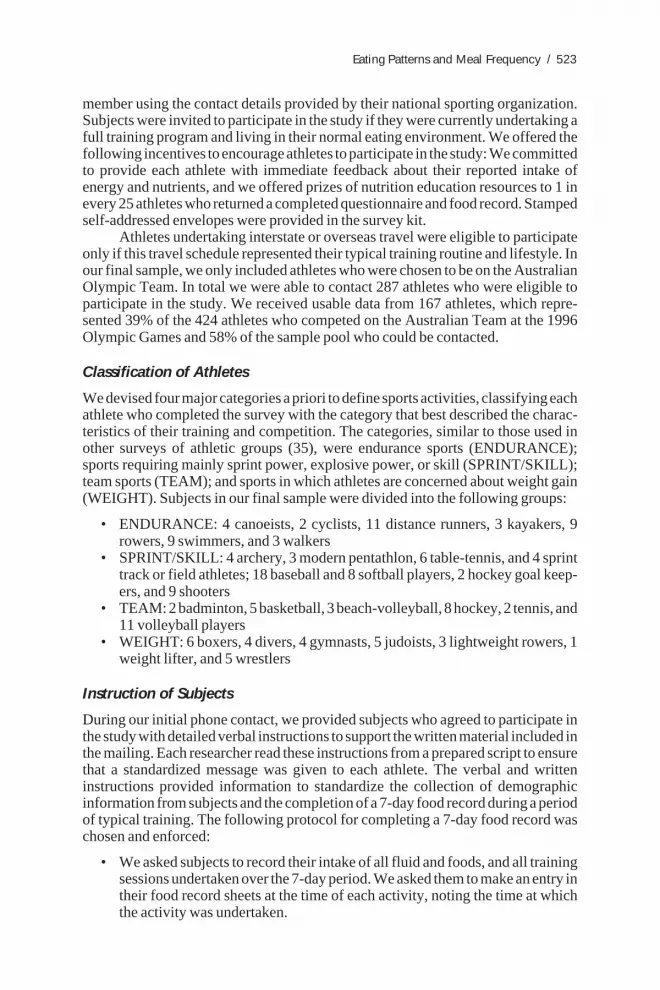
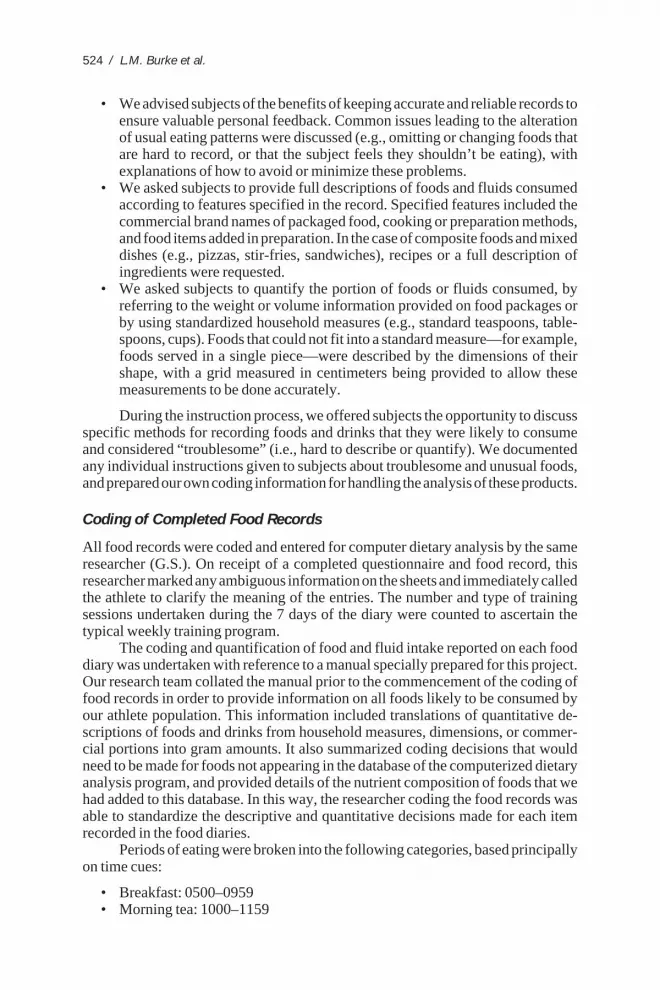
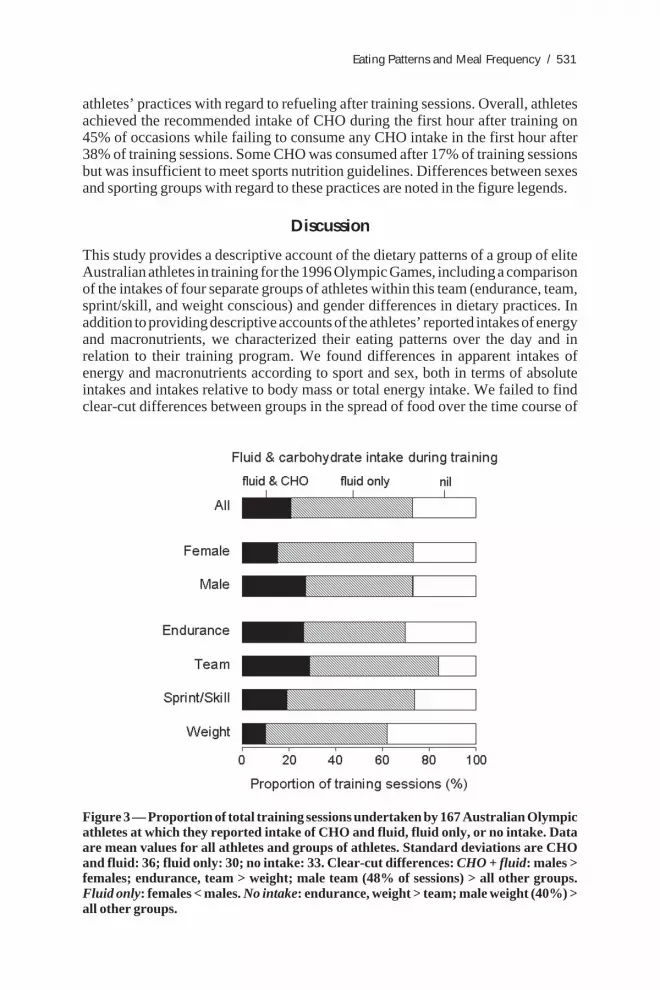
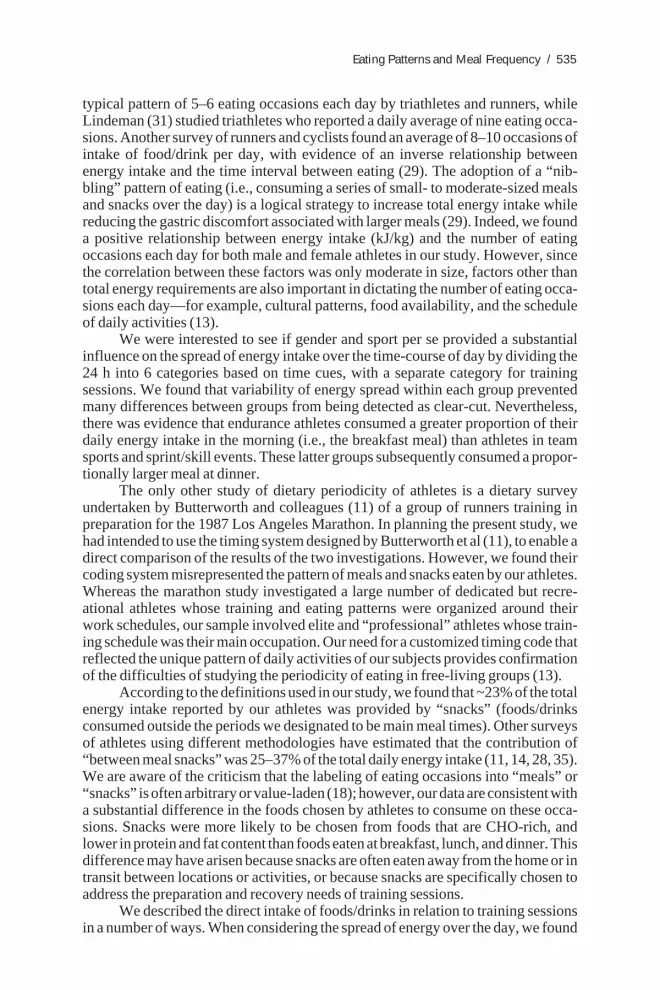
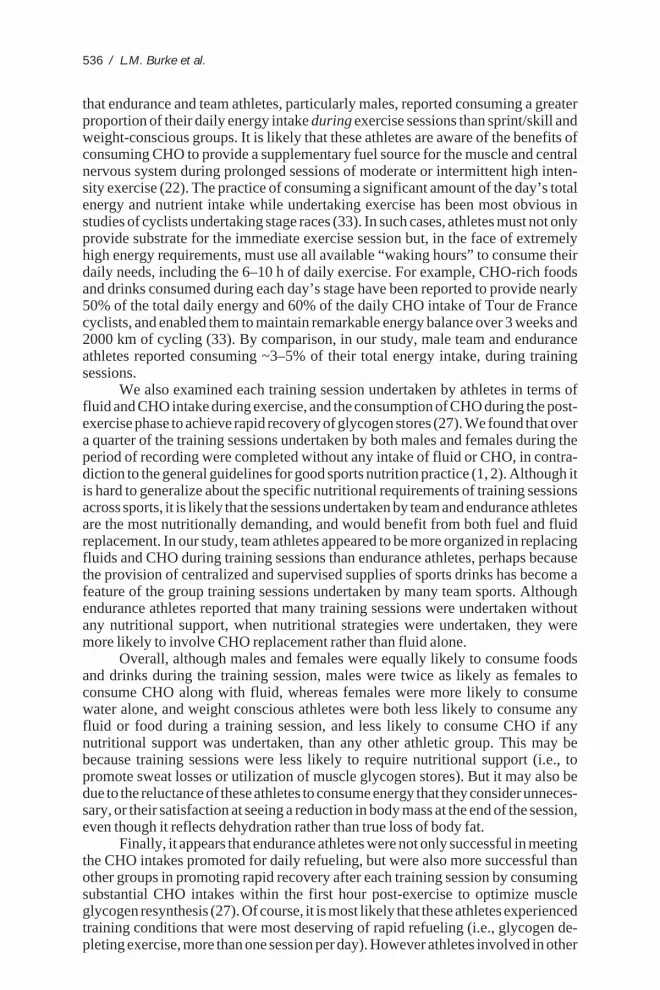
Figure 3 summarizing training nutrition practices, shows that athletes typi-cally consumed fluid during 73% of training sessions, with CHO also being con-sumed at 21% of training sessions. Twenty-seven percent of all training sessionswere reportedly undertaken without any intake of food or fluids. Figure 4 shows
Table 2 Age, Body Mass, Frequency of Training, and Eatingin Sex and Sport Groups
Sex Sport
Sprint/Variable All Female Male Endurance skill Team Weight
aLarge and clear-cut differences in body mass: males > females; female endurance, female sprint/skill,female team > female weight; male team > male sprint/skill > male weight, male endurance. bModerateand cleat-cut differences in training: endurance, weight > team, sprint/skill. cModerate and cleat-cutdifferences in eating occasions: endurance > sprint/skill, weight; female weight < all other groups.
Eating Patterns and Meal Frequency / 529
Tab
le 3
Dai
ly I
ntak
e of
Ene
rgy
and
Mac
ronu
trie
nts
in S
ex a
nd S
port
Gro
ups
Sex
Spor
t
Var
iabl
eA
llFe
mal
eM
ale
End
uran
ceSp
rint
/ski
llT
eam
Wei
ght
Ene
rgya
MJ
11.1
±3.
79.
0±
2.5
13.0
±3.
712
.7±
4.1
10.2
±2.
711
.6±
4.0
10.1
±4.
3 K
J/kg
155
±47
144
±39
166
±52
184
±52
139
±38
157
±44
151
±47
Mac
ronu
trie
nts
(%E
)b
CH
O54
±8
55±
853
±8
60±
750
±8
53±
755
±8
Pro
tein
17±
318
±3
17±
317
±2
18±
317
±3
18±
4 F
at28
±8
27±
829
±7
23±
731
±7
29±
726
±9
Alc
ohol
0.9
±1.
70.
8±
1.7
1.0
±1.
80.
5±
1.0
1.0
±2.
11.
3±
1.8
0.7
±1.
5M
acro
nutr
ient
s (g
)c
CH
O37
0±
140
310
±10
042
0±
140
470
±15
032
0±
110
370
±12
034
0±
130
Pro
tein
117
±39
96±
2613
7±
3912
9±
3811
3±
3312
0±
4610
8±
44 F
at83
±39
64±
2810
1±
3881
±41
83±
2993
±42
76±
51 A
lcoh
ol3.
3±
6.5
2.3
±4.
94.
2±
7.5
2.1
±4.
63.
2±
6.4
5.8
±8.
32.
4±
6.3
Mac
ronu
trie
nts
rela
tive
tobo
dy m
ass
(g ·
kg–1
)d
CH
O5.
2±
1.8
4.9
±1.
55.
4±
2.1
6.8
±2.
04.
4±
1.4
5.0
±1.
35.
0±
1.4
Pro
tein
1.6
±0.
51.
5±
0.4
1.7
±0.
51.
9±
0.5
1.5
±0.
41.
6±
0.5
1.6
±0.
5 F
at1.
2±
0.5
1.0
±0.
51.
3±
0.5
1.2
±0.
51.
1±
0.4
1.3
±0.
61.
1±
0.6
a Abs
olut
e en
ergy
inta
ke (
kJ):
larg
e an
d cl
ear-
cut d
iffe
renc
es: m
ales
> f
emal
es; f
emal
e en
dura
nce,
fem
ale
spri
nt/s
kill,
fem
ale
team
> f
emal
e w
eigh
t;m
ale
endu
ranc
e >
mal
e sp
rint
/ski
ll, m
ale
wei
ght.
Rel
ativ
e en
ergy
inta
ke (k
J/kg
): la
rge
and
clea
r-cu
t dif
fere
nce:
mal
e en
dura
nce
> m
ale
wei
ght;
mod
erat
edi
ffer
ence
s: m
ales
> fe
mal
es. b M
acro
nutr
ient
% o
f E: m
oder
ate
and
clea
r-cu
t dif
fere
nces
: %C
HO
: end
uran
ce >
team
, spr
int/s
kill;
fem
ale
team
> m
ale
team
; fem
ale
wei
ght >
mal
e w
eigh
t; %
fat:
mal
e w
eigh
t > fe
mal
e w
eigh
t; te
am, s
prin
t/ski
ll >
end
uran
ce: %
alco
hol:
mal
e te
am >
fem
ale
team
. c Abs
olut
ein
take
s of
mac
ronu
trie
nts
(g):
lar
ge a
nd c
lear
-cut
dif
fere
nces
. All
nutr
ient
s: m
ales
> f
emal
es;
CH
O i
ntak
e: e
ndur
ance
> t
eam
, spr
int/s
kill,
wei
ght;
alco
hol i
ntak
e: m
ale
team
> a
ll ot
her g
roup
s. d R
elat
ive
inta
kes o
f mac
ronu
trie
nts (
g/kg
): la
rge
and
clea
r-cu
t dif
fere
nces
: CH
O in
take
: end
uran
ce >
team
,sp
rint
/ski
ll, w
eigh
t; m
ale
endu
ranc
e >
fem
ale
endu
ranc
e; fa
t int
ake:
mal
e en
dura
nce
> fe
mal
e en
dura
nce;
mal
e w
eigh
t > fe
mal
e w
eigh
t: pr
otei
n in
take
:m
ale
endu
ranc
e >
fem
ale
endu
ranc
e; m
ale
wei
ght >
fem
ale
wei
ght.
Smal
l-m
oder
ate
but c
lear
cut
dif
fere
nces
: all
nutr
ient
s: m
ales
> f
emal
es.
530 / L.M. Burke et al.
Figure 1 — Proportion of reported daily energy intake consumed at various periods ofthe day by 167 Australian Olympic athletes. Data are mean values for all athletes andgroups of athletes. Standard deviations are breakfast, lunch, and dinner: 7; snacks: 5;training: 3. Clear-cut differences: Breakfast intake: endurance > sprint/skill, team.Dinner intake: sprint/skill, team > endurance. Training intake: males (3%) > females(1%); endurance, team (3%) > weight (0.5); male team (5%) > all other groups.
Figure 2 — Proportion of energy from meals and snacks reported by 167 AustralianOlympic athletes, provided by carbohydrate (C), fat (F), protein (P), and alcohol (A).Data are mean values for all athletes and groups of athletes. Standard deviations are formeals (C: 8; F: 7; P: 3; A: 1) and snacks (C: 7; F: 4; P: 2; A: 1).
Eating Patterns and Meal Frequency / 531
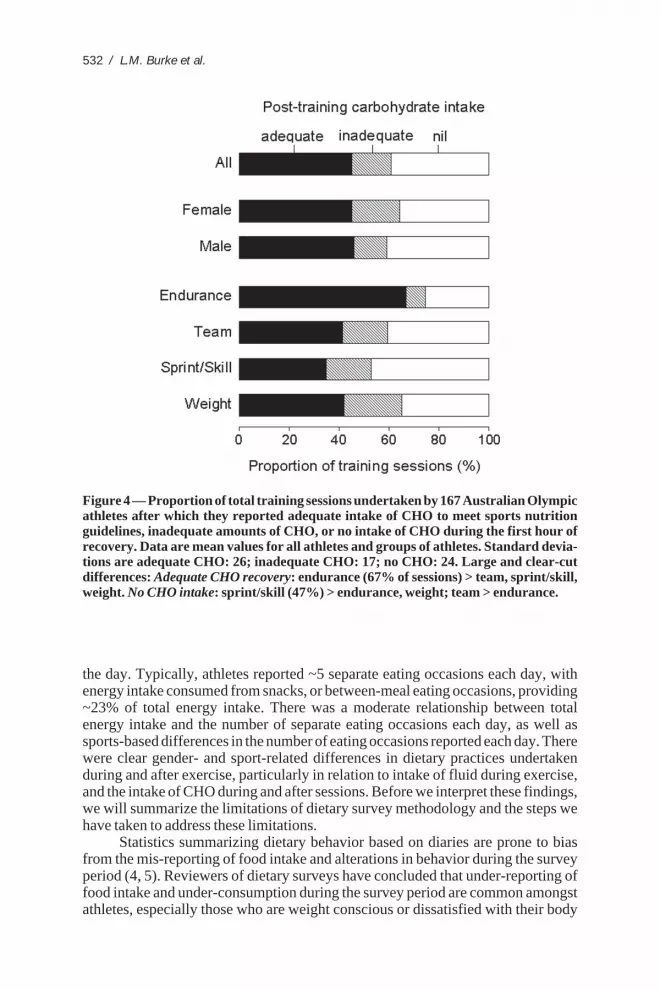
athletes’ practices with regard to refueling after training sessions. Overall, athletesachieved the recommended intake of CHO during the first hour after training on45% of occasions while failing to consume any CHO intake in the first hour after38% of training sessions. Some CHO was consumed after 17% of training sessionsbut was insufficient to meet sports nutrition guidelines. Differences between sexesand sporting groups with regard to these practices are noted in the figure legends.
Discussion
This study provides a descriptive account of the dietary patterns of a group of eliteAustralian athletes in training for the 1996 Olympic Games, including a comparisonof the intakes of four separate groups of athletes within this team (endurance, team,sprint/skill, and weight conscious) and gender differences in dietary practices. Inaddition to providing descriptive accounts of the athletes’ reported intakes of energyand macronutrients, we characterized their eating patterns over the day and inrelation to their training program. We found differences in apparent intakes ofenergy and macronutrients according to sport and sex, both in terms of absoluteintakes and intakes relative to body mass or total energy intake. We failed to findclear-cut differences between groups in the spread of food over the time course of
Figure 3 — Proportion of total training sessions undertaken by 167 Australian Olympicathletes at which they reported intake of CHO and fluid, fluid only, or no intake. Dataare mean values for all athletes and groups of athletes. Standard deviations are CHOand fluid: 36; fluid only: 30; no intake: 33. Clear-cut differences: CHO + fluid: males >females; endurance, team > weight; male team (48% of sessions) > all other groups.Fluid only: females < males. No intake: endurance, weight > team; male weight (40%) >all other groups.
532 / L.M. Burke et al.
the day. Typically, athletes reported ~5 separate eating occasions each day, withenergy intake consumed from snacks, or between-meal eating occasions, providing~23% of total energy intake. There was a moderate relationship between totalenergy intake and the number of separate eating occasions each day, as well assports-based differences in the number of eating occasions reported each day. Therewere clear gender- and sport-related differences in dietary practices undertakenduring and after exercise, particularly in relation to intake of fluid during exercise,and the intake of CHO during and after sessions. Before we interpret these findings,we will summarize the limitations of dietary survey methodology and the steps wehave taken to address these limitations.
Statistics summarizing dietary behavior based on diaries are prone to biasfrom the mis-reporting of food intake and alterations in behavior during the surveyperiod (4, 5). Reviewers of dietary surveys have concluded that under-reporting offood intake and under-consumption during the survey period are common amongstathletes, especially those who are weight conscious or dissatisfied with their body
Figure 4 — Proportion of total training sessions undertaken by 167 Australian Olympicathletes after which they reported adequate intake of CHO to meet sports nutritionguidelines, inadequate amounts of CHO, or no intake of CHO during the first hour ofrecovery. Data are mean values for all athletes and groups of athletes. Standard devia-tions are adequate CHO: 26; inadequate CHO: 17; no CHO: 24. Large and clear-cutdifferences: Adequate CHO recovery: endurance (67% of sessions) > team, sprint/skill,weight. No CHO intake: sprint/skill (47%) > endurance, weight; team > endurance.
Eating Patterns and Meal Frequency / 533
image (9, 15). Accuracy improves when athletes are motivated to receive valuablefeedback or are trained to enhance their record-keeping skills (9).
This study involved a number of characteristics and intentional measures thathelp to reduce, or at least standardize the sources of error in our dietary survey tool.First, our athletes were highly motivated individuals who were both accustomed tokeeping detailed records related to their sporting preparation, and interested inreceiving feedback that might assist their performance. We judged a 7-day diary tobe appropriate for such a motivated group, since it would allow us to capture theentire weekly pattern or micro-cycle of the athlete’s training program, as well asachieve a substantial decrease in the variability of the estimates of energy andnutrient intake compared with a less demanding 4-day recording period (6). Weprovided standardized and detailed instructions, both verbally and in writing, to allsubjects on how to keep the food diary as accurately as possible.
Second, our protocol of processing the food diaries eliminated the coder errorthat might otherwise add another substantial source of variability to the estimationsof energy and nutrient intake (6). This protocol included crosschecking completeddiaries with the athlete, having one coder process all records, using standardizedprotocols for both quantifying the descriptions of foods and drinks, and finding theitem of best fit in the dietary analysis database, and undertaking a standard qualityassurance protocol on each record to check for entry errors. We chose to focus onintakes of energy and macronutrients, since these are known to have the lowest dailyvariability in intake (6, 32).
Many other dietary studies (10, 17, 19, 34, 35) or reviews (7, 9, 20, 21) haveprovided data on the reported energy and nutrient intakes of elite athletes. The mainfocus of the present study was to make comparisons of the dietary practices ofgroups within our athletic population, and specifically to explore the patterns andfrequencies of food and fluid intake by elite athletes. Our survey showed clear-cutgender differences in dietary intake. Male athletes reported greater intakes of energyand macronutrients than females with this effect persisting, albeit to a lesser extent,when their greater body mass was taken into account. A gender difference in energyintake, both absolute and relative to body mass, is a common finding of dietarysurveys of athletes [for an extensive review of the literature, including a pooling ofthe results of a large number of studies, see (9)]. Several explanations are possible,and may exist or co-exist in athletic populations; female athletes may undertake aless demanding training program than their male counterparts, they may be morelikely to restrict their energy intake in order to achieve low body fat levels, or theymay under-report to a greater extent on food records. We did not see a genderdifference in the number of training sessions undertaken each week in our study; ifanything, female athletes tended to report a greater number of training sessions eachweek. Of course, we were unable to monitor the energy cost of training in this study.
Within sports, the largest difference in energy intake of female and maleathletes relative to body mass occurred in endurance and weight-conscious groups.Although we had classified athletes in weight classification sports (e.g., lightweightrowing, boxing) and aesthetic sports (e.g., gymnastics, diving) as those primarilydriven by concern about weight gain, many endurance athletes are also concernedabout achieving or maintaining a lean physique to reduce the energy cost of movingtheir body mass (8). It is well documented that many female athletes in endurancesports, such as distance running and cycling, struggle to achieve their desired levelof leanness, despite undertaking a strenuous training program with substantial energy
534 / L.M. Burke et al.
costs (3, 7). Although males in endurance and weight-conscious sporting groupsapparently share the physique goals of their female counterparts, it seems thatfemales carry an additional burden in having a naturally higher body fat level andperhaps, greater societal pressure to achieve an unrealistic body physique. Whetherthe reported energy intakes of these female athletes denote a greater reliance onenergy restriction to achieve physique goals than their male counterparts, or agreater degree of under-reporting due to greater diet-related stress, cannot be deter-mined in this study.
Between sports, endurance athletes reported higher values of energy intakerelative to body mass than the other groups, a finding in agreement with the results ofother dietary surveys (9) and consistent with the greater number of individual train-ing sessions undertaken by the endurance group compared with team athletes andsprint/skill athletes. Although the weight-conscious athletes reported an equallyhigh number of individual training sessions as endurance athletes, these trainingsessions were based largely on skill rather than activities with high energy expenditure.
Gender differences in macronutrient intakes, relative to total energy intake orto body mass were trivial, but there were substantial differences between sports.Endurance athletes reported higher intakes of CHO than other groups of athletes(absolute and relative to body mass), in accordance with sports nutrition guidelines(2) and with the findings of other dietary surveys (9). In our study, CHO-rich foodsprovided a greater proportion of reported energy intake in the diets of enduranceathletes (60% of total energy) than in the diets reported by other groups. As a result,the typical male endurance athlete reported a CHO intake (~7.7 g/kg/d) that matchedthe predicted fuel needs for optimal daily glycogen restoration (7–10 g/kg/d; 9),while the mean daily CHO intake reported by female athletes (~6.2 g/kg) failed tomeet this target range principally because of a lower total energy intake. It is likely,however, that these figures are skewed by some level of under-reporting, offeringthe possibility that the mean actual CHO intakes of both groups fell within therecommended range.
We found several other observations of group interactions with dietary choice.Male team athletes in our survey reported the largest intake of alcohol of any athleticgroup. A relationship between team sports and alcohol use has also been noted inother dietary surveys (10, 35, 36) and reflects both the cultural attitudes and oppor-tunities for group socializing in team sports, as well as the strong link betweenalcohol and sport that is promoted via sponsorship and advertising. Other findingsincluded the restriction of fat intake by endurance athletes compared with othergroups, and female weight-conscious athletes compared with male weight-con-scious athletes. The mean reported intake of protein by all groups met or exceededthe recommended intakes for athletes in heavy training (1.2–1.6 g/kg/d; 29), withendurance athletes reporting the highest intake of protein (1.9 g/kg) than all othergroups (~1.5–1.6 g/kg), despite consuming diets with a similar protein-to-energyratio to the other groups.
The timing and frequency of food and fluid intake were a novel aspect of thepresent study, at least for studies of elite athletes. One of the problems of studyingsuch periodicity of eating is the lack of a standard definition of meals or of eatingoccasions in general (18). According to two definitions of eating occasion based onintervals between the consumption of food/fluids, the athletes in our survey typi-cally consumed food or drinks on five occasions each day. Other dietary surveyshave commented that a pattern of frequent eating is often observed in athletes whoachieve a high intake of energy (10, 29, 31). In an earlier study (10) we reported the
Eating Patterns and Meal Frequency / 535
typical pattern of 5–6 eating occasions each day by triathletes and runners, whileLindeman (31) studied triathletes who reported a daily average of nine eating occa-sions. Another survey of runners and cyclists found an average of 8–10 occasions ofintake of food/drink per day, with evidence of an inverse relationship betweenenergy intake and the time interval between eating (29). The adoption of a “nib-bling” pattern of eating (i.e., consuming a series of small- to moderate-sized mealsand snacks over the day) is a logical strategy to increase total energy intake whilereducing the gastric discomfort associated with larger meals (29). Indeed, we founda positive relationship between energy intake (kJ/kg) and the number of eatingoccasions each day for both male and female athletes in our study. However, sincethe correlation between these factors was only moderate in size, factors other thantotal energy requirements are also important in dictating the number of eating occa-sions each day—for example, cultural patterns, food availability, and the scheduleof daily activities (13).
We were interested to see if gender and sport per se provided a substantialinfluence on the spread of energy intake over the time-course of day by dividing the24 h into 6 categories based on time cues, with a separate category for trainingsessions. We found that variability of energy spread within each group preventedmany differences between groups from being detected as clear-cut. Nevertheless,there was evidence that endurance athletes consumed a greater proportion of theirdaily energy intake in the morning (i.e., the breakfast meal) than athletes in teamsports and sprint/skill events. These latter groups subsequently consumed a propor-tionally larger meal at dinner.
The only other study of dietary periodicity of athletes is a dietary surveyundertaken by Butterworth and colleagues (11) of a group of runners training inpreparation for the 1987 Los Angeles Marathon. In planning the present study, wehad intended to use the timing system designed by Butterworth et al (11), to enable adirect comparison of the results of the two investigations. However, we found theircoding system misrepresented the pattern of meals and snacks eaten by our athletes.Whereas the marathon study investigated a large number of dedicated but recre-ational athletes whose training and eating patterns were organized around theirwork schedules, our sample involved elite and “professional” athletes whose train-ing schedule was their main occupation. Our need for a customized timing code thatreflected the unique pattern of daily activities of our subjects provides confirmationof the difficulties of studying the periodicity of eating in free-living groups (13).
According to the definitions used in our study, we found that ~23% of the totalenergy intake reported by our athletes was provided by “snacks” (foods/drinksconsumed outside the periods we designated to be main meal times). Other surveysof athletes using different methodologies have estimated that the contribution of“between meal snacks” was 25–37% of the total daily energy intake (11, 14, 28, 35).We are aware of the criticism that the labeling of eating occasions into “meals” or“snacks” is often arbitrary or value-laden (18); however, our data are consistent witha substantial difference in the foods chosen by athletes to consume on these occa-sions. Snacks were more likely to be chosen from foods that are CHO-rich, andlower in protein and fat content than foods eaten at breakfast, lunch, and dinner. Thisdifference may have arisen because snacks are often eaten away from the home or intransit between locations or activities, or because snacks are specifically chosen toaddress the preparation and recovery needs of training sessions.
We described the direct intake of foods/drinks in relation to training sessionsin a number of ways. When considering the spread of energy over the day, we found
536 / L.M. Burke et al.
that endurance and team athletes, particularly males, reported consuming a greaterproportion of their daily energy intake during exercise sessions than sprint/skill andweight-conscious groups. It is likely that these athletes are aware of the benefits ofconsuming CHO to provide a supplementary fuel source for the muscle and centralnervous system during prolonged sessions of moderate or intermittent high inten-sity exercise (22). The practice of consuming a significant amount of the day’s totalenergy and nutrient intake while undertaking exercise has been most obvious instudies of cyclists undertaking stage races (33). In such cases, athletes must not onlyprovide substrate for the immediate exercise session but, in the face of extremelyhigh energy requirements, must use all available “waking hours” to consume theirdaily needs, including the 6–10 h of daily exercise. For example, CHO-rich foodsand drinks consumed during each day’s stage have been reported to provide nearly50% of the total daily energy and 60% of the daily CHO intake of Tour de Francecyclists, and enabled them to maintain remarkable energy balance over 3 weeks and2000 km of cycling (33). By comparison, in our study, male team and enduranceathletes reported consuming ~3–5% of their total energy intake, during trainingsessions.
We also examined each training session undertaken by athletes in terms offluid and CHO intake during exercise, and the consumption of CHO during the post-exercise phase to achieve rapid recovery of glycogen stores (27). We found that overa quarter of the training sessions undertaken by both males and females during theperiod of recording were completed without any intake of fluid or CHO, in contra-diction to the general guidelines for good sports nutrition practice (1, 2). Although itis hard to generalize about the specific nutritional requirements of training sessionsacross sports, it is likely that the sessions undertaken by team and endurance athletesare the most nutritionally demanding, and would benefit from both fuel and fluidreplacement. In our study, team athletes appeared to be more organized in replacingfluids and CHO during training sessions than endurance athletes, perhaps becausethe provision of centralized and supervised supplies of sports drinks has become afeature of the group training sessions undertaken by many team sports. Althoughendurance athletes reported that many training sessions were undertaken withoutany nutritional support, when nutritional strategies were undertaken, they weremore likely to involve CHO replacement rather than fluid alone.
Overall, although males and females were equally likely to consume foodsand drinks during the training session, males were twice as likely as females toconsume CHO along with fluid, whereas females were more likely to consumewater alone, and weight conscious athletes were both less likely to consume anyfluid or food during a training session, and less likely to consume CHO if anynutritional support was undertaken, than any other athletic group. This may bebecause training sessions were less likely to require nutritional support (i.e., topromote sweat losses or utilization of muscle glycogen stores). But it may also bedue to the reluctance of these athletes to consume energy that they consider unneces-sary, or their satisfaction at seeing a reduction in body mass at the end of the session,even though it reflects dehydration rather than true loss of body fat.
Finally, it appears that endurance athletes were not only successful in meetingthe CHO intakes promoted for daily refueling, but were also more successful thanother groups in promoting rapid recovery after each training session by consumingsubstantial CHO intakes within the first hour post-exercise to optimize muscleglycogen resynthesis (27). Of course, it is most likely that these athletes experiencedtraining conditions that were most deserving of rapid refueling (i.e., glycogen de-pleting exercise, more than one session per day). However athletes involved in other
Eating Patterns and Meal Frequency / 537
sporting groups, particularly team sports, may also under training situations that areequally fuel demanding on at least some occasions. Overall, athletes were almostequally spread between achieving CHO intakes for optimal refueling after exercise,and failing to refuel at all during the first hour of recovery, and there were no genderdifferences in attention to this nutrition guideline.
In summary, we found differences in the dietary patterns reported by eliteathletes who were in training for the 1996 Olympic Games, both as a result of genderand type of sporting activity. Although the typical eating patterns of some of thegroups of athletes met many of the literature guidelines for sports nutrition, otherpractices were suboptimal. Although it is difficult to study the periodicity of eating,because of a lack of standardization of methodology, information of this type isinteresting in understanding how athletes can best meet their total energy needs, andpromote fuel availability for training sessions.
References
1. American College of Sports Medicine. Position stand: exercise and fluid replacement.Med. Sci. Sports Exerc. 28:i-vii, 1996.
2. American College of Sports Medicine, American Dietetic Association, and Dietitians ofCanada. Nutrition and athletic performance. Med. Sci. Sports Exerc. 32:2130-2145, 2000.
3. Barr, S.I. Women, nutrition and exercise: a review of athletes’ intakes and a discussion ofenergy balance in active women. Prog. Food Nutr. Sci. 11:307-361, 1987.
4. Bingham, S.A. The dietary assessment of individuals; methods, accuracy, new tech-niques and recommendations. Nutr. Abstr. Rev. 57A:705-742, 1987.
5. Block, G. Human dietary assessment: methods and issues. Preventive Med. 18:653-660,1989.
6. Brakkhuis, A., K. Meredith, G.R. Cox, W.J. Hopkins, and L.M. Burke. Variability inestimation of self-reported dietary intake data from elite athletes resulting from process-ing by different sports dietitians. Int. J. Sport Nutr. Exerc. Metab. 13:152-165, 2003.
7. Burke, L.M. Nutrition for the female athlete. In: Nutrition in Women’s Health, D. Krummeland P Kris-Etherton (Eds.). Maryland: Aspen, 1995, pp. 263-299.
8. Burke, L.M. Sport and body fatness. In: Exercise and Obesity, A.P. Hills and M.L.Wahlqvist (Eds.). London: Smith-Gordon, 1994, pp. 217-231.
9. Burke, L.M., G.R. Cox, N.K. Cummings, and B. Desbrow. Guidelines for daily carbohy-drate intake: do athletes achieve them? Sports Med. 31:267-299, 2001.
10. Burke, L.M., R.A. Gollan, and R.S.D. Read. Dietary intakes and food use of groups ofelite Australian male athletes. Int. J. Sport Nutr. 1:378-394, 1991.
11. Butterworth, D.E., D.C. Nieman, J.V. Butler, and J.L. Herring. Food intake patterns ofmarathon runners. Int. J. Sport Nutr. 4:1-7, 1994.
12. Cohen, J. Statistical power analysis for the behavioral sciences (2nd ed.). New Jersey:Lawrence Erlbaum, 1988.
13. De Castro, J.M. Socio-cultural determinants of meal size and frequency. Br. J. Nutr.77:S39-S55, 1997.
14. De Wijn, J.F., and M. Van Erp-Baart. Foodpattern, body composition and physicalcondition of heavy weight competition rowers. Voeding. 41:13-18, 1980.
15. Deakin, V. Measuring nutritional status of athletes: clinical and research perspectives.In: Clinical Sports Nutrition, L. Burke and V. Deakin (Eds.). Sydney: McGraw-Hill,2000, pp. 30-68.
16. Ferro-Luzzi, A., and A. Venerando. Aims and results of dietary surveys in athletes. In:Nutrition, Physical Fitness and Health, J. Parizkova and V.A. Rogozkin (Eds.). Balti-more: University Park Press, 1978, pp. 145-154.
17. Garcia-Roves, P.M., N. Terrados, S. Fernandez, and A.M. Patterson. Comparison ofdietary intake and eating behaviour of professional road cyclists during training andcompetition. Int. J. Sport Nutr. Exerc. Metab. 10:82-98, 2000.
538 / L.M. Burke et al.
18. Gibney, M.J., and T.M.S. Wolever. Periodicity of eating and human health: presentperspective and future directions. Br. J. Nutr. 77:S3-S5, 1997.
19. Grandjean, A.C. Macronutrient intake of US athletes compared with the general popula-tion and recommendations made for athletes. Am. J. Clin. Nutr. 49:1070-1076, 1989.
20. Grandjean, A.C., K.J. Reimers, and J.S. Ruud. Dietary habits of Olympic athletes. In:Nutrition in Exercise and Sport, I. Wolinsky (Ed.). Boca Raton: CRC Press, 1998, pp.421-430.
21. Grandjean, A.C., and J.S. Ruud. Energy intake of athletes. In: Oxford Textbook of SportsMedicine, M. Harries, C. Williams, W.D. Stanish, and L.J. Micheli (Eds.). New York:Oxford University Press, 1994, pp. 53-65.
22. Hargreaves, M. Metabolic responses to carbohydrate ingestion: effects on exercise per-formance. In: Perspectives in Exercise Science and Sports Medicine, D.R. Lamb and R.Murray (Eds.). Carmel, IN: Cooper, 1999, pp. 93-124.
23. Hawley, J.A., and M.M. Williams. Dietary intakes of age-group swimmers. Br. J. SportsMed. 25:154-158, 1991.
24. Heinemann, L., and H. Zerbes. Physical activity, fitness, and diet: behavior in the popu-lation compared with elite athletes in the GDR. Am. J. Clin. Nutr. 49:1007-1016, 1989.
25. Hopkins, W.G. A scale of magnitudes for effect statistics. In: A New View of Statistics,Sportsci.org: Internet Society for Sport Science, 1997. Accessed at: http://newstats.org/effectmag.html.
26. Hopkins, W.G. Models: important details. In: A New View of Statistics, Sportsci.org:Internet Society for Sport Science, 2001. Accessed at: http://newstats.org/modelsdetail.html#normal.
27. Ivy, J.L., A.L. Katz, C.L. Cutler, W.M. Sherman, and E.F. Coyle. Muscle glycogensynthesis after exercise: effect of time of carbohydrate ingestion. J. Appl. Physiol. 64:1480-1485, 1988.
28. Khoo, C.S., N.E. Rawson, M.L. Robinson, and R.J. Stevenson. Nutrient intake andeating habits of triathletes. Ann. Sports Med. 3:144-150, 1987.
29. Kirsch, K.A., and H. Von Ameln. Feeding patterns of endurance athletes. Eur. J. Appl.Physiol. 47:197-208, 1981.
30. Lemon, P.W.R. Do athletes need more dietary protein and amino acids? Int. J. SportNutr. 5:S39-S61, 1995.
31. Lindeman, A.K. Eating and training habits of triathletes: a balancing act. J. Am. Diet.Assoc. 1990:993-995, 1990.
32. Marr, J.W., and J.A. Heady. Within- and between-person variation in dietary surveys:number of days needed to classify individuals. Hum. Nutr. Appl. Nutr. 40A:347-364,1986.
33. Saris, W.H.M., M.A. Van Erp-Baart, F. Brouns, K.R. Westerterp, and F. Ten Hoor.Study on food intake and energy expenditure during extreme sustained exercise: theTour de France. Int. J. Sports Med. 10:S26-S31, 1989.
34. Sugiura, K., I. Suzuki, and K. Kobayashi. Nutritional intake of elite Japanese track-and-field athletes. Int. J. Sport Nutr. 9:202-212, 1999.
35. Van Erp-Baart, A.M.J., W.H.M. Saris, R.A. Binkhorst, J.A. Vos, and J.W.H. Elvers.Nationwide survey on nutritional habits in elite athletes. Part I: Energy, carbohydrate,protein, and fat intake. Int. J. Sports Med. 10:S3-S10, 1989.
36. Watten, R.G. Sports, physical exercise and use of alcohol. Scand. J. Med. Sci. Sports.5:364-368, 1995.
Acknowledgments
We wish to thank the athletes who participated in this study and acknowledge thesupport of the Australian Olympic Committee and the National Sporting Organizations whogovern sport within Australia.