Direct Payments and Land Rents: Evidence from New Member States Kristine Van Herck 1 and Liesbet Vranken 1,2 1 LICOS - Centre for Institutions and Economic Performance, Department of Economics, K. U. Leuven, Belgium 2 Department of Earth and Environmental Sciences, K. U. Leuven, Belgium [email protected][email protected]Abstract This paper analyses the impact of increasing direct payments on land rents in six new EU member states in which agricultural subsidies largely increased as a result of their EU accession. We find that up to 25 eurocents per additional euro of direct payments is capitalized in land rents. In addition, the results show that capitalization of direct payments is higher in more credit constrained markets, while capitalization of direct payments is lower in countries where more land is used by corporate farms. Keywords: Land rental prices, Farm subsidies, New Member States Selected Paper prepared for presentation at the International Association of Agricultural Economists (IAAE) Triennial Conference, Foz do Iguaçu, Brazil, 18-24 August, 2012. Copyright 2012 by [authors]. All rights reserved. Readers may make verbatim copies of this document for non-commercial purposes by any means, provided that this copyright notice appears on all such copies.
Transcript
Direct Payments and Land Rents:
Evidence from New Member States
Kristine Van Herck
1 and Liesbet Vranken
1,2
1 LICOS - Centre for Institutions and Economic Performance, Department of
Economics, K. U. Leuven, Belgium
2Department of Earth and Environmental Sciences, K. U. Leuven, Belgium
This paper analyses the impact of increasing direct payments on land rents in six new
EU member states in which agricultural subsidies largely increased as a result of their
EU accession. We find that up to 25 eurocents per additional euro of direct payments is
capitalized in land rents. In addition, the results show that capitalization of direct
payments is higher in more credit constrained markets, while capitalization of direct
payments is lower where more land is used by corporate farms.
1. INTRODUCTION
A general purpose of agricultural subsidies is to increase farmers’ incomes.
However, these first-order income objectives are influenced by second-order
adjustments, in particular the impact of subsidies on factor markets. Various studies
have analysed the second-order effects of agricultural policy measures (see e.g. Hertel,
1989; Salhofer, 1996; Dewbre et al., 2001; Alston and James, 2002; Guyomard et al.,
2004; Ciaian and Swinnen, 2006, 2009). In general, these studies find that agricultural
subsidies alter farmers’ production incentives and thus factor demand. An important
second order effect of agricultural policy is its impact on the land market, in particular
on agricultural land prices (among others, Floyd, 1965; Guyomard et al., 2004; Ciaian
and Swinnen, 2006, 2009).
There are two important implications. First, land price increases due to subsidies
reduce the impact of subsidies on agricultural income. This is particularly important in
the EU New Member States (NMS). In 2004, eight Central and Eastern European
countries joined the European Union (EU). This accession round was followed by the
accession of Bulgaria and Romania in 2007. Since EU accession, farm support in the
NMS is implemented through the Common Agricultural Policy (CAP) and in most
countries financial support to farmers largely increased compared to the pre-accession
level. In many NMS land reforms restituted land rights to the former owners who are no
longer active in the agricultural sector (Mathijs and Swinnen, 1998). As a result, a large
share of agricultural land is rented out by these absentee landowners.
Second, an increase of land rents has a direct negative effect on land mobility and
hence an indirect negative effect on farm restructuring. New farmers face a higher initial
investment cost and existing farmers face a higher cost of expansion. Consequently, the
transfer of land from less to more efficient users is reduced which has a negative impact
on structural adjustments in the agricultural sector.
The majority of empirical studies have dealt with the land market in North
America (the US and Canada). A few studies have empirically analysed the impact of
direct payments on land rents in the EU (Patton et al., 2008; Kilian et al., 2008; Ciaian
et al., 2010a; Breustedt and Habbermann, 2011). This paper focuses on a selected
number of EU NMS
To our knowledge there is only one study that analyzes the impact of direct
payments in the NMS. In particular, Ciaian and Kancs (2009) investigate the impact of
the Single Area Payment Scheme (SAPS) in the NMS based on farm level panel data
for the period 2004-2005. However, this study only considers the post-accession period;
while the pre-accession period, when most NMS already started to provide agricultural
support to their farmers, has not been taken into account.
Our paper extends the Ciaian and Kancs (2009) analysis in two ways: (1) we use
country-level data and (2) we study the pre- as well as the post-accession period.1 While
the use of farm level data has obvious advantages, the use of longer series of country
level panel data also has advantages. There are two reasons for using country level data.
First, when using farm-level data there is only limited variation in the main explanatory
variable, the level of direct payments after EU accession, since a substantial share of the
direct payments are Single Area Payments (SAPS), which are in principle uniformly
distributed over all agricultural land in a country. Second, with two-year panel data,
there is only limited variation in the dependent variable, because of the presence of
longer term contracts. The capitalization of the direct payments will only occur when a
new contract is signed by the land owner and the tenant. Hence, one needs longer time
periods to capture these effects.
We estimate the impact of direct payments on land rents. In the NMS,
investigating the effect of agricultural subsidies on land rents is more relevant than
investigating the impact on land values for at least three reasons. First, rental rates are
less affected by urban and other non-agricultural pressures as contracts have only a
limited duration (Whithaker, 2006). Second, in the NMS the number of land rental
transactions is considerably higher than the number of land sales transactions. In the
NMS, the rental market is particularly important to ensure the occurrence of efficiency
enhancing land transfers because there are also substantial costs associated with
enforcing property rights and obtaining the necessary documents from local officials
required for land sales next to the usual costs associated with land transactions, such as
notary fees, taxes and administrative charges (Swinnen and Vranken, 2009; 2010).
1 The disadvantage of including both pre- and post-accession data is that we are not able to disentangle the impact of
different types of direct payments (coupled vs. decoupled), since these disaggregate subsidy data are – to our
knowledge - not available for the pre-accession period.
Finally, rental rates are observed in the market while land value is often stated by the
owner - because the limited number of sales transactions- and therefore subjective
(Whithaker, 2006).
The remainder of the paper is as follows. In the next section, we briefly discuss
the development of rental land markets in the NMS. We give a short overview on the
agricultural policy and in particular on the use of direct payments in the NMS. The third
section gives an overview of the existing literature on the impact of agricultural policy
measures on land rents. In section 4, we empirically test the impact of direct payments
on land rents in selected NMS. Finally, we conclude in section 5.
2. RENTAL LAND MARKETS AND DIRECT PAYMENTS IN NMS
In this section we briefly review rural land markets and agricultural policy in the
NMS before and after EU accession.
2.1. Rental land markets
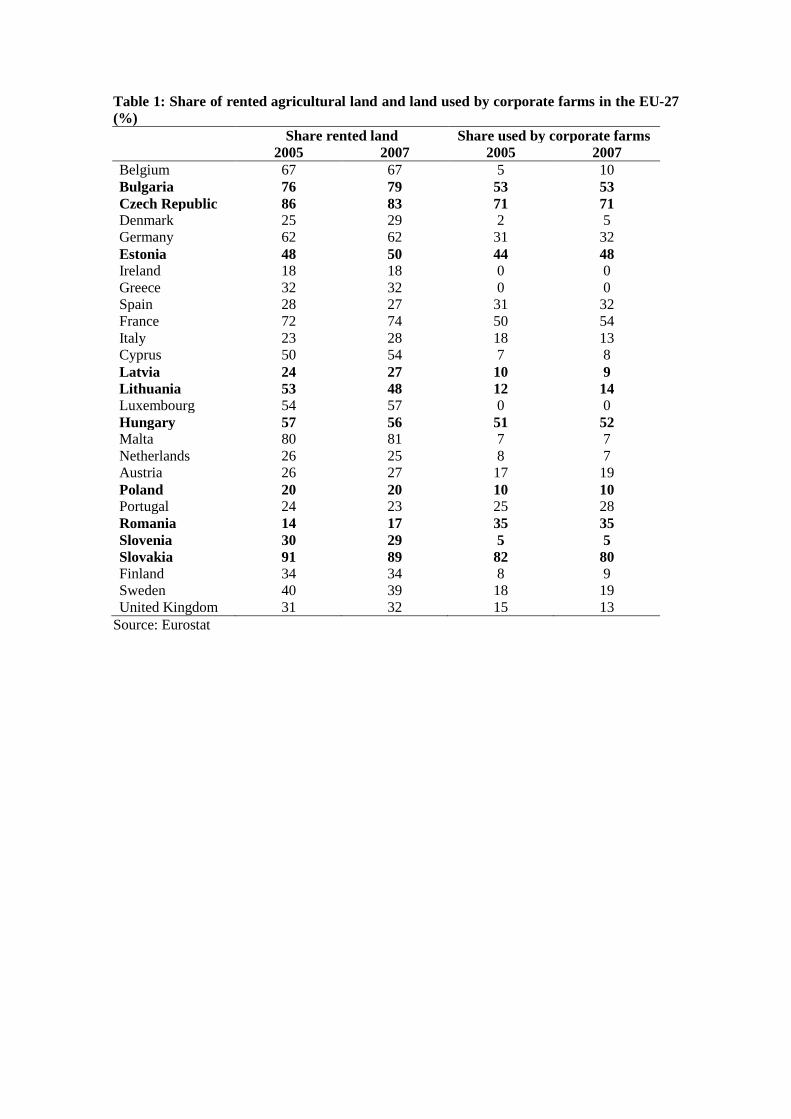
Similar to the US and several EU15 countries, a large amount of the land
transactions in the NMS takes place through the rental market, although there are large
variations among countries (Table 1). In Slovakia and the Czech Republic, more than
80% of the cultivated area is rented. Also in Bulgaria, land renting is very prominent
(79% of total land). In Hungary, Estonia and Lithuania, between 48% and 56% of the
cultivated area is rented. In Latvia, Poland and Romania, the figures are lower,
respectively 27%, 20% and 17%.
There is a striking correlation between the prevalence of land rental at the country
level and the proportion of corporate farms in total land use (Swinnen et al., 2006).
While corporate farms own little land, they use a lot of land in some countries, almost
all of which is rented. In the Czech Republic and Slovakia, more than 70% of the total
agricultural land area is used by corporate farms (Table 1). Also in Hungary, Estonia
and Bulgaria, corporate farms still use around half of all agricultural land. A large share
of agricultural land is still rented to the large scale successor organisations of the former
cooperatives and state farms (Vranken et al., 2011). This can be attributed to the land
reform process that was implemented at the start of transition. Land was restituted to
former owners out of which the majority are not (or no longer) active in agriculture.
They may be retired or living in urban areas and are more likely to rent it out, in
particularly to large scale corporate farms and this for several reasons. First, because of
limited information about the sales price and the expected increase in land prices upon
accession to the European Union, most of these new landowners were unwilling to sell
their newly acquired assets and preferred to rent it out instead. Second, since identifying
potential tenants involves search and negotiation costs, the easiest way for the new
landowners was to rent out their land to the corporate farms, which were the historical
users of the land (Mathijs and Swinnen, 1998). Third, the corporate management was
closely involved in the land reform process and their search and negotiate costs to
identify and contract with those new owners were significantly lower than the costs
faced by newly emerging structures (particularly family farms and de novo companies).
In combination, these factors resulted in a higher demand for rented land by corporate
farms than by family farms and an increased supply of rented land to corporate farms
than to family farms. As a result, restitution has contributed to a consolidation of the
large scale farming structures (collective and state farms in the past, now corporate
farms) through the land rental market.
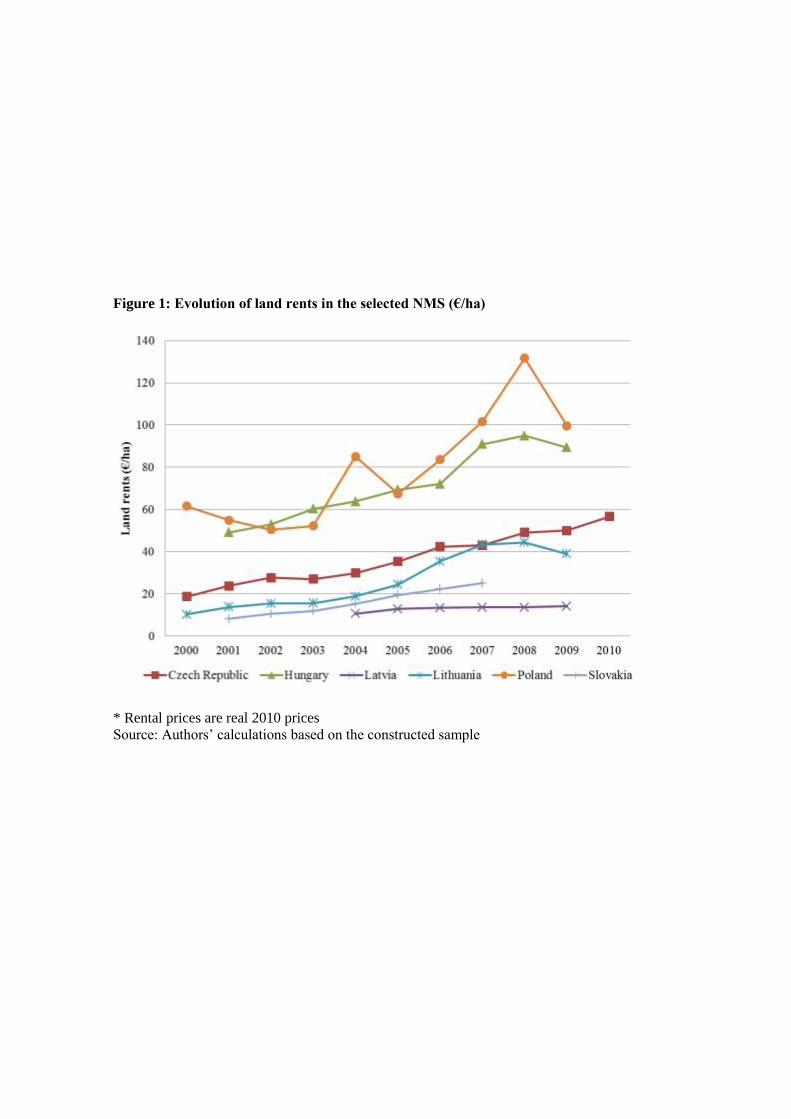
In the period 2000-2008, a strong and persistent increase in land rental prices is
observed in all NMS and the increase was especially strong around the period of EU
accession. For example, if one compares rental prices from just before (2003) to just
after accession (2006), real land rental prices grew with more than 20% in the Czech
Republic, Lithuania, Hungary, Poland and Slovakia (Figure 1). This large increase in
land rents correlates with an increase in direct payments in the same period indicating
that at least a part of the direct payments are capitalized in the land rent (Figure 2).
2.2. Agricultural policy
At the beginning of the 1990s, after the transition to a more market orientated
economy, agricultural support dramatically reduced in all Central and Eastern European
countries. However, when the economic and institutional climate started to improve at
the end of the 1990s, agricultural support started to increase again. Later, when the
countries accessed the EU agricultural support increased even further.
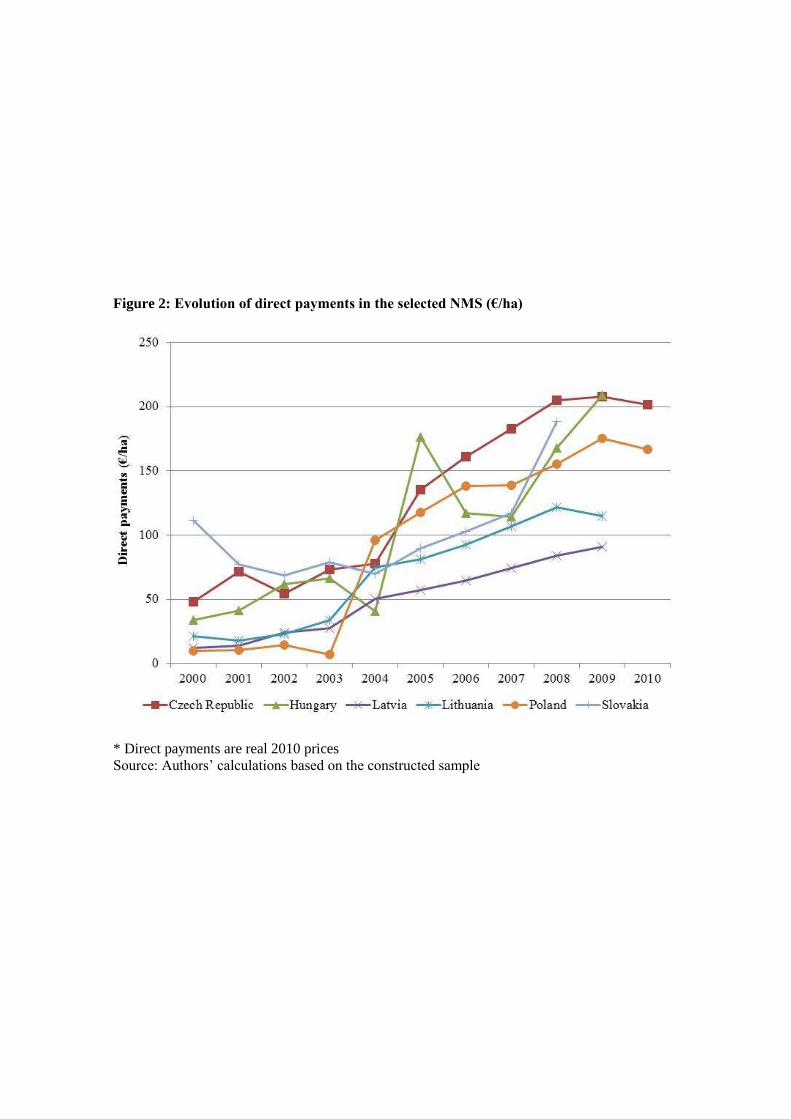
There are several distinct types of support measures. First, governments can make
payments directly to producers, so-called “direct payments”. Figure 2 illustrates the
strong increase in direct payments in a selected number of NMS in the period 2000-
2010.
Before EU accession, agricultural policy in the selected NMS, included a wide
variety of direct payments. For example, in Poland there were output payments for crop
production such as bread cereals (payment/tonne) and in the Czech Republic and
Slovakia there were payments for livestock production such as for sheep, beef or milk
production (payment per head or per litre). In addition, there existed in all countries area
payments, which are payments based on the cultivated area (payment/ha). For example
for flax in the Czech Republic or for arable land in Slovakia.
After EU accession, there were two main types of direct payments depending on
the source of the subsidy. First, there is the Single Area Payment Scheme (SAPS),
which is financed by the EU budget. SAPS payments are fixed payments per ha, which
are decoupled from production and, in principle, uniform for all eligible land within
each NMS.2 SAPS payments are gradually implemented and they will reach the EU-15
level in 2013. Second, the NMS were allowed to supplement the SAPS payments by
national “top-up” payments (or Complementary National Direct Payments (CNDPs)).
These “top-up” payments can be implemented in a similar way as SAPS, namely as a
fixed payment per ha, such as for example in Slovakia for arable crops. However, the
NMS can also decide to couple the support to a specific production and provide
payments per ha or per animal head for a specific production such as for example the
per-hectare payment for hops in Slovakia or the suckler cow premium in Hungary.
In addition to direct payments, governments can also use specific instruments,
such as quota, tariffs and intervention buying to support farmers’ income. These
instruments create a gap between the domestic producer price and the world market
price of a specific agricultural commodity and are referred to as market price support
(MPS). Before EU accession, the NMS implemented quota, tariffs and intervention
buying, to protect their agricultural markets. After EU accession, the NMS were
integrated in the common EU market and MPS was implemented in the same way as in
the EU15, such that for the same commodity all EU farmers receive in principle the
same level of support (single market principle). This implies that after EU accession the
amount of MPS in a country fully depends on its production structure. The dairy sector
is for example traditionally more protected than fruit and vegetables producers.
2 However, there are substantial differences between the NMS. These variations stem from the fact that the level of
per hectare payments is computed by dividing the available EU financial “envelope” for each country by the eligible
agricultural area. The EU rules for the determination of the CAP Pillar I financial allocations imply that higher land
productivity results in higher hectare payments, as historical yield levels (2000-2002) were factored into the
determination of the financial envelope for Pillar I. There was a large variety in the reference yield of the different
NMS which results in a disparity in the direct payments.
3. CONCEPTUAL MODEL
3.1. Support measures and capitalization
Various studies analysed how land markets were affected by agricultural policy
measures that have been implemented to support farmers’ income in developed
countries (e.g. Floyd 1965; Goodwin and Ortalo-Magné, 1992; Lence and Mishra, 2003;
Kirwan, 2005; Ciaian and Swinnen ,2006, 2009).
Capitalization of agricultural subsidies in land rents depends on the type of
support. Ciaian et al. (2010b) analyse the impact of different forms of coupled direct
payments on land markets. They develop a partial equilibrium model, which combines
two inputs (land and a non-land input) in a production function of one agricultural
output.3
According to Ciaian et al. (2010b), output payments increase the price of a factor
if the supply elasticity of that factor is not perfectly elastic. A given percentage increase
in product price will result in the same percentage rise in all factor prices if the factors
are perfect substitutes in production or if the supply elasticities of the two factors are the
same. If the factor supply elasticities are not equal, the price of the input with the least
elastic supply will increase more. Hence, the impact of output payments on land rents
depends largely upon the factor supply and substitution elasticities. In fact, in case the
factor supply is entirely inelastic and the elasticity of substitution between factors is
zero or the factor proportions are fixed, the output payment will be fully capitalized in
the price of the factor with inelastic supply. If this factor is land, which is often the case,
then the output payment will be fully capitalized in land rents.
Area payments, which are targeted on land, stimulate farm land demand and in
combination with inelastic land supply, these payments are capitalized into higher land
3 They based their model on the model of Floyd (1965), who analyzes the effects farm price supports on the returns to
land in agriculture.
rents, creating leakages of policy rents to landowners. In a corner solution, when the
land supply is fixed, the land subsidy is fully capitalized into land rents (Ciaian et al.,
2010b).
In summary, in case land is the most inelastic production factor, both output and
area payments are expected to be capitalized in land rents and the price of land will
increase relative to the price of the other factors. In case the land supply elasticity is
equal to zero (or land supply is fixed) area payments will be fully capitalized in land
rents. Output payments are only fully capitalized in land rents if, additionally to zero
land supply elasticity, either the supply elasticity of non-land inputs is perfectly elastic
or if factor proportions are fixed.
In addition to the type of subsidy, the capitalization of subsidies also depends
upon the exact policy implementation. If subsidies are only implemented for a limited
period of time, they may not be capitalized in the land value. Also the criteria
determining the eligibility to receive the future stream of policy transfers, may limit the
capitalization of subsidies (Sumner and Wolf, 1996; Ciaian and Swinnen, 2006, 2009;
Kilian and Salhofer, 2008). For example, area payments may be subjected to cross-
compliance, set-aside, or other requirements. If area payments are subjected to cross-
compliance, then their effect on land rents is (partially) mitigated due to the fact that
farmers have to incur certain costs in order to meet the eligibility criteria.
Almost all available studies on the capitalization of land rent use US data.4
However, recently the number of studies analysing the impact of CAP payments on land
rents increased.
4 Using US-county level data from the state Iowa, Lence and Mishra (2003) examine the impact of government
payments on cash rents using county-level panel data for 1996-2000. Unlike most other studies on land values and
rents, Lence and Mishra control for spatial autocorrelation and they find an increase in land rents of $0.13 per acre for
each additional dollar of government payments. Roberts et al. (2003) use 1992 and 1997 farm-level panel data from
the US Census of Agriculture. They find that an increase in cash land rents of between $0.34 and $0.41 per acre for
Patton et al. (2008) analyse the impact of both coupled (output) and decoupled
(area and single farm) direct payments on land rents in Northern Ireland covering the
period 1994 to 2002. They find that the impact of CAP direct payments on rental values
depends on the type of payment and on the nature of the production characteristics of
the associated agricultural commodity. Also in the EU, Kilian et al. (2008) analyses
capitalization of direct payments in land rental prices in 2005 in Bavaria (region in
Germany). They find that one additional euro of direct payments increases rental prices
by 28 to 78 eurocents. Additionally, they evaluate the effect of decoupling support and
they find an increase in the capitalization ratio due to decoupling and an additional 15 to
19 eurocents are capitalized into land rents.
Ciaian and Kancs (2009) investigate the impact of the Single Area Payment
Scheme (SAPS) in the NMS based on farm level panel data of the period 2004-2005.
They find that almost 20% of the SAPS payment is capitalized in land rents. In a related
study, Ciaian et al. (2010a) analyse the income distributional effects of the CAP for
farmers and landowners, using farm level panel data for the period 1995-2007 in
selected member states. Their results do not confirm the theoretical hypothesis that
landowners benefit from a large share of the CAP subsidies. According to their
estimates, farmers gain between 60% to 95%, 80% to 178% and 86% to 90% of the
total value of coupled crop/animal, coupled RDP and decoupled payments, respectively.
They find that CAP subsidies are only marginally capitalized in land rents, although the
effects depend on the type of payment.
Finally, Breustedt and Habermann (2011) analyse the impact of direct payments
on land rents in Germany in 2001 by estimating a general spatial model to account for
each additional dollar of government payments. Using the same data, Kirwan (2005) finds in a related study that
landowners capture on average between $0.20 and $0.40 of the marginal per acre subsidy dollar depending on the
region and farm size.
both spatial relationships among rental prices of neighboring farmers and spatially
autocorrelated error terms. They find that the marginal incidence of EU direct payment
on land rents amounts to 38 eurocents for each additional euro of direct payments.
3.2. Market Imperfections, Land Institutions and Regulations
In addition to the magnitude and type of the agricultural subsidy measure, the
capitalization of agricultural subsidies will also be affected by market imperfections in
in- and output markets as well as by the land institutions and rental regulation in place
(see for example, Chau and de Gorter, 2005; Hennessy, 1998; Latruffe and Mouël,
2009).
First, at the end of 1990s, credit market imperfections (including credit and
technology) were major limitations on the functioning of land markets in the NMS
(Petrick, 2004). At the end of the 1990s and especially in the beginning of the 2000s,
under the impulse of the prospect of EU accession and economic growth, market
imperfections started to decrease. This resulted in increased investments in agriculture
and in an increase in farm productivity which in turn led to a rise in the demand for land
in the NMS. Furthermore, foreign and domestic investment in the food industry and
agribusiness were stimulated with major positive vertical spillovers on farms. With EU
accession direct payments started to increase which had a positive impact on farmers’
investments by reducing their credit constraints (Latruffe et al., 2010). Ciaian and
Swinnen (2009) develop a theoretical model in which they analyse the impact of credit
market constraints on capitalization of area payments in land rents. They find that, in the
presence of credit market imperfections, area payments increased land rents by more
than the payment.
Second, several studies document that land markets in the transition countries,
even the most advanced such as in the NMS, are still characterized by the existence of
significant transaction costs in the rural land markets. Transaction costs affect the
development of land markets as they constrain access to land for rural households
willing to start up or enlarge their farm and reinforce the persistence and dominance of
large scale corporate farms (Ciaian and Swinnen, 2006). As a consequence rental prices
for land rented by corporate farms is often much lower than that rented by individual
farms due to the combination of imperfect competition and transaction costs. In the
Czech Republic and Slovakia land rents paid by corporate farms are generally much
lower: they vary between 50% and 20% of the rents paid by family farms (Swinnen et
al., 2006). In addition, corporate farms rely on in kind rental payments which are
typically less transparent. They often depend on yields, which are difficult to control by
the landowners, and may result in lower effective rent payments. As a consequence, the
capitalization of agricultural subsidies is expected be lower when the share of corporate
farms in agricultural land use is higher
Finally, also land market institutions and regulations may affect capitalization of
payment in land rental rents. The most obvious case of how regulation is affecting the
land market is the case where rental payments are regulated by the government such as
it is for example the case in Belgium or France (Ciaian et al., 2010b).
4. ECONOMETRIC ANALYSIS
4.1. Empirical model and variables
The sample used in the empirical analysis includes 6 NMS: the Czech Republic,
Poland, Slovakia, Hungary, Lithuania and Latvia. We use yearly data from 1997 to
2009 for the Czech Republic, from 1994 to 2009 for Poland, from 2001 to 2007 for
Slovakia, from 2001 to 2009 for Hungary, from 2000 to 2009 for Lithuania and finally
from 2004 to 2009 for Latvia. This results in an unbalanced panel data set with 61
observations.
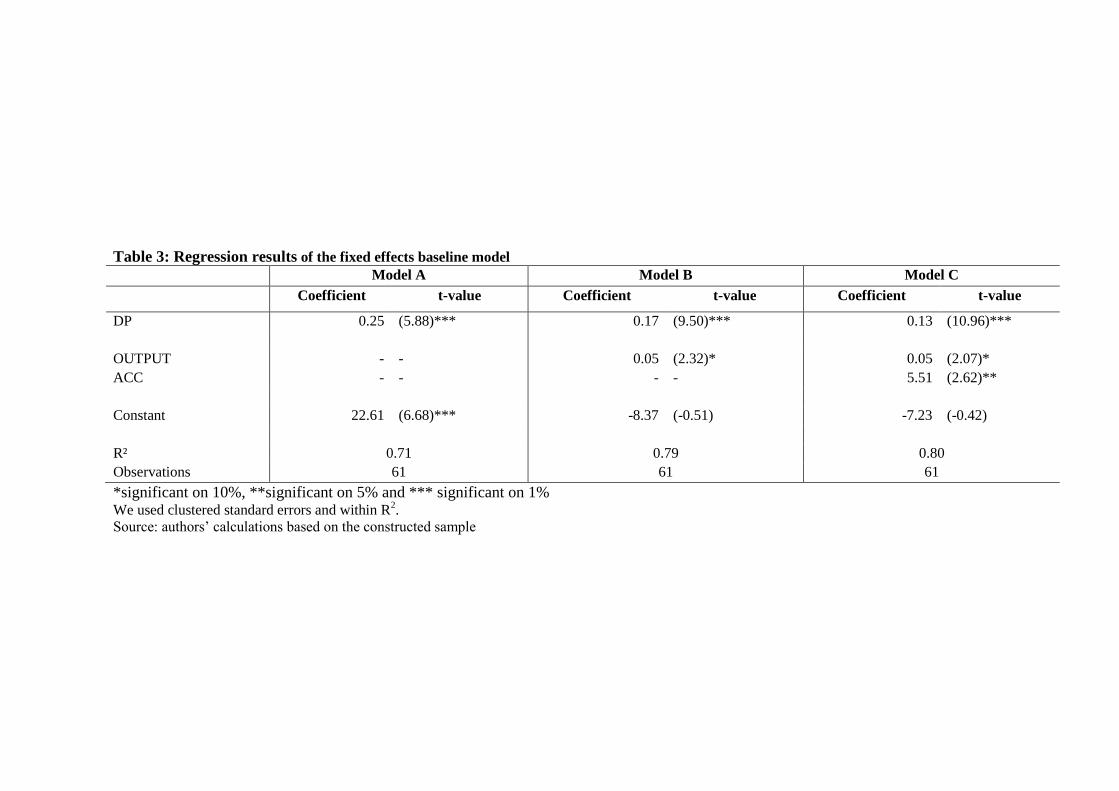
4.1.1 Baseline model
To econometrically quantify the effect of direct payments on land rents, we
estimate the following baseline model:
tiitititiit ACCaOUTPUTaDPaaRENTS ,,3,2,10 (1)
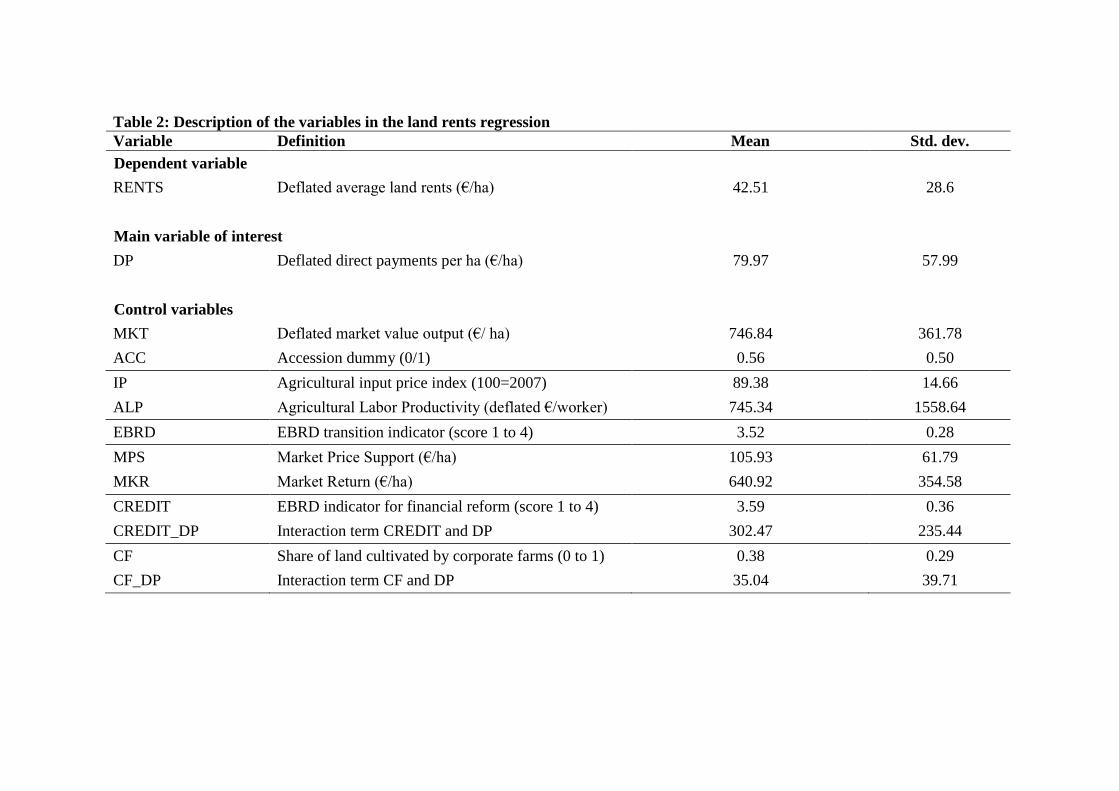
where the dependent variable RENTSit represent the average rental price of
agricultural land in country i in year t. RENTSi,t, is defined as the deflated country
average land rental price in euros and data are obtained from national statistics.5
First, the main variable of interest is the deflated average level of direct payments
per ha expressed in euros (DPi,t). Due to data limitations, we aggregated output and area
payments, although it is possible that the effect differs between the two types of
subsidies.6 Before EU accession, DPi,t are obtained from OECD and are calculated as
the sum of the OECD support categories “Payments based on output” and “Payments
based on area planted/ number of animals” divided by the total utilized agricultural area
as obtained from Eurostat. After EU accession, DPi,t are calculated as the sum of SAPS
payments and national “top up” payments based on national statistics7, divided by the
total utilized agricultural area as obtained from Eurostat. Given the theoretical evidence
5 VUZE for Czech Republic, GUS, ANR and Zagorski for Poland; VUEPP for Slovakia; the Central Statistical
Office for Hungary; Lithuanian Institute of Agricultural Economics and the State Enterprise Centre of Agricultural
Information and Rural Business; FADN for Latvia. 6 See theoretical insights presented in section 3. 7 Green Report (Ministry of Agriculture) for Czech Republic; ARiMR and ARR for Poland; Green Report (Ministry
of Agriculture) for Slovakia; Payment Agency for Hungary; the Lithuanian Institute of Agrarian Economics for
Lithuania; Rural Support Service for Latvia.
of the capitalization of direct payments (see section 3), we expect a positive coefficient
of the DPi,t variable.
Second, to capture the effect of market returns on land rents, we include the
variable OUTPUTi,t which is the deflated agricultural output value per hectare,
expressed in euros and based on data obtained from Eurostat. We expect a positive
correlation between land rents and agricultural output value per hectare.
Third, EU accession is expected to affect land markets directly by freeing them
and integrating them into a single EU market. Indirectly, EU accession will also affect
land markets as it improved the functioning of other factor markets (including credit and
technology) and stimulated foreign and direct investments in the food industry and
agribusiness, with sizeable spillovers on farming. In order to control for these effects,
we include a dummy variable ACCi,t which equals one from the year of accession
(2004) onwards and zero otherwise.8
Finally, we also include country fixed effects (δi) in order to control for
unobserved heterogeneity that remains fixed over time. Since both coupled and
decoupled direct payments are based on regional productivity levels, there is an
unobserved country level effect for which we control by relying an a fixed effects
estimation such that direct payments are exogenous within the country, but endogenous
between the different NMS.9
8 The variable ACC is expected to be correlated with the variables DP and OUTPUT. In addition to the full baseline
model, we also estimated a restricted model in which we exclude the ACC variable in order to test for the robustness
of our coefficients. 9 In addition to regional productivity, coupled direct payments also depend on the individual production choice of the
farmer. However, on a country level we believe that the production structure is relatively stable over the time period
that we consider, such that including country fixed effects eliminates a large share of the endogeneity bias.
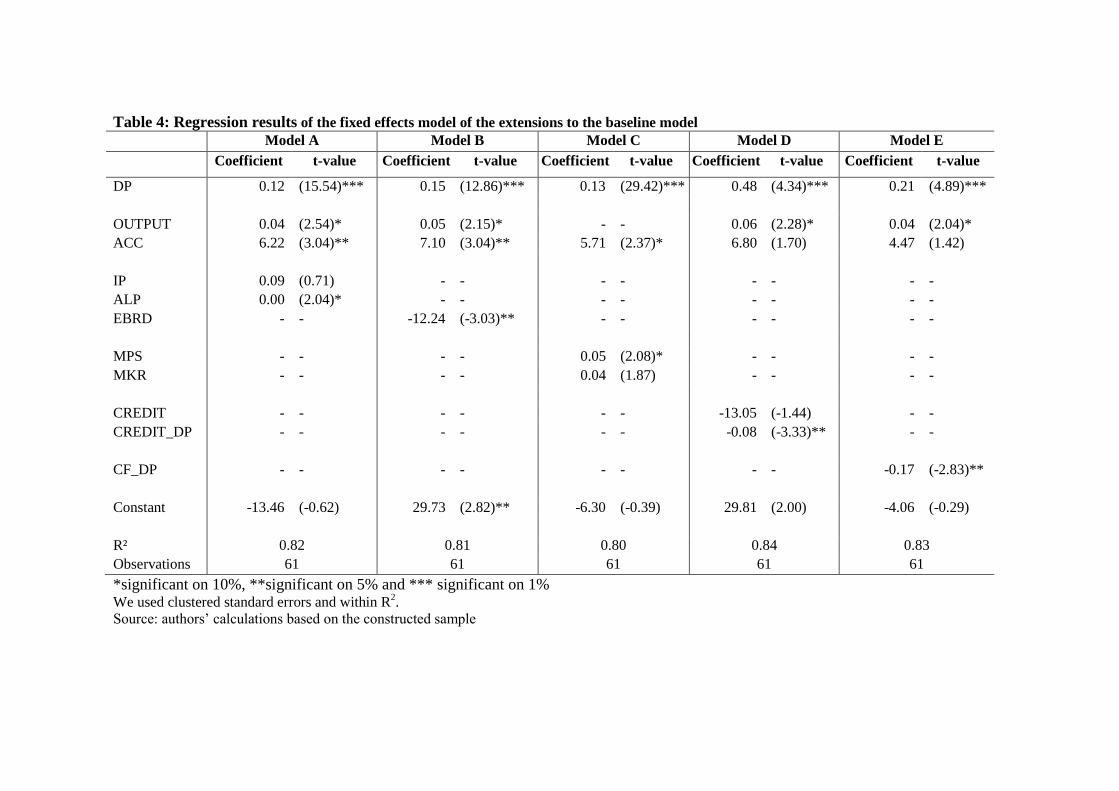
4.1.2 Extensions of the baseline model
We extend the baseline model in four ways. First, we include two different sets of
explanatory variables to control for the prices of substitutes for land on the one hand,
and for market imperfections due to incomplete institutional reforms on the other hand.
Second, we estimate the impact of market price support measures by disentangle the
variable OUTPUTi,t into one variable capturing the market return without subsidies and
one variable capturing the market price support per hectare. Third, we analyse the
interaction between the level of direct payments and credit market imperfections.
Finally, we analyse the interaction between the level of direct payments and the
country’s farm structure (share of land cultivated by corporate vs. individual farmers).
Control variables10
First, in order to control for changes in the prices of substitutes for agricultural