Page 1
Atmospheric Environment 38 (2004) 1705–1714
ARTICLE IN PRESS
AE International – Asia
*Correspond
E-mail addr
1352-2310/$ - se
doi:10.1016/j.at
Chemical composition of precipitation during 1984–2002at Pune, India
P.D. Safai*, P.S.P. Rao, G.A. Momin, K. Ali, D.M. Chate, P.S. Praveen
Indian Institute of Tropical Meteorology, Dr. Homo Bhabha Road Pashan, Pune 411 008, India
Received 26 September 2003; accepted 26 December 2003
Abstract
Since 1984, bulk precipitation samples have been collected at Pune, a tropical urban location in India, in the
monsoon season. Data from these studies are used to analyze the long-term trends in the major chemical constituents of
precipitation. Significantly increasing trends were observed for SO4 and NO3 which could be attributed to the rise in
industrial and vehicular activities during this period. Also Ca, the chief neutralizing constituent, showed decreasing
trend, mainly due to the rapid urbanization that reduced the availability of open land which is the major source for Ca.
This has resulted in the overall decrease in trend of pH. However, the average pH value is still in the alkaline range due
to the dominance of neutralizing potential of precipitation over the acidic potential.
r 2004 Elsevier Ltd. All rights reserved.
Keywords: Ionic ratio; Fractional acidity; Original acidity; Neutralization factors; Enrichment factors; Frequency distributions
1. Introduction
A number of studies on time trend analysis in
precipitation chemistry have been reported from Central
and Western Europe, North America and recently from
South East Asia. Puxbaum et al. (1998) have taken a
comprehensive account of such studies from USA,
Netherlands, Denmark, Spain, Canada and Germany.
Most of the studies have reported decrease in SO4
concentrations along with increase in pH that could be
directly related with the decrease in the emissions of
SO2. Nilles and Conley (2001) also reported rainfall
composition data for a period of 1981–1998, from about
144 sites of National Atmospheric Deposition Program
of USA. About 35% decrease in SO4 has been reported.
No significant trends were observed for NO3, NH4 and
Ca, although about 64 sites showed decreasing trend for
Ca and 30 sites showed increasing trend for NH4. Fujita
et al. (2001) have reported trends in chemical composi-
tion of precipitation at six rural stations in western
ing author.
ess: [email protected] (P.D. Safai).
e front matter r 2004 Elsevier Ltd. All rights reserve
mosenv.2003.12.016
Japan during 1987–1996. There was no significant
change in the concentrations of non-seasalt fraction of
SO4, i.e., nssSO4 and non-seasalt fraction of Ca, i.e.,
nssCa whereas, concentrations of NO3 and NH4 showed
increasing (45%) trends. The ratio of neutralizing
potential (NP) to acidic potential (AP) showed 24%
increase. Lee et al. (2001) have reported changes in
chemical composition of precipitation at four sites in
South Korea during 1993–1998. Concentrations of
NssSO4, NH4 and Ca showed decreasing trends at
statistically significant level whereas, NO3 did not show
much variation. Overall, pH did not show any
significant trend.
Acid precipitation has been a growing problem in
China, especially in its southern parts. About 73% of its
energy is produced by coal burning, resulting in
substantial increase in sulfur emissions. Natural alkaline
dust neutralizes much of the acidity in north but in south
the problem of acidity is more severe. pH values
reported are between 4 and 5 with sometimes well below
4 also (Zhao et al., 1988; Qin and Huang, 2001).
However, due to some recent policies in fuel changes and
other restrictions, growth of sulfur emissions has been
d.
Page 2
ARTICLE IN PRESS
Fig. 1. Location of Pune and other sites under GAW network in India along with pH as reported by Shende (2000).
P.D. Safai et al. / Atmospheric Environment 38 (2004) 1705–17141706
decelerated, but the increase in NOx emissions is still
substantial (Streets et al., 2001). According to Hedin
et al. (1994), the lowering of pH in precipitation may
take place in Asia in future due to the decrease in
alkaline dust owing to mobilization and urbanization.
Studies on long-term monitoring of precipitation
chemistry, especially from the Asian region are very
few. Due to the rapid economic growth in this region,
emissions and consequently atmospheric concentrations
of many pollutants have increased enormously. For any
comprehensive and realistic assessment of the changes in
atmospheric composition, it is very much essential to
have data on the chemical constituents of precipitation.
In India, even though the chemical composition of
precipitation has been reported in many studies, most of
them are limited to a short period of time (Handa, 1973;
Mukherjee, 1964; Mahadevan et al., 1989; Khemani
et al., 1985, 1987). Under the Global Atmospheric
Watch (GAW) network, previously known as Back-
ground Atmospheric Pollution Monitoring Network
program of WMO, studies relating to precipitation
composition have been carried out at 10 different
stations in India since last three decades. Pune is one
of these stations. Results on this data have been reported
by many studies (Varma, 1989; Mukhopadhyay et al.,
1992; Shende, 2000; Soni and Kannan, 2001). Recently a
comprehensive review on precipitation chemistry studies
in India has been reported by Kulshrestha et al. (2003).
Pune is about 100 km inland on west coast of India,
on the leeward side of Western Ghats (Fig. 1). At the
Indian Institute of Tropical Meteorology (IITM), Pune,
monitoring of precipitation chemistry has been carried
out since 1970s. Results relating to these studies have
been reported earlier (Khemani, 1989; Naik et al., 1988;
Rao, 1997). Khemani (1985) has reported a decadal
(1974–1983) variation of ionic constituents of rain water.
However, then the observational site was on the western
outskirts, about 3 km from the city center and latter,
after 1984 it was shifted to Pashan, situated to the
northwest, on the outskirts of the city, about 10 km from
city center. Since then, continuous monitoring of rain-
water has been carried out at Pashan. Results relating to
the data on precipitation composition for a period of 19
years from 1984 to 2002 are discussed.
2. Sampling and analysis techniques
Sampling was carried out on the terrace of the IITM
building, about 10m above the surface. The funnel and
collector bottles were daily cleaned with triple distilled
water to avoid dry deposition of gaseous and particulate
pollutants. Samples were immediately analyzed for pH
and stored in refrigerator at about 4�C until the
completion of chemical analysis. Spectrophotometric
methods were used to measure Cl, SO4, NO3 and NH4
Page 3
ARTICLE IN PRESSP.D. Safai et al. / Atmospheric Environment 38 (2004) 1705–1714 1707
and Atomic Absorption Spectrophotometric technique
was used to measure Na, K, Ca and Mg. Concentrations
of HCO3 were computed from pH and atmospheric CO2
partial pressure, assuming gas–liquid equilibrium (Brim-
blecombe, 1986). Details about analysis have been
mentioned elsewhere (Safai, 1999). Since 2000, analysis
of Cl, NO3 and SO4 is carried out by Ion Chromato-
graphy technique (Dionex-100, USA) using analytical
columns Ion Pac-AS4A-SC 4mm, anion micromem-
brane suppressor ASRS-1, 1.8mM Sodium Carbonate/
1.7mM Bicarbonate as eluent and triple distilled water
as regenerant.
3. Quality control methods
In the present study, data relating to the analysis of
bulk rainwater samples have been considered as wet-
only sampling was carried out during 1992–1997 only
and then continued after 2000 onwards and data related
to it have been reported elsewhere (Pillai et al., 2001).
Also, samples collected during sequential shower have
been omitted because they are better suitable for studies
relating to washout coefficients for different chemical
components of precipitation. Samples contaminated
with dust or bird droppings were removed. A simple
statistical data reduction technique (Rodhe and Granat,
1984) was adopted. Data points outside the range
(m � 3s; m þ 3s) were excluded, where m=average
and s=standard deviation. In this method, the filtering
process converges to a stable value of m and s after a
few iterations. It serves the purpose of excluding extreme
outliers and at the same time allows the real (sometimes
episodic) data to be retained.
4. Results and discussions
4.1. Variations of pH and ionic constituents of rain water
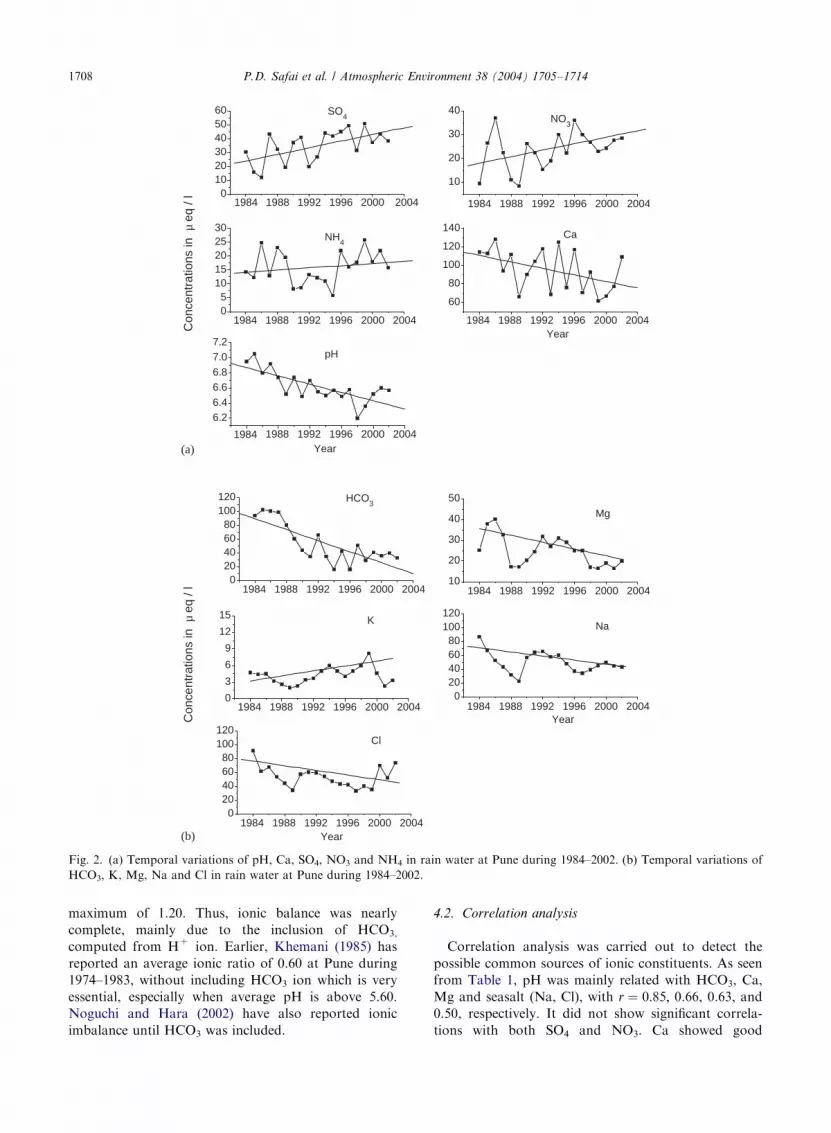
Figs. 2(a) and (b) show the temporal variations of pH
and different ionic constituents of rain water at Pune
during 1984–2002. pH showed significantly decreasing
trend with time (r ¼ �0:75 at o1% level of significance)
and its variation closely resembled that of Ca, which
also showed decreasing trend (r ¼ �0:42 at 7% level).
Concentrations of major acidifying components, i.e. SO4
and NO3 have shown increasing trend. Increasing trend
of SO4 was more significant (r ¼ 0:60; at o1% level)
than that of NO3 (r ¼ 0:36 at 10% level). Another
alkaline component NH4 has shown slightly increasing
trend but it was not significant (r ¼ 0:24 at 30% level).
Therefore, Ca was the major alkaline component
neutralizing the acidity generated by SO4 and NO3.
Similar results have been reported by many studies
(Noguchi et al., 1997; Al Momani et al., 1995). Other
ionic constituents, i.e., Na, Cl and Mg have shown
overall decreasing trend. However, the decreasing trend
was more significant for Mg (r ¼ �0:60 at 1% level)
than those for Na (r ¼ �0:35 at 10% level) and Cl
(r ¼ �0:23 at 30% level). K showed slightly increasing
trend (r ¼ 0:30; at 20% level) whereas, HCO3 showed a
significantly decreasing trend (r ¼ �0:81 at 1% level).
Average pH during 1984–2003 was 6.60. However, at
the beginning in 1984, it was 7.10 and remained around
6.90 until 1987. From 1988 onwards, it reduced down
below 6.80 with the lowest (6.36) recorded in 1999.
Khemani (1985) has reported decreasing trends in pH
and other ionic constituents of rainfall at Pune during
1974–1983, except NO3, Ca and Na, which did not show
any significant trend. Pillai et al. (2001) have reported
average pH 6.10 for rain water using wet-only collector
at the same site and also have shown a decreasing trend
with lowest value (5.71) in 1998.
Shende (2000) has reported trends in pH values at 10
locations in India inclusive of Pune, under the GAW
network of WMO, for the period 1985–1994. The
average values of pH at all these locations have been
indicated in Fig. 1, along with that obtained in the
present study. However, the average pH for Pune for
1985–1994 was 6.25 which is less as compared to the
present value of 6.60. This could be due to the difference
in observational site. The site under GAW network is in
close proximity of city center where vehicular and other
urban activities are more as compared to those at the site
under present study, which is away from city center.
Soni and Kannan (2001) have also reported the trends in
pH and ionic constituents at these 10 sites in India for
the period 1981–1998. They have reported that the pH
of precipitation in India varies between 3.60 and 8.50
with the maximum frequency observed in the range of
6.00–7.50. Also, there was a decreasing trend of pH at all
the 10 stations. Nagpur, Allahabad and Mohanbari
showed significant increasing trends of SO4 and NO3,
whereas, Minicoy, Port Blair and Visakhapatanam
showed significant increasing trend of NO3. Varma
(1989) has reported highest frequency of pH in the range
of 6.5–7.0 for rain water in India.
As seen from Fig. 3, about 53% of average ionic
composition is formed by cations whereas; remaining
47% is formed by anions. Ca shows the maximum
contribution (27%), followed by HCO3 (17%). The
minimum contribution is from K (1%). Seasalt, i.e., Na
and Cl contributed about 30% whereas, SO4 and NO3
together contributed about 14%. Significantly high
concentrations of Ca have been reported in precipitation
as well as aerosol samples over Pune, which has been
attributed to the transport of soil dust from the Arabian
Peninsula to the west coast of India (Khemani, 1989;
Rao, 1997; Naik, 2001).
The average value of the ratio between total anions to
total cations was 0.91, with a minimum of 0.60 and a
Page 4
ARTICLE IN PRESS
1984 1988 1992 1996 20000
102030405060
10
20
30
40
05
1015202530
60
80
100
120
140
1984 1988 1992 2004
6.26.46.66.87.07.2
Con
cent
ratio
ns in
µ e
q / l
Ca
pH
SO4 NO
3
Year
NH4
Year20001996
2004 1984 1988 1992 1996 2000 2004
1984 1988 1992 1996 2000 20041984 1988 1992 1996 2000 2004
020406080
100120
10
20
30
40
50
0
3
6
9
12
15
020406080
100120
020406080
100120
Mg
K Na
Cl
HCO3
Year
Year
1984 1988 1992 1996 2000 2004 1984 1988 1992 1996 2000 2004
1984 1988 1992 1996 2000 20041984 1988 1992 1996 2000 2004
1984 1988 1992 1996 2000 2004
Con
cent
ratio
ns in
µ e
q / l
(a)
(b)
Fig. 2. (a) Temporal variations of pH, Ca, SO4, NO3 and NH4 in rain water at Pune during 1984–2002. (b) Temporal variations of
HCO3, K, Mg, Na and Cl in rain water at Pune during 1984–2002.
P.D. Safai et al. / Atmospheric Environment 38 (2004) 1705–17141708
maximum of 1.20. Thus, ionic balance was nearly
complete, mainly due to the inclusion of HCO3,
computed from H+ ion. Earlier, Khemani (1985) has
reported an average ionic ratio of 0.60 at Pune during
1974–1983, without including HCO3 ion which is very
essential, especially when average pH is above 5.60.
Noguchi and Hara (2002) have also reported ionic
imbalance until HCO3 was included.
4.2. Correlation analysis
Correlation analysis was carried out to detect the
possible common sources of ionic constituents. As seen
from Table 1, pH was mainly related with HCO3, Ca,
Mg and seasalt (Na, Cl), with r ¼ 0:85; 0.66, 0.63, and0.50, respectively. It did not show significant correla-
tions with both SO4 and NO3. Ca showed good
Page 5
ARTICLE IN PRESSP.D. Safai et al. / Atmospheric Environment 38 (2004) 1705–1714 1709
correlations with Mg (r ¼ 0:75), Na and Cl (r ¼ 0:70 for
both). Also, both Ca and Mg showed good correlations
(rX0:60) with HCO3, indicating towards formation of
calcium and magnesium carbonates, possibly originated
from fine clay size particles fractured from calcite and
dolomite. Similar results were reported by Saxena et al.
(1991), Noguchi and Hara (2002) and Mukhopadhyay
et al. (1992). Significantly good correlation was seen
between Na and Cl (r ¼ 0:92) and also, both showed
good correlations with Mg (r > 0:70), indicating towards
a common marine source. Good correlations between
these marine components and Ca indicate towards the
existence of deposited seasalt particles on the local soil.
SO4 and NO3 did not show significant correlation
among themselves (r ¼ 0:21). In fact, SO4 was correlated
with Ca and seasalt (Na and Cl) rather than with NO3
Fig. 3. Average chemical composition of rain water at Pune
during 1984–2002.
Table 1
Correlation coefficients for the pH and ionic constituents of precipita
Cl SO4 NO3 HCO3 NH4 N
Cl 1 0.41 0.10 0.44 �0.12
SO4 1 0.21 0.15 0.04
NO3 1 0.15 0.17
HCO3 1 �0.06
NH4 1 �Na
K
Ca
Mg
H
pH
and NH4. Thus, the major portion of SO4 was in the
form of salts with soil/sea originated constituents. Jain
et al. (2000) have reported significant fractions of nssSO4
in rain water at Delhi, contributed by soil. SO4 in rain
water has been reported due to the resuspension of
gypsiferous soil in India (Jacks et al., 1994). Naik et al.
(1988) have reported similar results for rain water at
Pune and surrounding rural areas. Khemani et al. (1982)
have shown a bimodal distribution for SO4 aerosols at
Pune during the monsoon season, with a major portion
of mass in coarse fraction. It was suggested that
atmospheric SO2 may be adsorbed on particulate matter
and thereby react with either soil-derived components
like Ca, Mg and K or with marine component like Na.
NO3 showed some correlation with K and Ca (r ¼ 0:30)indicating towards the formation of its salts with the
crustal components. Similar results have been reported
earlier (Mukhopadhyay et al., 1992; Naik et al., 1988).
4.3. Quantification of acidifying and neutralizing
potentials
Over large areas of Northern Hemisphere, acidity of
rain is controlled mainly by the strong acids, e.g., H2SO4
and HNO3 (Overrain et al., 1981). Considering both SO4
and NO3 as the main acidifying components of rain,
Fractional Acidity (FA) was computed as, FA=[H+]/
([nssSO42�]+[NO3
�]) (Balasubramanian et al., 2001). If
this ratio is one, it is considered that the acidity
generated by these strong acids is not neutralized at
all. Fig. 4 shows variation of FA in rain water at Pune
during 1984–2003. There is slow but gradual increase in
FA indicating some decrease in neutralization of
acidification. Table 2 shows the annual variation of
FA. The average FA value was 0.013, indicating that
about 99% acidity was neutralized by alkaline constitu-
ents. Relative contribution of NO3 to the acidification
was computed using a ratio [NO3�]/([NO3
�]+[nssSO42�])
and its average value was 0.54, showing that about 54%
of acidity of rain was due to NO3 and 46% due to SO4.
tion at Pune (significant at 1% level)
a K Ca Mg H pH
0.92 0.45 0.68 0.71 �0.02 0.50
0.43 0.31 0.47 0.31 �0.18 0.19
0.10 0.29 0.27 0.24 0.06 0.17
0.46 0.30 0.63 0.61 0.13 0.85
0.13 0.07 �0.05 �0.06 �0.06 �0.03
1 0.47 0.69 0.74 0.04 0.51
1 0.51 0.48 0.02 0.35
1 0.75 0.00 0.66
1 0.13 0.63
1 0.11
1
Page 6
ARTICLE IN PRESS
1982 1984 1986 1988 1990 1992 1994 1996 1998 2000 2002 20040.000
0.008
0.016
0.024
0.032
0.040
[H+]
/ [N
O3+
] + [N
ss S
O42-
]
Year
Fig. 4. Variation of FA in rain water at Pune during
1984–2002.
Table 2
Annual variation of fractional acidity, original acidity and ratio
of neutralization potential to AP in the rain water at Pune
during 1984–2002
Year Fractional
acidity (meq l�1)
Original acidity
(meq l�1)
NP/AP
1984 0.005 128.25 2.39
1985 0.022 122.20 3.40
1986 0.015 152.70 3.30
1987 0.006 107.31 0.69
1988 0.013 127.01 1.44
1989 0.025 81.19 2.01
1990 0.004 98.54 0.75
1991 0.009 113.30 1.01
1992 0.020 130.63 2.39
1993 0.009 81.12 1.21
1994 0.007 136.32 0.73
1995 0.012 79.80 0.68
1996 0.010 139.32 0.87
1997 0.008 86.89 0.71
1998 0.020 110.72 1.15
1999 0.010 87.82 0.48
2000 0.030 84.34 0.84
2001 0.007 99.24 0.58
2002 0.009 125.42 0.86
Average 0.013 110.14 1.34
1982 1984 1986 1988 1990 1992 1994 1996 1998 2000 2002 20040.0
0.5
1.0
1.5
2.0
2.5
3.0
3.5
4.0
Nf Ca Nf NH4 Nf Mg Nf K
Neu
tral
izat
ion
Fac
tors
1982 1984 1986 1988 1990 1992 1994 1996 1998 2000 2002 2004
0
1
2
3
4
NP
/ AP
Year
(a)
(b)
Fig. 5. (a) Variation of NFs for Ca, NH4, Mg and K for rain
water at Pune during 1984–2002. (b) Variation of NP/AP in
water at Pune during 1984–2002.
P.D. Safai et al. / Atmospheric Environment 38 (2004) 1705–17141710
Nitric acid is found to be of common occurrence in rain
water in India (Mukhopadhyay et al., 1992).
According to Galloway et al. (1987), the measured
hydrogen ion concentration [H+] reflects the acidity
of precipitation after neutralization by atmospheric
bases especially, NH4 and Ca. Therefore, the original
acidity should be estimated by calculating [H+]+
[NH4+]+[Ca2+] to compare with the measured acidity
[H+]. Year-wise variation of the measured acidity and
calculated original acidity for rainfall at Pune is shown
in Table 2. It can be seen that the average pH of rainfall
at Pune was 3.96 in the absence of Ca and NH4 (average
original acidity=110.14meq l�1). Momin (1990) has
reported about two orders of magnitude more original
acidity than the measured one for rainfall at Delhi. He
has suggested that the neutralization reactions are more
rapid and extensive during the early stages of rainfall
when the airborne dust is plentiful and pH of precipita-
tion is low than during the latter stages when the pH is
higher and amount of dust is lower.
Varma (1989) formulated an empirical relationship
between total suspended particulates and pH for
Jodhpur and Srinagar, two north Indian locations
which receive high incursions of dust from adjoining
arid regions. The soil particles are rich in alkaline
ions like Ca, Mg, and K which neutralize the acidity
of rain.
Neutralization factors (NF) were computed for
different alkaline constituents using the formulae
suggested by Parashar et al. (1996). Fig. 5(a) shows the
variation of NF values for Ca, Mg, K and NH4. Ca
showed maximum value among all the cations. Average
NF values were 1.21, 0.18, 0.19 and 0.09 for Ca, NH4,
Page 7
ARTICLE IN PRESSP.D. Safai et al. / Atmospheric Environment 38 (2004) 1705–1714 1711
Mg and K, respectively. To assess the balance between
acidity and alkalinity, ratio of NP to AP was compu-
ted as, NP/AP=[nssCa2+]+[NH3+]/[nssSO4
2�]+[NO3+].
Table 2 reveals the variation of this ratio for each year.
The average value was 1.33, indicating overall dom-
inance of alkaline constituents that prevented acidifica-
tion of rain water. However, as seen in Fig. 5(b), the
decreasing trend of this ratio showed that the neutraliz-
ing capacity is declining.
4.4. Frequency distributions of pH and ionic constituents
Figs. 6(a) and (b) show the frequency distributions of
pH and ionic constituents of rain water at Pune during
0
20
40
60
80
100
140120100806040200
Per
cent
age
Fre
quen
cyP
erce
ntag
e F
requ
ency
SO4
0
20
40
60
80
0
20
40
60
80
100
1201007550250
NH4
0
20
40
60
80
100
2180120600
Concentrations in µ eq / l
100
6040200
0
20
40
60
80
360300240180120600
HCO3
0
20
40
60
80
1280400
0
20
40
60
80
2520151050
K
0
20
40
60
80
1280400
100
100100
100
Concentrations in µ eq / l
(a)
(b)
Fig. 6. (a) Frequency distribution of SO4, NO3, pH, NH4 and Ca in
HCO3, Na, Mg, K and Cl in water at Pune during 1984–2002.
1984–2002. About 71% samples showed pH in the range
of 6.5–7.5 while 17% showed in the range of 6.0–6.5 and
10% in the highly alkaline range of 7.5–8.0. Less than
2% samples showed pHp5.
In case of Ca, about 30% samples showed concentra-
tions below 50meq l�1 whereas, more than 90% for NH4
and NO3, 85% for Mg, 78% for SO4, 60% for Na and
Cl and 56% for HCO3 showed concentration below
50 meq l�1. Concentrations above 100 meq l�1 were rarely
found in case of SO4, NO3 (2% each), Mg (1%) and
NH4 (nil). For K, about 98% samples showed concen-
trations below 15 meq l�1. Only Ca showed maximum
concentrations with some samples (about 2%) reaching
above 300meq l�1.
0.1
1
10
8.07.57.06.56.05.55.0
pHNO3
42036030040
Ca
100
14012010080
2402001600
Na
0
20
40
60
80
1201007550250
Mg
2402001600
Cl
100
water at Pune during 1984–2002. (b) Frequency distribution of
Page 8
ARTICLE IN PRESSP.D. Safai et al. / Atmospheric Environment 38 (2004) 1705–17141712
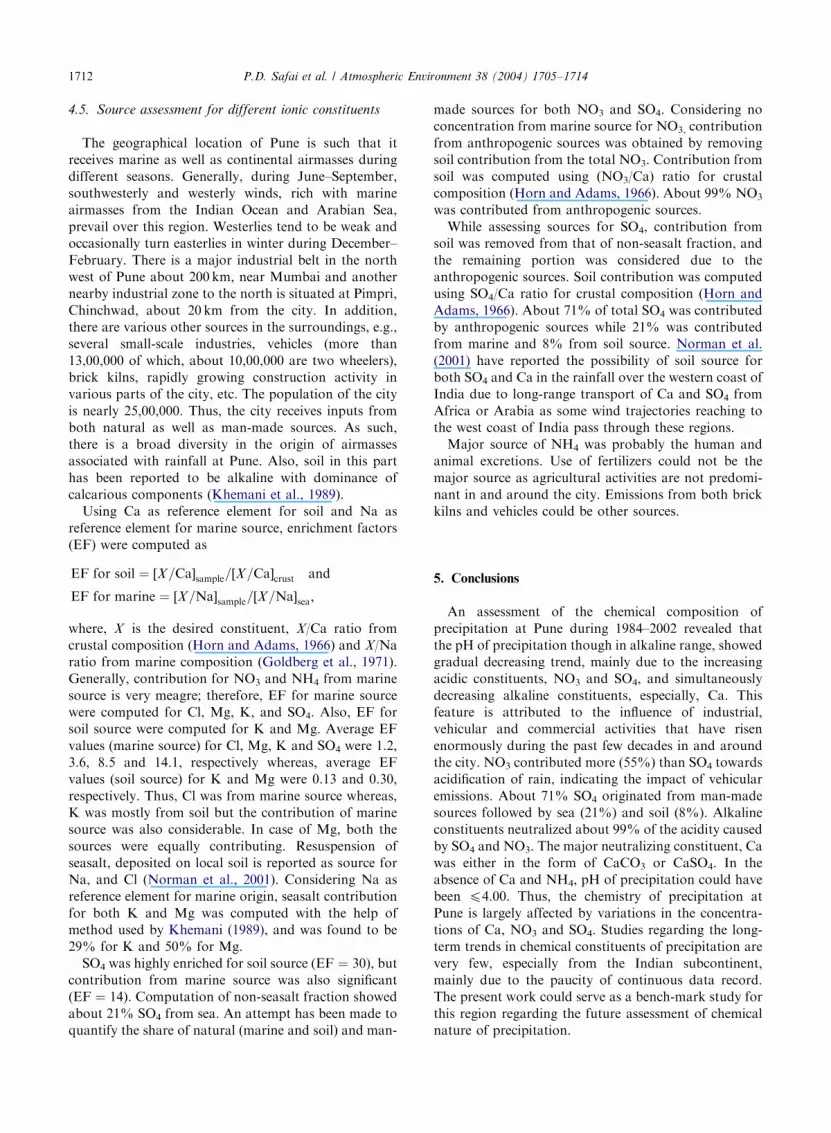
4.5. Source assessment for different ionic constituents
The geographical location of Pune is such that it
receives marine as well as continental airmasses during
different seasons. Generally, during June–September,
southwesterly and westerly winds, rich with marine
airmasses from the Indian Ocean and Arabian Sea,
prevail over this region. Westerlies tend to be weak and
occasionally turn easterlies in winter during December–
February. There is a major industrial belt in the north
west of Pune about 200 km, near Mumbai and another
nearby industrial zone to the north is situated at Pimpri,
Chinchwad, about 20 km from the city. In addition,
there are various other sources in the surroundings, e.g.,
several small-scale industries, vehicles (more than
13,00,000 of which, about 10,00,000 are two wheelers),
brick kilns, rapidly growing construction activity in
various parts of the city, etc. The population of the city
is nearly 25,00,000. Thus, the city receives inputs from
both natural as well as man-made sources. As such,
there is a broad diversity in the origin of airmasses
associated with rainfall at Pune. Also, soil in this part
has been reported to be alkaline with dominance of
calcarious components (Khemani et al., 1989).
Using Ca as reference element for soil and Na as
reference element for marine source, enrichment factors
(EF) were computed as
EF for soil ¼ ½X=Ca�sample=½X=Ca�crust and
EF for marine ¼ ½X=Na�sample=½X=Na�sea;
where, X is the desired constituent, X/Ca ratio from
crustal composition (Horn and Adams, 1966) and X/Na
ratio from marine composition (Goldberg et al., 1971).
Generally, contribution for NO3 and NH4 from marine
source is very meagre; therefore, EF for marine source
were computed for Cl, Mg, K, and SO4. Also, EF for
soil source were computed for K and Mg. Average EF
values (marine source) for Cl, Mg, K and SO4 were 1.2,
3.6, 8.5 and 14.1, respectively whereas, average EF
values (soil source) for K and Mg were 0.13 and 0.30,
respectively. Thus, Cl was from marine source whereas,
K was mostly from soil but the contribution of marine
source was also considerable. In case of Mg, both the
sources were equally contributing. Resuspension of
seasalt, deposited on local soil is reported as source for
Na, and Cl (Norman et al., 2001). Considering Na as
reference element for marine origin, seasalt contribution
for both K and Mg was computed with the help of
method used by Khemani (1989), and was found to be
29% for K and 50% for Mg.
SO4 was highly enriched for soil source (EF ¼ 30), but
contribution from marine source was also significant
(EF ¼ 14). Computation of non-seasalt fraction showed
about 21% SO4 from sea. An attempt has been made to
quantify the share of natural (marine and soil) and man-
made sources for both NO3 and SO4. Considering no
concentration from marine source for NO3, contribution
from anthropogenic sources was obtained by removing
soil contribution from the total NO3. Contribution from
soil was computed using (NO3/Ca) ratio for crustal
composition (Horn and Adams, 1966). About 99% NO3
was contributed from anthropogenic sources.
While assessing sources for SO4, contribution from
soil was removed from that of non-seasalt fraction, and
the remaining portion was considered due to the
anthropogenic sources. Soil contribution was computed
using SO4/Ca ratio for crustal composition (Horn and
Adams, 1966). About 71% of total SO4 was contributed
by anthropogenic sources while 21% was contributed
from marine and 8% from soil source. Norman et al.
(2001) have reported the possibility of soil source for
both SO4 and Ca in the rainfall over the western coast of
India due to long-range transport of Ca and SO4 from
Africa or Arabia as some wind trajectories reaching to
the west coast of India pass through these regions.
Major source of NH4 was probably the human and
animal excretions. Use of fertilizers could not be the
major source as agricultural activities are not predomi-
nant in and around the city. Emissions from both brick
kilns and vehicles could be other sources.
5. Conclusions
An assessment of the chemical composition of
precipitation at Pune during 1984–2002 revealed that
the pH of precipitation though in alkaline range, showed
gradual decreasing trend, mainly due to the increasing
acidic constituents, NO3 and SO4, and simultaneously
decreasing alkaline constituents, especially, Ca. This
feature is attributed to the influence of industrial,
vehicular and commercial activities that have risen
enormously during the past few decades in and around
the city. NO3 contributed more (55%) than SO4 towards
acidification of rain, indicating the impact of vehicular
emissions. About 71% SO4 originated from man-made
sources followed by sea (21%) and soil (8%). Alkaline
constituents neutralized about 99% of the acidity caused
by SO4 and NO3. The major neutralizing constituent, Ca
was either in the form of CaCO3 or CaSO4. In the
absence of Ca and NH4, pH of precipitation could have
been p4.00. Thus, the chemistry of precipitation at
Pune is largely affected by variations in the concentra-
tions of Ca, NO3 and SO4. Studies regarding the long-
term trends in chemical constituents of precipitation are
very few, especially from the Indian subcontinent,
mainly due to the paucity of continuous data record.
The present work could serve as a bench-mark study for
this region regarding the future assessment of chemical
nature of precipitation.
Page 9
ARTICLE IN PRESSP.D. Safai et al. / Atmospheric Environment 38 (2004) 1705–1714 1713
References
Al Momani, I.F., Ataman, O.Y., Anwari, M.A., Tuncel, S.,
Kose, C., Tuncel, G., 1995. Chemical composition of
precipitation near an industrial area at Izmir, Turkey.
Atmospheric Environment 29, 1131–1143.
Balasubramanian, R., Victor, T., Chun, N., 2001. Chemical and
statistical analysis of precipitation in Singapore. Water, Air
and Soil Pollution 130, 451–456.
Brimblecombe, P., 1986. Air Composition and Chemistry,
Cambridge Environmental Chemistry Series. Cambridge
University Press, Cambridge.
Fujita, S.I., Takahashi, A., Hayami, H., Sakurai, T., 2001.
Long-term trends in the chemical composition of precipita-
tion over western Japan. Water, Air and Soil Pollution 130,
415–420.
Galloway, J.N., Diawu, Z., Jiling, X., Likens, G.E., 1987. Acid
rain: China, United States and a remote area. Science 236,
1559–1562.
Goldberg, E.D., Broecker, W.S., Gross, M.G., Turekian, K.K.,
1971. Marine chemistry. In: Radioactivity in the Marine
Environment. National Academy of Sciences, Washington,
DC, pp. 137–146.
Handa, B.K., 1973. Chemical composition of monsoon rain
water over Chandigarh in 1971. Indian Geohydrology 9,
31–37.
Hedin, L.O., Granat, L., Likens, G.E., Buishand, T.A.,
Galloway, J.N., Butler, T.J., Rodhe, H., 1994. Steep
declines in atmospheric base cations in regions of Europe
and North America. Nature 367, 351–354.
Horn, M.K., Adams, J.A.S., 1966. Computer-derived geochem-
ical balances and element abundances. Geochimica et
Cosmochimica Acta 30, 279–297.
Jacks, G., Sharma, V.P., Torssander, P., Oberg, G., 1994.
Origin of sulphur in soil and water in a precambrian terrain.
Geochemical Journal 28, 351–358.
Jain, M., Kulshrestha, U.C., Sarkar, A K., Parashar, D.C.,
2000. Influence of crustal aerosols on wet deposition at
urban and rural sites in India. Atmospheric Environment
34, 5129–5137.
Khemani, L.T., 1985. Characteristics of atmospheric gaseous
and particulate pollutants and their influence on cloud
microphysics and rain formation. Ph.D. Thesis, University
of Poona, Poona.
Khemani, L.T., 1989. Physical and chemical characteristics of
atmospheric aerosols. In: Cheremisinoff, P.N. (Ed.),
Air Pollution Control, Encyclopedia of Environmental
Control Technology, Vol. 2. Gulf Publishing Co., USA,
pp. 401–452.
Khemani, L.T., Momin, G.A., Naik, M S., Vijayakumar, R.,
Ramana Murty, Bh.V., 1982. Chemical composition of size
distribution of atmospheric aerosols over the Deccan
Plateau, India. Tellus 34, 151–158.
Khemani, L.T., Momin, G.A, Naik, M.S., Prakasa Rao, P.S.,
Kumar, R., Ramana Murty, Bh.V., 1985. Impact of alkaline
particulates on pH of rain water in India. Water, Air and
Soil Pollution 24, 365–376.
Khemani, L.T., Momin, G.A., Naik, M.S., Prakasa Rao, P.S.,
Safai, P.D., Murty, A.S.R., 1987. Influence of alkaline
particulates on pH of cloud and rain water in India.
Atmospheric Environment 21, 1137–1145.
Khemani, L.T., Momin, G.A., Rao, P.S.P., Safai, P.D., Singh,
G., Kapoor, R.K., 1989. Spread of acid rain over India.
Atmospheric Environment 23, 757–762.
Kulshrestha, U.S., Granant, L., Rodhe, H., 2003. Precipitation
chemistry studies in India, a search for regional patterns.
Department of Meteorology, Stockholm University, Inter-
national Meteorological Institute in Stockholm, Report
CM-99.
Lee, B.K., Lee, D.S., Kim, M.G., 2001. Rapid time variations
in chemical composition of precipitation in South Korea.
Water, Air and Soil Pollution 130, 421–426.
Mahadevan, T.N., Negi, B.S., Meenakshy, V., 1989. Measure-
ments of elemental composition of aerosol matter and
precipitation from a remote background site in India.
Atmospheric Environment 23, 869–874.
Momin, G.A., 1990. The role of alkaline particulates on
pH of rain water in India. M.Sc. Thesis, University of Pune,
Pune.
Mukherjee, A.K., 1964. Acidity of monsoon rain water. Indian
Journal of Meteorology and Geophysics 5, 267–270.
Mukhopadhyay, B., Datar, S.V., Srivastava, H.N., 1992.
Precipitation chemistry over the Indian region. Mausam
43, 249–258.
Naik, M.S., 2001. Study of ionic constituents in rain water in
polluted and non-polluted regions of India. Ph.D. Thesis,
University of Pune, Pune.
Naik, M.S., Khemani, L.T., Momin, G.A., Prakasa Rao, P.S.,
1988. Measurement of pH and chemical analysis of rain
water in rural area of India. Acta Meteorologica Sinica 2,
91–100.
Nilles, M.A., Conley, B.E., 2001. Changes in the chemistry of
precipitation in the United States, 1981–1998. Water, Air
and Soil Pollution 130, 409–414.
Noguchi, I., Hara, H., 2002. Precipitation hydrogen carbonate
and its significance in East Asia. In: Peng, L.C., Bala, R.,
Rodhe, H., Hicks, K. (Eds.), Proceedings of First Work-
shop on Composition of Asian Deposition, Malaysia, 21–23
November 2002, pp. 67–75.
Noguchi, I., Kato, T., Akiyama, M., Otsuka, H., Matsumoto,
Y., 1997. The precipitation chemistry in northern Japan—
effect of alkaline dust. In: Murano, K. (Ed.), Proceedings of
International Workshop on Unification of Monitoring
Protocol of Acid Deposition and Standardization of
Emission Inventory, Japan, March 1997, pp. 76–83.
Norman, M., Das, S.N., Pillai, A.G., Granat, L., Rodhe, H.,
2001. Influence of mass trajectories on the chemical
composition of precipitation in India. Atmospheric Envir-
onment 35, 4223–4235.
Overrain, L.N., Seip, H.M., Tollan, A., 1981. Acid precipita-
tion—effects on forest and fish. SNSF project final report
175.
Parashar, D.C., Granat, L., Kulshrestha, U.C., Pillai, A.G.,
Naik, M.S., Momin, G.A., Prakasa Rao, P.S., Safai, P.D.,
Khemani, L.T., Naqvi, S.W.A., Narvekar, P.V., Thapa,
K.B., Rodhe, H., 1996. Chemical composition of precipita-
tion in India and Nepal. A Preliminary Report on an Indo-
Swedish Project on Atmospheric Chemistry, Department of
Meteorology, Stockholm University, International Meteor-
ological Institute, Stockholm, CM-90.
Pillai, A.G., Naik, M.S., Momin, G.A., Rao, P.S.P., Safai,
P.D., Ali, K., Rodhe, H., Granat, L., 2001. Studies of wet
Page 10
ARTICLE IN PRESSP.D. Safai et al. / Atmospheric Environment 38 (2004) 1705–17141714
deposition and dust fall at Pune, India. Water, Air and Soil
Pollution 130, 475–480.
Puxbaum, H., Simeonov, V., Kalina, M.F., 1998. Ten years
trends (1984–1993) in the precipitation chemistry in central
Austria. Atmospheric Environment 32, 193–202.
Qin, G., Huang, M., 2001. A study on rain acidification
processes in ten cities of China. Water, Air and Soil
Pollution 130, 163–174.
Rao, P.S.P., 1997. Some studies on the deposition of atmo-
spheric pollutants in different environments in India. Ph.D.
Thesis, University of Pune, Pune.
Rodhe, H., Granat, L., 1984. An evaluation of SO4 in
European precipitation 1955–1982. Atmospheric Environ-
ment 18, 2627–2639.
Safai, P.D., 1999. A study of the air pollutants in the
environment of the Nilgiri Biosphere Reserve, South India.
Ph.D. Thesis, University of Pune, Pune.
Saxena, A., Sharma, S., Kulshrestha, U.C., Srivastava, S.S.,
1991. Factors affecting alkaline nature of rain water in Agra
(India). Environmental Pollution 74, 129–138.
Shende, P.R., 2000. Changes in trends of pH over BAPMON
stations in India. Vayu Mandal 30, 36–43.
Soni, V.K., Kannan, P.S., 2001. Background acidic precipita-
tion trends in India, Proceedings of National Symposium
Tropmet 2001 on Meteorology for Sustainable Develop-
ment, Mumbai, pp. 616–621.
Streets, D.G., Tsai, N.Y., Akimoto, H., Oka, K., 2001. Trends
in emissions of acidifying species in Asia, 1985–1997. Water,
Air and Soil Pollution 130, 187–192.
Varma, G.S., 1989. Background trends of pH of precipitation
over India. Atmospheric Environment 23, 747–751.
Zhao, D., Xiong, J., Xu, Y., Chan, W.H., 1988. Acid rain
in southwestern China. Atmospheric Environment 22,
349–358.