25 Assessment of Microwave versus Conventional Heating Induced Degradation of Olive Oil by VIS Raman Spectroscopy and Classical Methods Rasha M. El-Abassy, Patrice Donfack and Arnulf Materny Jacobs University Bremen, Molecular Life Science Center, Campus Ring 1, 28759 Bremen, Germany 1. Introduction Over the last few decades, the microwave heating process has experienced more common and routine use for both home and industrial applications. In industrial field, microwave heating has been used for many applications, including food processing and preservation, bleaching, pasteurization, and sterilization (Decareau, 1985; Farag et al., 2001; Knutson et al., 1987). Numerous advantages boosted the use of microwave heating making it in many cases a technique preferred to conventional heating. These advantages include precise timing, rapidity, and energy saving. The principle of microwave heating is based on the interaction of electromagnetic waves with the molecular constituents of food. Such interaction leads to heat generation in the entire volume at nearly the same rate due to internal thermal dissipation of the vibrational energy of the molecules in the food (Decareau, 1985; Kamel & Stauffer, 1993). On the contrary, conventional heating generates heat at the contact surface first, and then the heat diffuses inward. The effects of microwave heating and conventional heating on the food components are therefore expected to be completely different. Since processed foods by microwaves are heated as a result of molecular excitation (Stein, 1972), many researchers have been concerned with the evaluation of the effect of microwaves on food constituents, nutrient retention and the change of flavours and colours of heated food (Finot, 1995; Mudgett, 1982). Microwave heating of roasted seeds and beans shows a better retention of flavour and antioxidant compounds without any significant chemical changes of the lipids (Behera et al., 2004; H. Yoshida & Kajimoto, 1989, 1994). With respect to lipid components, microwave heating was studied to verify eventual heat induced effects on different oils and fats (Farag, 1994; Hiromi Yoshida et al., 1990; H. Yoshida et al., 1992). For this purpose, peroxide value, carbonyl value and conjugated diene and triene levels were assessed. Extra virgin olive oil that comes from the first pressing of the olive, without using heat or chemicals, contains natural antioxidants such as tocopherols, carotenoids, sterols, and phenolic compounds (Boskou, 1996). It should be mentioned that carotenoids play a significant role as antioxidants by scavenging free radicals, and as singlet oxygen quenchers (Burton & Ingold, 1984; Di Mascio et al., 1989). Since oil and fat have low specific heat constants and heat quickly (Jowitt, 1983), nowadays microwave frying of food has been www.intechopen.com
Transcript
25
Assessment of Microwave versus Conventional Heating Induced Degradation of Olive Oil by VIS
Raman Spectroscopy and Classical Methods
Rasha M. El-Abassy, Patrice Donfack and Arnulf Materny Jacobs University Bremen, Molecular Life Science Center,
Campus Ring 1, 28759 Bremen, Germany
1. Introduction
Over the last few decades, the microwave heating process has experienced more common and routine use for both home and industrial applications. In industrial field, microwave heating has been used for many applications, including food processing and preservation, bleaching, pasteurization, and sterilization (Decareau, 1985; Farag et al., 2001; Knutson et al., 1987). Numerous advantages boosted the use of microwave heating making it in many cases a technique preferred to conventional heating. These advantages include precise timing, rapidity, and energy saving. The principle of microwave heating is based on the interaction of electromagnetic waves with the molecular constituents of food. Such interaction leads to heat generation in the entire volume at nearly the same rate due to internal thermal dissipation of the vibrational energy of the molecules in the food (Decareau, 1985; Kamel & Stauffer, 1993). On the contrary, conventional heating generates heat at the contact surface first, and then the heat diffuses inward. The effects of microwave heating and conventional heating on the food components are therefore expected to be completely different. Since processed foods by microwaves are heated as a result of molecular excitation (Stein, 1972), many researchers have been concerned with the evaluation of the effect of microwaves on food constituents, nutrient retention and the change of flavours and colours of heated food (Finot, 1995; Mudgett, 1982). Microwave heating of roasted seeds and beans shows a better retention of flavour and antioxidant compounds without any significant chemical changes of the lipids (Behera et al., 2004; H. Yoshida & Kajimoto, 1989, 1994). With respect to lipid components, microwave heating was studied to verify eventual heat induced effects on different oils and fats (Farag, 1994; Hiromi Yoshida et al., 1990; H. Yoshida et al., 1992). For this purpose, peroxide value, carbonyl value and conjugated diene and triene levels were assessed. Extra virgin olive oil that comes from the first pressing of the olive, without using heat or chemicals, contains natural antioxidants such as tocopherols, carotenoids, sterols, and phenolic compounds (Boskou, 1996). It should be mentioned that carotenoids play a significant role as antioxidants by scavenging free radicals, and as singlet oxygen quenchers (Burton & Ingold, 1984; Di Mascio et al., 1989). Since oil and fat have low specific heat constants and heat quickly (Jowitt, 1983), nowadays microwave frying of food has been
www.intechopen.com
Advances in Induction and Microwave Heating of Mineral and Organic Materials
586
introduced in order to improve the quality of the fried food (Oztop et al., 2007). Therefore, it is of paramount importance to consider the potential side effects of microwave and conventional heating on olive oil and their respective benefits. Owing to the above mentioned characteristics of olive oil, with both nutritional physiological benefits, this chapter is focused on the heat-induced degradation of extra virgin olive oil during microwave versus conventional heating. Emphasis is put on the repercussions in its natural antioxidant content, which is one of the most crucial factors for maintaining the quality and increasing the useful lifetime of frying oils in food manufacturing. In our work, Raman spectroscopy was employed as a fast and non-destructive technique in order to reveal and compare the degradation of extra virgin olive oil induced by microwave and conventional heating processes. This spectroscopy technique is based on the inelastic scattering of laser light, giving rise to a frequency shift of the scattered light (usually to lower energies; Stokes shift) (Baeten & Dardenne, 2002). Since these energy losses reflect the internal vibrational energies of the scattering molecules, the Raman spectra have fingerprint properties making them very useful for analytical purposes. The major advantages of this technique lie in the fact that it requires little to no sample preparation, it is rapid and non-destructive, and it can be performed using miniaturized setups ideally suited for online industrial processing. It can provide content relevant information based on the energies of molecular vibrations yielding well defined and resolved spectral features in various sample categories including liquids, solids, and gases. Therefore, Raman spectroscopy has a considerable potential as simple, fast and reliable technique in the field of food analysis.
2. Methodology and design
2.1 Samples and heating procedures
In order to explore the effect of microwave and conventional heating processes on extra virgin olive oil degradation, olive oil was separately heated using a microwave oven and an electronic heater plate equipped with a magnetic stirrer. In the microwave heating process, 200 ml of extra virgin olive oil was heated for a total of 15 min at 700 W. For conventional heating, 200 ml of extra virgin olive oil was heated using an electronic heater plate for 80 min. In order to avoid overheating of parts of the oil bath and to maintain average thermal equilibrium as far as possible, the oil bath was stirred with a magnetic stirrer either every 2 minutes or continuously, during microwave heating and conventional heating, respectively. 20 ml of oil was each time sampled from the heating oil bath at 50, 70, 100, 120, 140, 160, 180, 190, 215, and 225°C. These sampled aliquots were allowed to cool down to room temperature for free fatty acid and carotenoid content determination and Raman spectroscopy monitoring of the oil quality.
2.2 Chemical analysis 2.2.1 Determination of carotenoid content
The total carotenoid content was determined using the British standard method of analysis (British standard methods of analysis, 1977). This approach was used as a reference in order to construct a calibration model using Raman data. The sample was weighed and dissolved with hexane and diluted to the mark of the desired volume. Then it was filled into a quartz cuvette. UV-visible spectrophotometry was used to measure the sample absorbance at 445 nm against hexane contained in a separate identical quartz cuvette. The total carotenoid content was expressed as ppm of beta carotene. The calculation was done as follows:
www.intechopen.com
Assessment of Microwave versus Conventional Heating Induced Degradation of Olive Oil by VIS Raman Spectroscopy and Classical Methods
587
[ 383 ]
(100 )
V ECarotenoid content
W
× ×= × (1)
Where, V is the volume used for analysis, 383 is the value diffusion coefficient of carotenoids, E is the observed difference in absorption between the sample solution and hexane, and W is the weight of the sample in g.
2.2.2 Determination of free fatty acid (FFA)
FFA was further determined as a reliability test using the American Oil Chemists’ Society, (AOCS) Ca 5a-40 official method (Rukunudin et al., 1998). The principle of this method is based on dissolving a weighed sample of oil into a mixture of 1:1 ethanol and diethylether solvents, and then titrating the mixture under constant stirring against a 0.1 M KOH solution, using phenolphthalein as pH-indicator. The titration was run in triplicate for each sample as in the case of the Raman measurement. The results are presented as percentage oleic acid; the expression is given according to AOCS as follows:
( ) 28.2
% ( )
alkali volume ml alkalinormalityFFA as oleic acid
sample weight g
× ×= (2)
Where 28.2 is the molecular weight of oleic acid divided by 10.
2.3 Experimental design
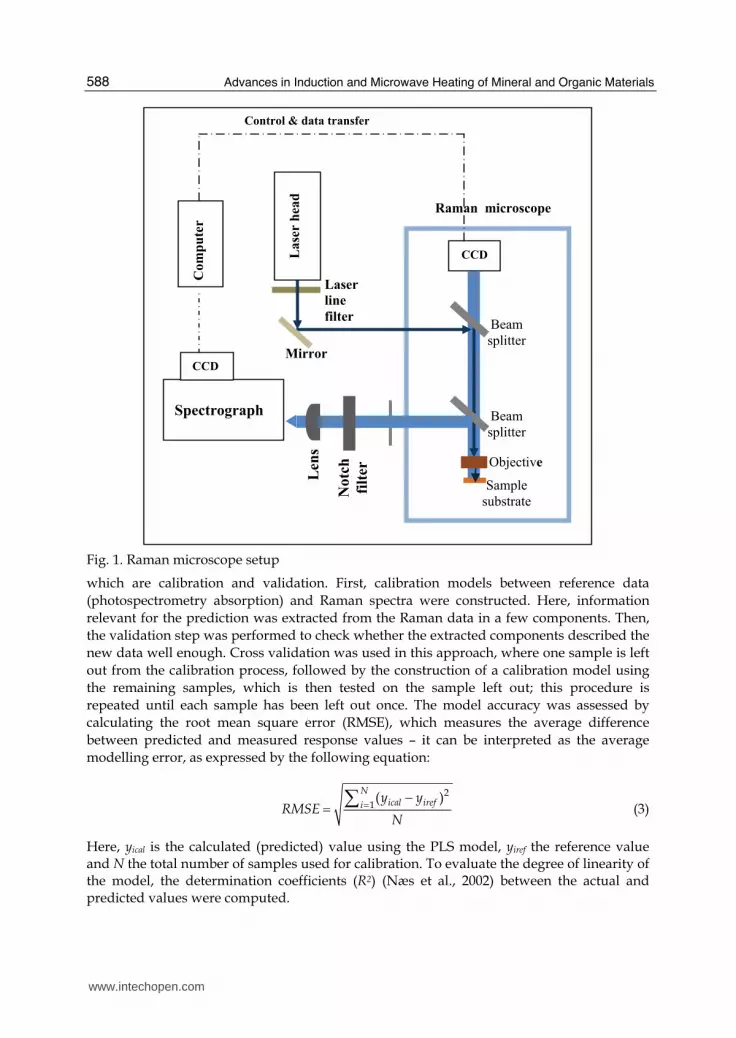
Tested samples were contained in 1800 μl quartz cuvettes (Starna) and illuminated by the 514.5 nm line of an Ar-ion laser (Coherent, Inova 308 Series) with an excitation power of 10 mW at the sample. The laser was focused within the sample using an inverted microscope setup equipped with a 10x ultra long working distance objective (10x ULWD, N.A 0.20; Olympus). The scattered signal was then recorded at a 180° backscattering geometry (Fig. 1) and dispersed by a single monochromator (TRIAX 550, Jobin Yvon) using a 1200 grooves/mm diffraction grating and an entrance slit width of 200 μm. The spectrometer was equipped with a liquid nitrogen cooled CCD detector with optimal sensitivity in the visible (blue/green) and a chip size of 2048 x 1024 pixels (Symphony 3500, Jobin Yvon). These unique features allowed for an absolute exposure time of only 3 s per spectral window (defined by detector area). Hence, the complete spectral range of interest [700 – 3100 cm-1] was recorded in just 15 s within which 5 signal accumulations were averaged. Each sample aliquot was analyzed in triplicate to insure the reproducibility of the measurement. A spike filter was applied to the recorded spectra in order to remove cosmic ray peaks. Toluene was used under the same conditions as an external standard for calibration by recording the position and the intensity of its well known symmetry ring breathing Raman band at 1004 cm-1. The baseline of each spectrum was approximated by a fourth-order polynomial fit in order to subtract the weak fluorescence background. Computer control of spectral recording and pre-processing was achieved using commercial software (NGSLabSpec, Jobin Ivon).
2.4 Statistical analysis For chemometric analysis, partial least square (PLS) regression was performed using the robust commercial software package Unscrambler (v 9.7; CAMO A/S). Calibration models for the determination of the carotenoid content in the heated extra virgin olive oil were developed using PLS regression. This statistical process consists of two separate steps,
www.intechopen.com
Advances in Induction and Microwave Heating of Mineral and Organic Materials
588
Fig. 1. Raman microscope setup
which are calibration and validation. First, calibration models between reference data
(photospectrometry absorption) and Raman spectra were constructed. Here, information
relevant for the prediction was extracted from the Raman data in a few components. Then,
the validation step was performed to check whether the extracted components described the
new data well enough. Cross validation was used in this approach, where one sample is left
out from the calibration process, followed by the construction of a calibration model using
the remaining samples, which is then tested on the sample left out; this procedure is
repeated until each sample has been left out once. The model accuracy was assessed by
calculating the root mean square error (RMSE), which measures the average difference
between predicted and measured response values – it can be interpreted as the average
modelling error, as expressed by the following equation:
2
1( )
Nical irefi
y yRMSE
N= −= ∑
(3)
Here, yical is the calculated (predicted) value using the PLS model, yiref the reference value and N the total number of samples used for calibration. To evaluate the degree of linearity of the model, the determination coefficients (R2) (Næs et al., 2002) between the actual and predicted values were computed.
Spectrograph
CCD
Beam
splitter
Beam
splitter
Sample
substrate
Objective
Raman microscope
La
ser
hea
d
CCD
Com
pu
ter
Len
s
Notc
h
filt
er
Mirror
Laser
line
filter
Control & data transfer
www.intechopen.com
Assessment of Microwave versus Conventional Heating Induced Degradation of Olive Oil by VIS Raman Spectroscopy and Classical Methods
589
3. Results
3.1 Assignments of Raman spectra of olive oil
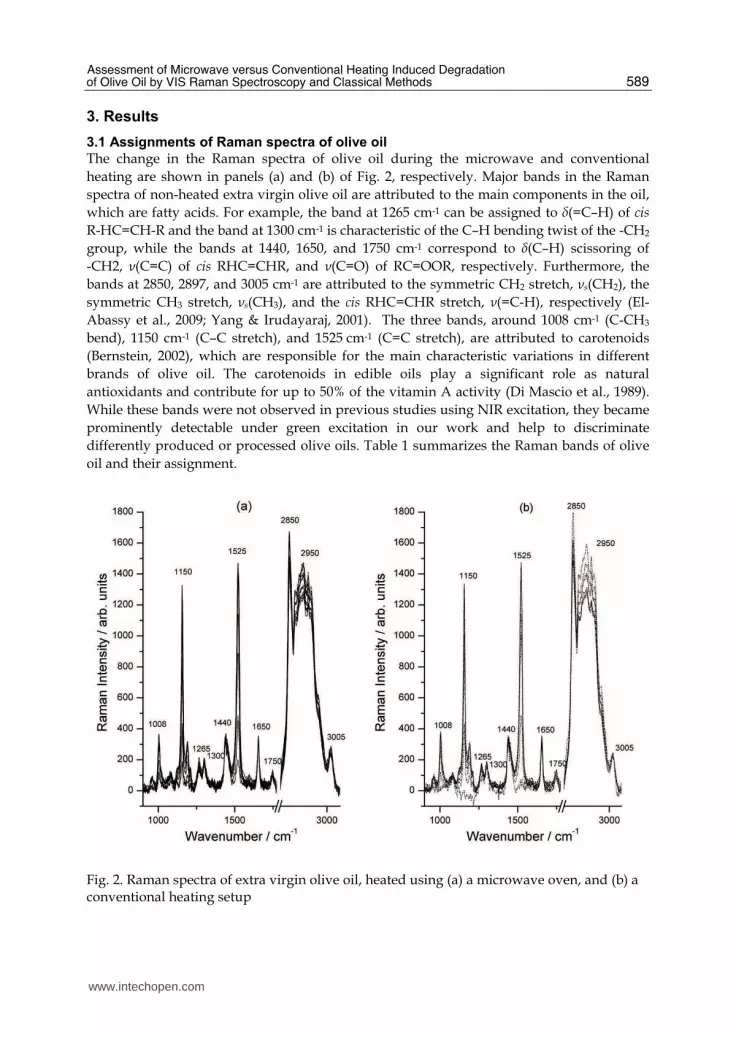
The change in the Raman spectra of olive oil during the microwave and conventional
heating are shown in panels (a) and (b) of Fig. 2, respectively. Major bands in the Raman
spectra of non-heated extra virgin olive oil are attributed to the main components in the oil,
which are fatty acids. For example, the band at 1265 cm-1 can be assigned to δ(=C–H) of cis
R-HC=CH-R and the band at 1300 cm-1 is characteristic of the C–H bending twist of the -CH2
group, while the bands at 1440, 1650, and 1750 cm-1 correspond to δ(C–H) scissoring of
-CH2, ν(C=C) of cis RHC=CHR, and ν(C=O) of RC=OOR, respectively. Furthermore, the
bands at 2850, 2897, and 3005 cm-1 are attributed to the symmetric CH2 stretch, νs(CH2), the
symmetric CH3 stretch, νs(CH3), and the cis RHC=CHR stretch, ν(=C-H), respectively (El-
Abassy et al., 2009; Yang & Irudayaraj, 2001). The three bands, around 1008 cm-1 (C-CH3
bend), 1150 cm-1 (C–C stretch), and 1525 cm-1 (C=C stretch), are attributed to carotenoids
(Bernstein, 2002), which are responsible for the main characteristic variations in different
brands of olive oil. The carotenoids in edible oils play a significant role as natural
antioxidants and contribute for up to 50% of the vitamin A activity (Di Mascio et al., 1989).
While these bands were not observed in previous studies using NIR excitation, they became
prominently detectable under green excitation in our work and help to discriminate
differently produced or processed olive oils. Table 1 summarizes the Raman bands of olive
oil and their assignment.
Fig. 2. Raman spectra of extra virgin olive oil, heated using (a) a microwave oven, and (b) a conventional heating setup
www.intechopen.com
Advances in Induction and Microwave Heating of Mineral and Organic Materials
590
Wavenumber (cm-1) Molecule / Group Vibrational mode
3005 cis RHC=CHR =C–H symmetric stretching
2897 – C H3 C–H symmetric stretching
2850 – C H2 C–H symmetric stretching
1750 RC=OOR C=O stretching
1650 1525
cis RHC=CHR RHC=CHR
C=C stretching C=C stretching
1440 – C H2 C–H bending (scissoring)
1300 – C H2 C–H bending (twisting)
1265 1150
cis RHC=CHR – (C H2)n–
=C–H bending (scissoring) C–C stretching
1008 HC–CH3 CH3 bending
Table 1. Assignment of major Raman bands in olive oil.
3.2 Changes in Raman spectra of heated olive oil 3.2.1 Heat induced degradation after microwave heating
Significant changes in the Raman spectra during the microwave heating process have been
observed to start after about 12 min of heating time and above 180°C, where the carotenoid
bands at 1008, 1150, and 1525 cm−1 show a gradual decrease in intensity and reach the
lowest intensity at 225°C after about 15 min total heating time. Concerning the C═C
vibrational mode of lipids at 1650 cm-1, a gradual increase in the intensity can be noticed.
This behaviour is certainly due to the conformational change of the methylene chains at
higher temperatures, for which the C=C vibrational mode is a sensitive indicator (Wong,
1984). The unsaturation degree in the oil is highly correlated to the intensity ratio of the
bands at 1265 and 1300 cm-1 (Li-Chan, 1996). This ratio shows a linear decrease with
increasing temperature reflecting a neat loss of the lipid chain unsaturation during the
heating process. A slightly decreasing intensity of the C=O stretching vibration band at
1750 cm−1 has also been observed indicating that hydrolysis is taking place leading to a
slight increase of FFA content during the heating process (Innawong et al., 2004; Muik et al.,
2005). This has been equally confirmed by titration, and is in agreement with the reported
increase in FFA content due to thermal treatment.
In the high wavenumber region, a linear increase of the Raman peak at 2850 cm−1 with temperature is observed. The relative intensities of the two Raman bands at 2850 and 2880 cm-1 are related to the degree of disorder of the hydrocarbon chains (Li-Chan, 1996), and usually are employed to determine the lipid phase transition. In the high wavenumber region, a linear increase of the Raman peak at 2850 cm−1 with temperature is observed. The relative intensities of the two Raman bands at 2850 and 2880 cm-1 are related to the degree of disorder of the hydrocarbon chains (Li-Chan, 1996), and are usually employed to determine the phase transition in lipids. In fact, the peak at 2850 cm−1 is dominant in the liquid phase of lipids while the peak at 2897 cm−1 is dominant in the solid state (Bergethon, 1998). Lipids liquefy as the temperature increases, which is reflected in our Raman results by the observed increase in the intensity of the 2850 cm-1 band with increasing temperature (Larsson, 1973). The gradual decrease of the intensity of the band at
www.intechopen.com
Assessment of Microwave versus Conventional Heating Induced Degradation of Olive Oil by VIS Raman Spectroscopy and Classical Methods
591
3005 cm-1 which is used to estimate the degree of the total cis unsaturation (Wong, 1984), reveals the loss of unsaturation level during the heating process. This loss of the unsaturation degree could be due to the degradation of the natural antioxidants (carotenoids) of olive oil, since it has been reported that the oxidative degradation of the oil during microwave heating depends on its natural antioxidant content (Dostalova et al., 2005).
3.2.2 Heat induced degradation after conventional heating
Similar to the case of the microwave heating process, at the beginning of conventional heating, the intensities of the carotenoid bands at 1008, 1150, and 1525 cm−1 follow the same trend. Especially, these bands temporary show an apparent stability. However, the intensity of these bands starts to decrease notably at 140°C. Moreover, unlike the situation observed in the microwave heating procedure, these carotenoid bands completely disappear at 203°C after 80 min of total heating time during the conventional heating process. The increase in the intensities of the band at 1650 cm−1 has also been observed, which is due to the methylene chains disorder. As already mentioned above in the case of microwave heating, during conventional heating, the ratio of relative intensities of the bands at 1265 and 1300 cm−1 is decreasing, revealing the general loss of cis double bonds during the heating process, and a gradual decrease in the intensity of the band at 1750 cm− 1 has been noticed as a result of hydrolysis reactions. Finally, in the high wavenumber region the Raman bands at 2850, 2897, and 3005 cm−1 showed the same behaviour as in the microwave heated sample.
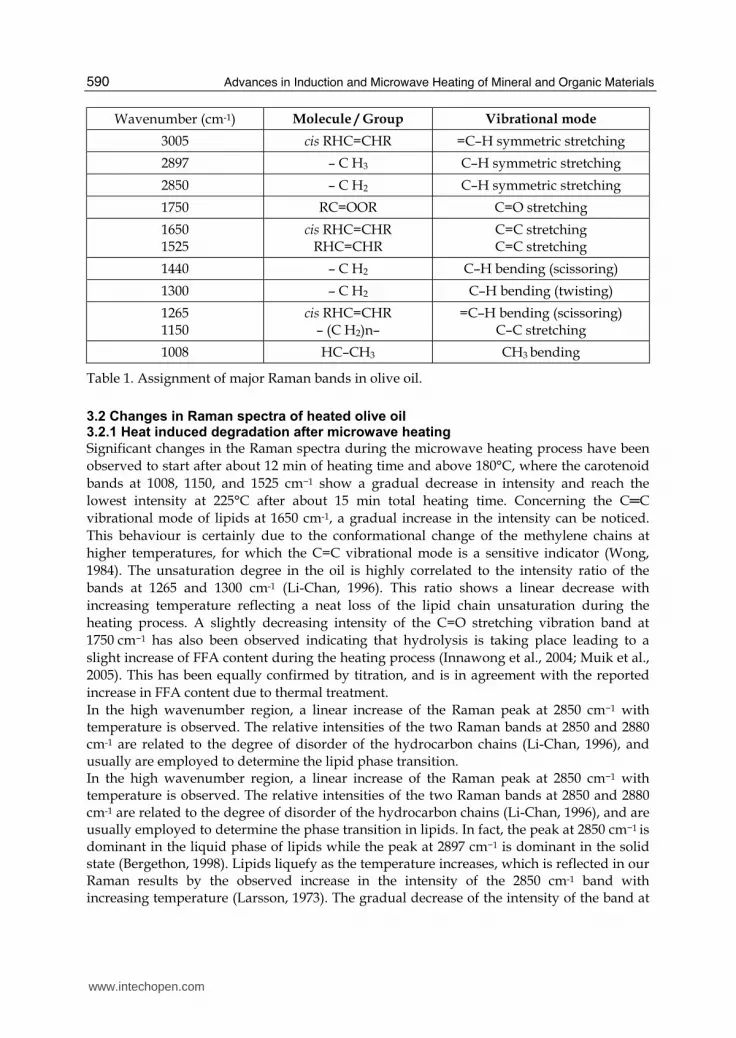
3.2.3 Effect of microwave versus conventional heating on carotenoid degradation
In comparison, the two different processes showed obvious differences. First, in the microwave heating process, carotenoid degradation starts at 180°C at 700 W, while it starts at 140°C in the conventional heating process as revealed by the decrease in the intensities of the carotenoid Raman bands and confirmed by quantitative analysis of carotenoid content. Moreover, the carotenoid bands completely vanish at 203°C with conventional heating, where the olive oil has been heated for about 60 min to reach this temperature. In contrast, during microwave heating, these bands can still be observed with much stronger intensities even at higher temperatures. In the last case, olive oil took only 15 min to reach the maximum temperature set at 225°C (panel (a) of Fig. 3). These observations indicate that the heating time is more effective on carotenoid degradation than the final temperature reached. In order to explore the role the heating time plays in the carotenoid degradation, additional experiments are carried out. When setting the power of the microwave oven to 240 W, the olive oil takes 40 min to heat up to a target temperature of 190°C; i.e., the reduction of the power of the microwave oven results in an increase of the heating time. The differences in the Raman spectra of the heated olive oil using the conventional heating process and the microwave heating process with short and long heating times are shown in panel (b) of Fig. 3. It is obvious that the degradation of the carotenoid content is more pronounced with increasing heating time. In order to further confirm this behaviour and to obtain an accurate model that can explain the dependence of carotenoid degradation on temperature and heating time, these two independent parameters are tested using multiparametric regression. The multiparametric regression test reveals a significant determination between carotenoid degradation and heating time, as evidenced by the P values. The P value gives the probability that the result obtained in a statistical test is due to chance rather than true and it tells how strongly each independent variable is correlated with the observable. Small
www.intechopen.com
Advances in Induction and Microwave Heating of Mineral and Organic Materials
592
Fig. 3. Raman spectra of extra virgin olive oil heated in a microwave oven and in a conventional way at 225 and 203°C, respectively (a), and heated to 190°C conventionally and in a microwave oven set to high and low power (b).
P values indicate that there is a true relationship between the dependent and the
independent variables. A P value < 0.05 is often considered statistically significant, and the
smaller the P-value the more significant the relationship between the independent variable
and the observable. From the evaluation of the experimental results, P values of less than
0.0001 for heating time and of approx. 0.04 for temperature in the microwave heating
process were determined. On the other side, for the conventional heating process, a P value
of 0.006 for heating time and a P value of 0.5 for temperature resulted. From this it becomes
obvious that the heating time is the crucial factor.
Finally, slight changes in FFA content of the extra virgin olive oil have been observed in
both heating processes. This is an expected result since it is well known that the FFA content
increases in refined olive oil as a result of thermal treatment. The observed FFA content of
olive oil analysis in terms of oleic acid percentage, as also indicated by the titration, ranges
from 0.18 to 0.25% for conventional heating, while after the microwave heating process it
ranges from 0.18 to 0.20%
3.3 Quantification of carotenoids degradation based on Raman data
Carotenoid values observed for heated olive oil in terms of beta carotene content range from
1.670 to 0.603 ppm as measured by the British standard method of analysis (1977) with the
absorption photospectrometer. The calibration model of the carotenoid content based on
Raman data has been constructed using PLS regression. The Raman spectral window [900-
1570 cm-1], which includes the carotenoid bands, is used to construct a calibration model.
Here, the multidimensional Raman data set is projected onto a reduced set of a few
components describing the directions of the most important variations within the data.
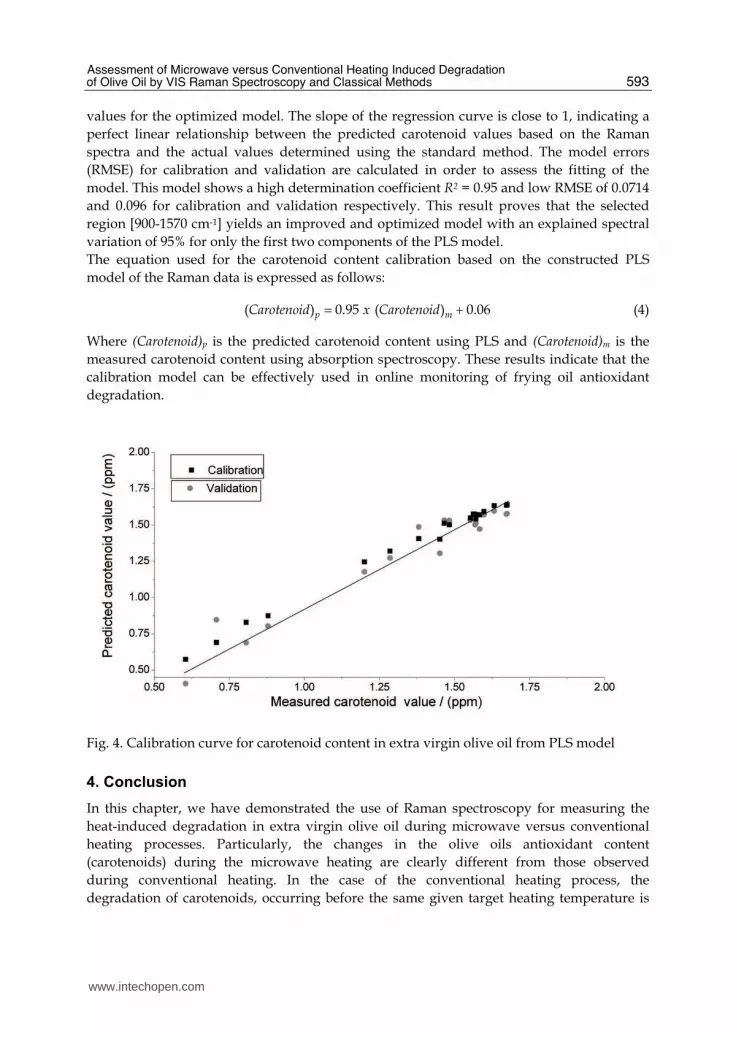
Figure 4 shows the predicted carotenoid content based on Raman spectra vs. reference
www.intechopen.com
Assessment of Microwave versus Conventional Heating Induced Degradation of Olive Oil by VIS Raman Spectroscopy and Classical Methods
593
values for the optimized model. The slope of the regression curve is close to 1, indicating a
perfect linear relationship between the predicted carotenoid values based on the Raman
spectra and the actual values determined using the standard method. The model errors
(RMSE) for calibration and validation are calculated in order to assess the fitting of the
model. This model shows a high determination coefficient R2 = 0.95 and low RMSE of 0.0714
and 0.096 for calibration and validation respectively. This result proves that the selected
region [900-1570 cm-1] yields an improved and optimized model with an explained spectral
variation of 95% for only the first two components of the PLS model.
The equation used for the carotenoid content calibration based on the constructed PLS
InTech ChinaUnit 405, Office Block, Hotel Equatorial Shanghai No.65, Yan An Road (West), Shanghai, 200040, China Phone: +86-21-62489820 Fax: +86-21-62489821
The book offers comprehensive coverage of the broad range of scientific knowledge in the fields of advancesin induction and microwave heating of mineral and organic materials. Beginning with industry application inmany areas of practical application to mineral materials and ending with raw materials of agriculture origin theauthors, specialists in different scientific area, present their results in the two sections: Section 1-Induction andMicrowave Heating of Mineral Materials, and Section 2-Microwave Heating of Organic Materials.
How to referenceIn order to correctly reference this scholarly work, feel free to copy and paste the following:
Rasha M. El-Abassy, Patrice Donfack and Arnulf Materny (2011). Assessment of Microwave versusConventional Heating Induced Degradation of Olive Oil by VIS Raman Spectroscopy and Classical Methods,Advances in Induction and Microwave Heating of Mineral and Organic Materials, Prof. Stanisław Grundas(Ed.), ISBN: 978-953-307-522-8, InTech, Available from: http://www.intechopen.com/books/advances-in-induction-and-microwave-heating-of-mineral-and-organic-materials/assessment-of-microwave-versus-conventional-heating-induced-degradation-of-olive-oil-by-vis-raman-sp